 Yiwen Liu
 Chongliang Zhang
 Binduo Xu
 Ying Xue
 Yiping Ren1,2,3*
 Yong Chen
- 1College of Fisheries, Ocean University of China, Qingdao, China
- 2Laboratory for Marine Fisheries Science and Food Production Processes, Pilot National Laboratory for Marine Science and Technology, Qingdao, China
- 3Field Observation and Research Station of Haizhou Bay Fishery Ecosystem, Ministry of Education, Qingdao, China
- 4School of Marine Sciences, University of Maine, Orono, ME, United States
Biological reference points (BRPs) derived from per-recruit analyses are commonly used in inferring stock status and serve as the target or threshold in fisheries management. However, the estimation of BRPs may be impacted by the variability in life history processes, and particularly, individual growth rates often display substantial seasonal oscillations but are seldomly considered in per-recruit analyses. Using four commercial fish species Lophius litulon, Saurida elongata, Hexagrammos otakii, and Larimichthys polyactis in coastal China Seas as examples, this study examined the effects of seasonal growth variability on per-recruit analyses and on the estimation of BRPs. We developed an individual-based modeling framework to simulate growth patterns with and without variations at the seasonal and the individual levels and adopted two common assessment methods, age-based analysis and length-frequency analysis, to estimate growth parameters regarding data availability in data-rich or data-poor fisheries, respectively. We found that ignoring seasonality could lead to substantial errors in the estimation of BRPs for the small-size species H. otakii and L. polyactis in our evaluation; when seasonal growth was considered, the estimation could be largely improved. Length-frequency analysis might yield considerably less reliable estimations than age-based method. The time of year when fast growth occurs determines positive or negative bias in estimation, and the amplitude of seasonal growth determines the degree of biases. In general, ignoring the seasonality of growth when there is can lead to underestimated growth parameter K and trigger biases that propagate in stock assessment and management, whereas incorporating seasonality falsely in assessment when there is no seasonal variation will have little influences on the estimation of BRPs. This study contributes to demonstrate the risk of ignoring seasonality in stock assessment and the approaches accounting for seasonal variability in fishery management.
Introduction
Successful management of global fish and invertebrate species relies on quantitative stock assessment, which aims to maintain stocks at sustainable levels while yielding optimal catch (Brooks, 2013; Punt et al., 2016). Even in data-limited situations that lack sufficient data supporting a comprehensive stock assessment, numerous data-limited methods are developed to meet management objectives. However, these models are commonly developed on specific assumptions or simplification of biological processes, some of which may be violated in realistic fisheries. For instance, heterogeneity of fish life-history and fishing activities is prevalent in fisheries (Truesdell et al., 2016), but it is not usually considered in assessment models. Management advices obtained from these models, consequently, may be misleading if the risks of violating assumptions are not sufficiently understood. To achieve valid management decision, uncertainty in stock assessment models needs to be widely tested in terms of robustness (Patterson et al., 2001; Magnusson et al., 2013).
Uncertainties in stock assessments may come from multiple sources, including methods, biological processes, and observation error. Regarding process uncertainty, there has been increasing studies to investigate the effect of seasonal variability in life-history processes on stock assessment and ecological models (Hufnagl et al., 2013; Datta and Blanchard, 2016). In particularly, numerous species in temperate seas display seasonal oscillations in growth on account of fluctuations of temperature, light, and food supply (Adolph and Porter, 1996; Coma et al., 2000; Carmona-Catot et al., 2014). Even at tropic latitudes, strong seasonal growth oscillations exist resulting from estivation or minor temperature changes (Pauly et al., 1992). Growth is one of the basis life-history processes that is often required in data-limited methods, understanding of which is fundamental to the knowledge of life histories, demography, and productivity (Pardo et al., 2013). Thus, seasonal growth variability has been a concern in stock assessments for a long time. Sparre (1990) indicated that length-converted catch curves (LCCC) could overestimate total mortality (Z) when growth was seasonal. Accordingly, Pauly (1990) proposed an approach to seasonal length converted catch curves (sLCCC). Recently, Hufnagl et al. (2013) evaluated the performance of length-based total mortality estimators and showed that the tested methods were sensitive to seasonal growth and recruitment. In spite of the established methods to account for seasonal growth, the common applications appear to be resistant to changing. For instance, Von Bertalanffy growth function (VBGF) (Beverton and Holt, 1957) doesn’t routinely incorporate this feature but instead assume a constant growth coefficient K, which impose crucial problems for assessment methods. However, there is still limited understanding about the effect of seasonality on stock assessments, i.e., estimation of biological reference points (BRPs).
In addition to the process errors, there are substantial observation errors in stock assessments from sampling, especially in data-poor situations. For example, estimation of growth parameters is commonly dependent on age determination, by counting annual increments of otolith rings or other hard tissue, which is assumed to be relatively accurate but not invulnerable to measurement errors. Besides, species with accurate age estimates are limited by high costs and technical difficulties. In this circumstance, length-based methods, such as electronic length frequency analysis (ELEFAN), are useful in estimating growth parameters, as length composition data are more easily obtained than age data. However, the effectiveness of length frequency data may be affected by diverse issues, i.e., sample size, selectivity, and uncovered distribution area (Schwamborn et al., 2019). In addition, both methods can be impacted by the variations in growth at the individual level, which largely contributes to uncertainty in the studies of growth. In practice, the different aspects of errors are likely to influence stock assessments altogether, whereas their interactions and overall effects remain unknown. Therefore, explicitly accounting for seasonality and individual variability is desired in the considerations of stock assessment.
This study examines the effect of seasonal growth when using classic per-recruit analyses. We consider two models, yield-per-recruit (YPR) and spawning-stock-biomass-per-recruit (SSBPR) analyses, which reflect the trade-off between fisheries yields and stock status, emphasizing growth-overfishing (King, 2013) and recruit-overfishing (Katsukawa, 2005), respectively. Combined with BRPs, per-recruit analyses are widely used in guiding fisheries management, especially in data-limited situations (Gabriel and Mace, 1999; Moreau and Matthias, 2018; Zhai and Pauly, 2019), due to its light data requirement (Chrysafi and Kuparinen, 2016) and partially the widespread application of FiSAT II (FAO-ICLARM Fish Stock Assessment Tools; FAO, 2006). In a recent evaluation for data-limited length-based methods (Chong et al., 2019), TB method (length-structure per-recruit analyses) could provide the most accurate assessment. However, it should be noted that per-recruit analyses are based on several strong assumptions such as equilibrium, including constant vital rates (i.e., growth, natural mortality, spawning, and recruitment) (King, 2013). In these types of models, seasonal variability in growth is not incorporated in most cases. As YPR analyses has been proved to be sensitive to the choice of growth function (Spence and Turtle, 2017), such unawareness of seasonal conditions may result in misleading management guidelines.
In this study, we selected four species in coastal China Sea to investigate how seasonal variability in growth affected per-recruit analyses. We developed an individual-based modeling framework to simulate seasonality and individual variations in the process of growth. Additionally, regarding the possible sources of information in data-rich and data-poor stocks, we evaluated how two types of data, length-at-age data and length-frequency data, contribute to estimating growth functions and subsequent per-recruit analyses. With a range of simulation scenarios about process and observation errors, we aim to evaluate the risk of ignoring seasonality when using per-recruit analyses in guiding management and to demonstrate the uncertainty of BRPs. This study may contribute to understanding uncertainties of BPRs in fisheries management under the circumstance of seasonal variability and data-poor stocks.
Materials and Methods
Data Sources
We considered four species in China’s coastal area, including anglerfish (Lophius litulon), slender lizardfish (Saurida elongata), greenling (Hexagrammos otakii), and small yellow croaker (Larimichthys polyactis). They were all commercially important and dominant species in ecosystem. These species had different life-history traits, ranging from slow-growing and long lifetime to short-lived fast-growing species. H. otakii represented a cold-temperate species differing from other three warm-temperate species.
A suit of biological data was collected from a trawl-based fishery-independent survey in coastal waters of Shandong Peninsula, China (See Supplementary Material for more details), from which life-history parameters of those species were derived with different methods. Length at recruitment (Lr) was set according to the range of minimum length caught in fisheries landings. Length-weight relationship was used to convert length into weight, and parameters a and b were calculated from size data using linear regression. Growth and maturation parameters were gathered from literature (Table 1). Total mortality (Z), as well as length-specific selectivity, was estimated by LCCC (Pauly, 1983). Natural mortality (M) was calculated by Pauly’s empirical equation (Pauly, 1980). The parameters were listed in Table 1 and in Supplementary Material for detailed formula.
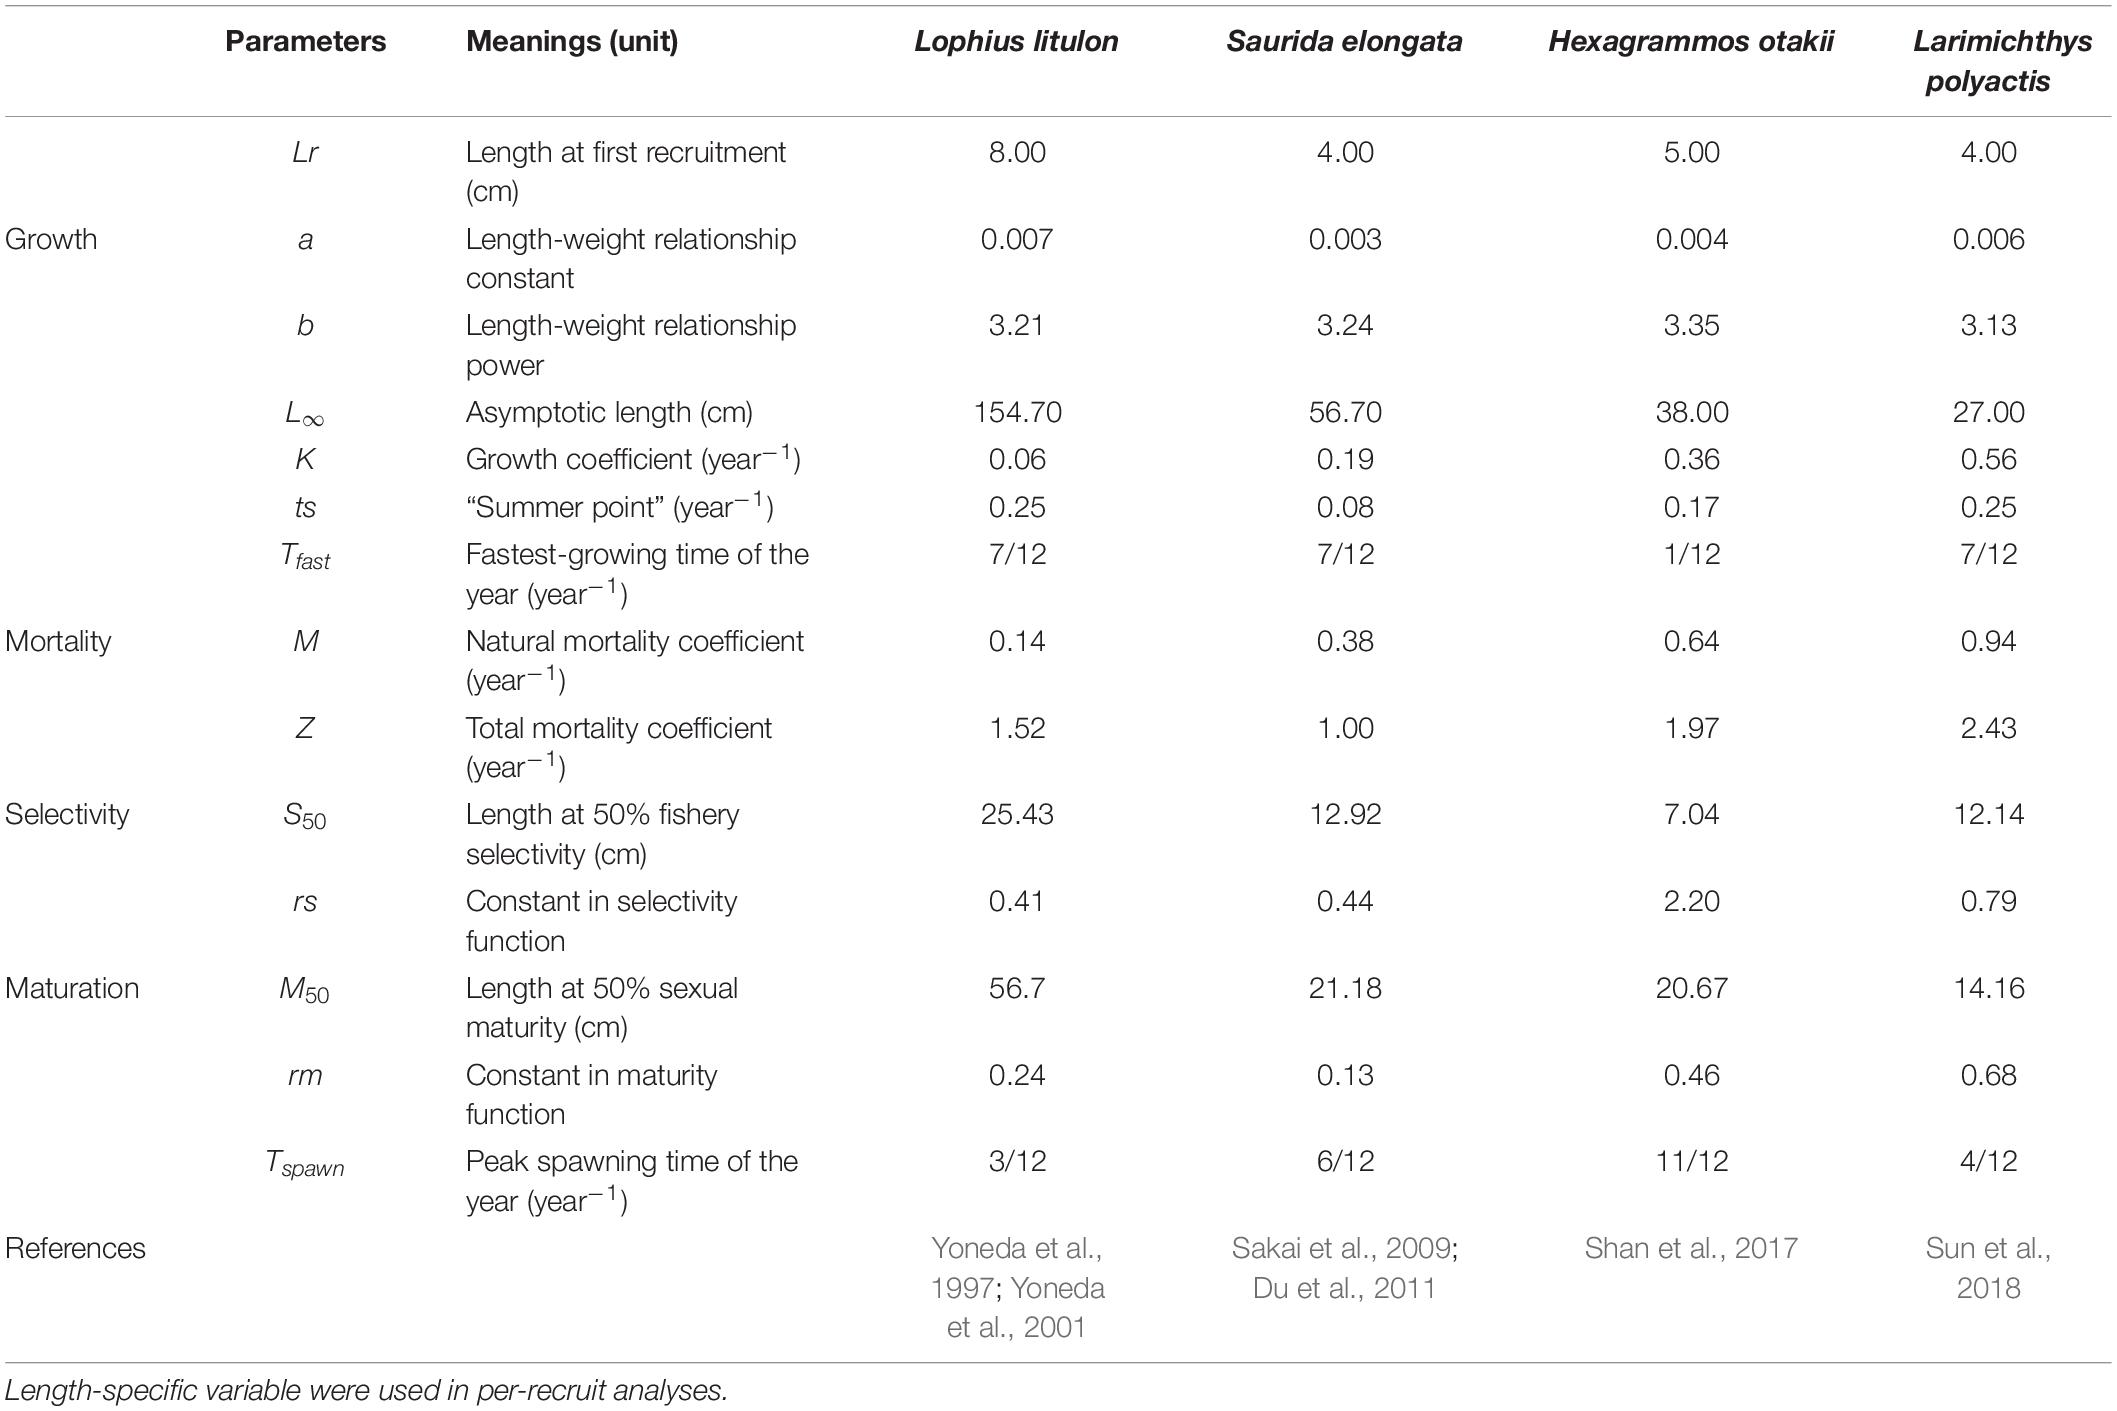
Table 1. Input parameters used in per-recruit analyses and simulation.
A General Framework of Simulation
We designed an individual-based modeling framework to investigate how seasonal and individual growth variability affected the per-recruit analyses and accounted for different amplitude of seasonality and data availability for different scenarios (Figure 1). In the following sections, we described each component of our simulation study.
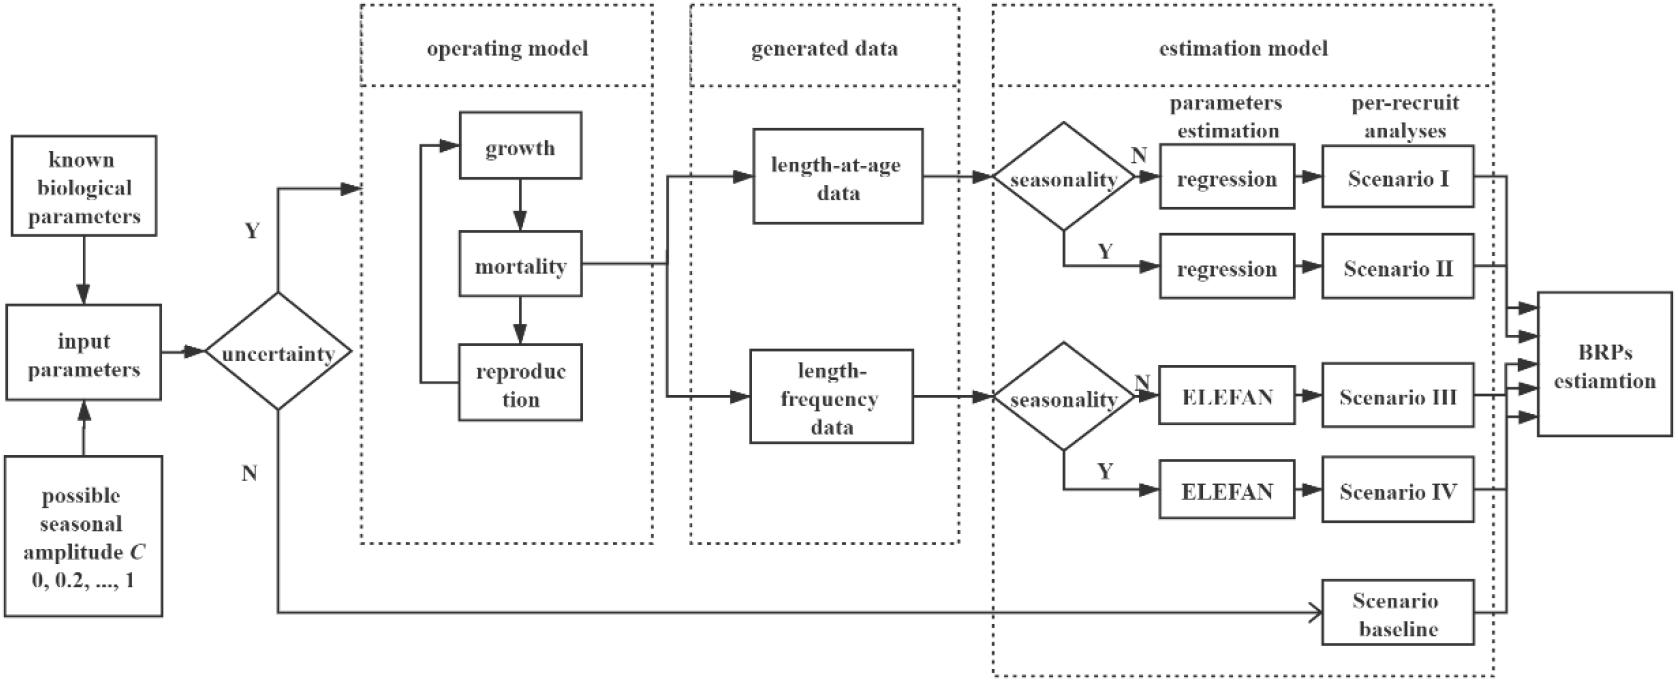
Figure 1. Flowchart of the simulation in the present study. Six gradients of variable C (amplitude of the seasonal oscillation, 0, 0.2, 0.4, …, 1) are set in this study. Deterministic section (scenario baseline) runs 1 time for each gradient of C, as the output is a deterministic value without uncertainty. Stochastic simulation runs 1000 times for each gradient of variable C, incorporating with individual growth variations (variability of K and L∞).
Operating Model
The operating model is developed to account for the variability of growth rate at the seasonal and individual levels. The model is developed on the basis of “fishdynr” package (version 0.4.1, Taylor, 2016) in R (version 3.5.3, R Core Team, 2018) with modifications on sub-models of the sampling process and types of available data.
Our model describes the primary life history processes, i.e., growth, mortality, and reproduction of fish species. With a time step of 1 month, individual grows following a given growth function and has probabilities to be caught in fishery or die of natural mortality. At specific time of year, reproduction occurs and new cohort is generated. Individuals caught by fishery are sampled as survey data for subsequent assessments. Detailed life-history processes are described as follows:
Seasonal growth
Seasonal growth models are generally based on the modifications of the basic VBGF. Extensions that incorporate a seasonality component into the model are used to describe seasonal oscillation of growth, and many of them use sine functions. This study adopts the model proposed by Hoenig and Hanumara (1982) and described by Somers (1988), so-called seasonal oscillation growth function (soVBGF):
where Lt is the average length at age t, L∞ is the asymptotic length (cm), K is the growth coefficient (year–1), t0 is the theoretical age at length of zero, C modulates the amplitude of the seasonal oscillation, and ts is the so-called summer point, indicating the start of the convex portion of the first sinusoidal growth oscillation. In this study, t0 is set to zero, assuming that fish has zero length at birth. The “summer point” ts could be calculated by: ts = Tfast−Tspawn, where Tfast is the fastest-growing time of the year and Tspawn is the peak spawning time. Here, Tfast is assumed to be 7/12 for warm-temperate species, and 1/12 for cold-temperate species (H. otakii), according to their life-history characteristics. Tspawn is set based on known life-history information (Table 1).
Individual variability
The growth function describes the average growth parameters of the whole population, whereas individual growth trajectory may be considerably different from the mean growth curve, which may substantially bias the estimation of growth parameters (Pilling et al., 2002). Here, individual growth variation is introduced into growth parameters K and L∞ of each simulated individual i, by multiplying the average growth parameters with the coefficient of variation (CV): , where εi is a random number generated for individual i following a log normal distribution with mean = 0 and standard deviation = CV on the log scale. The same procedure is used to generate the growth parameter Ki for each individual i. CV of both K and L∞ is set to 0.1 in this study (Taylor and Mildenberger, 2017). The remaining growth parameters, variables t0, C, and ts are set constantly for all individuals.
Mortality and recruitment
Individual survival rate S = e−(M + F)Δt, where M and F indicate annual natural and fishing mortality coefficient, respectively. Δt is the time step on a yearly basis. For each time step, individual stochastically dies from fishing or natural cause, with a probability consistent with their relative proportions ( versus ).
The model coupled a Beverton–Holt stock–recruitment relationship, combining spawning stock biomass with parameters for maximum recruitment, rmax, and a steepness coefficient, beta. In order to focus on the effects of growth variability, beta was set to 1 to imply constant recruitment at rmax level, as the assumption is not concerned for per-recruit analyses. In addition, recruitment was assumed to occur in single month, Tspawn, instantaneously. When recruitment occurred, individual had a length of zero. More detailed information about model description can be found in Taylor and Mildenberger (2017).
Simulation Process
We set six gradients of seasonal growth oscillation, C = 0, 0.2, 0.4, 0.6, 0.8, and 1, to simulate different magnitudes of seasonal variability. According to whether individual variation was incorporated, simulation process was divided into two parts for each gradient (Figure 1).
Deterministic scenario
Before the simulation, the performance of estimation method was evaluated without incorporating individual variations. The result proved the validation of the estimation model (Supplementary Figure 2). In this scenario, growth parameters were set unbiased. The biological parameters and pre-designed variable C (using soVBGF) in simulation were used directly as input of per-recruit analyses. Therefore, the parameters represented the “true” vital rates of biological processes, and this scenario thus served as a baseline to examine BRPs. Parameters other than growth were assumed to be constant (this and the stochastic scenarios in this study).
Stochastic section
With the same biological parameters as deterministic section, we conducted the individual-based model (“operating model”) to account for individual growth variations and errors in sampling. In each simulation run, we generated two types of data, length-at-age data and length-frequency data, from which growth parameters were estimated and used for per-recruit analyses (Figure 1). The former represented the cases of data-rich stocks where ages were determined from otoliths, scales, or dorsal fin spines, and the latter represented a data-poor situation, where age data were unavailable but length data were collected.
To evaluate the bias resulting from growth seasonality and sampling errors, we developed four simulation scenarios (Table 2) that were based on length-at-age data (scenario I, II) versus length-frequency data (scenario III, IV) and that considered seasonality (using soVBGF as growth functions, scenario II, IV) versus ignoring seasonal growth (using VBGF as growth functions, scenario I, III), respectively. It should be noted that no additional observation error or other source of uncertainty was incorporated into simulation process, except the stochasticity in mortality. The simulations were run 1000 times for each gradient of variable C.
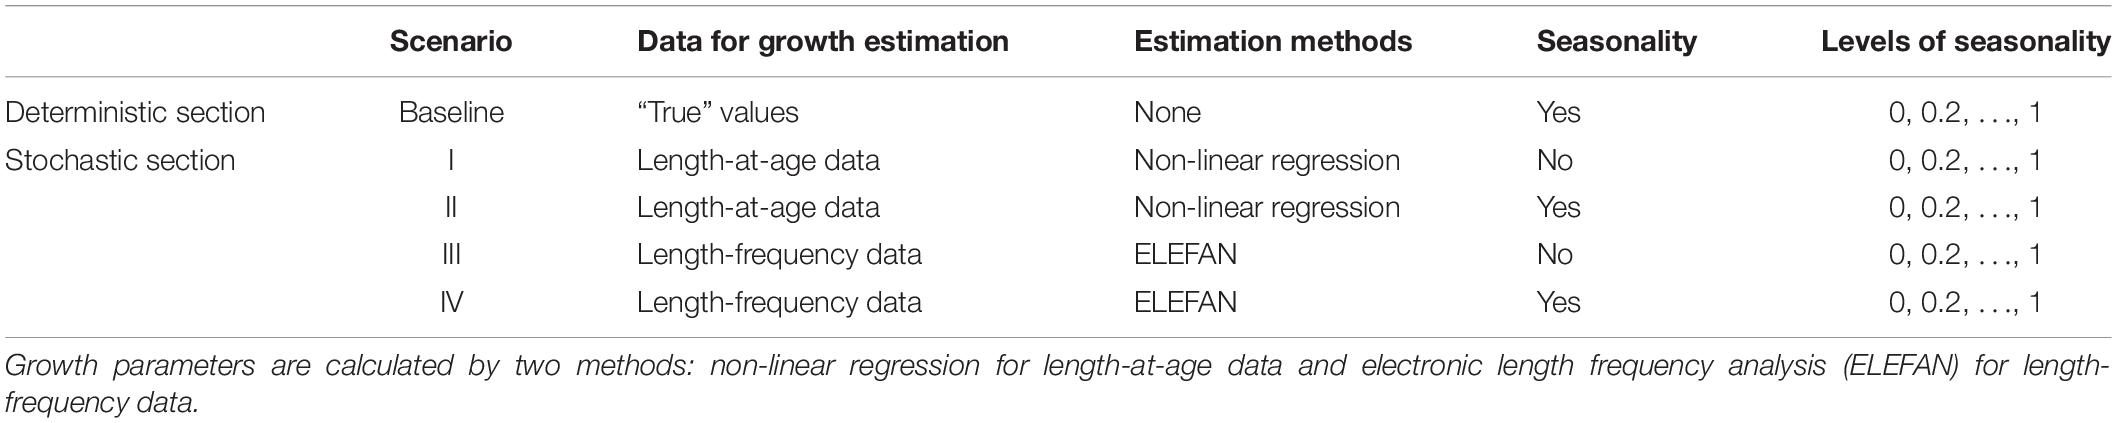
Table 2. Simulation scenarios for testing the impact of seasonality on estimation of biological reference points.
Assessment
Parameter estimation
In the simulation, the size and age of caught individuals were recorded to generate length-at-age data and length-frequency data (Figure 1). For length-at-age data, age was assumed to be accurately estimated to the unit of seasons to estimate seasonal growth. The growth parameters were estimated by non-linear regression, using the “port” algorithm in R function “nls,” in which the values of C and ts were constrained between 0 and 1 (Ogle, 2017). For length-frequency data, ELEFAN was used to estimate growth parameters (Pauly and David, 1981), using “ELEFAN_GA” in R package “TropFishR” (Mildenberger et al., 2017). Regarding the common practices of seasonal surveys, simulation data were selected from 4 months, January, April, July, and October. Regarding the typical cost of aging, 400 individuals per species were age-determined to generate length-at-age data, and all length measurement of catch was used as length-frequency data.
Length-structure per-recruit analyses
Traditional per-recruit analyses are generally age-structured, requiring age-dependent parameters, including age at recruitment to the fishery and age-specific selectivity. However, processes such as recruitment and selectivity are more closely associated with individual size, rather than age-dependent for many species (Hilborn and Walters, 1992). Thus, length-structure per-recruit analyses is considered as better reflecting biological and fishery-related processes (Kvamme and Bogstad, 2007), and this study re-parameterizes age-structure per-recruit analyses to length-structure model to better reflect length-dependent fishing and seasonality.
The length-structure per-recruit model uses length cohort instead of age cohort in analyses. Interval between length at recruitment (Lr) and asymptotic mean length (L∞) can be divided into n segments (L1, L2, …, Ln), and L1 and Ln+1 represent Lr and L∞, respectively. Let d represent the width of each class, and thus, dj = Lj + 1−Lj. d is set to equal in this study for convenience while it should be noted that width d does not necessarily to be equal. Combining above, length-structure per-recruit analyses can be calculated as:
where j (k) represents the length class, Wj indicates the average weight of length class j, Sj is the selectivity coefficient for length class j, and mj is the maturation proportion for length class j. The average time that species takes to grow from Lj to Lj+1, ΔTj, can be estimated from growth function. When growth is modeled by VBGF, ΔTj can be estimated as . When growth is modeled by soVBGF, ΔTj cannot be estimated directly, because of the complication resulting from sine function. The R function “fzero” is used to convert length into age, and ΔTj can be obtained for SOGF through a similar approach presented by de Graaf and Dekker (2006). The full description of per-recruit analyses can be found in Supplementary Material.
Biological reference points
Four typical BRPs were calculated by per-recruit analyses: Fmax, the fishing mortality rate which produces the maximum YPR; F0.1, the fishing mortality coefficient corresponding to 10% of the slope of the YPR curve at the origin; F20% and F40%, the fishing mortality coefficient at which SSBPR is 20% and 40% of the SSBPR when fishing mortality coefficient is zero. The estimated BRPs were compared to the corresponding true values to evaluate the effects of diverse factors considered.
Results
Risk of Ignoring Seasonality
We simulated four species under six gradients of seasonal growth and four scenarios of data analyses (Figure 1) and herein showed the results of F0.1 and F40% as example (Figure 2). Ignoring seasonality (scenario I) could lead to underestimation of BRPs when seasonality existed, and this bias trended to increase dramatically with amplitudes of seasonal oscillation, which implied that the species was less productive than expected. The pattern was consistent for all four BRPs considered. Incorporating seasonality (scenario II) could largely reduce the bias, whereas certain level of bias remained compared to the “true” values (deterministic scenario). The bias could be attributed to the errors in the estimation of growth parameters, i.e., overrating L∞ and underrating K (Supplementary Figure 5). In addition, the results revealed that seasonal growth could cause systematic deviation in per-recruit analyses (Supplementary Figures 3, 4). Besides, the extent of bias caused by seasonality varied substantially among different species. Ignoring seasonality had minor influence on the estimation of BRPs for the large-size species (L. litulon and S. elongata), while it could lead to serious under-estimation for small-sized species (H. otakii and L. polyactis).

Figure 2. Relative bias of estimated BRPs F0.1 and F40% for four case species in the case of ignoring seasonality (scenario I) and considering seasonality (scenario II) under different gradients of seasonal growth amplitude.
Risk of Falsely Incorporating Seasonality
Not all species display seasonal growth oscillation, and the consequences of incorporating seasonality falsely were showed in the case where seasonal amplitude C was zero but soVBGF was adopted (scenario II when C = 0). Our results showed that the inappropriate procedure would not substantially bias the estimation, although leading to little overestimation in H. otakii (Figure 3). The overestimation was similar or less for other species. However, when seasonality was absent, fitting soVBGF was likely to fail (Supplementary Table 1) because the length-at-age data did not support fitting additional seasonal growth parameters, which also reduced the risk of misdiagnose.
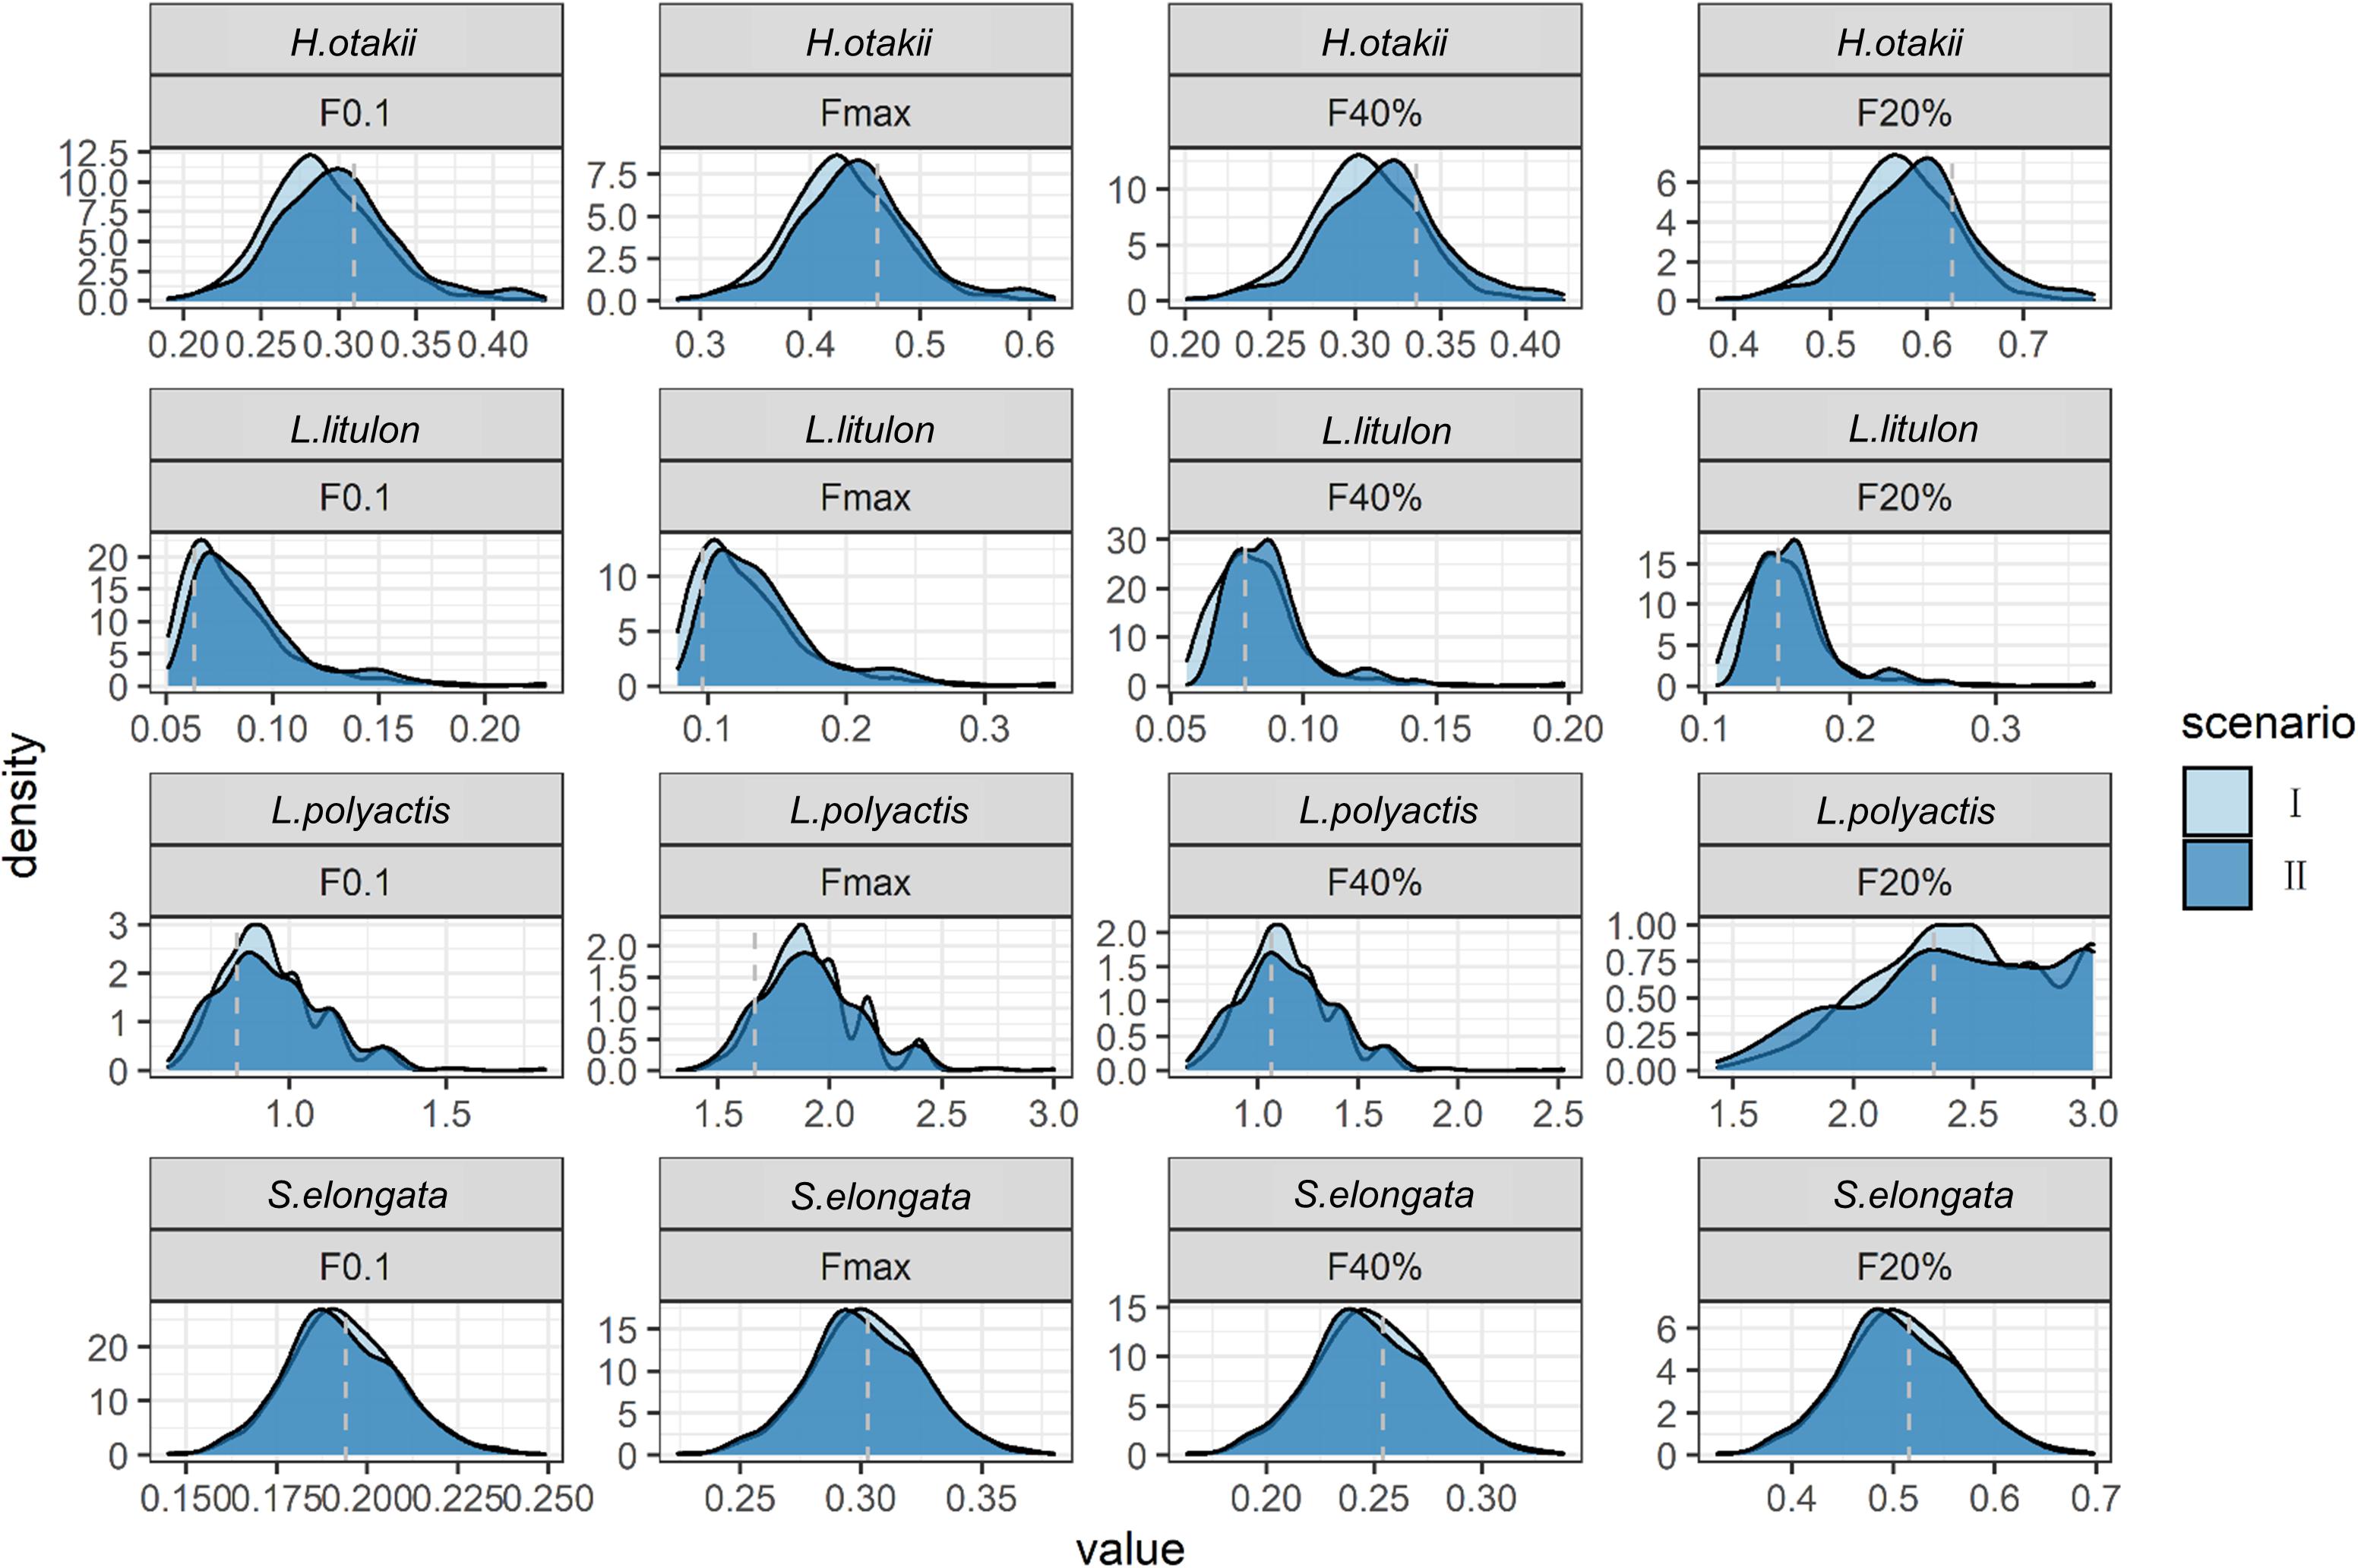
Figure 3. Comparison of estimated BRPs between ignoring seasonality (scenario I) and considering seasonality falsely (scenario II) when seasonality was absent, shown as density plot. X-axis denotes the value of BRPs, Y-axis denotes the density of each value. The dashed gray lines indicate the “true” values in deterministic scenarios.
Effects of Data Types
To investigate the effect of seasonal growth in data insufficient situation, we designed scenarios III and IV, in which only length-frequency data were used for analyses. The estimations of BRPs were generally biased in these two scenarios regardless of the amplitude of seasonal oscillation (Figure 4). Incorporating seasonality in ELEFAN might have little improvement for the estimation of BRPs. Furthermore, ELEFAN cannot track the changing of seasonal amplitude C properly (Supplementary Figure 6), and its estimation for ts was highly volatile, indicating its sensitivity to sample data.
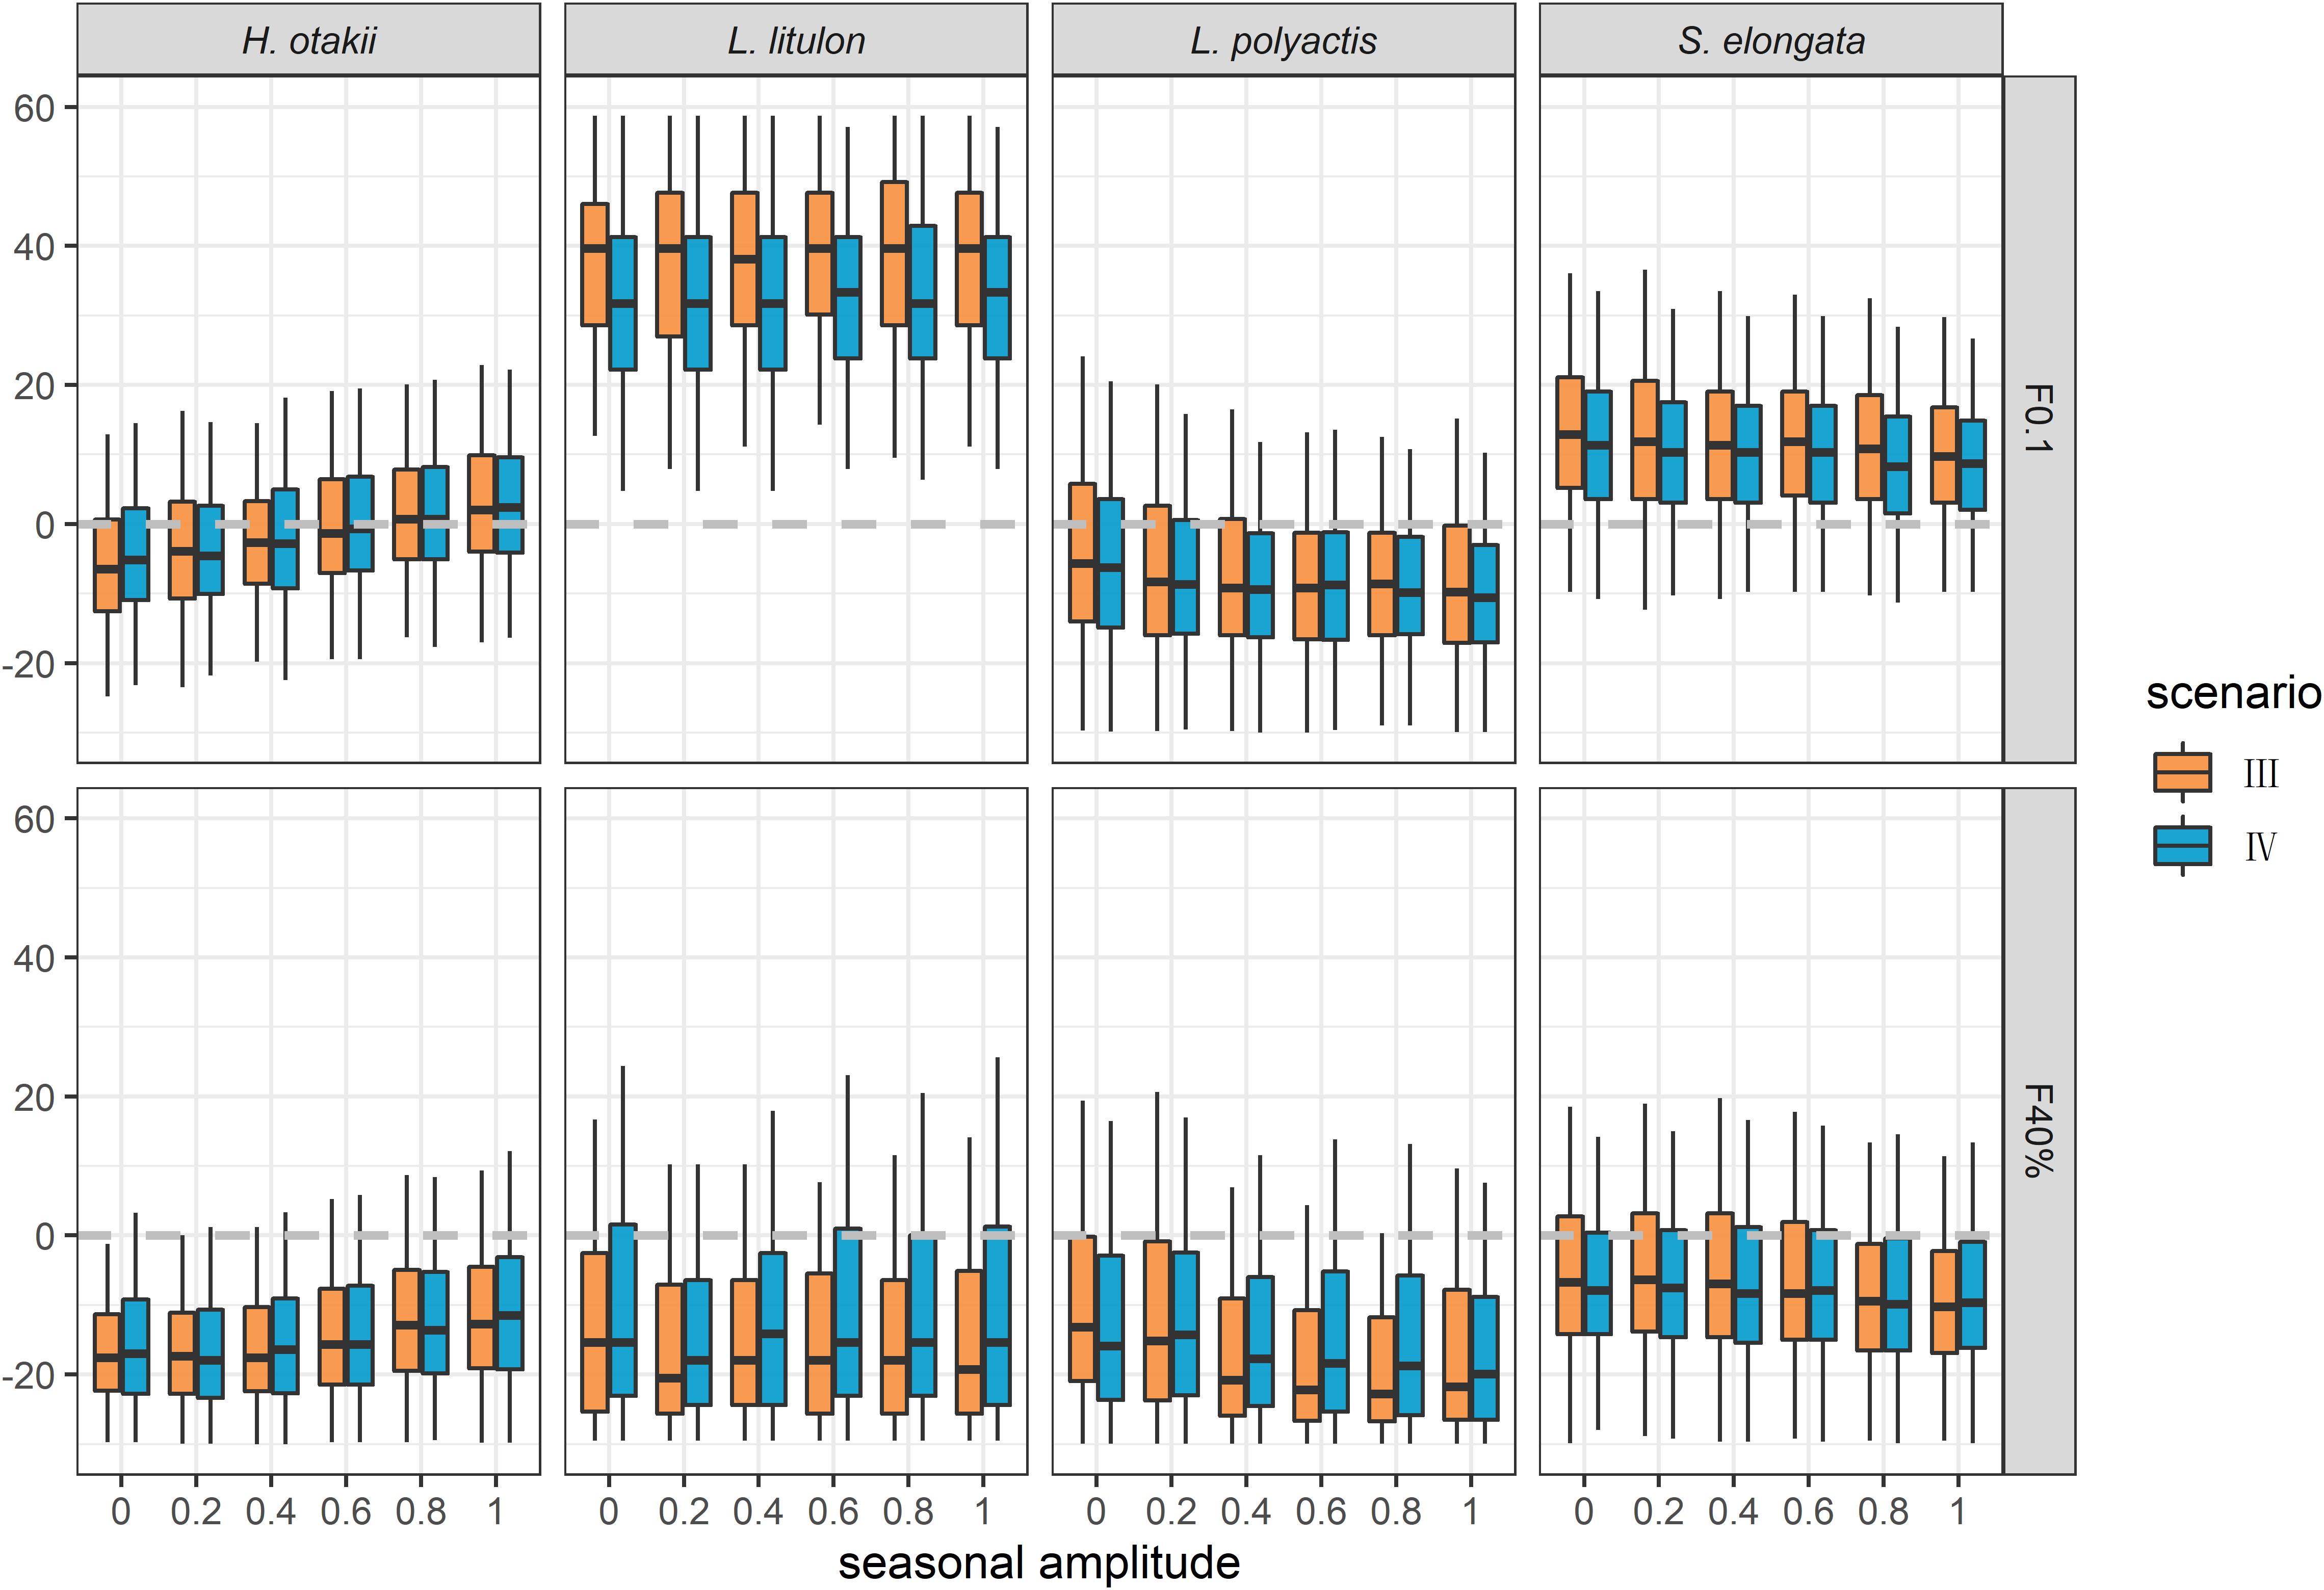
Figure 4. Relative bias of the estimation of BRPs F0.1 and F40% in data insufficient situation. Scenario III and IV indicated ignoring and considering seasonality, respectively.

Figure 5. (A) Fitting growth function by VBGF and soVBGF within dataset that display seasonal growth oscillation, the amplitude of seasonality is 0.8. (B) Similar plot with panel (A) except that the amplitude of seasonality is 0.4. (C) Scatterplot of the deviation caused by ignoring seasonality. Full line indicates trend line generated by generalized additive models (GAMs). (D) Deterministic estimation of reference point Fmax for H. otakii under different ts. Black points and gray points indicate that C is 0.8 and 0.4, respectively.
How Seasonality Works
Our “baseline” scenario indicated that seasonality could result in biased BRPs estimate even if the growth parameters were accurately obtained, and the extent was affected by seasonal oscillation amplitude (Supplementary Figure 3). We therefore explored two additional sub-scenarios to investigate how seasonality affected the estimation of BRPs (see Supplementary Material for details), and H. otakii were used as an example. Fitting VBGF with data of seasonal growth oscillation could lead to higher L∞ and lower K, because algorithm could not handle the deceleration phase of growth (Figures 5A,B, illustrating an amplitude of seasonality of 0.8 and 0.4, respectively). In addition, a remarkable correlation was observed between the range of deviation in reference points and the value of parameter ts (Figure 5C), and reference points also showed obvious patterns with the change parameter ts and parameter C according to numerical computation (Figure 5D). The results suggested ts might be associated with the direction of bias and C determined the magnitude of errors.
Discussion
Seasonality in growth has been widely observed in aquatic organisms, including marine and freshwater fish and invertebrate (e.g., crustacean), as responses to variations of environment conditions (e.g., fluctuations of temperature, light, and food supply) and individual life history process (e.g., molting). However, seasonality is seldomly incorporated into routine practices of stock assessment for many reasons, including that additional parameters used for incorporating seasonality may increase the difficulty of model fitting. Nevertheless, given the demand for accuracy of stock assessment and success of management strategy, our results suggest the influence of seasonality cannot be ignored in deriving management references.
Our finding demonstrates that ignoring seasonality in growth when it exists may result in misleading estimation of BRPs, which may lead to further errors in management, such as the under-estimation results in the loss of potential yield. Meanwhile, the risk of misleading was different among the four species. Seasonality showed negligible impact on the large-size species L. litulon and S. elongata, but for medium or small-size species H. otakii and L. polyactis, the mis-estimation could reach up to 20% and thus was hard to be overlooked. The conclusion was consistent with a previous study (Sparre, 1991), although that focused on fisheries yield. This situation suggests that management of some species (especially small-size one) may be exposed to high risk when fishing-mortality based reference points are used as proxies for MSY due to data insufficient. As seasonality in growth is quite common for small-size short-lived species (Veale et al., 2015; Yard et al., 2015; Tremont et al., 2016), we recommend a prior test of seasonality for stock assessment on those species to avoid possible bias.
This study explores how seasonal variability affects the estimation of reference points and demonstrated that the effect is associated with seasonal parameters C and ts. When seasonal variability is considered in per-recruit analyses, the time span of each length cohort ΔT is distorted, suggesting that slow-growing phase will be exposed to longer periods of fishing pressure before moving into next cohort, which can be reflected in the tumbling decrease within length composition (Figure 6). The position of distortion can influence the population length composition, for instance, population with a value of 0.95 for ts (shown in Figure 6B) has earlier gone through the first “slippery slope” than population of which ts is 0.15 (shown in Figure 6A) before reaching length at first capture, which is why the former has higher overall survival. The position is in control of variable ts, as thus, position parameter ts regulates the direction of misleading (if theoretical age at zero length is not equal to 0, position should be controlled by both ts and t0). This perspective could explain the interspecific difference on response to seasonality. Short-lived species have shorter length group and higher mortality than long-lived species, which made the distortion of growth rate and ΔT in per-recruit analyses more influential.

Figure 6. Growth curve and survival rates of each length group for H. otakii. (A) The population has a constant fishing mortality coefficient F = 0.4. C and ts are set to 0.8 and 0.15, respectively. (B) ts is set to 0.95, and other parameters are same as former.
Our results reveal a potential risk of serious mis-estimation of growth parameters L∞ and K if seasonality is ignored. These parameters have been proved as the key parameters that affect accuracy of estimated BRPs (Lin et al., 2015), implying that management plans for those species may need to be re-considered. Specifically, the misleading may cause the loss of securable yield, as the estimates of growth rate tend to be biased to lower values when ignoring seasonality. Furthermore, the growth rate K is considered to correlate with natural mortality, and in data-limited stocks, natural mortality coefficient is often derived from empirical estimators on the basis of K (Kenchington, 2014), e.g., Pauly’s estimator (Pauly, 1980). The combination of two effects above may lead to serious under-estimation of BRPs and undermine the demand of maximum sustainable catches (United Nations, 2002). On the contrary, we illustrated that incorporating seasonality falsely might not bias the estimation of growth parameter as well as the BRPs, although fitting soVBGF with two additional seasonal parameters requires data with higher accuracy. We emphasize that seasonality should be considered to ensure the validity of fishery management, especially for stock management based on fishing mortality-based BRPs.
Reliable stock assessment requires accurate input parameters, which depends on the quality of data collected from monitoring programs (Li et al., 2019) and effective methods for parameter estimation (Schwamborn et al., 2019). In the present study, parameter estimations were conducted according to a regular seasonal sampling, and age-based methods was superior to length-based methods. The results suggested that the estimation based on age-structure data could track the change of seasonal growth parameters, whereas ELEFAN were less effective (Supplementary Figure 6). Compared with Taylor and Mildenberger (2017) which conducted a similar ELEFAN simulation process with monthly observation and showed accurate estimation of seasonal parameters, we assume the monitoring programs matter, that is, quarter sampling may be insufficient to calculate seasonal parameters using ELEFAN. Sampling design need to be adjusted to satisfies the requirements of such research objective, which need further examination.
The individual-based modeling framework proposed in this study aims to reflect realistic population dynamic and improve understanding the effect of uncertainty from multiple sources on per-recruit analyses. Meanwhile, there are many issues that worth further consideration. For example, incorporating seasonality in growth requires selecting suitable growth function. Several functions have been proposed to account for seasonal growth, wherein the models from Hoenig and Hanumara (1982) and Somers (1988) were most popular. Despite that, proper growth functions may be species-specific, for example, the seasonal growth function proposed by Pauly et al. (1992) allows individuals to stop growing over a particular period of time (which is called as “no-growth time,” NGT), which can be useful to describe growth cessation of some species. In addition, the models modified from VBGF were criticized for inappropriate choice of the exponent relating the allometric relationship between anabolism and size of the organism (Chowdhury et al., 2013). Some novel models might be considered, e.g., Powell et al. (2019) conducted two new model to account for seasonality in a rate:state form, and Spence and Turtle (2017) used a flexible equation to represent the proportion of growth already occurred to describe growth function. Further comparison study for above models should benefit to the model selection. In addition, some assumptions and simplifications in our simulation should be noted for improvement. Input parameters except for growth parameters were assumed to be constant, and some parameters such as natural mortality coefficient and stock-recruitment relationship were considered to vary substantially due to environment changes. The effects of varying parameters may interact with that of seasonal growth, thus the integrative effects need to be further examined. To this end, the energy budget theory may be crucial to avoid the burden of examining numerous patterns of interactions and correlations among life-history parameters. Seasonality and correlations of vital rates may be better reflected with respect to body condition such as food shortage and starvation and ambient environment such as temperature (Brown et al., 2004). A mechanistic individual-based model may further improve our understanding of seasonal growth variability and its influence on fisheries assessment and management.
Conclusion
This study demonstrated that unawareness of seasonal growth could lead to biased BRPs estimation when it existed. Incorporating seasonality into consideration could largely improve the model estimation. The bias could occur at two processes: the biased estimation of growth parameters and the systematic error in per-recruit analyses caused by seasonality. Thus, the knowledge for life history traits should be better introduced in stock assessment to reduce the possible bias, as seasonal growth has been observed in many marine organisms.
The mechanism of effect of seasonal growth on population dynamic was discussed. The distortion caused by seasonal growth impacted the overall length compositions of fish stock. This inference could explain the observed situation: seasonal parameters ts were associated with the direction of bias and C determined the magnitude of errors. Under this condition, other length-based methods, that is, using length frequency data as model input, should be tested to identify the sensitivity to seasonal variability. In addition, this study observed interspecific difference on response to seasonal growth. Further research was required to investigate the biological mechanisms behind it.
Data Availability Statement
The raw data supporting the conclusions of this article will be made available by the authors, without undue reservation.
Author Contributions
YL performed the data analyses and wrote the manuscript. CZ contributed significantly to analysis and manuscript preparation. BX and YX helped to perform the analysis with constructive discussions. YR and YC contributed to the conception of the study. All authors contributed to the article and approved the submitted version.
Funding
The research was supported by the National Key R&D Program of China (2018YFD0900904 and 2018YFD0900906).
Conflict of Interest
The authors declare that the research was conducted in the absence of any commercial or financial relationships that could be construed as a potential conflict of interest.
Acknowledgments
We thank the editor and three reviewers for their review and comments on the manuscript. We also thank the members of the Fisheries Ecosystem Monitoring and Assessment Laboratory of Ocean University of China for data collection and their perspectives.
Supplementary Material
The Supplementary Material for this article can be found online at: https://www.frontiersin.org/articles/10.3389/fmars.2021.567240/full#supplementary-material
References
Adolph, S. C., and Porter, W. P. (1996). Growth, seasonality, and lizard life histories: age and size at maturity. Oikos 77, 267–278. doi: 10.2307/3546065
Beverton, R. J. H., and Holt, S. J. (1957). On the Dynamics of Exploited Fish Populations. Fisheries Investigations (Series 2), vol 19. London: United Kingdom Ministry of Agriculture and Fisheries.
Brooks, E. N. (2013). Effects of variable reproductive potential on reference points for fisheries management. Fish. Res. 138, 152–158. doi: 10.1016/j.fishres.2012.06.003
Brown, J. H., Gillooly, J. F., Allen, A. P., Savage, V. M., and West, G. B. (2004). Toward a metabolic theory of ecology. Ecology 85, 1771–1789. doi: 10.1890/03-9000
Carmona-Catot, G., Santos, A. F. G. N., Tedesco, P. A., and Emili García-Berthou (2014). Quantifying seasonality along a latitudinal gradient: from stream temperature to growth of invasive mosquitofish. Ecosphere 5, 1–23.
Chong, L., Mildenberger, T. K., Rudd, M. B., Taylor, M. H., Cope, J. M., Branch, T. A., et al. (2019). Performance evaluation of data-limited, length-based stock assessment methods. ICES J. Mar. Sci. 77, 97–108. doi: 10.1093/icesjms/fsz212
Chowdhury, M. A. K., Siddiqui, S., Hua, K., and Bureau, D. P. (2013). Bioenergetics-based factorial model to determine feed requirement and waste output of tilapia produced under commercial conditions. Aquaculture 410, 138–147. doi: 10.1016/j.aquaculture.2013.06.030
Chrysafi, A., and Kuparinen, A. (2016). Assessing abundance of populations with limited data: lessons learned from data-poor fisheries stock assessment. Environ. Rev. 24, 25–38. doi: 10.1139/er-2015-0044
Coma, R., Ribes, M., Gili, J. M., and Zabala, M. (2000). Seasonality in coastal benthic ecosystems. Trends. Ecol. Evol. 15, 448–453. doi: 10.1016/s0169-5347(00)01970-4
Datta, S., and Blanchard, J. L. (2016). The effects of seasonal processes on size spectrum dynamics. Can. J. Fish. Aquat. Sci. 73, 598–610. doi: 10.1139/cjfas-2015-0468
de Graaf, G. J., and Dekker, P. (2006). A simple spreadsheet model to incorporate seasonal growth into length-based stock assessment methods. NAGA 29, 46–54.
Du, J., Lu, Z., Yang, S., and Chen, M. (2011). Studies on ecological characteristics variation and population dynamics of four lizardfishes in the southern Taiwan straits. Acta. Oceanol. Sin. 30, 72–81. doi: 10.1007/s13131-011-0163-y
FAO (2006). Fisat II - Fao-Iclarm Stock Assessment Tool (Version 1.2.2). Rome: Food and Agriculture Organization of the United Nations.
Gabriel, W. L., and Mace, P. M. (1999). “A review of biological reference points in the context of the precautionary approach,” in Proceedings of the Fifth National NMFS Stock Assessment Workshop: Providing Scientific Advice to Implement the Precautionary Approach Under the Magnuson-Stevens Fishery Conservation and Management Act, (Washington, DC: NOAA Tech Memo NMFS-F/SPO-40), 34–45.
Hilborn, R., and Walters, C. J. (1992). Quantitative Fisheries Stock Assessment: Choice, Dynamics and Uncertainty. New York: Chapman and Hall.
Hoenig, J. M., and Hanumara, R. C. (1982). A Statistical Study of a Seasonal Growth Model for Fishes. in Technical Report of the Department of Computer Science and Statistics.: Kingston, RI: University of Rhode Island, 91.
Hufnagl, M., Huebert, K. B., and Temming, A. (2013). How does seasonal variability in growth, recruitment, and mortality affect the performance of length-based mortality and asymptotic length estimates in aquatic resources? ICES J. Mar. Sci. 70, 329–341. doi: 10.1093/icesjms/fss163
Katsukawa, T. (2005). Evaluation of current and alternative fisheries management scenarios based on spawning-per-recruit (SPR), revenue-per-recruit (RPR), and yield-per-recruit (YPR) diagrams. ICES J. Mar. Sci. 62, 841–846. doi: 10.1016/j.icesjms.2005.04.002
Kenchington, T. J. (2014). Natural mortality estimators for information-limited fisheries. Fish Fish. 15, 533–562. doi: 10.1111/faf.12027
Kvamme, C., and Bogstad, B. (2007). The effect of including length structure in yield-per-recruit estimates for northeast arctic cod. ICES. J. Mar. Sci. 64, 357–368. doi: 10.1093/icesjms/fsl027
Li, B., Chen, Y., Reardon, K., and Wilson, C. (2019). A simulation-based evaluation of sea sampling design for American lobster in the Gulf of Maine. Fish. Res. 216, 145–154. doi: 10.1016/j.fishres.2019.04.012
Lin, Y. J., Sun, C. L., Chang, Y. J., and Tzeng, W. N. (2015). Sensitivity of yield-per-recruit and spawning-biomass-per-recruit models to bias and imprecision in life history parameters: an example based on life history parameters of Japanese eel (Anguilla japonica). Fish. Bull. NOAA 113, 302–312. doi: 10.7755/fb.113.3.6
Magnusson, A., Punt, A. E., and Hilborn, R. (2013). Measuring uncertainty in fisheries stock assessment: the delta method, bootstrap, and MCMC. Fish Fish. 14, 325–342. doi: 10.1111/j.1467-2979.2012.00473.x
Mildenberger, T. K., Taylor, M. H., and Wolff, M. (2017). TropFishR: an R package for fisheries analysis with length-frequency data. Methods Ecol. Evol. 8, 1520–1527. doi: 10.1111/2041-210x.12791
Moreau, C. M., and Matthias, B. G. (2018). Using limited data to identify optimal bag and size limits to prevent overfishing. N. Am. J. Fish Manag. 38, 747–758. doi: 10.1002/nafm.10073
Ogle, D. H. (2017). An algorithm for the von Bertalanffy seasonal cessation in growth function of Pauly et al. (1992). Fish. Res. 185, 1–5. doi: 10.1016/j.fishres.2016.09.020
Pardo, S. A., Cooper, A. B., and Dulvy, N. K. (2013). Avoiding fishy growth curves. Methods Ecol. Evol. 4, 353–360. doi: 10.1111/2041-210x.12020
Patterson, K., Cook, R., Darby, C., Gavaris, S., and Gunnar Stefánsson. (2001). Estimating uncertainty in fish stock assessment and forecasting. Fish Fish. 2, 125–157. doi: 10.1046/j.1467-2960.2001.00042.x
Pauly, D. (1980). On the interrelationships between natural mortality, growth parameters, and mean environmental temperature in 175 fish stocks. ICES J. Mar. Sci. 39, 175–192. doi: 10.1093/icesjms/39.2.175
Pauly, D. (1983). Length-converted catch curves: a powerful tool for fisheries research in the tropics (part 1). Fishbyte 1, 9–13.
Pauly, D. (1990). Length-converted catch curves and the seasonal growth of fishes. Fishbyte 8, 33–38.
Pauly, D., and David, N. (1981). ELEFAN I, a BASIC program for the objective extraction of growth parameters from length-frequency data. Meeresforschung 28, 205–211.
Pauly, D., Soriano-Bartz, M., Moreau, J., and Jarre-Teichmann, A. (1992). A new model accounting for seasonal cessation of growth in fishes. Mar. Freshw. Res. 43, 1151–1156. doi: 10.1071/mf9921151
Pilling, G. M., Kirkwood, G. P., and Walker, S. G. (2002). An improved method for estimating individual growth variability in fish, and the correlation between von Bertalanffy growth parameters. Can. J. Fish. Aquat. Sci. 59, 424–432. doi: 10.1139/f02-022
Powell, C. D., López, S., and France, J. (2019). Elementary functions modified for seasonal effects to describe growth in freshwater fish. J. Theor. Biol. 461, 133–144. doi: 10.1016/j.jtbi.2018.10.036
Punt, A. E., Haddon, M., and McGarvey, R. (2016). Estimating growth within size-structured fishery stock assessments: what is the state of the art and what does the future look like? Fish. Res. 180, 147–160. doi: 10.1016/j.fishres.2014.11.007
R Core Team (2018). R: A Language and Environment for Statistical Computing. Vienna: R Foundation for Statistical Computing. Available online at: https://www.R-project.org/.
Sakai, T., Yoneda, M., Shiraishi, T., Tokimura, M., Horikawa, H., and Matsuyama, M. (2009). Age and growth of the lizardfish saurida elongata from the Tsushima/Korea Strait. Fish. Sci. 75, 895–902.
Schwamborn, R., Mildenberger, T. K., and Taylor, M. H. (2019). Assessing sources of uncertainty in length-based estimates of body growth in populations of fishes and macroinvertebrates with bootstrapped ELEFAN. Ecol. Model. 393, 37–51. doi: 10.1016/j.ecolmodel.2018.12.001
Shan, X., Li, X., Yang, T., Sharifuzzaman, S. M., Zhang, G., Jin, X., et al. (2017). Biological responses of small yellow croaker (Larimichthys polyactis) to multiple stressors: a case study in the yellow sea, China. Acta Oceanol. Sin. 36, 39–47. doi: 10.1007/s13131-017-1091-2
Sparre, P. (1990). Can we use traditional length-based fish stock assessment when growth is seasonal? Fishbyte 8, 29–32.
Sparre, P. (1991). Estimation of yield per recruit when growth and fishing mortality oscillate seasonally. Fishbyte 9, 40–44.
Spence, M. A., and Turtle, A. J. (2017). Making the most of survey data: incorporating age uncertainty when fitting growth parameters. Methods Ecol. Evol. 7, 7058–7068. doi: 10.1002/ece3.3280
Sun, M., Zhang, C., Li, Y., Xu, B., Xue, Y., and Ren, Y. (2018). Management strategy evaluation of fishery stocks in Haizhou bay based on data-limited methods. J. Fish. Chin. 42, 1661–1669.
Taylor, M. H. (2016). Fishdynr: Fisheries Science Related Population Dynamics Models (version 0.4.1).
Taylor, M. H., and Mildenberger, T. K. (2017). Extending electronic length frequency analysis in R. Fish. Manag. Ecol. 24, 330–338. doi: 10.1111/fme.12232
Tremont, R. M., Harding, J. M., and Allen, D. M. (2016). Effects of within-season temperature variations on the early life history of two estuarine demersal fishes. Environ. Biol. Fish. 99, 79–94. doi: 10.1007/s10641-015-0455-8
Truesdell, S. B., Hart, D. R., and Chen, Y. (2016). Effects of spatial heterogeneity in growth and fishing effort on yield-per-recruit models: an application to the US Atlantic sea scallop fishery. ICES J. Mar. Sci. 73, 1062–1073. doi: 10.1093/icesjms/fsv238
United Nations (2002). Report of the World Summit on Sustainable Development. Johannesburg: United Nations.
Veale, L., Coulson, P., Hall, N., Hesp, A., and Potter, I. C. (2015). Age and size compositions, habitats, growth and reproductive characteristics of a terapontid (Pelates octolineatus) in coastal waters. Mar. Freshw. Res. 66, 535–548. doi: 10.1071/mf14079
Yard, M. D., Korman, J., Walters, C. J., and Kennedy, T. A. (2015). Seasonal and spatial patterns of growth of rainbow trout in the Colorado river in grand Canyon, Arizona. Can. J. Fish. Aquat. Sci. 73, 125–139. doi: 10.1139/cjfas-2015-0102
Yoneda, M., Tokimura, M., Fujita, H., Takeshita, N., Takeshita, K., Matsuyama, M., et al. (1997). Age and growth of anglerfish lophius litulon in the east china sea and the yellow sea. Fish. Sci. 63, 887–892. doi: 10.2331/fishsci.63.887
Yoneda, M., Tokimura, M., Fujita, H., Takeshita, N., Takeshita, K., Matsuyama, M., et al. (2001). Reproductive cycle, fecundity, and seasonal distribution of the anglerfish Lophius litulon in the East China and Yellow seas. Fish. Bull. NOAA 99, 356–370.
Keywords: seasonality, per-recruit analyses, biological reference points, data availability, model improvement, growth parameters
Citation: Liu Y, Zhang C, Xu B, Xue Y, Ren Y and Chen Y (2021) Accounting for Seasonal Growth in Per-Recruit Analyses: A Case Study of Four Commercial Fish in Coastal China Seas. Front. Mar. Sci. 8:567240. doi: 10.3389/fmars.2021.567240
Received: 29 May 2020; Accepted: 28 January 2021;
Published: 18 February 2021.
Edited by:
Daniel Pauly, Sea Around Us, CanadaReviewed by:
Hui Zhang, Institute of Oceanology (CAS), ChinaMaite Pons, University of Washington, United States
Qi Lee, University of Washington, United States
Copyright © 2021 Liu, Zhang, Xu, Xue, Ren and Chen. This is an open-access article distributed under the terms of the Creative Commons Attribution License (CC BY). The use, distribution or reproduction in other forums is permitted, provided the original author(s) and the copyright owner(s) are credited and that the original publication in this journal is cited, in accordance with accepted academic practice. No use, distribution or reproduction is permitted which does not comply with these terms.
*Correspondence: Yiping Ren, cmVueWlwQG91Yy5lZHUuY24=