 Kathryn D. Bisack
 Gisele M. Magnusson
- 1Northeast Fisheries Science Center, National Oceanic and Atmospheric Administration (NOAA-Fisheries), Woods Hole, MA, United States
- 2Economics, Statistics, and Data Governance, Fisheries and Oceans Canada (DFO), Ottawa, ON, Canada
Despite the use of gear requirements and access restrictions to manage lobster fishery interactions with north Atlantic right whales since 1997, the population is likely below 370 animals. The Dynamic Area Management (DAM) program (2002–2009) used “real-time” right whale sightings data to provide temporary protection using closures or whale-modified-gear to reduce entanglement. Our ex-post evaluation uses a flexible framework to identify strengths and weaknesses of the program. Biological and economic implications of the program are evaluated using a relative risk of entanglement index (RREI) calculated with spatially and temporally explicit data on density of right whales and fishing effort. An illustrative closure optimization model demonstrates the trade-offs between the non-monetary benefits of risk reduction and the opportunity cost of closures under alternative decision rules (benefit-ranking and cost-effectiveness). Annual aerial sampling to detect DAM areas was low (<3%), yet in some months’ the 17% of area covered by all northeast right whale management areas encompassed up to 70% of the region’s population. Despite their small spatial footprint, dynamic and static measures may have reduced total risk by 6.5% on average, and DAM zones may have created an indirect economic incentive for some fishers to adopt the whale-modified-gear. Similar RREI index values in some months with inverse levels of fishing effort and whale presence highlight the need to consider fishing and whales jointly to reduce risk. These temporal-spatial patterns are critical in policy instrument design. Further, optimization results illustrate how different decision rules can attain equivalent non-monetary benefits of risk reduction at different opportunity costs to industry; the implications of whale-modified-gear and compliance factors are explored. We recommend that DAMs be considered as part of a suite of policy instruments, and highlight how recent technological advances may support lower cost data collection and faster implementation given limited public sector budgets. This case study highlights the need for evaluation of past policy instruments with a lens beyond biological outcomes, and sets the stage for further empirical analysis to better understand harvester responses to management measures designed to protect right whales and the resulting private and public sector trade-offs.
Introduction
The complex interplay between commercial fisheries and marine protected species may require multiple policy instruments to support conservation, as in the case with the north Atlantic right whale (Eubalena glacialis; right whale) and the American lobster (Homarus americanus) fishery in the northeast United States (U.S.). Bycatch is the single greatest cause of cetacean mortality (Read et al., 2006). Over the past 20 years a growing regime of policy instruments have been applied to the American lobster fishery to reduce the entanglement of right whales in fishing gear in order to allow the endangered population to recover; however, recovery has not occurred (National Oceanic and Atmospheric Administration (NOAA), 2017). While past regulatory measures have been assessed prior to implementation (ex-ante), there has been relatively few ex-post evaluations of the effectiveness or success of past measures for marine mammals and fishing interactions as there is rarely a control or counterfactual to determine what would have occurred in the absence of bycatch management (Little et al., 2015). Such studies can provide insights and guidance in the modification of existing measures and development of new measures. We use a case study approach to develop a framework to jointly consider the conservation and economic considerations of management focused on risk reduction for a large migratory protected species. The case study evaluates the Dynamic Area Management (DAM) program for right whale protection between 2002 and 2009, adding to the literature on policy instruments used to protect marine protected species from interactions with commercial fishing activity (see Fonner et al., 2020 for a recent review).
The right whale population is endangered. The population was as high as 500 in 2010 but is declining (Pace et al., 2017); the most recent abundance estimate is 428 animals (National Oceanic and Atmospheric Administration (NOAA), 2020), with the 2019 population likely less than 370 (Pettis et al., 2020). The leading known causes of mortality for right whales are entanglement in fishing gear and vessel strikes (National Oceanic and Atmospheric Administration (NOAA), 2020). The distribution between the two causes of mortality is unknown, however, recent information indicates the vast majority of serious injuries are entanglement-related and this mortality is widely underestimated (Pace et al., 2021). Further, based on the distribution of vertical lines by gear type, roughly 96% of the vertical lines in U.S. east coast waters were attached to lobster trap/pots for any month on average (National Oceanic and Atmospheric Administration (NOAA), 2014: Exhibit 5–4), suggesting lobster gear likely poses the greatest probability of a whale entanglement. Implementation of measures to reduce the likelihood and severity of entanglements for right whales and other large whales began in 1997, with the first Atlantic Large Whale Take Reduction Plan (the Plan), while implementation of measures to reduce mortality from ship strikes began in 2008 (73 FR 60173, October 10, 2008).1 Ex-post evaluations of the measures for vessel speed and traffic relocation, which are not part of the Plan, have considered biological outcomes (Laist et al., 2014) and compliance (Lagueux et al., 2011; Silber et al., 2014). Ex-post evaluation of the Plan’s success has focused on biological outcomes for the combined measures in the Plan (Knowlton et al., 2012; Pace et al., 2014) and on the Take Reduction Team process (Borggaard et al., 2017). However, the lack of data on entanglement or bycatch rates and the impacts of fishing practices, gear characteristics, area, and/or environmental factors on those rates (Borggaard et al., 2017) make the ex-post evaluation of biological outcomes of a specific management measure, such as DAM, difficult. Evaluation of biological outcomes is further complicated by the progression and overlap of management measures over time. However, policy instruments may be designed to achieve multiple goals or objectives, and the use of other evaluation criteria including, among others, economic, social-normative and longevity (Bisack and Magnusson, 2016) may be appropriate for evaluation of individual measures, such as the DAM program.
All the policy instruments in the Plan were based on a command-and-control, direct regulatory approach, such as input controls (time-area closures) to reduce fishing effort and technical standards (gear modifications) to reduce entanglement rates (Squires and Garcia, 2014; Lent and Squires, 2017). The instruments within the Plan progressed from seasonal closures of critical habitat to static and dynamic gear-modification zones, then to broad-based mandatory gear modifications. This sequence follows the first two stages of the mitigation hierarchy (Squires and Garcia, 2014; Milner-Gulland et al., 2018) of avoidance (closures) and minimization (gear modifications).2 The mitigation hierarchy approach suggests a sequence of steps (avoid, minimize, restore, compensate) that minimizes ecological risk across all steps (Squires and Garcia, 2014), which may be implemented simultaneously and will interact in the achievement of the biological goal or target (Milner-Gulland et al., 2018). If each step in the hierarchy is implemented to the maximum extent practicable before moving to the next step, diminishing conservation returns per monetary unit spent can result with suboptimal conservation; this can be reduced using a least-cost approach within and between steps (Squires and Garcia, 2018; Squires et al., 2018). Alternatively, incentive-based policy instruments that incorporate the social cost of entanglement in fishing may outperform other instruments and provide an alternative approach to command-and-control.
The team tasked with developing the Plan must deal with the complexity of designing policy instruments that implicitly minimize economic impacts to the target fishery (e.g., cost to lobster fishery) while explicitly minimizing the entanglement of non-target species (i.e., benefit to right whales). Cost-benefit analysis identifies options that maximize net benefits and yield an efficient solution; however, cost-benefit analysis requires monetization of benefits and costs which may not be possible. The formal joint consideration of both biological or non-monetary benefits and economic costs has grown in conservation planning (Ando et al., 1998; Naidoo et al., 2006; Robin et al., 2006), including in the marine environment (e.g., Stewart and Possingham, 2005; Delavenne et al., 2012; Oinonen et al., 2016). For protected species, ex-ante regulatory economic analysis often takes the form of cost-effectiveness analysis,3 with a comparison of non-monetary biological benefits (i.e., minimize risk of entanglement) with costs (i.e., profit reductions of the fishery) for a discrete number of alternatives. Joint consideration of costs and non-monetary benefits within a optimization framework can yield different outcomes (i.e., compared to when costs not considered) where the magnitude of the efficiency gains depends on the correlations between, and relative variabilities of, benefits and costs across investment or management measures (Ferraro, 2003). One of the challenges of this type of analysis is a quantitative measure of non-monetized benefits of the policy instrument (i.e., management measures).
The focus of the Plan on measures to reduce the likelihood and severity of entanglement by large whales in commercial fixed-gear fisheries suggests it is appropriate to discuss benefits from the Plan in the context of “risk reduction.” The common concept of risk includes what can happen, the likelihood of that happening, and the consequence if it happens (Kaplan and Garrick, 1981). Several measures of entanglement risk have focused on the likelihood aspect defined as a co-occurrence between the gear of concern and whales. Wiley et al. (2003) developed an index of Relative Interaction Potential between large whales and commercial fisheries gear in Stellwagen Bank National Marine Sanctuary, United States. To evaluate alternatives for the reopening of the winter black sea bass fishery in the southeastern United States, Farmer et al. (2016) developed Relative Risk Units which considered right whale survey encounters (a proxy for density) and fishing effort measured in soak time. Brilliant et al. (2017) used the probability of encounter of right whales for the Atlantic waters of Canada, which multiplied the annual probability of occurrence of a fishing set within a grid cell by the probability of a right whale within the cell. Vanderlaan et al. (2011) considered the third component of risk by including a measure of lethality to individual whales. Depth was used as an estimate of end-buoy line length, with an encounter based on the relative probability of whale presence and gear presence for the Fundy-Scotia area, Canada.4
The DAM program was an innovative “real-time” instrument when introduced, an early example of dynamic ocean management which uses near real-time data to guide the spatial distribution of commercial activities (Lewison et al., 2015). Actual examples of dynamic management remain relatively novel, despite analyses that suggest dynamic area management for fisheries (e.g., Hobday and Hartmann, 2006; Hobday et al., 2010; Needle and Catarino, 2011; Dunn et al., 2016) and marine protected species (e.g., Grantham et al., 2008; Hazen et al., 2018), and reduce bycatch and protected species interactions (Lewison et al., 2015). Using an optimization approach to achieve defined reductions in bycatch, Grantham et al. (2008) found that bycatch reductions could be achieved with lower costs to fishers with spatially and temporally moveable (dynamic) closures as compared to static temporary or permanent closures. Based on 10 case studies of real-time spatial management approaches, Little et al. (2015) concluded that for dynamic management, greater monitoring and control of individual practices may be required to allow for better management and utilization of target and bycatch quota if individual incentives to avoid bycatch are weak. In a review of nine examples, Lewison et al. (2015) identify regulatory frameworks and incentive structures, stakeholder participation, and user aligned technological applications as key to successful implementation of dynamic ocean management. While Little et al. (2015) called for additional evaluation of dynamic management, they note that in many cases rigorous assessment of performance is made difficult by the lack of a control or counterfactual. Empirical evaluations using quasi-experimental data, such as difference-in-difference, require the identification of a counterfactual (e.g., Ardini and Lee, 2018).
We develop a flexible framework that considers biological and economic factors simultaneously that can be used to assess alternative policy instruments including closures and gear modifications, and use this framework for the evaluation of the DAM program. This is an initial step toward an analysis that can assess a broader range of policy instruments. To set the stage for an evaluation of the DAM program we provide background on the U.S. American lobster fishery and the DAM program as part of the Plan to reduce fishery interactions with right whales. Given the critical role of the NOAA-Fisheries aerial survey in the implementation of the DAM program, we review monthly flights. We then assess the biological and economic implications of the DAM program relative to other spatial measures, using spatially and temporally explicit data on whale and fishing effort density to develop a relative risk of entanglement index (RREI) for right whales. Using reductions in risk as the non-monetary benefit measure and fishing revenues as a proxy for opportunity costs, we develop an illustrative closure optimization model. We evaluate two management decision rules (benefits-ranking and cost-effectiveness) subject to the same risk reduction constraint, solving for the optimal number of closures (i.e., avoidance) under each decision rule. Then under the cost-effectiveness rule, we consider minimization measures (i.e., gear modifications) to reduce the risk of entanglement, and the implications of non-compliance with gear requirements. Taking into account data quality issues, we demonstrate the utility of our framework and present general results that highlight the tradeoffs between biological and economic objectives. Finally, we summarize our general observations on DAM for right whales, discuss the strengths and challenges of implementing dynamic management, and offer recommendations for future policy instrument design.
Background
The U.S. American Lobster Fishery
The American lobster (Homarus americanus) has been one of the top three most valuable individual commercial species landed in the United States since 1997, accounting for an average of 9% of the national value of domestic landings.5 The fishery occurs from Maine to Cape Hatteras, North Carolina although the vast majority of landings come from waters of Maine (Figure 1). Maine’s dominance of the fishery has increased from 57% of all landings in 1997 rising to 82% in 2018. During the period 2002–2009, the United States landed an average of 39,856 metric tons of lobster with an average annual dockside-value of $393M (US$2012), with about 79% of landings and 75% of value from Maine.
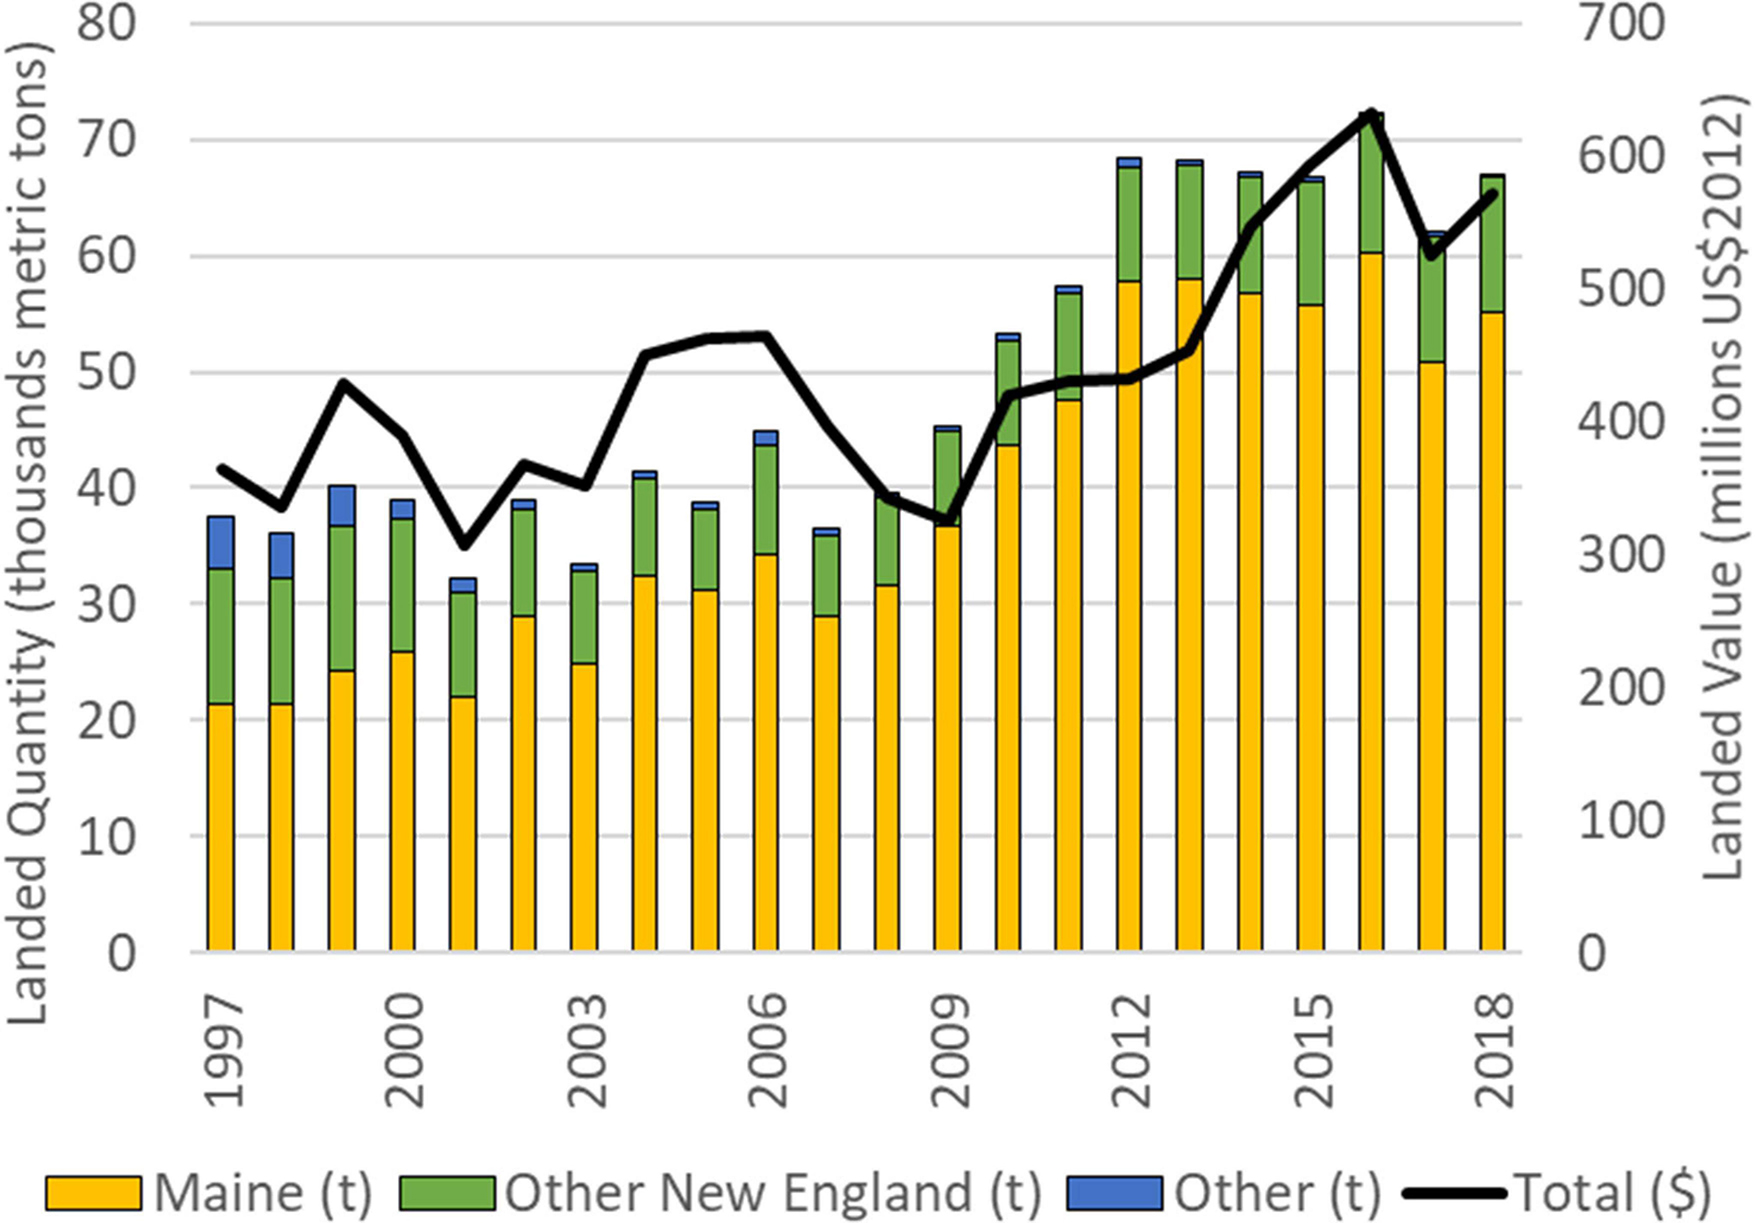
Figure 1. United States Lobster (Homarus americanus) landings for Maine (stacked yellow column), other New England states (stacked green column) and the rest of the United States (stacked blue bar) in thousands of metric tons and total landed value (solid line, right axis) in millions of United States dollars (US$2012), 1997–2018. New England coastal states include Maine, New Hampshire, Massachusetts, Rhode Island, and Connecticut. Source: NOAA Fisheries. Commercial Fisheries Statistics. https://www.fisheries.noaa.gov/national/sustainable-fisheries/commercial-fisheries-landings.
The fishery is cooperatively managed by the states and National Oceanic and Atmospheric Administration Fisheries (NOAA-Fisheries) under the framework of the Atlantic States Marine Fisheries Commission. States have jurisdiction for implementing measures in state waters within 3 nautical miles of shore, while NOAA-Fisheries implements complementary regulations in offshore federal waters 3–200 nautical miles from shore. The reporting requirements for vessels have changed over time and vary by the type of permit held. Vessels that hold a federal lobster permit as well as any other federal fishery permit must submit vessel trip reports (VTR), which include amongst other information, catch and an average fishing location for each trip. However, if the vessel only holds a federal permit for lobster, VTR are not required. State-level data collection exists, but varies by state and over time.
The lobster fishery predominantly uses pots and traps, with the term “lobster trap” broadly referring to any structure or device, other than a net, that is designed to be placed on the ocean bottom and is capable of catching lobsters. A number of traps may be linked together with “groundline” to create a “trawl,” the location of which is identified using one or more buoys attached to the trawl using a vertical line arrangement. Specific gear requirements vary by area, but include requirements for marking and deployment. Management measures include biological requirements (e.g., minimum and maximum size), as well as effort constraints including limited access and either individual trap allocations or caps on the number of traps per permit.
The market for lobster is for human consumption and it is sold live or it is processed and primarily sold frozen (Pereira and Josupeit, 2017). There is a high degree of integration in the processing and trade of lobster between the United States and Canada, with each country being the largest trade partner for the other (Department of Fisheries and Oceans Canada (DFO), 2018). Parts of the Maine lobster fishery first received sustainability certification from the Marine Stewardship Council (MSC) in 2013; however, the most recent certification was suspended in summer 2020 as a result of concerns regarding right whale entanglement. 6
Measures to Reduce Right Whale-Fisheries Interactions7
The range of the north Atlantic right whale, which historically included much of the north Atlantic, is primarily in the northwest Atlantic from northern Florida, United States to Newfoundland and Labrador, Canada (National Oceanic and Atmospheric Administration (NOAA), 2020). The species is protected under the Endangered Species Act (Endangered Species Act (ESA), 1973) and the (Marine Mammal Protection Act (MMPA), 1972) of the United States and the Species at Risk Act (Species at Risk Act, 2002) of Canada. This species has been extensively studied within the south and central part of this range in U.S. waters and the Scotian Shelf in Canada, and biologically important areas for calving, migrating, feeding and mating have been identified (LaBrecque et al., 2015).
To protect these whales, in 1994 two areas of critical habitat as defined by the ESA were designated in the United States, the Great South Channel (Figure 2, solid gray area) and Cape Cod Bay (Figure 3, solid gray area) (59 Federal Register 28805, 3 June 1994). This was followed in 1997 by the Atlantic Large Whale Take Reduction Plan (the Plan), which was developed under the authority of the MMPA to address incidental takes or bycatch of large whales, defined as non-intentional, accidental death or injury that occurs during an otherwise lawful activity, such as permitted fishing. While the Plan was developed to implement measures to reduce the likelihood and severity of entanglement in commercial fixed-gear fisheries, including lobster, for north Atlantic right whale, north Atlantic humpback whale (Megaptera novaeangliae) and fin whale (Balaenoptera physalus), and benefited minke whales (Balaenoptera acutorostrata), the spatial management rules in the Plan focused on the right whale.
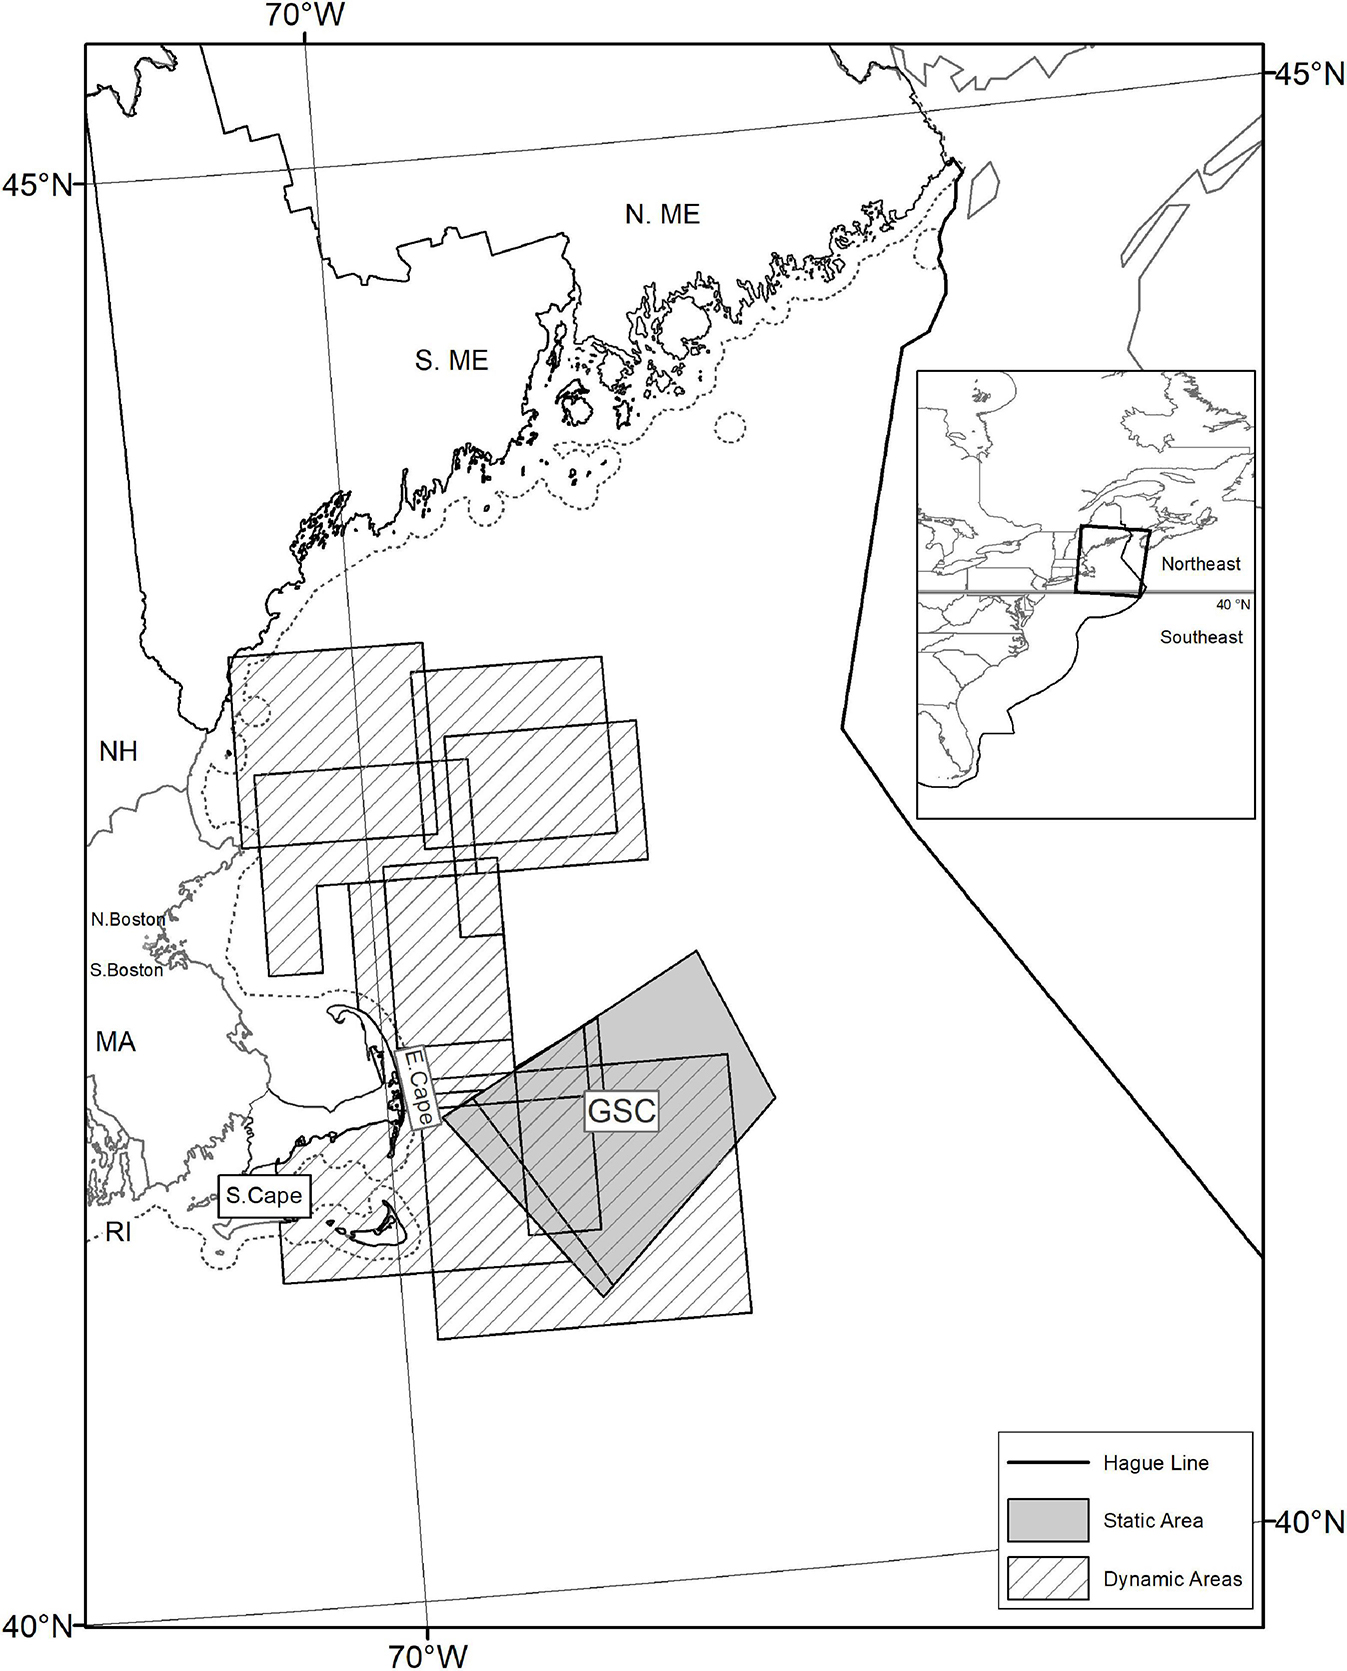
Figure 2. Right whale management areas in the northeast United States that required removal of lobster fishing gear during certain times of year (i.e., avoid risk), as identified in the Atlantic Large Whale Take Recovery Plan, 2002–2009, with port groups and state waters (dash line 3 nm from shore) identified. Great South Channel (GSC) critical habitat area (solid gray area), and Dynamic Area Management (DAM) zones (hatched area).
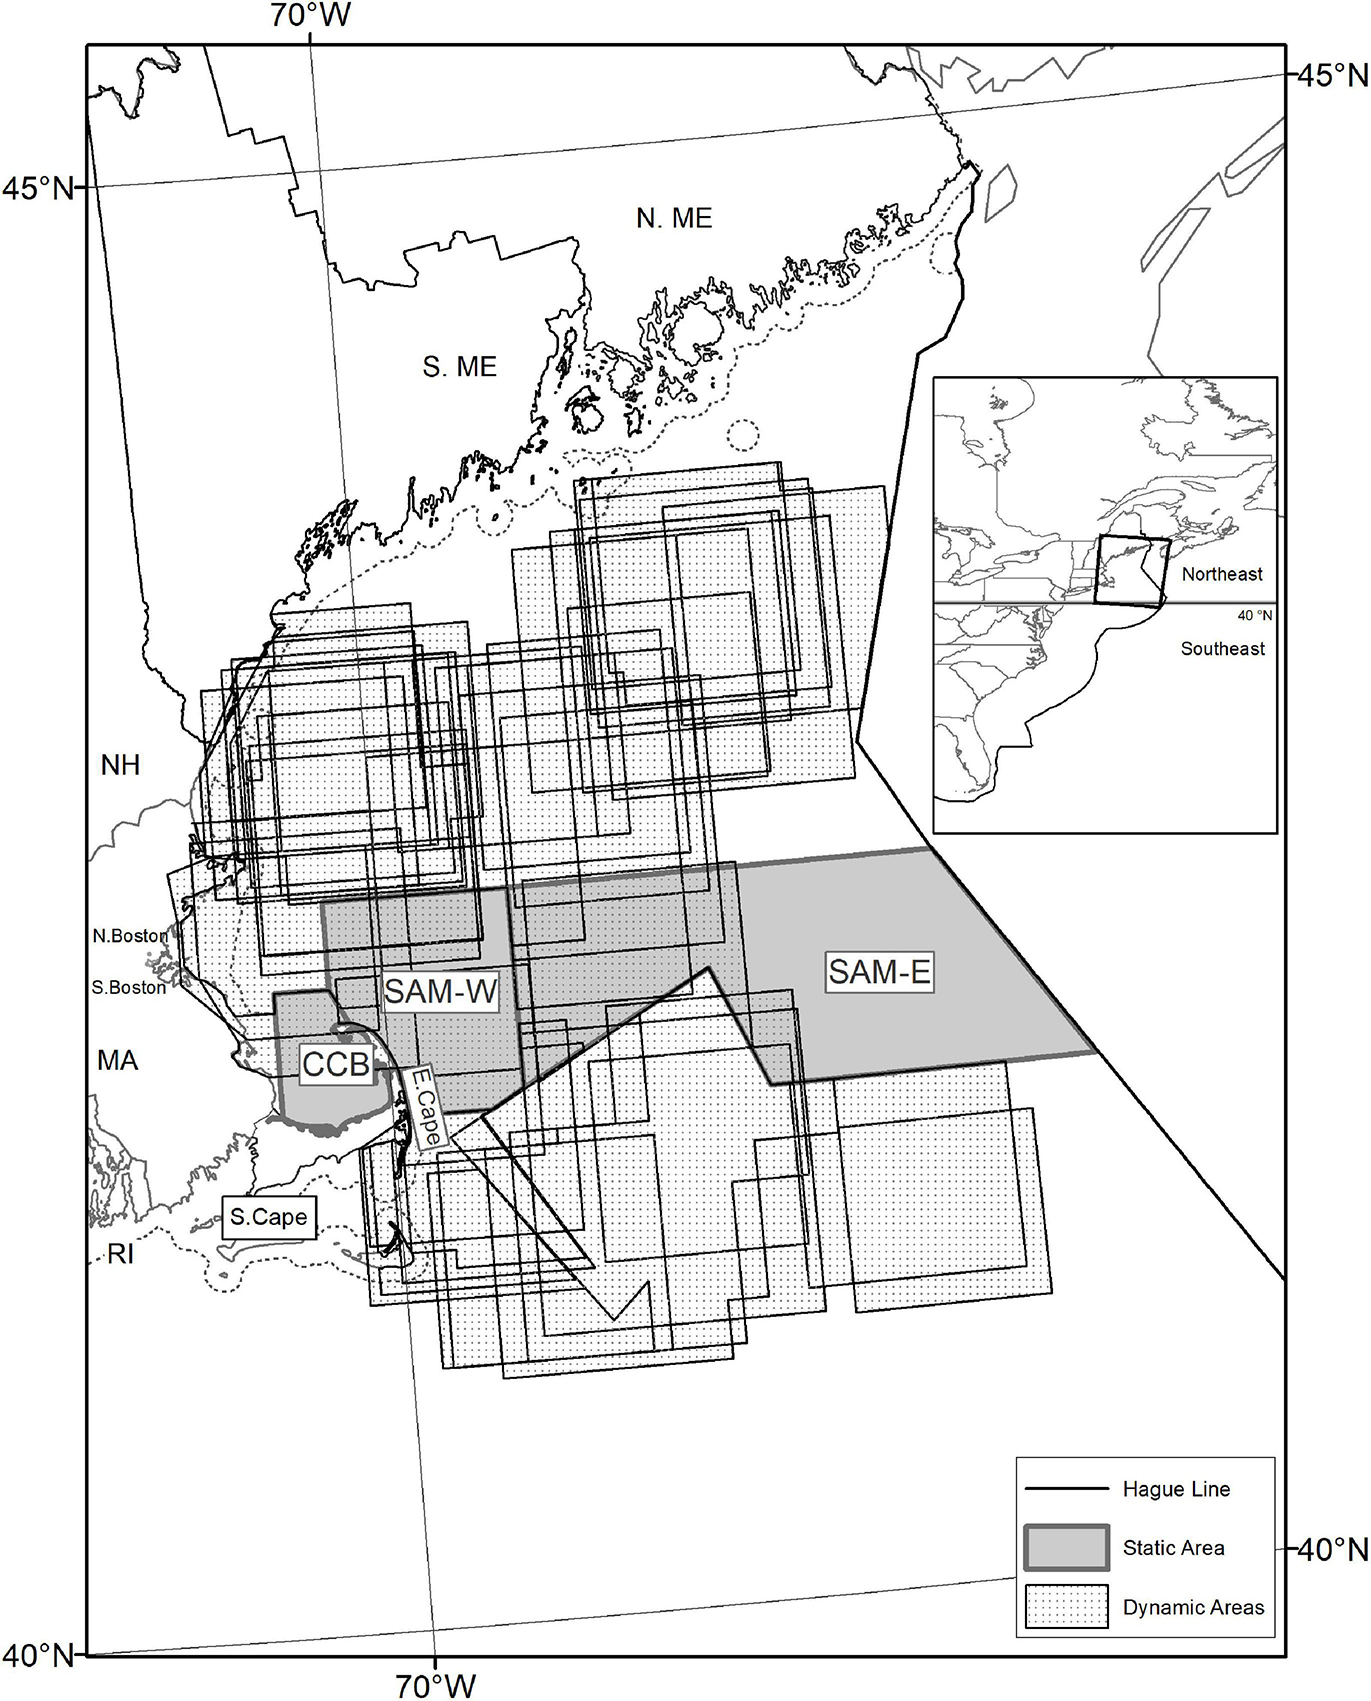
Figure 3. Right whale management areas that required the use of whale-modified-gear during certain times of year (i.e., minimize risk), as identified in the Atlantic Large Whale Take Recovery Plan, 2002–2009, with port groups and state waters (dash line 3 nm from shore) identified. Static areas included Cape Cod Bay (CCB) critical habitat area and Seasonal Area Management zones East (SAM-E) and West (SAM-W) (solid gray area). Dynamic areas include Dynamic Area Management (DAM) zones (hatched area).
Marine animals can become entangled in fishing gear, with impacts ranging from no permanent injury to immediate drowning. Large whales, such as right whales may not be in danger of immediate drowning as they can often pull all or parts of the gear off the ocean floor, and so the likelihood of observing an entanglement at the contact point is low. When these whales travel with gear they can suffer serious injury and potentially mortality, even if they eventually lose the gear. Most adult right whales have scarring evidence of multiple encounters with gear which can affect health, reproduction and survival (Robbins et al., 2015; Knowlton et al., 2016).
The objectives of the Plan are determined by statutory benchmarks of the MMPA, which require reductions in levels of bycatch in relation to the Potential Biological Removal level (Wade and Angliss, 1997) and timelines to achieve the reductions. Observed fishing mortality for right whale was, and continues to be, above the Potential Biological Removal level.8 Borggaard et al. (2017) provides a timeline for the major rule making actions under the Plan between July 1997 and May 2015, as well as the process for the development of the rules; the Plan continues to be adapted based on need with the most recent proposed changes published December 31, 2020 (85 Federal Register 86878, December 31, 2020).
Assessing the biological effectiveness of the Plan in achieving a reduction in entanglements has been challenging (Borggaard et al., 2017). This can be illustrated by data from 1990 to 2017, where of the total modeled right whale mortalities, on average only 36% of right whale carcasses were detected annually9 and approximately half of the carcasses had sufficient information to determine the cause of death based on necropsies and other analyses (Henry et al., 2019; Pace et al., 2021). Given right whales ability to carry gear for long distances, in instances where gear is recovered there is significant uncertainty in assigning the location, type and configuration of the gear involved in an entanglement, despite ongoing gear marking requirements starting with the first Plan (62 FR 39157, July 22, 1997). These technical difficulties, coupled with the statistical rarity of observing entanglements for large whales, makes it nearly impossible to assess the biological success of a particular policy instrument within the Plan.
The first Plan limited closures to critical habitat areas and gear modifications were identified as the preferred alternative to minimize economic impacts (62 FR 16519, April 7, 1997: 16531), despite the uncertainties regarding the effectiveness of these modifications. In response to high levels of serious injury and mortality, regulations were temporarily implemented in 1997 to seasonally manage lobster gear, and later made permanent. Lobster gear was prohibited in Great South Channel (April 1–June 30) while modified lobster gear could be used in Cape Cod Bay (January 1–May 15) (50 CFR 229.30). A limit on floating buoy lines and the need to select modifications from a list of options applied to almost the entire U.S. lobster fishery and changed over the years.
Both the Seasonal Area Management (SAM) and DAM programs were implemented in 2002 as part of the second amendments to the Plan. The SAM program (67 FR 1142, January 9, 2002) included additional gear restrictions for two temporally and spatially static areas (Figure 3, solid gray area) defined by historical north Atlantic right whale aggregations (Merrick et al., 2001). SAM West (March 1–April 30) and SAM East (May 1–July 31) zones required sinking or neutrally buoyant groundline and a single buoy line per trawl in addition to the sinking or neutrally buoyant buoy line and weak links required more broadly.10
The DAM program was a complement to the SAM program (67 FR 1133. January 2, 2002) (Figures 2, 3, hatched area). The program operated year round in U.S. waters north of 40°N with restrictions for each individual zone to be in place for 2 weeks, unless extended or removed. The implementing regulations laid out criteria for when a DAM zone would be triggered, how the size of the zone would be determined and the process for notifying fishers of the DAM zone and requirements. The ex-ante regulatory analysis of mandatory gear removal in DAM zones estimated forgone lobster revenues of $3.2M (US$2000, or $4.1M US$2012) for the first year (National Marine Fisheries Service (NMFS), 2001). Within the regulation, however, authority remained with the NOAA-Fisheries administrator to determine on a case-by-case basis if an area would be subject to a mandatory or voluntary closure. Of the seven DAM zones implemented between April 1, 2002 and September 25, 2003, only one mandated gear removal while the others were notices for voluntary removal of gear (Figure 2, hatched areas).
As an alternative to gear removal in the DAM zone, the NOAA-Fisheries administrator could determine if gear with specific modifications could be allowed to fish in the zone. In September 2003, a standardized list of acceptable gear requirements became available for use in DAM zones (68 FR 51195, August 26, 2003). Gear that did not meet the requirements was to be removed within two days of the publication in the Federal Register of a notice of a DAM zone. The gear specifications were required no matter where the DAM zone was identified unless more restrictive requirements were in place; for example, the Great South Channel critical habitat closure would prevail over DAM gear requirements. The gear specifications identified for use in DAM zones in 2003 followed those for SAM areas with the exception that an additional buoy line was allowed in the DAM zones, meaning SAM requirements were considered more restrictive. The ex-ante regulatory analysis to allow use of modified gear in DAM zones was estimated as $31,100–$93,700 (US$2002 or $38,400–$115,600 US$2012) for the fleet (National Marine Fisheries Service (NMFS), 2003).
In April 2009, amendments to the Plan ended the SAM and DAM programs (73 FR 51228, September 2, 2008), and marked the next step in implementation of the management strategy identified in 2003. Broad-base gear modification requirements for the gillnet and trap/pot fisheries, over much of the United States Atlantic coast from Maine to Florida, became effective year-round in the northeast and seasonally in other areas (Borggaard et al., 2017). Amendments in 2014 and 2015 focused on reducing risk from vertical line, as well as expanded gear marking requirements and time and area closures (Borggaard et al., 2017).
Materials and Methods
Assessing the performance of policy instruments for right whale protection requires an understanding of the spatial-temporal density of the whales and fishing effort in the management areas to assess the risk of entanglement. We compare dynamic (i.e., DAM zones) and static (i.e., SAM zones and Cape Cod Bay critical habitat) and closed (Great South Channel critical habitat) right whale management areas, to the remaining “open” area, in U.S. waters north of 40 degrees N latitude to The Hague line with Canada, an area of approximately 176,400 km2.
In the “Data” section we present the data on the NOAA-Fisheries aerial surveys used to trigger the DAM zones, commercial lobster fishing data, and right whale data. The “Methods” section describes the methods used to calculate a RREI, and an illustrative optimization closure model under two management decision rules, a management objective based strictly on benefits (“benefit-ranking”) vs. an objective that simultaneously considers costs and non-monetized benefits (“cost-effectiveness”). Additional scenarios then consider implications of the use of whale-modified-gear and non-compliance.
Data
The temporal scale for all data are at the month level for April 2002 to March 2009, the period in while the DAM program was active. ArcGIS software is used to establish a standardized coordinate system to produce an initial 20 km2 vector grid of the data (see Supplementary Section 1).
Data for Detecting and Implementing a DAM
The North Atlantic Right Whale Sighting Survey, a NOAA-Fisheries aerial survey program, provided real-time data to NOAA-Fisheries managers to determine if and where to trigger a DAM. The Survey locates and records the seasonal distribution of right whales off the northeastern coast of the United States (Khan et al., 2010). The goal of each flight is to identify locations of large aggregations of right whales. After each flight, the sightings data were used to determine whether the density of right whales was above the threshold to trigger a DAM (i.e., 0.04 right whales per nm2). If the density threshold was reached, the survey team notified the Greater Atlantic Regional Fisheries Office. The Regional Office was responsible for issuing a Federal Register notice to notify the public, the fishing industry in particular, that a DAM zone was to be implemented. The notification included whether the DAM was voluntary or mandatory, the location coordinates, any specific conditions (e.g., gear requirements), and the start and end date of the DAM zone requirements. The Greater Atlantic Regional Fisheries Office provided the authors the notice details for each DAM zone, along with the GIS shape files for all right whale management areas, including critical habitat, SAM and DAM zones (Figures 2, 3). Roberts et al. (2016) incorporates these data from the North Atlantic Right Whale Sighting Survey in the density map estimates discussed below. The recorded NOAA aerial survey flight track line data were assigned to the 20 km2 vector grid (see Supplementary Section 1).
The aerial survey data are the primary source for detecting potential DAMs and are considered an important element of the overall performance of the DAM program. We are interested in measuring the sampling coverage, the actual number of flight-days per year compared to the number of flights required to sample the Bay of Fundy/Gulf of Maine water body for each of 365 days of the year. A bare-bone survey without any fly-backs over areas (C. Khan, pers. comm., August 2020), would require 2,920 flight-days (=8 simultaneous flights per day for a one-day-snapshot × 365 days) to have 100% sampling coverage (Palka, 2012).11 The annual and temporal frequency distribution of flights can shed light on how well U.S. waters were sampled to detect DAMs and therefore provide additional right whale protection beyond the static right whale management areas.
Right Whale Data
For the United States Atlantic and Gulf of Mexico, Roberts et al. (2016) integrated 23 years of aerial and shipboard cetacean surveys, linked them to environmental covariates obtained from remote sensing and ocean models, and built habitat-based density models for 26 species and 3 multi-species guilds using distance sampling methodology. The density maps for these regions are the first to be published in the peer-reviewed literature. We use the monthly right whale density maps supplied by Roberts et al. (2016) to quantify the total right whale population within our spatial-temporal strata (Wta for month t, area a). The aggregate monthly data are static across years and are based on survey effort from 1998 to 2017, and therefore they do not represent the density of whales in a given area in a particular year (Roberts et al., 2016; Center of Independent Experts, 2019). The right whale density map data was converted to the 20 km2 vector grid, consistent with the aerial survey track lines.
Commercial Fishing Data
Data from several sources were used to provide an overall estimate of the spatial distribution of lobster fishing trips. In the northeast United States, NOAA-Fisheries collects VTR; these records identify northeast “lobster trap/pot” fishing trips. This is the only source for trip locations. For each trip (i.e., the “raw” data), a single location point is recorded to represent the place where the most hauls occurred for a trip. NOAA-Fisheries also collects first-point of sale data for federally managed fish from entities that buy fish directly from federally permitted fishing vessels; these data are referred as “dealer” data and include value and volume but do not include trip location. The Atlantic Coastal Cooperative Statistic Program collects “dealer” data for state permitted vessels and shares these data with NOAA-Fisheries. The NOAA-Fisheries “dealer” data used in this analysis includes both federal and state landings data. A common variable across all datasets is port of landing and weight of catch. The NOAA-Fisheries Greater Atlantic Regional Office’s vessel permit database identifies federally permitted vessels’ physical characteristics, such as horsepower, length and gross registered tons. We use the Atlantic Coastal Cooperative Statistic Program as an additional source of information to identify vessel characteristics for state permitted vessels.
We assume the NOAA-Fisheries dealer data are a census of lobster landings and VTR data are a subset of these data. The 2002–2009 NOAA-Fisheries dealer data contains roughly 94–100% of lobster landings as reported by the Atlantic State Marine Fisheries Commission (2018). Trips recorded in the VTR are used to spatially allocate dealer landing not recorded in the VTR to six different port groups (see Figures 2, 3 for location of port groups). This provides data to estimate the overall spatial and temporal distribution of trips for the American lobster fishery.
In 2002, the NOAA-Fisheries dealer data indicated that northern and southern Maine combined landed approximately 66% of the total lobster weight (Table 1) while 34% was landed by the remaining southern port groups. The distribution was similar in 2009. The share of total lobster landings reported in the VTR ranged from high of 99–100% in New Hampshire to a low of 6–7% in northern Maine. Trips from northern Maine were largely allocated to the open area, as the majority of right whale management areas are adjacent to southern ports (Figures 2, 3). Since exclusion of northern Maine data would provide an incomplete picture of the scale and distribution of fishing trips within the lobster fishery, we include northern Maine dealer data despite the low VTR reporting rates.
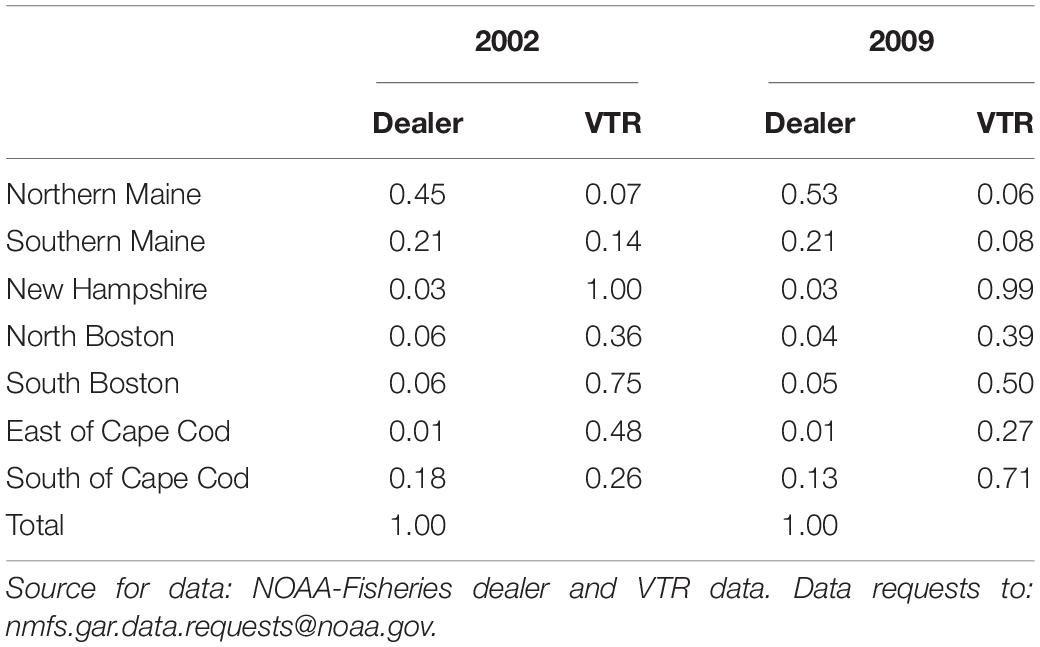
Table 1. The distribution by port group of total lobster landings (dealer), and the percent of landings for that port group in the Vessel Trip Report (VTR).
The large difference in VTR coverage by port groups would allow for finer spatial resolution for some (e.g., New Hampshire) port groups but not others (e.g., northern Maine). To accommodate this difference in data resolution, the spatial stratification chosen for fishing areas is at the level of right whale management area (i.e., dynamic, static, closed) and open (i.e., remaining area with general lobster gear requirements). Trip, the decision point for every harvester, is our unit of fishing effort for this analysis. We estimate trips by year y, month t, port group p, and fishing area a for each year; we then sum over port groups to estimate fishing effort, Eyta. Fishing area a is either a dynamic, static, closed or open management area. Details on Eyta calculations can be found in the Supplementary Section 2.12
In the northeast, the total number of lobster trap/pot fishing trips ranged between 210,320 and 284,951 between 2002 and 2009, using the combined VTR and Dealer data (Table 2). Total landings range between 32,603 and 45,026 metric tons, while revenues range between $324.4M and $457.1M (US$2012). New Hampshire and north Boston port groups fished as much as 6.6 and 6.2% of their annual lobster trips in right whale management areas in later years, respectively. See Supplementary Table 2 for the total number of fishing trips by port group and the percent of trips in right whale management areas.
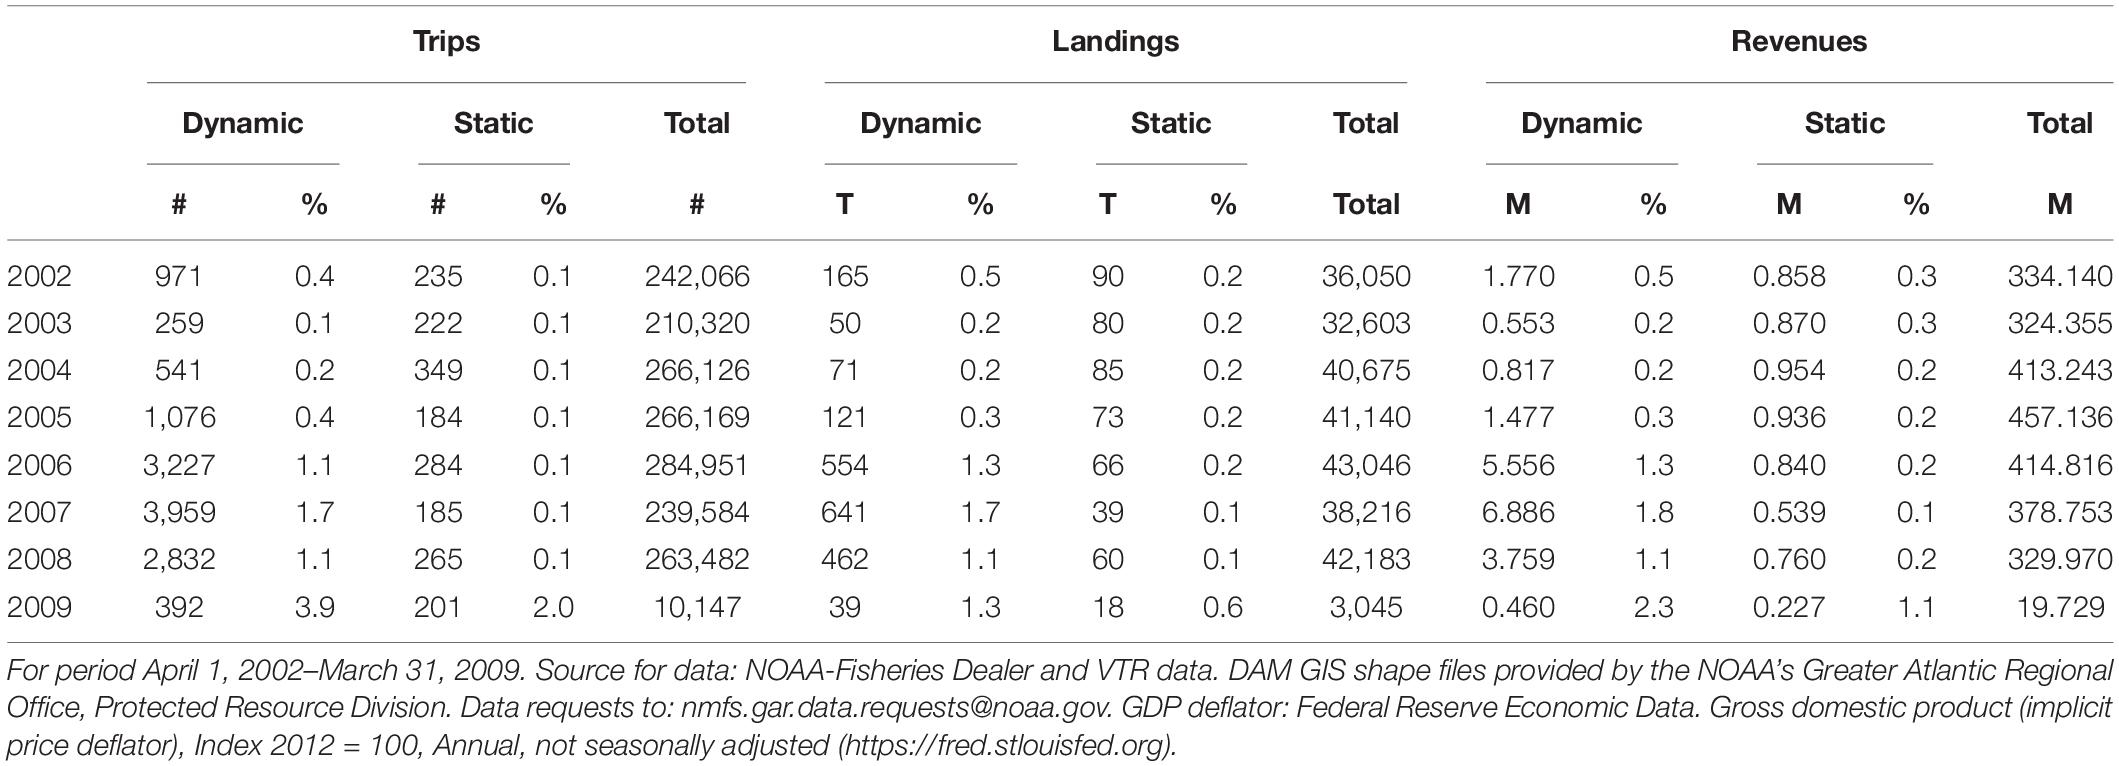
Table 2. Total trips, landings (metric tons) and landed value (revenues in millions of US$2012) and percent of total for the Dynamic Area Management (DAM) zones, the static whale-modified-gear areas and for entire area north of 40-degree north latitude from shore east to the Exclusive Economic Zone.
Methods
A relative risk of entanglement index (RREI) is calculated to allow spatial-temporal comparisons of potential non-monetary benefits of right whale management areas between 2002 and 2009. We develop an optimization model using closures to compare the cost frontier for alternative management decision rules (benefit-ranking vs. cost-effectiveness) to reduce the risk of entanglement.
Estimating Risk of Entanglement
Entanglement risk is jointly determined by the co-occurrence of gear and whales in the water in time and space, and the potential impact of the gear on whales. Following from others (Wiley et al., 2003; Vanderlaan et al., 2011; Farmer et al., 2016; Brilliant et al., 2017), we use fishing effort and whale presence within an area to develop a risk of entanglement. We measure whale presence in terms of number of whales per grid cell (20 km2) based on Roberts et al. (2016). Comparisons are made between right whale management areas (static and dynamic) and the open area.13
The risk of entanglement (RE) is the product of the number of whales and the density of trips. We use trips as a first proxy for vertical lines in the water.14 An important risk factor is gear lethality (Vanderlaan et al., 2011), although there is no scientific data to support parameter estimates of the impact on whales of alternative gear designs. Thus, for this first estimate of risk, we assume a homogenous gear configuration within a given time and area, such that the relationship between trips and lines is exact. The density of fishing trips is used as a proxy for the likelihood of a whale interaction with gear, where density is the number of trips divided by the total km2 for the relevant area (), y is year, t is month, and a is area. We assume “a single line” in the water in different times and areas presents the same level of risk to whales.15 In Roberts et al. (2016) monthly whale numbers, W_t are constant, however, the spatial temporal placement of DAM zones varies over the years resulting in a change in the number of whales (Wyta) within a zone, as well as fishing effort (Eyta). The distribution of trips and whales is assumed uniformly distributed within a stratum. Here we estimate a risk of entanglement (REyta) for any time-area, by assuming it is proportional to the product of the number of whales at risk (Wyta) and the likelihood of a whale interaction ().
To make comparisons between management areas which differ in size, a RREI is calculated. The RREI is normalized 0–1, to the maximum REyta, the open area in July 2006 (i.e., RREIyta = REyta/RE2006,07,open). This provides a relative measure between months and areas against this base. Changes in the RREI provide a consistent proxy for the potential non-monetary benefits of risk reduction of alternative right whale management measures.
Reducing Risk Under an Optimization Framework
The optimization closure model minimizes a management objective, subject to a set of constraints, and is solved using the R package “lpSolve” version 5.6.15 (Berkelaar, 2020). Two management decision rules are considered, one based strictly on non-monetized benefits (“benefit-ranking”) and the other which considers costs and non-monetized benefits simultaneously (“cost-effectiveness”). For this illustrative model, a representative year was generated by averaging monthly data across years for number of whales (Wta)and trip density (for the risk calculation, creating an average risk profile for each month and management area type, which is assumed exogenous. While the size of fishing areas vary, size is implicitly imbedded in the calculation of cost and risk.16
The expected non-monetary benefit of a closure is a reduction in entanglement risk (REta), which is a function of density of fishing trips and whale numbers. The required level of overall risk reduction () is exogenously determined based on legal mandates (e.g., MMPA and ESA). Risk is reduced along a continuum between no expected change (i.e., Status Quo: ) to a complete reduction in risk (e.g., complete closure: ). This allows us to trace out a cost frontier. More formally, let xta be the control variable. A complete closure (xta = 1) or partial closure (0 ≤ xta < 1) directly reduces fishing effort with an opportunity cost (cta) to fishery participants.17 We assume fishing effort does not shift to other times or areas.18 Mathematically our model is:
where ; 0 ≤ xta ≤ 1 (0 is open and 1 is fully closed); 0 ≤ αa ≤ 1; 0 ≤ βa ≤ 1.
We include a measure of the efficacy of whale-modified-gear (αa) in reducing the risk to right whales where 1.0 indicates the whale-modified-gear is 100% effective at reducing the impact on the whale (e.g., rope-less gear) and 0.0 indicates that there is no change in the impact on the whale and thus risk is not reduced (i.e., no whale-modified-gear).19 The rate of non-compliance (βa) can also impact the efficacy of the whale-modified-gear. The net entanglement risk for a given time and area is (REta)(αa)(1 – βa).
In scenario 1 (“benefit-ranking”), a decision to close a fishing area is based exclusively on the non-monetary benefits of a reduction in entanglement risk. The objective is to minimize the number of closures (cta = 1) while simultaneously meeting the risk constraint (). Under scenario 2 (“cost-effectiveness”), a decision maker is interested in minimizing the opportunity costs to the fishing industry (cat) while also meeting the risk constraint (). For these two scenarios we assume closing an area eliminates risk of a gear-whale-encounter (αa = 1) and there is zero non-compliance (βa = 0, i.e., full compliance). We then investigate in Scenario 3 the impacts of closures when gear-modifications (α) are already in place and non-compliance (β) is zero (Table 3). In the absence of data on the efficacy of whale-modified-gear, we assume the required gear modifications in dynamic and static areas are more effective (i.e., assume αdynamic and αstatic both equal 0.9) compared to the general gear requirements in the “open” area as described in the “Measures to Reduce Right Whale-Fisheries Interactions” section (i.e., assume αopen = 0.45).20 Scenario 4 then considers non-compliance with whale-modified-gear requirements that is greater than zero (β = 0.6). In scenarios 3 and 4, the gear efficacy and non-compliance assumptions result in risk reductions occurring prior to running the optimization closure model. The cost frontier illustrates the total cost to industry compared to the total non-monetary benefits of a reduction in risk along the continuum between no expected change to a complete reduction in risk, for each of the four scenarios.
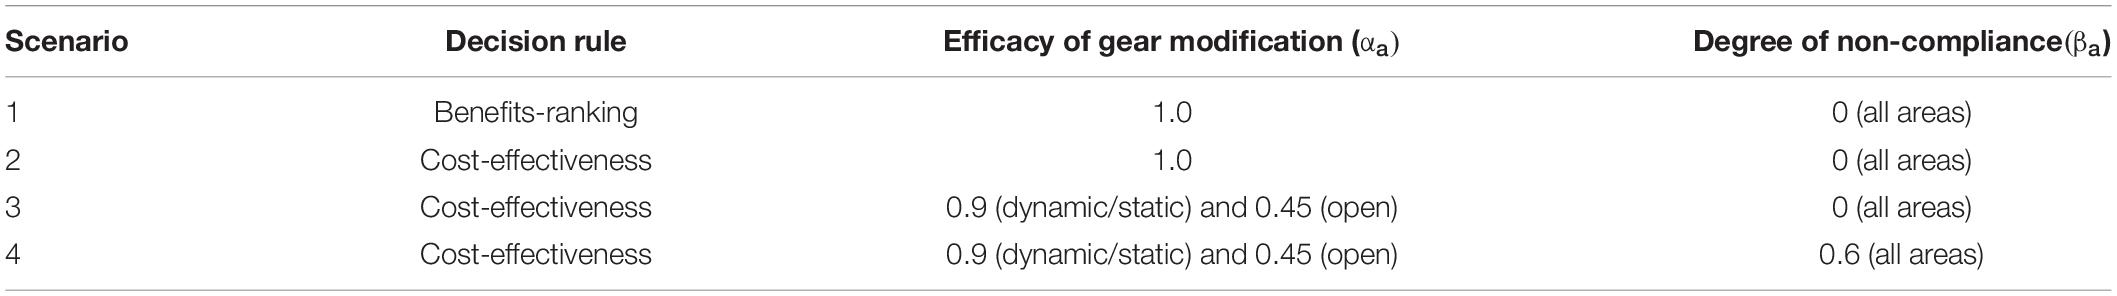
Table 3. Criteria for management decision rules in optimization framework, by scenario (Eqs. 1 and 2).
Results
Public Sector: Detecting and Implementing DAMs
The degree to which DAMs could provide a reduction in risk to right whales was dependent on public investment in detection and the regulatory requirements for implementation. Of the 589 flight-days between April 2002 and March 2009, the NOAA North Atlantic Right Whale Sighting Survey detected right whale aggregations that triggered 66 DAMs with an average annual detection rate of 11% (=66/589) (Table 4). Between 2002 and 2007, the annual DAM detection rate increased from 4 to 25%.21 From a seasonal perspective, flights in November to March had the highest DAM detection rates; yet the frequency of flights was greatest from April to June.
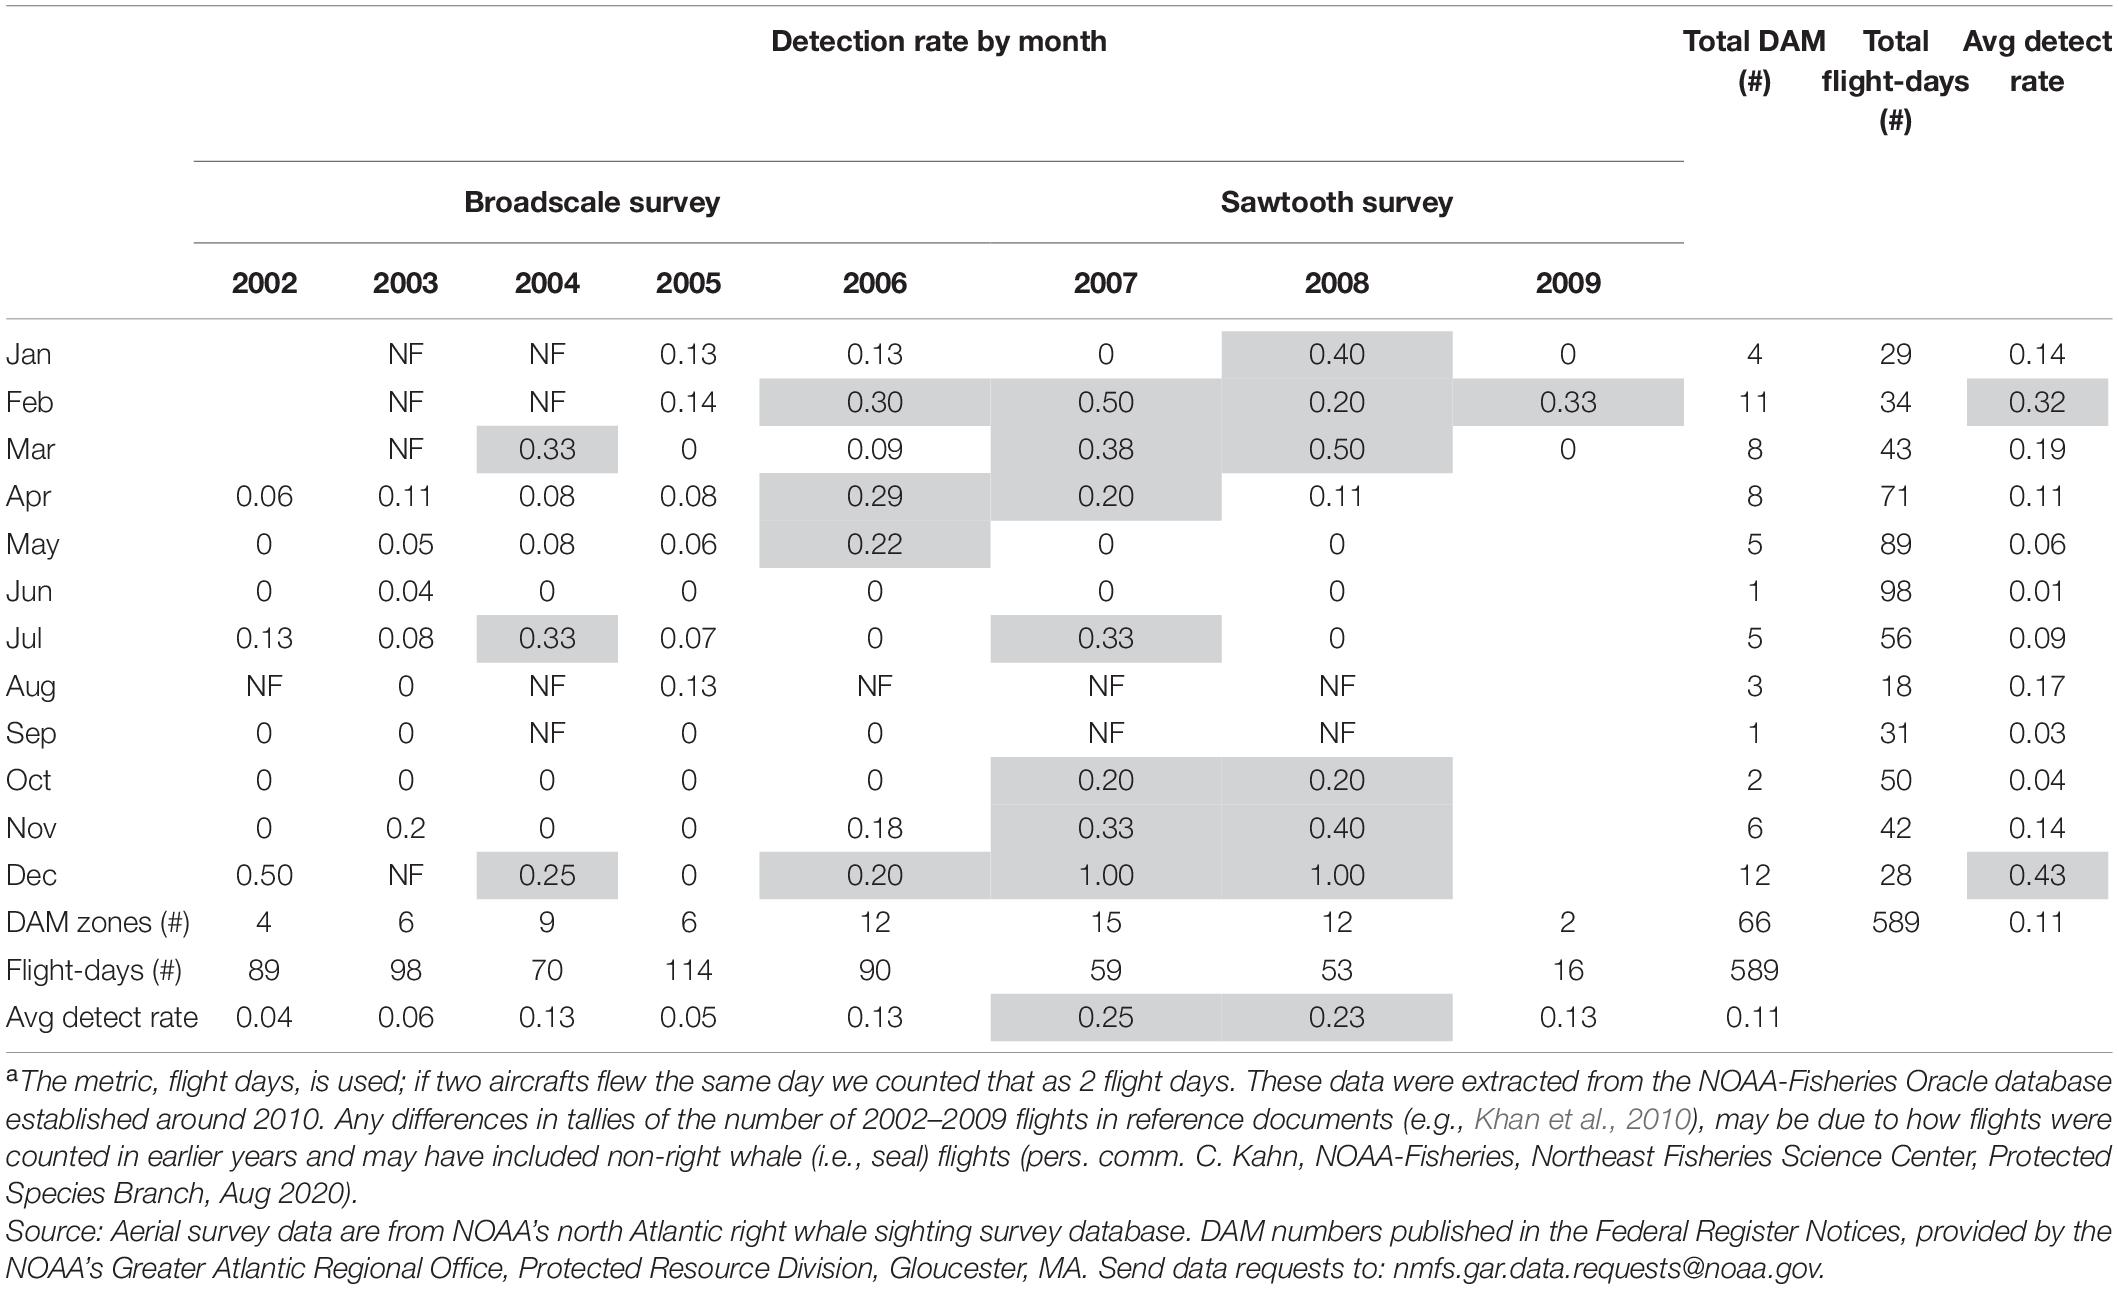
Table 4. The Dynamic Area Management (DAM) detection rate (=No. DAMs/No. flight-days) for broadscale and sawtooth survey methods by year and month. The total number of DAM zones triggered, North Atlantic Right Whale Sighting Survey flight daysa and average detection rate (avg detect rate) across years and months. Shaded areas show detection rates of 20% or greater and NF = no flights.
The detection of DAM zones, designed to provide protection for large aggregations of right whales, was influenced by the sampling frequency. The aerial survey team flew 84 flight-days a year on average between 2002 and 2009 (Table 4). Approximately 2.9% of the water was sampled on average in a year, based on the ratio of actual flight-days to number of flights required for 100% sampling (=84/2,920 flights).22 Sampling varied by month. In May, the month with the largest percent of the population present in northeast U.S. waters (Roberts et al., 2016), on average they sampled roughly 5.1% [=89 flights/7 years)/(8 flights/day × 31 days)] of the grid.
The speed at which a DAM can be implemented impacts its effectiveness in delivering right whale protection. The number of days it took to implement the DAM (12.8 days, CV = 0.21) was only slightly less than the number of days the DAM was in effect (14.9 days, CV = 0.25). Over the history of the DAM program, it took an average of 7.7 days (CV = 0.36) from the day the DAM was triggered based on the date of the aerial survey, to the publication of the federal register notice. It took an additional 5.2 days (CV = 0.38) on average, between the published Federal Register notice and the first day the DAM measures were implemented, as described in the notice. The data were insufficient to determine whether whales were still present during the implementation period (i.e., 12.8 days after trigger); flights over DAM zones after implementation were too limited to calculate any statistics.
Right Whale Management Areas and Distribution
The right whale density maps (Roberts et al., 2016) indicate that more than 50% of the right whale population was in U.S. waters between November and June (Figure 4, stacked columns). The largest share of the total population is in the southeast United States during fall-winter (November to February), in the northeast United States in the spring (March to June) and outside U.S. waters in summer-fall (July to October).
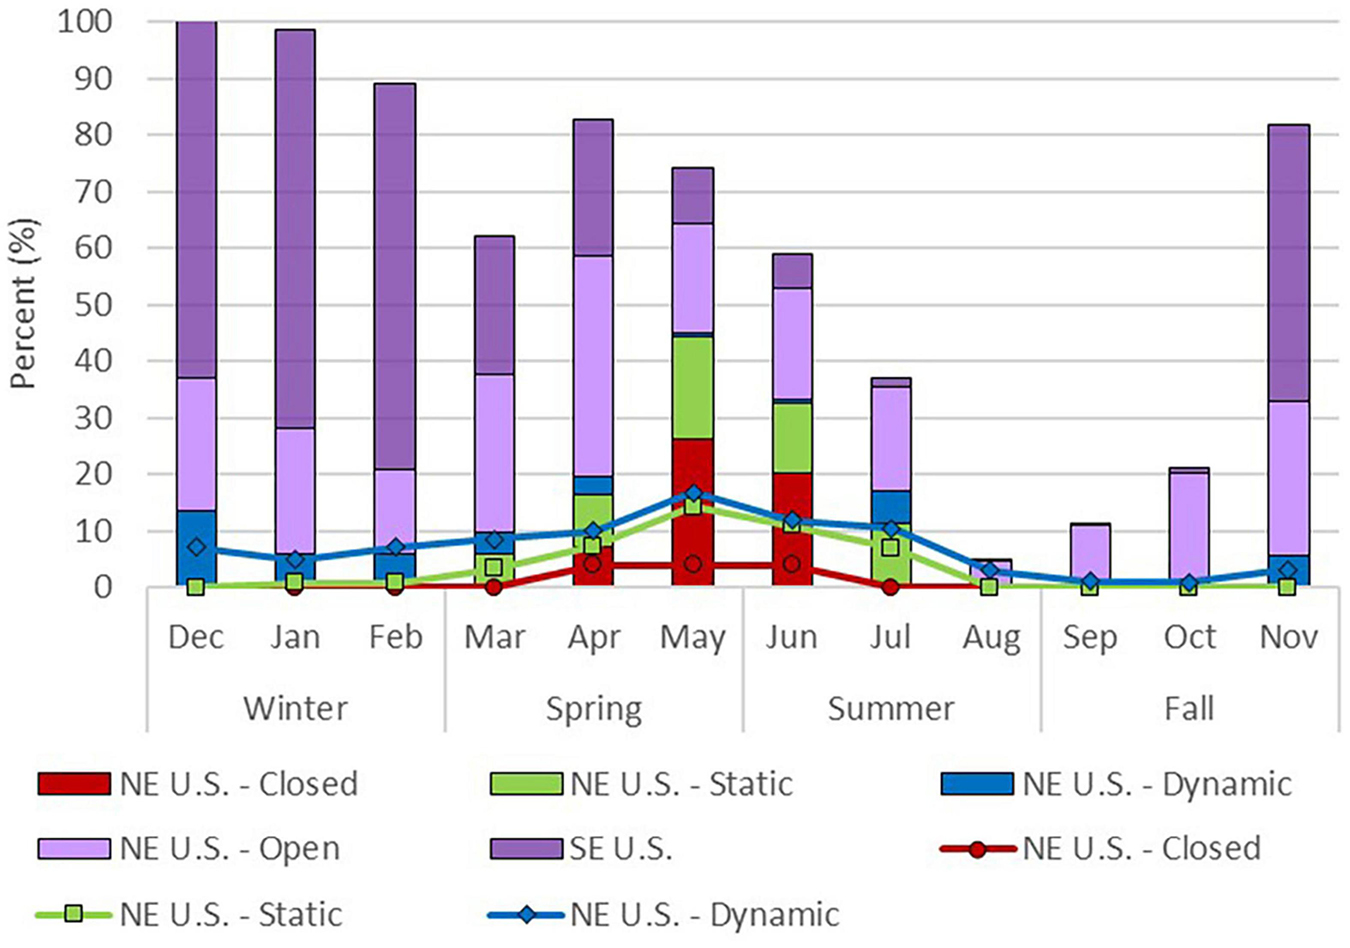
Figure 4. The spatial temporal distribution of right whale population estimates (stacked bars) are compared to the share of northeast (NE) waters (stacked lines) dedicated to right whale management areas (April 2002–March 2009). Distribution of the right whale population in U.S. waters by month (stacked columns) and northeast right whale management areas including dynamic (blue), static (green), closed (red), and outside northeast management areas (i.e., open, light purple), as well as southeast (SE) waters below 40 degrees N latitude (dark purple). As much as 95% of the population estimates (August) based on Roberts et al. (2016) are not in U.S. waters; these shares unaccounted for may be in Canadian waters. In addition, the share of northeast ocean waters north of 40 degrees N latitude (stacked lines), monthly average, shows shares by right whale management area including dynamic (blue), static (green) and closed (red); remaining northeast waters are classified as “open.” At the maximum, 17% of northeast waters are dedicated to right whale management in May on average.
Right whale management areas were spatially a small share of U.S. waters north of 40°N (Figure 4, stacked lines), yet a significant share of the right whale population was present in the management areas (Figure 4, stacked column). In May for example, on average 17% of the northeast area waters was dedicated to right whale management areas: 4% was closed to lobster fishing (i.e., Great South Channel), 10% was in static areas, and 3% in dynamic areas (Figure 4, stacked lines). During the same month, of the total right whale population, 26% was in the closed area (Great South Channel critical habitat), 18% in the static areas, 1% in dynamic areas, 19% in open northeast waters and 10% in the southeast waters (Figure 4, stacked columns). May is an example month where both avoidance and minimization strategies complement each other, and may have provided protection to 45% of the total population or 70% of the population in U.S. waters north of 40°N.23
Fishing Effort and RREI
The DAM program may have created an economic incentive to whale-modified-gear to continue fishing in a DAM zone after it was triggered; this inference is based on increased fishing effort in DAMs, frequency of DAMs, and spatial overlap of zones. Between 2003 and 2008, years with complete data, the number of DAM zones varied from 6 to 15 with the maximum in 2007 (Table 4), and exhibited a high degree of spatial overlap (Figure 3, hatched areas). During this period, the share of total trips in DAMs increased from 0.1% to as high 1.7% in 2007 (Table 2).24 The commercial fishing data show an increase in trips, landings and revenues within dynamic areas over time in both absolute value and share of total. Compared to dynamic areas, activity in static areas was lower, despite their larger spatial extent, and effort was more consistent. Much of the area within the static areas (e.g., Figure 3, SAM East) is farther offshore in federal waters compared to the location of dynamic areas, so fewer vessels would be able to access these fishing areas.
The potential for dynamic areas to mitigate risk was highest in November to February (Table 5). Risk in dynamic areas accounted for 27% of the average risk for December, which may have been mitigated with whale-modified-gear, a minimization strategy in the mitigation hierarchy. The total average monthly RREI was highest in the fall (Sept-Nov) followed by the summer (Jun-Jul) (Table 5 and Figure 5 dashed line). Yet the percent of the right whale population present in the northeast is highest in the spring, from March to July (Figure 5 solid line), signaling the influence of fishing effort in risk (Figure 5 stacked bars). In some months, such as May and August the RREI value is equivalent, while the number of lobster trips (Figure 5 stacked columns) and the percent of right whale population present (Figure 5 solid line) have an inverse relationship.
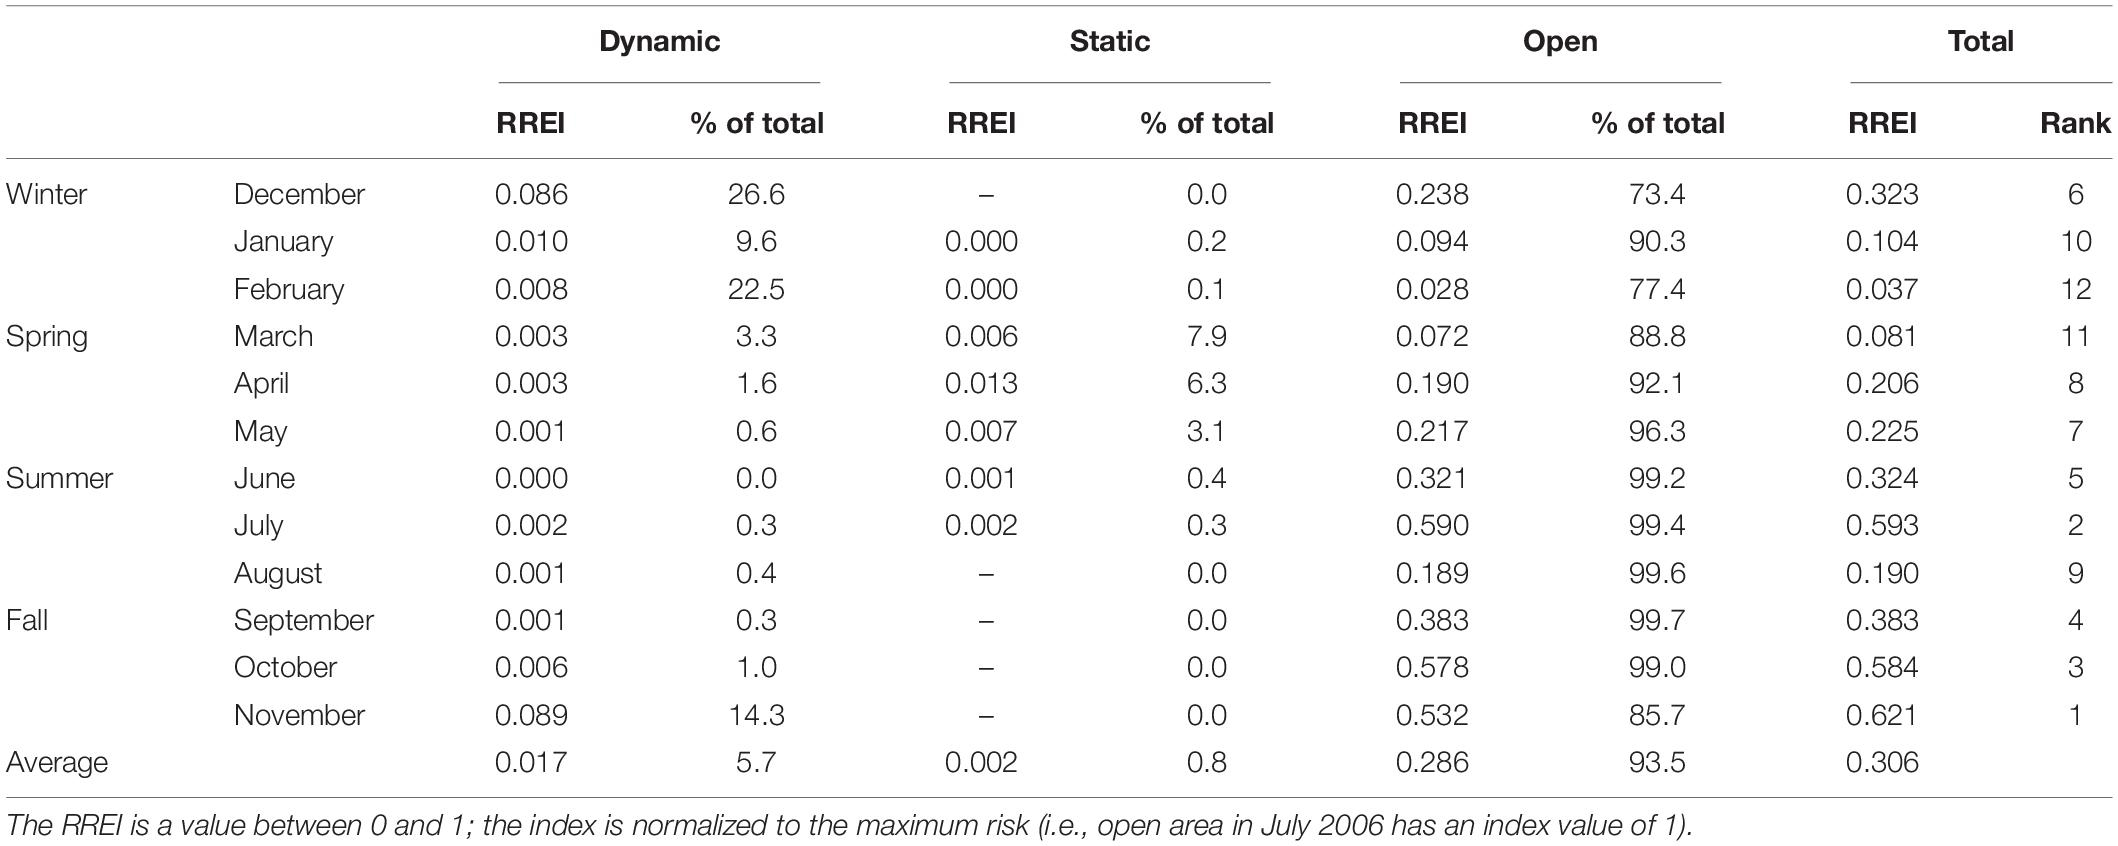
Table 5. Average monthly Relative Risk of Entanglement Index (RREI) for dynamic and static whale-modified-gear management areas, open areas, and total for the area north of 40-degree north latitude from shore east to the Exclusive Economic Zone, for April 2002 to March 2009.
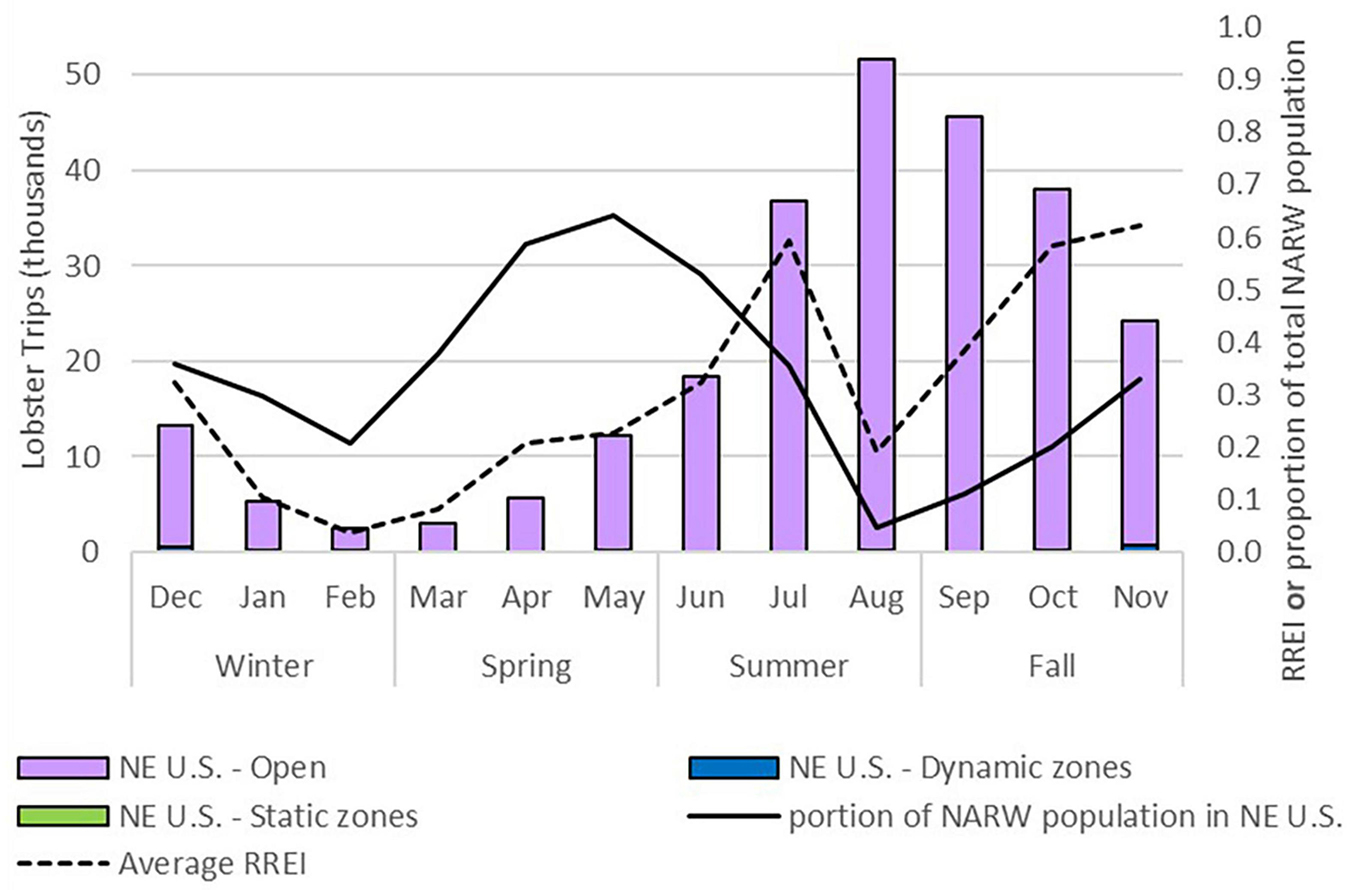
Figure 5. Spatial temporal distribution in the northeast U.S. waters of the percent of the north Atlantic right whale population present (solid line, right axis) (Roberts et al., 2016), lobster fishing effort (trips, stacked columns, left axis) and the average relative risk of entanglement index (RREI, dashed line, right axis) by month (April 2002–March 2009). The average number of trips are by right whale management areas. The RREI is a consistent, relative measure of risk between areas and months with a value between 0 and 1; the base is the “open area” in July 2006 which has an index value of 1.
Optimization: Reducing Risk at Lower Cost
The optimization results illustrate how different decision rules can attain equivalent non-monetary benefits of risk reduction with different opportunity costs to industry.25 Costs are consistently lower under the “cost-effectiveness” decision rule (scenario 2) as compared to the “benefit-ranking” decision rule (scenario 1) except for the two extreme endpoints (Figure 6 solid lines). For example, under the “benefit-ranking” decision rule a 60% reduction in risk results in a cost of roughly 60% of average revenues vs. 40% of revenues for an equivalent reduction in risk under the “cost-effectiveness” rule. The solution paths also differ (Table 6) in how the 60% risk reduction is achieved. For example, under the “benefit-ranking” rule four to five big open areas with high risk are the first to close. In contrast, under the “cost-effectiveness” rule, 20 smaller static and dynamic areas are closed, as these areas have a lower ratio of cost to non-monetary benefits (Table 6). Each unit of risk reduced was achieved at a lower cost under the “cost-effectiveness” rule (Figure 6). Consider May and August where total risk is somewhat equivalent (Figure 5 and Table 5). Clearly the cost to reduce a unit of risk is much higher in August (low whales and high fishing effort) compared to May (high whales and low fishing effort). This leads to May being closed before August in all scenarios.
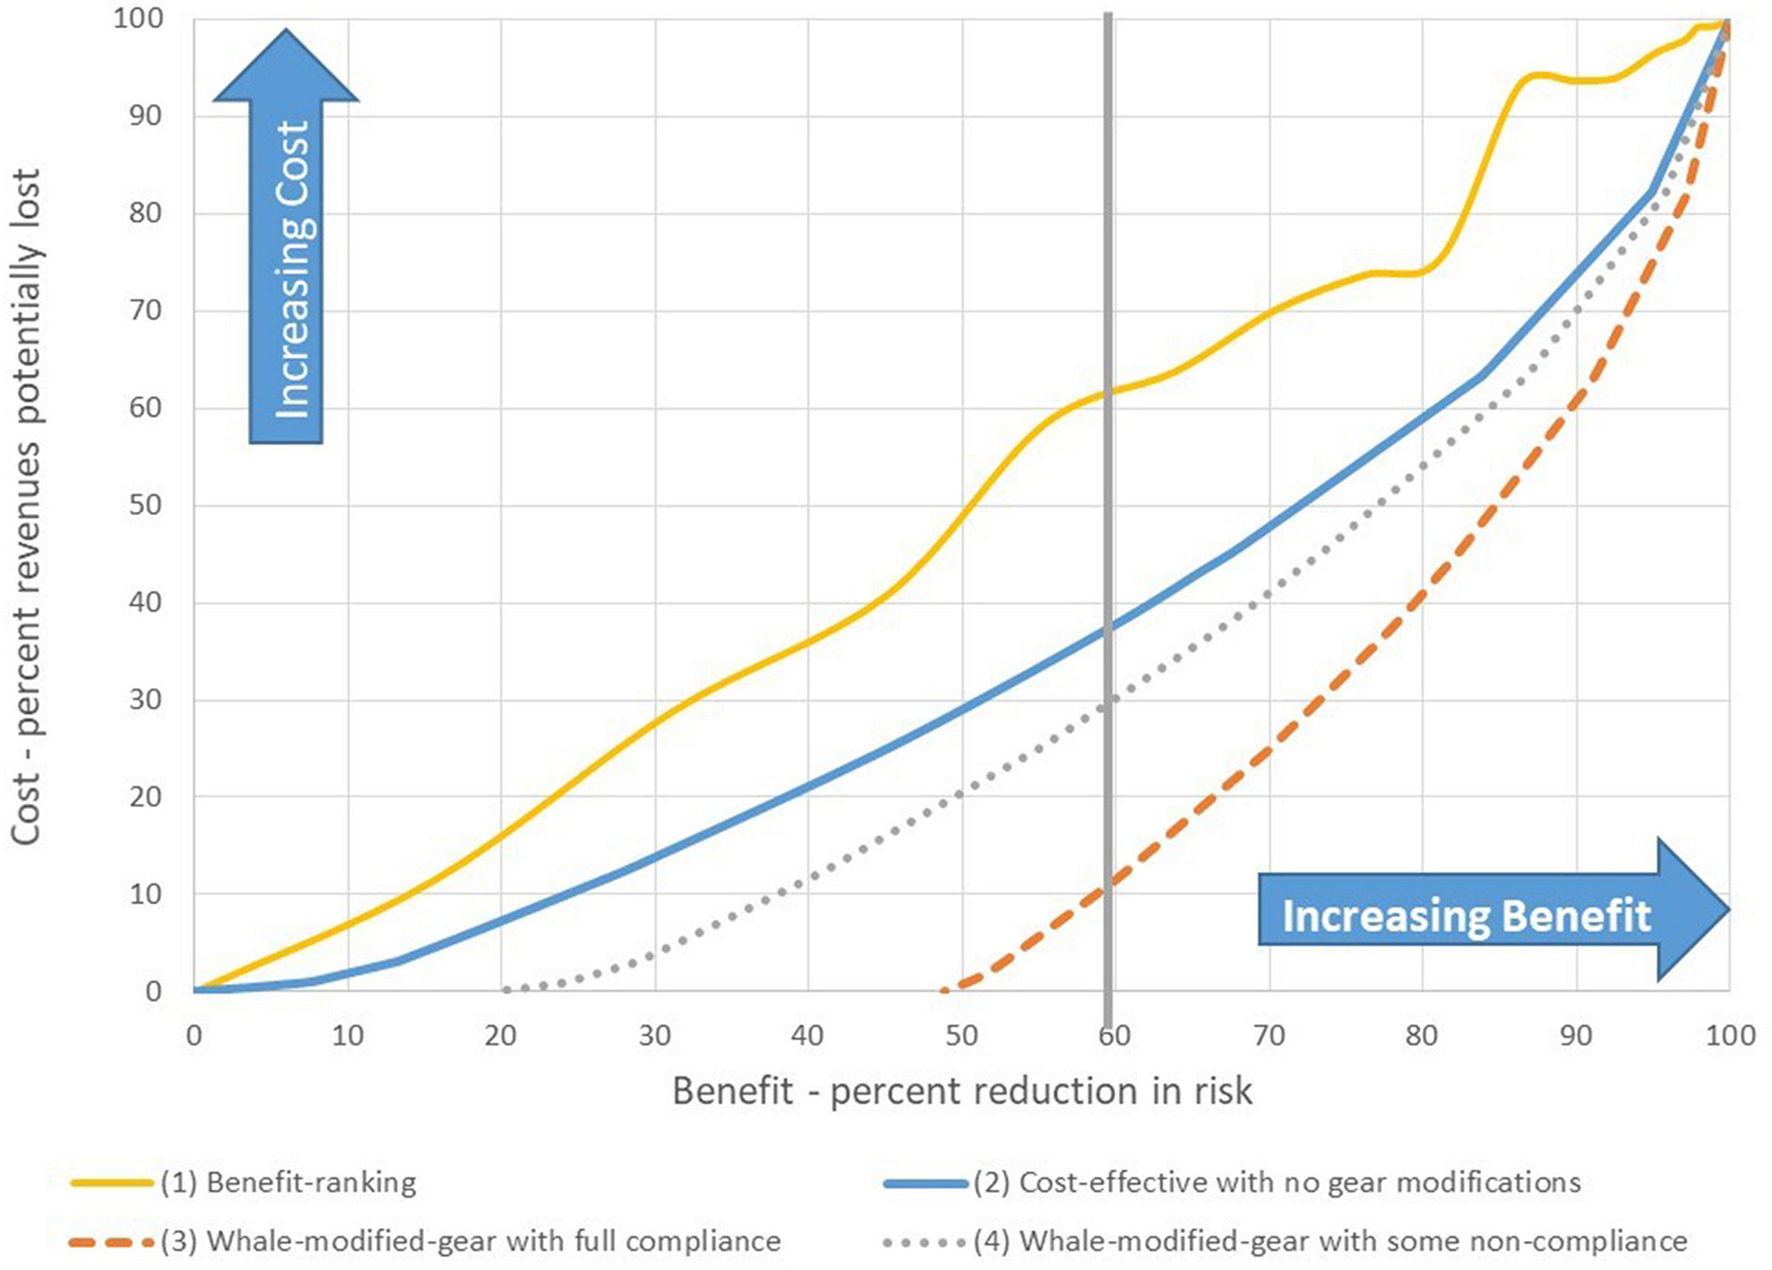
Figure 6. Optimization results of trade-off between the non-monetary benefit of risk reduction and potential cost of closing months and areas (i.e., avoidance) along a continuum of no change (i.e., status quo, ) to a complete reduction in risk (i.e., complete closure, ). Scenarios (Table 3) include: (1) benefit-ranking with no gear modifications, (2) cost-effectiveness with no gear modifications, (3) cost-effectiveness with whale-modified-gear requirements and full compliance, and, (4) cost-effectiveness with whale-modified-gear requirements and some non-compliance.
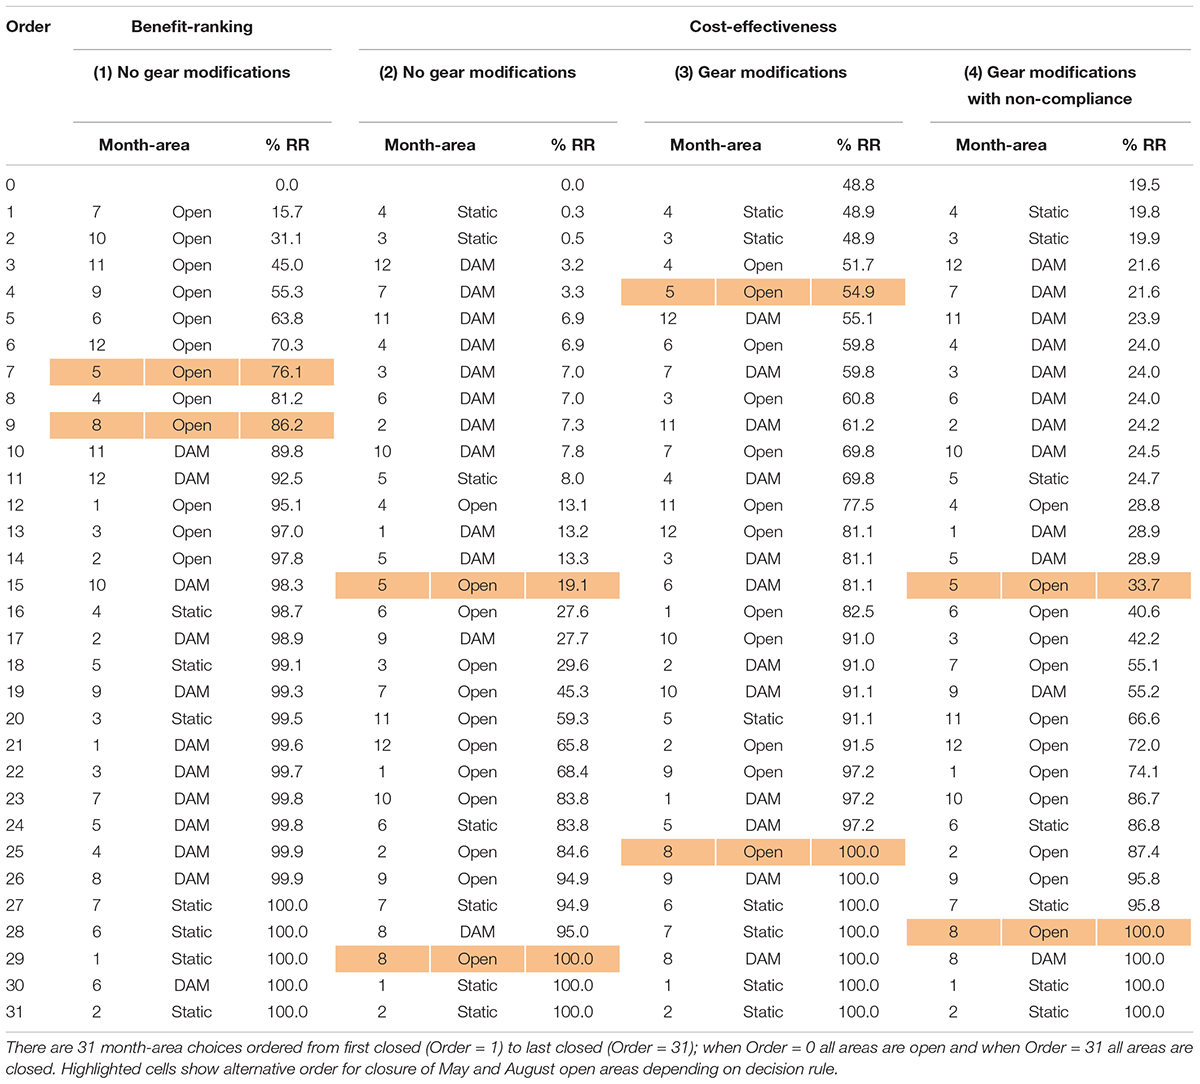
Table 6. Optimization results showing the solution paths with the cumulative percent reduction in risk (% RR) moving from no change (i.e., status quo, ) to a complete reduction in risk (i.e., complete closure, ) for scenarios 1–4.
Continuing with the “cost-effectiveness” decision rule, we introduce whale-modified-gear (scenario 3), a minimization step in the mitigation hierarchy. By requiring fishermen to use whale-modified-gear and given our gear efficacy assumptions (Table 3), the risk of entanglement is immediately reduced by 50%, prior to any closures and assuming full compliance (scenario 3), but by only 20% in the case of non-compliance (scenario 4) (Figure 6 dotted lines). Under these scenarios, to then reach a total reduction in risk of 60%, requires closure costs equivalent to about 10 and 30% of industry revenues, under compliance and non-compliance, respectively. Our example illustrates that when there is non-compliance there may be an economic incentive to first address the compliance issues with the existing gear requirements, rather than implementing additional measures, such as new whale-modified-gear requirements or closures to achieve the desired risk reduction.26
Discussion
When developing a list of management alternatives, the U.S. marine mammal Take Reduction Team process relies on stakeholder consensus to balance the need to reduce marine mammal takes and implicitly minimize economic impacts on fishermen (Young, 2001). However, the assessment of costs, though informally addressed by stakeholders during the process (M. Asaro, pers. comm. October 9, 2020), are not formally considered until a small set of alternatives is identified and then ex-ante cost-effectiveness or cost-benefit analyses are conducted for regulatory purposes. As the optimization model illustrates, and economic theory predicts, a cost-effective solution can yield a given level of risk reduction for a lower cost than a decision based only on risk reduction. For a 60% reduction in risk from the status quo (Figure 6), the potential costs to reduce risk were as much as 20% lower under a decision rule that considered fishing industry opportunity costs and non-monetary benefits simultaneously (i.e., cost-effectiveness, scenario 2), as compared to a decision rule based only on the benefits of risk reduction (i.e., benefit-ranking, scenario 1). This empirical example highlights the need to integrate economic considerations throughout the management process.
A least-cost implementation approach of the bycatch mitigation hierarchy (Squires and Garcia, 2018; Squires et al., 2018) suggests that combining mitigation steps, such as was done in the Atlantic Large Whale Take Reduction Plan with avoidance and minimization measures, could further reduce economic waste and support optimal conservation when both costs and benefits are considered. Theoretically, it is possible to solve for an optimal mix of policy instruments (avoidance and minimization) which is when the marginal cost between and within mitigation hierarchy steps equates, yielding a least-cost solution for a desired risk reduction. While briefly explored in the optimization (scenario 3), the lack of information on the effectiveness of minimization policy instruments limits the conclusions that could be made. Additionally, we suggest the uncertainty associated with effectiveness of alternative management measures be included formally in the decision framework. We discuss this in more detail in our fifth recommendation.
The DAM program with whale-modified-gear, a minimization measure, was anticipated to be a lower cost alternative than the closure of the DAM zones, an avoidance measure (National Marine Fisheries Service (NMFS), 2003). This could not be evaluated due to voluntary nature of most closures and the short timeframe for the closure-based version of the program. However, the case study did identify a number of strengths of the dynamic program which can assist in the design of future mitigation measures. A major strength was the program’s ability to be a flexible instrument that provided protection in response to inter-annual variability in whale density, as demonstrated by the distribution and frequency of the DAM zones. The dynamic measures may have provided incremental protection during the “shoulder” months (i.e., November to February) prior to the protection provided by static management areas in the spring. The dynamic and static measures combined may have reduced the total risk by 6.5% on average (Table 5), even with their small spatial footprint (Figure 4 stacked lines). There was substantial spatial overlap of DAM zones over the years (Figures 2, 3) and the share of total fishing effort within these zones increased over time (Table 2), suggesting the DAM program did not reduce fishing opportunities. Ongoing aerial surveys were required to ensure that aggregations of whales were detected and protected outside SAM and critical habitat areas. Those surveys are useful for analysis of habitat use, provide important sighting information to the Catalog and Sightings Database, and give valuable support to the disentanglement program (Reeves et al., 2007). The DAM program also proved flexible in responding to a potential safety problem for fishermen, who could be required to remove large quantities of fixed gear on short notice in poor weather (Reeves et al., 2007). By allowing whale-modified-gear and shifting to a minimization measures in 2003 the safety concern was eliminated. And while the DAM program was intended to be a temporary measure while broader gear requirements were designed and implemented (Borggaard et al., 2017), it may have provided an economic incentive for some fishers to convert to whale-modified-gear as the frequency and spatial overlap of DAM zones grew. This in turn would have reduced the cost to implement the broad-based measures in 2009.
Our study highlights some of the challenges and tradeoffs associated with the critical and increased responsibilities of the public sector to implement a dynamic management program (Grantham et al., 2008). While monitoring is required to support dynamic protection measures, such as the DAM program, it is also required for stock assessments, and to assess compliance with, and efficacy of the management measure—all public sector responsibilities. The protection delivered by DAM zones hinged on the United States government budget allocated to the NOAA-Fisheries aerial survey team for right whale detection flights. About 3% of the spatial-temporal Bay of Fundy/Gulf of Maine grid was sampled annually on average, although flights were not consistent spatially or temporally (Table 3). Additionally, return flights (i.e., fly backs) to designated DAM zones were sparse and did not allow an analysis to determine if the whales were still present in DAMs despite the delay in implementation. Further, data to estimate compliance was not available. For other species, such a harbor porpoise, the observer logs provide information to estimate gear efficacy; however, this was not the case for right whales. The Northeast Fisheries Observer Program logs for gillnet and trap/pot fisheries were not modified until 2007 to capture the information required to calculate compliance rates by area for different gear modifications (e.g., weak links) and low observer coverage lead to low sample sizes (National Oceanic and Atmospheric Administration (NOAA), 2012).
To manage the risk, it is critical to recognize the RREI was similar in some months when there were inverse levels of fishing effort and whale presence. While in some months as much as 70% of the population in the northeast may have been protected by the combined right whale management areas (Figure 4), the majority of the risk remained outside these areas and times. Fishing effort and whale distribution need to be considered jointly to reduce risk, the data on both were, and continues to be, a barrier to analysis. For our study, data related issues do limit our ability to evaluate with precision and accuracy the performance of the DAM program and other right whale management areas. However, the results of the optimization model and some general results are invariant of the data issues; this includes conclusions regarding aerial surveys, time to implement the DAMs, temporal distribution of landings and fishing effort, the reduced cost of implementing risk reduction measures to the fishing industry under a cost-effectiveness vs. a benefit ranking decision rule and that most importantly, most of the risk was outside right whale management areas for the study time period. The data related issues we encountered continue to exist (i.e., sparse spatial data for northern Maine and the constant monthly right whale density estimates). Still the lack of data (and ensuing uncertainty) does not take away from the utility of doing this modeling as long as the inherent biases and impacts on results are taken into account. Conservation decisions need to be made now, vs. waiting for new or perfect data. Although, characterizing parameter, process and/or model structural uncertainty could improve information for management decisions (Geary et al., 2020).
A critical input parameter to our relative risk index is fishing trip density. The lowest coverage of VTR trips is for the northern Maine port group, which accounts for almost 50% of landings; this could bias our estimates of risk. To address this issue we chose a larger spatial stratification scale (i.e., right whale management area) to avoid overstating the results or giving the end-user an excessive sense of precision or accuracy. Consequently, most of the trips for northern Maine were allocated to the open areas (Supplementary Table 2). To investigate how these data could bias our observations about the performance of right whale management areas, we tested excluding northern Maine fishing effort.27 The test result suggested right whale management areas would have a greater impact on reducing risk (i.e., 12.6% annual reduction vs. 6.5% with northern Maine). However, including the data for northern Maine allows for a more complete estimate of risk and captures the seasonality relationship between whales and lobster fishing effort.
The main focus of our work is to examine fishing effort controls that were in place through 2009 with whale density treated as exogenous. Since the density maps are based on survey effort from 1998 to 2017, they do not reflect risk for any one-time period and we include this critical input parameter as a point estimate. We recognize the empirical estimates of the relative risk index would differ by including the variance of density of whales (and fishing effort). However, this exploratory study was not intended to provide tactical management advice, and in recognition of limited resources and simplicity, we did not incorporate this uncertainty. We expect general observations will not change with this decision, for example, the seasonal distribution of whales (and fishing) given the short period of our analysis, 2002–2009, are unlikely to change.28 Appreciating the fact that uncertainty in whale density estimates is critical for tactical management decisions, further implementation of this model would need to take this into consideration. For instance, in recent years, there appear to be fairly large shifts in the distribution of whales; developers of the maps plan to create two density maps for separate time periods (Center of Independent Experts, 2019). At this point in time we do not have annual density maps which would reveal inter-annual variability in monthly density estimates, although the variance reported in the current density maps does reflect this to some degree.
In terms of our optimization model structure, the use of large spatial strata allows us to make the assumption that fishing effort disappears when an area is closed. When large fishing areas are closed (i.e., open ocean) this effectively eliminates fishing opportunities for that month as alternative spatial fishing opportunities are limited. Whereas, when smaller dynamic and static areas are closed (Table 2), the effect of this shift in fishing effort to the large open area has negligible impacts on relative risk index values. Recognizing that a harvester behavior model is critical for management decisions, a fuller implementation of the framework would require a finer spatial scale and allow uncertainty to be introduced. With a finer spatial scale, revenue differences between the two decision rules may decrease, however, it would remain an empirical question. Input parameter estimates of gear efficacy and compliance in our model were provided to demonstrate how they can impact risk reduction targets if not considered. While data can be collected for compliance, methods, such as expert elicitation may be necessary to estimate gear efficacy parameters since data do not currently exist.
Going forward, first, we recommend DAM programs be included for consideration in the suite of policy instruments for protection of large marine mammals, such as right whales. The U.S. DAM program provided a greater level of risk reduction than static management areas despite the small spatial and temporal extent of the zones. However, for dynamic management to be effective, measures must be able to be implemented quickly, responding to real-time information (Hobday and Hartmann, 2006). Lengthy delays between sightings and implementation of United States DAM zones likely reduced protection provided to whales. Yet, mandatory changes can be implemented quickly in some regulatory systems. In Canada for example, within the “dynamic zone” in the Gulf of St. Lawrence, an area is closed on the day a whale is detected and notice through the Fisheries Notice system can require gear removal within 48 h.29 Alternatively, voluntary dynamic measures may provide protection faster than mandatory measures. Under the voluntary speed reduction zones used to reduce the risk of ship strike mortality in the United States Dynamic Management Areas, a message is immediately sent to an industry contact email list once boundaries have been identified. The United States Coast Guard broadcasts the coordinates to mariners on the NOAA weather radio, and the media is contacted (73 FR 60173, October 10, 2008); this communication speed increases the degree of potential risk reduction from the action. While participation in voluntary measures can be limited (e.g., Silber et al., 2012), high participation has been demonstrated for a noise reduction strategy in Vancouver, Canada (Fraser River Port Authority, 2019) where a reduction in port fees incentivized participation.30 A growing literature on voluntary approaches is helping to identify the conditions to influence success (Segerson, 2010), and positive incentives or the threat of regulatory measures can influence participation (Bisack and Clay, 2020, 2021). Understanding the conditions necessary for high participation should assist in determining whether incentives should be positive or negative.
Second, we recommend additional targeted research on the economics and norms (i.e., social, cultural, and legitimacy) of key fisheries, both in the United States and Canada, in addition to the ongoing biological research on the species. The issue of right whale entanglement is transboundary and extends along much of the Atlantic coast of both countries and overlaps with numerous fisheries, governance structures, and cultures. A single policy instrument (e.g., modified gear) is unlikely to fully address the issue. Understanding how harvesters’ respond to different instruments, such as closures (e.g., Smith and Wilen, 2003; Powers and Abeare, 2009), and the impact of the governance structure on the daily choices of fishermen, will assist in the design of policies that consider the associated incentives and disincentives (Squires and Garcia, 2014). Additional solution pathways may also emerge by simultaneously modeling the economic benefits that can be attained by the lobster fishery under different lobster regulations. This will require an understanding of the yield of the resource stock, costs of harvesting the resource, and market demand models (Richardson and Gates, 1986; Ardini and Lee, 2018), along with the implications of climate change and geographic shifts in lobster stocks (Goode et al., 2019). From a management policy perspective, it is important to understand these relationships to steer clear of implementing measures that could unknowingly shift fishing effort into time-areas with a high density of right whales.
Third, we recommend that the collection of compliance data be included in the design and monitoring requirements for all regulations, even temporary regulations, such as the DAM program. While the Plan included enforcement to deter non-compliance along with outreach and education for compliance promotion (National Oceanic and Atmospheric Administration (NOAA), 2012), data that could be used to estimate compliance were not collected until the program was in its fifth year. Failure of current policy instruments to meet marine mammal management outcome goals cannot always be fixed with new instruments, and it is critical to understand if the goals of a policy instrument are being impeded by non-compliance. When assuming full compliance, the reduction in risk can be overestimated (i.e., scenario 3 vs. scenario 4). Compliance can be improved through enforcement with associated public sector costs, but alternative mechanisms exist. For example, cost-effective management may leave more revenues in the lobster fishery compared to benefit-ranking, which takes the economic needs of the entire lobster industry into account and may increase compliance. As well, incentives can influence choices people make on a daily basis, acting as what behavioral economics calls a “nudge” (Thaler and Sunstein, 2010; Mackay et al., 2018). There is some evidence that compliance increases with at-sea observers, which in the United States do not perform any enforcement function but may provide such a “nudge” to increase compliance (Bisack and Das, 2015; Bisack and Clay, 2020, 2021), although with an increase in public sector costs. However, other tools, such as taxes and subsidies (Squires and Garcia, 2014) and normative factors, such as social influences within a community (Mackay et al., 2018) may also influence compliance choices, suggesting areas for further research.
Fourth, we recommended right whale detection sampling regimes be evaluated for the trade-offs between public and private sector benefits, costs and outcomes. Monitoring of both the species and harvesters is critical to evaluation of success or shortcomings of management measures. Identifying cost-effective resource allocations for right whale detection for management (e.g., flights for protection and/or stock assessments) could improve the performance of right whale protection measures given limited public sector funding envelopes. The outstanding question is, what is the optimal investment in right whale scientific data collection to support recovery? A simulation-based analysis that incorporates uncertainty and a cost-benefit framework of public and private sector trade-offs for right whale protection would allow for an evaluation of the economic value of scientific information for right whale protection. These types of analyses may identify incentives for the private sector to financially support some of scientific data collection costs currently carried by the public sector (Bisack and Magnusson, 2014).
Finally, we recommend that the uncertainty associated with effectiveness of alternative management measures be considered when identifying an optimal mixed of policy instruments within the least-cost mitigation hierarchy framework. This is particularly relevant when there are very different levels of uncertainty associated with the different policy instruments. For example, the effectiveness of reducing risk with avoidance measures is known; if fishing effort is removed completely from an area, the entanglement risk for that area goes to zero (point estimate) with zero uncertainty (variance). However, for minimization measures, such as whale-modified-gear, where information on risk reduction is not available, there is no measure of uncertainty (i.e., variance). Uncertainty around risk can be decomposed into uncertainty around the presence of the species of concern (i.e., right whales), the threat (i.e., different gear configurations), and the mitigation methods (i.e., effectiveness of different policy instrument choices). The precautionary approach advocates a conservative management decision with priority to the resource when there is uncertainty (FAO (Food and Agriculture Organization), 1996; Hildreth et al., 2004). In evaluating the mix of instruments, a benchmark for an acceptable level of uncertainty (variance) around total risk could be established, with the benchmark lowered for endangered species, such as right whales. A lower variance benchmark around risk reductions may result in more avoidance policy instruments rather than minimization policy instruments within the least-cost framework than would be the case otherwise.
Conclusion
This case study evaluated the reduction in risk provided by dynamic and static right whale management areas. Strengths identified included the year round operation of the DAM program and its flexibility to provide additional protection to occasional aggregations of right whales beyond the static areas, where they aggregate year after year. The extensive spatial distribution and repeated overlap of the DAM zones may have incentivized adoption of the whale-modified-gear. To improve the future performance of dynamic measures, we recommend the consideration of voluntary measures, additional social science research of relevant fisheries, the collection of compliance data, evaluation of detection sampling regimes, and consideration of the uncertainty within a least-cost mitigation hierarchy framework.
Despite the potential benefit of the DAM program for right whales, it is not possible to provide a comprehensive evaluation of the program due to a lack of linkage to goals and the absence of key information. The goals of the DAM program were wrapped into the larger goals of the Plan and were defined in terms of outcomes for right whales, with the link to the managed entity (i.e., fishers), not clear. The presence of marine mammal and fishing activity need to be jointly identified to manage reductions in entanglement risk and move toward more cost-effective management options. For a full evaluation, public sector cost must also be considered. The implementation of the DAM program required a high degree of sustained effort by the public sector that likely could not have been sustained indefinitely. However, there may have been additional benefits of the program and the circumstances may have changed. The DAM program reduced economic impacts on private sector harvesters in comparison to extensive closures and potentially provided supplemental protection to right whales. The high public cost of the DAM program may have been, in part, due to the era in which it was implemented. Costs today could be lower. Technological advances have yielded additional detection methods (e.g., passive and glider-based acoustics, etc., see Goulette et al., 2021) and strengthened computational methods (e.g., methods to integrate and assimilate data from the multiple detection methods), which can support improved dynamic decision support tools (e.g., Lewison et al., 2015; Welch et al., 2019).
This research provides important insights into the potential for dynamic management to support far-ranging marine protected species, such as right whales and other large cetaceans, while also raising the need for a larger research agenda to consider tradeoffs between the public and private sectors (Lewison et al., 2015). Protection and recovery of transboundary right whales requires a multi-disciplinary and comprehensive consideration of multiple policy instruments, multiple fisheries, multiple detection methods, economic tradeoff considerations, and multiple governance structures (Kitts et al., 2021). Biological, economic or social research in isolation is bound to miss key considerations, and potentially lead away from, rather than toward, second-best policy options. Bringing these components together within predictive, dynamic models of behavior of the harvesters, whales and lobsters could help steer the discussions and provide a solution path that is critical to the protection and recovery of right whales. In closing, conservation requires science-based decisions (Carter et al., 2021), and the simultaneous inclusion of socio-economic objectives in decision-science models, such as the framework presented, will yield cost-effective solutions.
Data Availability Statement
For NOAA-Fisheries data requests, please contact nmfs.gar.data.requests@noaa.gov and for state data please contact the Atlantic Coastal Cooperative Statistics Program (www.accsp.org). Data supporting the conclusions of this manuscript will be made available by the authors, upon request.
Author Contributions
KB and GM contributed equally to the analysis and the writing of the manuscript. KB organized the database and performed the analysis. Both authors contributed to the article and approved the submitted version.
Funding
This work was funded by the Social Science Branch, Northeast Fisheries Science Center and Protected Resources Division, Greater Atlantic Regional Fisheries Office, through the support of two research assistants. Support for KB by NOAA-Fisheries and for GM by DFO made this collaboration possible.
Conflict of Interest
The authors declare that the research was conducted in the absence of any commercial or financial relationships that could be construed as a potential conflict of interest.
Publisher’s Note
All claims expressed in this article are solely those of the authors and do not necessarily represent those of their affiliated organizations, or those of the publisher, the editors and the reviewers. Any product that may be evaluated in this article, or claim that may be made by its manufacturer, is not guaranteed or endorsed by the publisher.
Acknowledgments
This article is based on the case study presented at the 2017 Incentive-Based Bycatch Workshop at Institute de Recherche’ pour le Development in Sete, France 19–22 September 2017. Chao Zou prepared the datasets used to estimate fishing effort and Dennis Corvi created the standardized GIS coordinate system for the fishing effort and right whale density which allowed us to estimate the RREI. We thank Michael Asaro for providing information and financial support for Dennis Corvi, and Christin Khan and Allison Henry for their assistance with the NOAA-Fisheries aerial survey data and database. It is through peer review that manuscripts improve and we thank Barb Best, Eric Thunberg, Mike Simpkins, along with several anonymous reviewers.
Supplementary Material
The Supplementary Material for this article can be found online at: https://www.frontiersin.org/articles/10.3389/fmars.2021.540966/full#supplementary-material
Footnotes
- ^ The Atlantic Large Whale Take Reduction Plan was first published in 1997 with amendments to the rule in 2000, 2002, 2007, 2014, and 2015. See: https://www.fisheries.noaa.gov/new-england-mid-atlantic/marine-mammal-protection/atlantic-large-whale-take-reduction-plan.
- ^ The development of “dis-entanglement teams” under the Atlantic Large Whale Take Reduction Plan would be part of the third stage of the hierarchy (remediation), while offsetting seems difficult to imagine for large whales, such as the right whale.
- ^ Cost-effectiveness analysis compares mutually exclusive alternatives in terms of the ratio of costs to a single quantifiable, but not monetized, effectiveness measure (Boardman et al., 2011).
- ^ Risk reduction was also used to evaluate alternatives measures to reduce ship strikes, not part of the Atlantic Large Whale Take Reduction Plan. Examples of risk calculations included the co-occurrence (in time and space) of whales and vessels (Fonnesbeck et al., 2008), the multiplication of predicted whale density by a measure of shipping intensity (Williams and O’Hara, 2010), and the relative probability that a vessel will encounter a whale (in time and space) multiplied by the probability of lethality resulting from an encounter (Vanderlaan et al., 2008; Wiley et al., 2011; Conn and Silber, 2013).
- ^ Calculated based on data from NOAA commercial landings, available here: https://foss.nmfs.noaa.gov.
- ^ Marine Stewardship Council. See documents associated with the Gulf of Maine Lobster fishery at: https://fisheries.msc.org/en/fisheries/@@search.
- ^ All Federal Register (FR) notices are available at https://www.federalregister.gov/ while links to final Atlantic Large Whale Take Reduction Plan regulatory documents (last accessed January 6, 2020) are here: https://www.fisheries.noaa.gov/action/atlantic-large-whale-take-reduction-plan-regulations-1997-2015.
- ^ Stock assessment reports which include information on mortality and the Potential Biological Removal level can be found here: https://www.fisheries.noaa.gov/national/marine-mammal-protection/marine-mammal-stock-assessment-reports-species-stock (accessed August 13, 2020).
- ^ Pace et al. (2021) used an abundance estimation model to derive estimates of cryptic mortality for North Atlantic right whales and found that observed carcasses accounted for only 36% of all estimated deaths from 1990 to 2017.
- ^ Weak links are rope attachments that are manufactured to break at a strength lower than that of the rope used, or otherwise reducing the breaking strength of lines used in fishing.
- ^ The 2011 NOAA-Fisheries Northeast Fisheries Science Center aerial abundance line transect survey covered the Gulf of Maine/Bay of Fundy stratum ranging from New York, United States to St. John, New Brunswick, Canada (about 40°N–45°N latitude) and from the shore to about the 100 m depth contour, using a NOAA Twin Otter airplane during 4–26 Aug 2011 (Palka, 2012, see Figure 3). On-effort surveying occurred during 8 good weather flight days for a total of 34.5 h for a total of 5,313.2 km2 track line. We assume flight-days is equivalent to number of individual flights.
- ^ VTR data records the configuration of fishing gear (i.e., number of hauls, traps-per-haul, soak time, and catch, etc.) for individual trips; however, the data for fixed gear (i.e., sink gillnet, lobster traps, etc.) was not recorded consistently by harvesters making it problematic for analysis. While the NOAA-Fisheries Northeast Fisheries Observer Program, which collects data for a sample of trips, records information at the haul level and provided details on fishing effort (e.g., number hauls, number of traps, soak time, catch, etc.), the data for 2002–2009 are too sparse to be used for spatially explicit estimates of the number of hauls per trip. This framework would have benefited from census level reporting of VTR records along with vertical line location and configurations, as would other management objectives.
- ^ Since the closed area (i.e., GSC) has no fishing effort, the risk of entanglement is zero.
- ^ This proxy can be modified by weighting the trips in different times or areas to reflect the average alternative gear configuration in terms of number of lines, should a complete set of data become available.
- ^ Individual trips could be weighted to account for lethality differences associated with different methods of deployment (i.e., number of traps in a trawl, depth) and characteristics (e.g., breaking strength of line), should that data become available.
- ^ Within a cost-effectiveness analysis the issue of scale can be a concern; however, the risk constraint within the optimization eliminates this issue.
- ^ For this illustration, the revenues potentially lost due to a closure are used as a proxy for opportunity costs.
- ^ If instead effort is displaced this would result in an overestimation of reductions in revenues and risk to whales. For use in a management setting we would incorporate a harvester behavioral model to reflect shifts in fishing effort in response to closures (e.g., Holland and Sutinen, 2000; NOAA (National Oceanic and Atmospheric Administration), 2009; Dépalle et al., 2020).
- ^ Lethality of entanglement could be, but currently is not, incorporated in the model. As Vanderlaan et al. (2011) states, it is not possible to estimate in a robust manner the lethality of an entanglement among gear types. Additional information would be needed on the mechanics of a fishing-gear entanglement, the likelihood of each gear type entangling a whale, the likelihood of self-disentanglement by gear type, and the standardization of entanglement rates by fishing effort.
- ^ The assumed values for α, are for illustration only, as there is no empirical evidence available. Research on efficacy of gear modifications for other marine mammals, such as pingers for harbor porpoise, has been assessed using NOAA’s Northeast Fisheries Observer Program data (Palka et al., 2008). However, as discussed in the “Background” and “Data and Methods” sections observer data are not available for assessing efficacy of whale-modified-gear for right whales.
- ^ Broadscale surveys were the primary survey type from 2002 to the spring of 2007 (Khan et al., 2018). The survey covers all federal waters from New York to Maine. Survey lines were flown year round whenever good weather occurred, unless there was a pressing management issue. Starting in the summer of 2007 sawtooth surveys were implemented as part of the mark-recapture effort for stock assessments. Blocks were made around areas with high numbers of right whale sightings. Sawtooth surveys also supported other management area needs, such as DAM detection.
- ^ As an alternative to proportional sampling, a stratified random sampling approach (Cochran, 1977) could be implemented to evaluate sampling tradeoffs. For example, increasing sampling in areas where the variance is higher, and vice versa, may reduce the total variance for improved precision around the statistic of choice (e.g., whale sightings per unit effort).
- ^ Calculated as 45% in management areas/64% of right whales in northeast waters.
- ^ While data on 3 months of the 2009 year were included in the analysis, they are not considered representative.
- ^ It is not possible to provide management level recommendations from the optimization results due to data limitations and the focus on pre-2010 fishing effort. For this analysis, we extrapolate the number of trips from the Dealer data not recorded in the VTR (Table 1), using the VTR data, as the first step. Going forward, with additional at-sea observer data and more consistent VTR data, we should be able to construct a regression model to estimate vertical lines as a function of trip attributes.
- ^ The cost of gear modifications to the fishing industry are not captured within this optimization model. This could be the case where it was (almost) costless for industry to implement a gear modification (e.g., a change in deployment that does not add cost) or whale-modified-gear is gifted/subsidized for the private sector. This may be the case as the ex-ante cost estimates for the implementation of the gear modifications for the DAM program were negligible (National Marine Fisheries Service (NMFS), 2003).
- ^ We would like to thank an reviewer for making this suggestion.
- ^ The empirical estimates of RREI would differ, if for example, both the number of whales and fishing effort were under-estimated (or over-estimated) in the right whale management areas, then the RREI in those areas would be under-estimated (over-estimated) and the RREI outside would be over-estimated (under-estimated). In the case where fishing effort and number of whales are in the opposite direction with magnitudes unknown, an empirical analysis would be required to address this question.
- ^ As described here: https://www.dfo-mpo.gc.ca/fisheries-peches/commercial-commerciale/atl-arc/narw-bnan/index-eng.html.
- ^ See: https://www.portvancouver.com/news-and-media/news/vancouver-fraser-port-authority-expands-noise-reduction-criteria-to-encourage-quieter-waters-for-endangered-whales/.
References
Ando, A., Camm, J., Polasky, S., and Solow, A. (1998). Species distribution, land values, and efficient conservation. Science 279, 2126–2128. doi: 10.1126/science.279.5359.2126
Ardini, G., and Lee, M. (2018). Do IFQs in the US Atlantic Sea Scallop fishery impact price and size. Mar. Res. Econ. 33, 263–288. doi: 10.1086/698199
Atlantic State Marine Fisheries Commission (2018). 2018 Review of The Atlantic States Marine Fisheries Commission Fishery Management Plan For American Lobster (Homarus Americanus) 2017 Fishing Year. Arlington, VA: Atlantic States Marine Fisheries Commission (ASMFC).
Berkelaar, M. (2020). lpSolve: Interface to ‘Lp_solve’ v. 5.5 to Solve Linear/Integer Programs. R package version 5.6.15.
Bisack, K., and Clay, P. M. (2020). Compliance with marine mammal protection: focus groups reveal factors in commercial fishermen’s decisions. Mar. Policy 15:103789. doi: 10.1016/j.marpol.2019.103789
Bisack, K., and Clay, P. M. (2021). Behavioral responses to competing incentives and disincentives: compliance with marine mammal protection. Mar. Policy 132:104674. doi: 10.1016/j.marpol.2021.104674
Bisack, K., and Das, C. (2015). Understanding non-compliance with protected species regulations in the northeast USA gillnet fishery. Front. Mar. Sci. 2:91. doi: 10.3389/fmars.2015.00091
Bisack, K., and Magnusson, G. M. (2014). Measuring the economic value of increased precision in scientific estimates of marine mammal abundance and bycatch: harbor porpoise Phocoena phocoena in the Northeast U.S. Gill-Net Fishery. N. Am. J. Fish. Manag. 34, 311–321. doi: 10.1080/02755947.2013.869281
Bisack, K., and Magnusson, G. M. (2016). Measuring management success for protected species: looking beyond biological outcomes. Front. Mar. Sci. 3:61. doi: 10.3389/fmars.2016.00061
Boardman, A. E., Greenberg, D. H., Vining, A. R., and Weimer, D. L. (2011). Cost-Benefit Analysis Concepts and Practice, 4th Edn. Saddle River, NJ: Pearson Education, Inc., 539.
Borggaard, D. L., Gouveia, D. M., Colligan, M. A., Merrick, R., Swails, K. S., Asaro, M. J., et al. (2017). Managing U.S. Atlantic large whale entanglements: four guiding principles. Mar. Policy 84, 202–212. doi: 10.1016/j.marpol.2017.06.027
Brilliant, S. W., Wimmer, T., Rangeley, R. W., and Taggart, C. T. (2017). A timely opportunity to protect North Atlantic right whales in Canada. Mar. Policy 81, 160–166. doi: 10.1016/j.marpol.2017.03.030
Carter, J., Goldman, G., Rosenberg, A., Reed, G., Desikan, A., and MacKinney, T. (2021). Strengthen scientific integrity under the Biden administration. Science 371, 668–671. doi: 10.1126/science.abg0533
Center of Independent Experts (2019). Peer Review Summary Report: Review of the North Atlantic Right Whale Decision Support Tool. Panel: Dvan der Hoop, How and Bowen. November 2019. Woods Hole, MA 02543. 27. Available online at: https://www.fisheries.noaa.gov/feature-story/decision-support-tool-helpful-those-finding-ways-reduce-whale-entanglement-fishing (accessed August 6, 2020)
Conn, P. B., and Silber, G. K. (2013). Vessel speed restrictions reduce risk of collision-related mortality for North Atlantic right whales. Ecosphere 4:43. doi: 10.1890/ES13-00004.1
Delavenne, J., Metcalfe, K., Smith, R. J., Vaz, S., Martin, C. S., Dupuis, L., et al. (2012). Systematic conservation planning in the eastern English Channel: comparing the Marxan and Zonation decision-support tools. ICES J. Mar. Sci. 69, 75–83. doi: 10.1093/icesjms/fsr180
Dépalle, M., Thébaud, O., and Sanchirico, J. (2020). Accounting for fleet heterogeneity in estimating the impacts of large-scale fishery closures. Mar. Resour. Econ. 35, 361–378. doi: 10.1086/710514
Department of Fisheries and Oceans Canada (DFO) (2018). Outlook to 2027 for Canadian Fish and Seafood. Ottawa, ON: Department of Fisheries and Oceans Canada (DFO), 39.
Dunn, D. C., Maxwell, S. M., Boustany, A. M., and Halpin, P. N. (2016). Dynamic ocean management increase the efficiency and efficacy of fisheries management. PNAS 113, 668–673. doi: 10.1073/pnas.1513626113
Endangered Species Act (ESA) (1973). 16 U.S.C. ch. 35 §1531 et seq. (Washington, DC: United States Congress).
FAO (Food and Agriculture Organization) (1996). Precautionary Approach to Capture Fisheries and Species Introductions. FAO, Technical Guidelines for Responsible Fisheries 2. Rome: FAO.
Farmer, N. A., Gowan, T. A., Powell, J. R., and Zoodsma, B. J. (2016). Evaluation of alternatives to winter closure of black sea bass pot gear: projected impacts on catch and risk entanglement with north atlantic right whales Eubalaena glacialis. Mar. Coast. Fish. 8, 202–221. doi: 10.1080/19425120.2016.1146181
Ferraro, P. J. (2003). Assigning priority to environmental policy interventions in a heterogeneous world. J. Policy Anal. Manag. 22, 27–43. doi: 10.1002/pam.10094
Fonner, R., Bellanger, M., and Warlick, A. (2020). Economic analysis for marine protected resource management: challenges, tools and opportunities. Ocean Coast. Manage. 194:105222. doi: 10.1016/j.ocecoaman.2020.105222
Fonnesbeck, C. J., Garrison, L. P., Ward-Geiger, L. I., and Baumstark, R. D. (2008). Bayesian hierarchical model for evaluating the risk of vessel strikes on North Atlantic right whales in the SE United States. Endanger. Species Res. 6, 87–94. doi: 10.3354/esr00134
Fraser River Port Authority (2019). ECHO Program 2018 Voluntary Vessel Slowdown in Haro Strait: Summary findings. 260. Available online at: https://www.portvancouver.com/wp-content/uploads/2020/08/ECHO-Program-2019-voluntary-vessel-slowdown-in-Haro-Strait-and-Boundary-Pass-final-report.pdf (accessed August 10, 2021).
Geary, W. L., Bode, M., Doherty, T. S., Fulton, E. A., Nimmo, D. G., Tulloch, A. I. T., et al. (2020). A guide to ecosystem models and their environmental applications. Nat. Ecol. Evol. 4, 1459–1471.
Goode, A. G., Brady, D. C., Steneck, R. S., and Wahle, R. A. (2019). The brighter side of climate change: how local oceanography amplified a lobster boom in the Gulf of Maine. Glob. Chang. Biol. 25, 3906–3917. doi: 10.1111/gcb.14778
Goulette, G., Hawkes, J., Kocik, J., Manning, J., Matzen, E., Van Parijs, S., et al. (2021). Opportunistic Acoustic Telemetry Platforms: An Update on the Northeast Fisheries Science Center’s Collaborative Monitoring Program in the Gulf of Maine, 2005-2018. NOAA Tech. Mem. NMFS-NE-265. Washington, DC: NOAA, 28.
Grantham, H. S., Petersen, S. L., and Possingham, H. P. (2008). Reducing bycatch in the South African pelagic longline fishery: the utility of different approaches to fisheries closures. Endanger. Species Res. 5, 291–299. doi: 10.3354/esr00159
Hazen, E., Scales, K., Maxwell, S., Briscoe, D., Welch, H., Bograd, S., et al. (2018). A dynamic ocean management tool to reduce bycatch and support sustainable fisheries. Sci. Adv. 4:5. doi: 10.1126/sciadv.aar3001
Henry, A., Garron, M., Reid, A., Morin, D., Ledwell, W., and Cole, T. (2019). Serious Injury and Mortality Determinations for Baleen Whale Stocks Along the Gulf of Mexico, United States East Coast, and Atlantic Canadian Provinces, 2012-2016. US Dept Commer, Northeast Fish Sci Cent Ref Doc. 19-13. Washington, DC: NOAA, 54.
Hildreth, R. G., Jarman, M. C., and Langlas, M. (2004). Roles for a precautionary approach in U.S. marine resources management. Nat. Res. Environ. 19, 64–67.
Hobday, A., and Hartmann, K. (2006). Near real-time spatial management based on habitat predictions for a longline bycatch species. Fish. Manag.Ecol. 13, 365–380. doi: 10.1111/j.1365-2400.2006.00515.x
Hobday, A., Hartog, J., Timmiss, T., and Fielding, J. (2010). Dynamic spatial zoning to manage southern bluefin tuna (Thunnus maccoyii) cap-ture in a multi-species longline fishery. Fish. Oceanogr. 19, 243–253.
Holland, D., and Sutinen, J. (2000). Location choice in New England trawl fisheries: old habits die hard. Land Econ. 76, 133–149. doi: 10.2307/3147262
Kaplan, S., and Garrick, B. (1981). On the quantitative definition of risk. Risk Anal. 1, 11–27. doi: 10.1111/j.1539-6924.1981.tb01350.x
Khan, C., Cole, T., Duley, P., Glass, A., and Gatzke, J. (2010). North Atlantic Right Whale SightingSurvey (NARWSS) and Right Whale Sighting Advisory System (RWSAS). NortheastFish Sci. Cent. Ref. Doc. 10-07. 7. Available online at: http://www.nefsc.noaa.gov/nefsc/publications/
Khan, C., Henry, A., Duley, P., Gatzke, J., Crowe, L., and Cole, T. (2018). North Atlantic Right Whale Sighting Survey (NARWSS) and Right Whale Sighting Advisory System (RWSAS) 2016 Results Summary. US Dept Commer, Northeast Fish Sci Cent Ref Doc. 18-01. Washington, DC: NOAA, 13.
Kitts, A., Benaka, L., Heinemann, D., Lovell, S., Olsen, N., and Squires, D. (2021). Workshop Report: Economic Aspects of Bycatch Reduction. NOAA Tech. Memo. NMFSF/SPO-214. Washington, DC: NOAA, 46.
Knowlton, A., Hamilton, P., Marx, M. K., Pettis, H. M., and Kraus, S. D. (2012). Monitoring North Atlantic right whale Eubalaena glacialis entanglement rates: a 30 yr retrospective. Mar. Ecol. Prog. Ser. 466, 293–302. doi: 10.3354/meps09923
Knowlton, A. R., Robbins, J., Landry, S., McKenna, H. A., Kraus, S. D., and Werner, T. (2016). Effects of fishing rope strength on the severity of large whale entanglements. Conserv. Biol. 30, 318–328. doi: 10.1111/cobi.12590
LaBrecque, E., Curtice, C., Harrison, J., Van Parijs, S. M., and Halpin, P. N. (2015). 2. Biologically important areas for cetaceans within U.S. waters–east coast region. Aquat. Mamm. 41, 17–29. doi: 10.1578/AM.41.1.2015.17
Lagueux, K. M., Zani, M. A., Knowlton, A. R., and Kraus, S. D. (2011). Response by vessel operators to protection measures for right whales Eubalaena glacialis in the southeast US calving ground. Endanger. Species Res. 14, 69–77. doi: 10.3354/esr00335
Laist, D. W., Knowlton, A. R., and Pendleton, D. (2014). Effectiveness of mandatory vessel speed limits for protecting North Atlantic right whales. Endanger. Species Res. 23, 133–147. doi: 10.3354/esr00586
Lent, R., and Squires, D. (2017). Reducing marine mammal bycatch in global fisheries: An economics approach. Deep Sea Res. 2 Top. Stud. Oceanogr. 40, 268–277. doi: 10.1016/j.dsr2.2017.03.005
Lewison, R., Hobday, A., Maxwell, S., Hazen, E., Hartog, J., Dunn, D., et al. (2015). Dynamic ocean management: identifying the critical ingredients of dynamic approaches to ocean resource management. Bioscience 65, 486–498. doi: 10.1093/biosci/biv018
Little, A. S., Needle, C. L., Hilborn, R., Holland, D. S., and Marshall, T. (2015). Real-time spatial management approaches to reduce bycatch and discards: experiences from Europe and the United States. Fish Fish. 16, 576–602. doi: 10.1111/faf.12080
Mackay, M., Jennings, S., van Putten, E. I., Sibly, H., and Yamazaki, S. (2018). When push comes to shove in recreational fishing compliance, think ‘nudge’. Mar. Policy 95, 256–266. doi: 10.1016/j.marpol.2018.05.026
Marine Mammal Protection Act (MMPA) (1972). Marine Mammal Protection Act of 1972, as Amended. U.S. Code, volume 31, Sections 1371–1423.
Merrick, R. L., Clapham, P. J., Cole, T., Gerrior, P., and Pace, R. M. III (2001). Identification of Seasonal Area Management Zones for North Atlantic Right Whale Conservation. Northeast Fish. Sci. Cent. Ref. Doc. 01-14. Woods Hole, MA: National Marine Fisheries Service, 18.
Milner-Gulland, E. J., Garcia, S., Arlidge, W., Bull, J., Charles, A., Dagorn, L., et al. (2018). Translating the terrestrial mitigation hierarchy to marine megafauna by-catch. Fish Fish. 19, 547–561. doi: 10.1111/faf.12273
Naidoo, R., Balmford, A., Ferraro, P. J., Polasky, S., Ricketts, T. H., and Rouget, M. (2006). Integrating economic costs into conservation planning. Trends Ecol. Evol. 21, 681–687. doi: 10.1016/j.tree.2006.10.003
National Marine Fisheries Service (NMFS) (2001). Environmental Assessment of the Final Rule amending the Atlantic Large Whale Take Reduction Plan Dynamic Area Management. Gloucester MA: Greater Atlantic Regional Fisheries Office, 41.
National Marine Fisheries Service (NMFS) (2003). Final Environmental Assessment of the Final Rule amending the Atlantic Large Whale Take Reduction Plan Dynamic Area Management Gear Modifications. Gloucester MA: Greater Atlantic Regional Fisheries Office, 108.
National Oceanic and Atmospheric Administration (NOAA) (2012). Atlantic Large Whale Take Reduction Plan (ALWTRP) Monitoring Strategy; Monitoring Effectiveness of and Regulatory Compliance with the ALWTRP, Vol. 2. Gloucester, MA: Grater Atlantic Region Fisheries Office, 22.
National Oceanic and Atmospheric Administration (NOAA) (2014). Final Environmental Impact Statement for Amending the Atlantic Large Whale Take Reduction Plan: Vertical Line Rule Volume I OF II. 773. Available online at: https://cdxnodengn.epa.gov/cdx-enepa-II/public/action/eis/details?eisId=88316 (accessed 12 July 2021).
National Oceanic and Atmospheric Administration (NOAA) (2017). North Atlantic Right Whale (Eubalaena glacialis) 5-Year Review: Summary and Evaluation, Vol. 34. Washington, DC: NOAA.
National Oceanic and Atmospheric Administration (NOAA) (2020). “North Atlantic Right Whale (Eubalaena glacialis): Western Atlantic Stock,” in Marine Mammal Stock Assessment Reports by Species/Stock. Available online at: https://www.fisheries.noaa.gov/national/marine-mammal-protection/marine-mammal-stock-assessment-reports-species-stock#more-information (accessed: August 14, 2020)
Needle, C. L., and Catarino, R. (2011). Evaluating the effect of real-time closures on cod targeting. ICES J. Mar. Sci. 68, 1647–1655. doi: 10.1093/icesjms/fsr092
NOAA (National Oceanic and Atmospheric Administration) (2009). Modifications to the Harbor Porpoise Take Reduction Plan. Final environmental assessment (includes regulatory review and final regulatory flexibility analysis). National Marine Fisheries Service, Northeast Region [now Greater Atlantic Region]. (See closed area model 4.2.1.3). Washington, DC: NOAA.
Oinonen, S., Hyytiäinen, K., Ahlvik, L., Laamanen, M., Lehtoranta, V., Salojärvi, J., et al. (2016). Cost-effective marine protection – a pragmatic approach. PLoS ONE 11:e0147085. doi: 10.1371/journal.pone.0147085
Pace, R., Williams, R., Kraus, S., Knowlton, A., and Pettis, H. (2021). Cryptic mortality of North Atlantic right whales. Conserv. Sci. Pract. 3:e346.
Pace, R. M. III, Cole, T., and Henry, A. G. (2014). Incremental fishing gear modifications fail to significantly reduce large whale serious injury rates. Endanger. Species Res. 26, 115–126. doi: 10.3354/esr00635
Pace, R. M. III, Corkeron, P. J., and Kraus, S. D. (2017). State–space mark–recapture estimates reveal a recent decline in abundance of North Atlantic right whales. Ecol. Evol. 7, 8730–8741. doi: 10.1002/ece3.3406
Palka, D. (2012). Cetacean Abundance Estimates in US Northwestern Atlantic Ocean Waters from Summer 2011 Line Transect Survey. US Dept Commer, Northeast Fish Sci Cent Ref Doc. 12-29. Woods Hole, MA: National Marine Fisheries Service, 37.
Palka, D., Rossman, M., Vanatten, A., and Orphanides, C. (2008). Effect of pingers on harbor porpoise (Phocoena phocoena) bycatch in the US Northeast gillnet fishery. J. Cetacean Res. Manag. 10, 217–226.
Pereira, G., and Josupeit, H. (2017). The World Lobster Market. FAO Globefish Research Programme. Volume 123. FAO: Rome.
Pettis, H. M., Pace, R. M. III, and Hamilton, P. K. (2020). North Atlantic Right Whale Consortium 2020 Annual Report Card. Report to the North Atlantic Right Whale Consortium. 22. Available online at: www.narwc.org (accessed August 10, 2021).
Powers, J. E., and Abeare, S. M. (2009). Fishing effort redistribution in response to area closures. Fish. Res. 99, 216–225. doi: 10.1016/j.fishres.2009.06.011
Read, A. J., Drinker, P., and Northridge, S. (2006). Bycatch of marine mammals in U.S. and global fisheries: bycatch of marine mammals. Conserv. Biol. 20, 163–169. doi: 10.1111/j.1523-1739.2006.00338.x
Reeves, R. A., Read, J., Lowry, L., Katona, S. K., and Boness, D. J. (2007). Report of the North Atlantic Right Whale Program Review. Woods Hole, MA: Marine Mammal Commission, 69.
Richardson, E. J., and Gates, J. M. (1986). Economic benefits of American lobster fishery management regulations. Mar. Res. Econ. 2, 353–382. doi: 10.1086/mre.2.4.42628910
Robbins, J., Knowlton, A. K., and Landry, S. (2015). Apparent survival of North Atlantic right whales after entanglement in fishing gear. Bio Conserv. 191, 421–427. doi: 10.1016/j.biocon.2015.07.023
Roberts, J. J., Best, B. D., Mannocci, L., Fujioka, E., Halpin, P. N., Palka, D. L., et al. (2016). Habitat-based cetacean density models for the U.S. Atlantic and Gulf of Mexico. Sci. Rep. 6:22615.
Robin, N., Balmford, A., Ferraro, P. J., Polasky, S., Ricketts, T. H., and Rouget, M. (2006). Integrating economic costs into conservation planning. Trends Ecol. Evol. 21, 681–687. doi: 10.1016/j.tree.2006.10.003
Segerson, K. (2010). “Can Voluntary Programs Reduce Sea Turtle Bycatch? Insights from the Literature in Environmental Economics,” in Handbook of Marine Fisheries Conservation and Management, eds R. Q. Grafton, R. Hilborn, D. Squires, M. Tait, and M. Williams (New York, NY: Oxford University Press), 618–629.
Silber, G. K., Adams, J. D., and Bettridge, S. (2012). Vessel operator response to a voluntary measure for reducing collisions with whales. Endanger. Species Res. 17, 245–254. doi: 10.3354/esr00434
Silber, G. K., Adams, J. D., and Fonnesbeck, C. J. (2014). Compliance with vessel speed restrictions to protect North Atlantic right whales. PeerJ 2:e399. doi: 10.7717/peerj.399
Smith, M., and Wilen, J. (2003). Economic impacts of marine reserves: the importance of spatial behavior. JEEM 46, 183–206. doi: 10.1016/S0095-0696(03)00024-X
Species at Risk Act (2002). Available online at: https://laws-lois.justice.gc.ca/eng/acts/S-15.3/. doi: 10.1016/s0095-0696(03)00024-x (accessed August 10, 2021).
Squires, D., and Garcia, S. M. (2014). Ecosystem-Level Impacts of Fisheries Bycatch on Marine Megafauna: Biodiversity Conservation Through Mitigation, Policy, Economic Instruments, and Technical Change. Report of an IUCN-CEM-FEG Scientific Workshop October 2013. Gland: International Union for Conservation of Nature.
Squires, D., and Garcia, S. M. (2018). The least-coast biodiversity impact mitigation hierarchy with a focus on marine fisheries and bycatch issues. Conserv. Biol. 32, 989–997. doi: 10.1111/cobi.13155
Squires, D., Restrepo, V., Garcia, S., and Dutton, P. (2018). Fisheries bycatch reduction within the least-cost biodiversity mitigation hierarchy: conservatory offsets with an application to sea turtles. Mar. Policy 93, 55–61. doi: 10.1016/j.marpol.2018.03.018
Stewart, R. R., and Possingham, H. P. (2005). Efficiency, costs and trade-offs in marine reserve system design. Environ. Model. Assess. 10, 203–213. doi: 10.1007/s10666-005-9001-y
Thaler, R. H., and Sunstein, C. R. (2010). Nudge: improving decisions about health, wealth, and happiness. Econ. Philos. 26, 369–376.
Vanderlaan, A. S., Smedbol, R. K., and Taggart, C. T. (2011). Fishing-gear threat to right whales (Eubalaena glacialis) in Canadian waters and the risk of lethal entanglement. Can. J. Fish Aquat. Sci. 68, 2174–2193. doi: 10.1139/F2011-124
Vanderlaan, A. S., Taggart, C. T., Serdynska, A. R., Kenney, R. D., and Brown, M. W. (2008). Reducing the risk of lethal encounters: vessels and right whales in the Bay of Fundy and on the Scotian Shelf. Endanger. Species Res. 4, 283–297. doi: 10.3354/esr00083
Wade, P. R., and Angliss, R. P. (1997). Guidelines for Assessing Marine Mammal Stocks: Report of the GAMMS Workshop. April 3-5. Seattle, WA. NOAA Tech Memo NMFS-OPR-12. Washington, DC: NOAA.
Welch, H., Brodie, S., Jacox, M. G., Bograd, S. J., and Hazen, E. L. (2019). Decision-support tools for dynamic management. Conserv. Biol. 34, 589–599. doi: 10.1111/cobi.13417
Wiley, D. N., Moller, J. C., and Zillnskas, K. A. (2003). The distribution and density of commercial fisheries and baleen whales within the Stellwagen Bank national marine sanctuary: July 2001–June 2002. Mar. Technol. Soc. J. 37, 35–53. doi: 10.4031/002533203787537384
Wiley, D. N., Thompson, M., Pace, R. M. III, and Levenson, J. (2011). Modeling speed restrictions tomitigate lethal collisions between ships and whalesin the Stellwagen Bank National Marine Sanctuary, USA. Biol. Conserv. 144, 2377–2381. doi: 10.1016/j.biocon.2011.05.007
Williams, R., and O’Hara, P. (2010). Modelling ship strike risk to fin, humpback and killer whales in British Columbia, Canada. J. Cetacean Res. Manag. 11, 1–8.
Keywords: mitigation, Dynamic Area Management, bio-eoconomic tradeoffs, policy instruments, bycatch, marine mammal, cost-effectiveness (economics), compliance
Citation: Bisack KD and Magnusson GM (2021) Spatial Management to Reduce Entanglement Risk to North Atlantic Right Whales in Fishing Gear: A Case Study of U.S. Northeast Lobster Fishery 2002–2009. Front. Mar. Sci. 8:540966. doi: 10.3389/fmars.2021.540966
Received: 06 March 2020; Accepted: 28 July 2021;
Published: 10 September 2021.
Edited by:
Lisa Taylor Ballance, Oregon State University, United StatesReviewed by:
Dale Edward Squires, National Oceanic and Atmospheric Administration (NOAA), United StatesStephen Stohs, Southwest Fisheries Science Center (NOAA), United States
Copyright © 2021 Bisack and Magnusson. This is an open-access article distributed under the terms of the Creative Commons Attribution License (CC BY). The use, distribution or reproduction in other forums is permitted, provided the original author(s) and the copyright owner(s) are credited and that the original publication in this journal is cited, in accordance with accepted academic practice. No use, distribution or reproduction is permitted which does not comply with these terms.
*Correspondence: Kathryn D. Bisack, S2F0aHJ5bi5CaXNhY2tAbm9hYS5nb3Y=
†These authors share first authorship