 Kristen B. Gorman
 Kate E. Ruck
 Tony D. Williams
 William R. Fraser
- 1Department of Biological Sciences, Simon Fraser University, Burnaby, BC, Canada
- 2College of Fisheries and Ocean Sciences, University of Alaska Fairbanks, Fairbanks, AK, United States
- 3College of William & Mary, Virginia Institute of Marine Science, Gloucester Point, VA, United States
- 4Polar Oceans Research Group, Sheridan, MT, United States
We evaluated annual and regional variation in the dietary niche of Pygoscelis penguins including the sea ice-obligate Adélie penguin (Pygoscelis adeliae), and sea ice-intolerant chinstrap (Pygoscelis antarcticus) and gentoo (Pygoscelis papua) penguins, three species that nest throughout the western Antarctic Peninsula (AP) to test the sea ice trophic interaction hypothesis, which posits that penguin breeding populations with divergent trends, i.e., declining or increasing, are reliant on differing food webs. Our study relies on values of naturally occurring carbon (13C/12C, δ13C) and nitrogen (15N/14N, δ15N) stable isotopes as integrated proxies of penguin food webs measured over three years at three different breeding colonies. At Anvers Island in the north, where reductions in sea ice and changes in breeding population trends among sympatric sea ice-obligate (Adélie) and sea ice-intolerant (chinstrap and gentoo) penguins have been most notable, our analyses show that all three species of Pygoscelis penguins became more similar isotopically over the reproductive period. By late chick-rearing at Anvers Island, crèched chicks at 5-weeks-old for all species occupied similar trophic positions. Isotopic mixing models indicated that the proportions of prey provisioned by adult penguins to 5-week-old chicks at Anvers Island were generally similar across species within years, consisting primarily of Antarctic krill (Euphausia superba). Crèched Adélie chicks had higher δ13C and δ15N values at Avian and Charcot Islands, southern breeding colonies where sea ice is more prominent and populations of Adélie penguins have increased or remain stable. Trophic position increased with latitude, while the proportions of prey provisioned by Adélie penguin adults to chicks at southern breeding colonies included species typical of high Antarctic marine food webs, especially crystal krill (Euphausia crystallorophias). A Bayesian metric for dietary niche width, standard ellipse area (SEA-B), indicated that Pygoscelis penguins with greater population changes in the north had more variability in dietary niche width than stable populations further south. Our results lend insight on marine food web drivers of Pygoscelis penguin reproduction at the regional scale and question the long-standing paradigm that Antarctic krill are the only food web component critical to penguin reproductive survival in this region of the Southern Ocean.
Introduction
Polar marine ecosystem studies have demonstrated broad correlations between climate-driven variation in physical oceanography and associated change in the abundance and distribution of key trophic levels including predator populations (Grebmeier et al., 2006; Ducklow et al., 2007). Although informative in terms of identifying ecosystem components involved in ecological change, the specific trophic interactions that link predator demography with variation in sea ice habitats have not been well resolved (but see Ainley et al., 2018). For example, ecological drivers of Antarctic penguin population change, i.e., Pygoscelis and Aptenodytes species (Baker et al., 2006) occurring throughout the Scotia Sea and Antarctic Peninsula (AP) regions (Figures 1A,B), have been classic discussions in Antarctic ecology, originally in terms of competitive release due to increases in food availability as a result of the commercial removal of baleen whales (Laws, 1977, 1985). The issue remains the focus of debate, but more recently within the context of regional climate warming (Fraser et al., 1992; Croxall et al., 2002; Forcada et al., 2006; Ducklow et al., 2007; Trathan et al., 2007, 2011; Forcada and Trathan, 2009; Bestelmeyer et al., 2011) and synergistic effects with marine resource harvesting (Ainley and Blight, 2009; Trathan and Agnew, 2010; Trivelpiece et al., 2011; McMahon et al., 2019). Fraser et al. (1992) hypothesized that climate-driven reductions in winter sea ice mediated divergent breeding population responses by chinstrap (Pygoscelis antarcticus) and Adélie (Pygoscelis adeliae) penguins by increasing or decreasing over-winter survival and subsequent recruitment of each species, respectively, given that chinstrap penguins winter in pelagic, sea ice-free regions across the Scotia Sea (Williams, 1995; Trivelpiece et al., 2007), while Adélie penguins rely on southerly distributed pack ice for winter habitat (Ainley, 2002). Although sea ice was recognized as important in mediating many trophic interactions, the physical extent of this critical winter habitat was considered the key ecological factor that allowed penguins to fully exploit their prey, particularly Antarctic krill (Euphausia superba) (Fraser et al., 1992). This paradigm of species’ opposing life history affinities for the presence of sea ice has been invoked to explain population change, particularly at range margins, by Antarctic penguins also including gentoo (Pygoscelis papua) (Ducklow et al., 2007; Forcada and Trathan, 2009; but see Trivelpiece et al., 2011) and emperor (Aptenodytes forsteri) (Trathan et al., 2011) penguins of the western AP. However, few studies have considered this issue from an integrated food web perspective as most have exclusively focused on variability in Antarctic krill stocks as the mechanistic link between climate and sea ice change in this region of the Southern Ocean and facets of Pygoscelis penguin demography that underlie breeding population change (Fraser and Hofmann, 2003; Hinke et al., 2007; Trivelpiece et al., 2011; Ducklow et al., 2013).
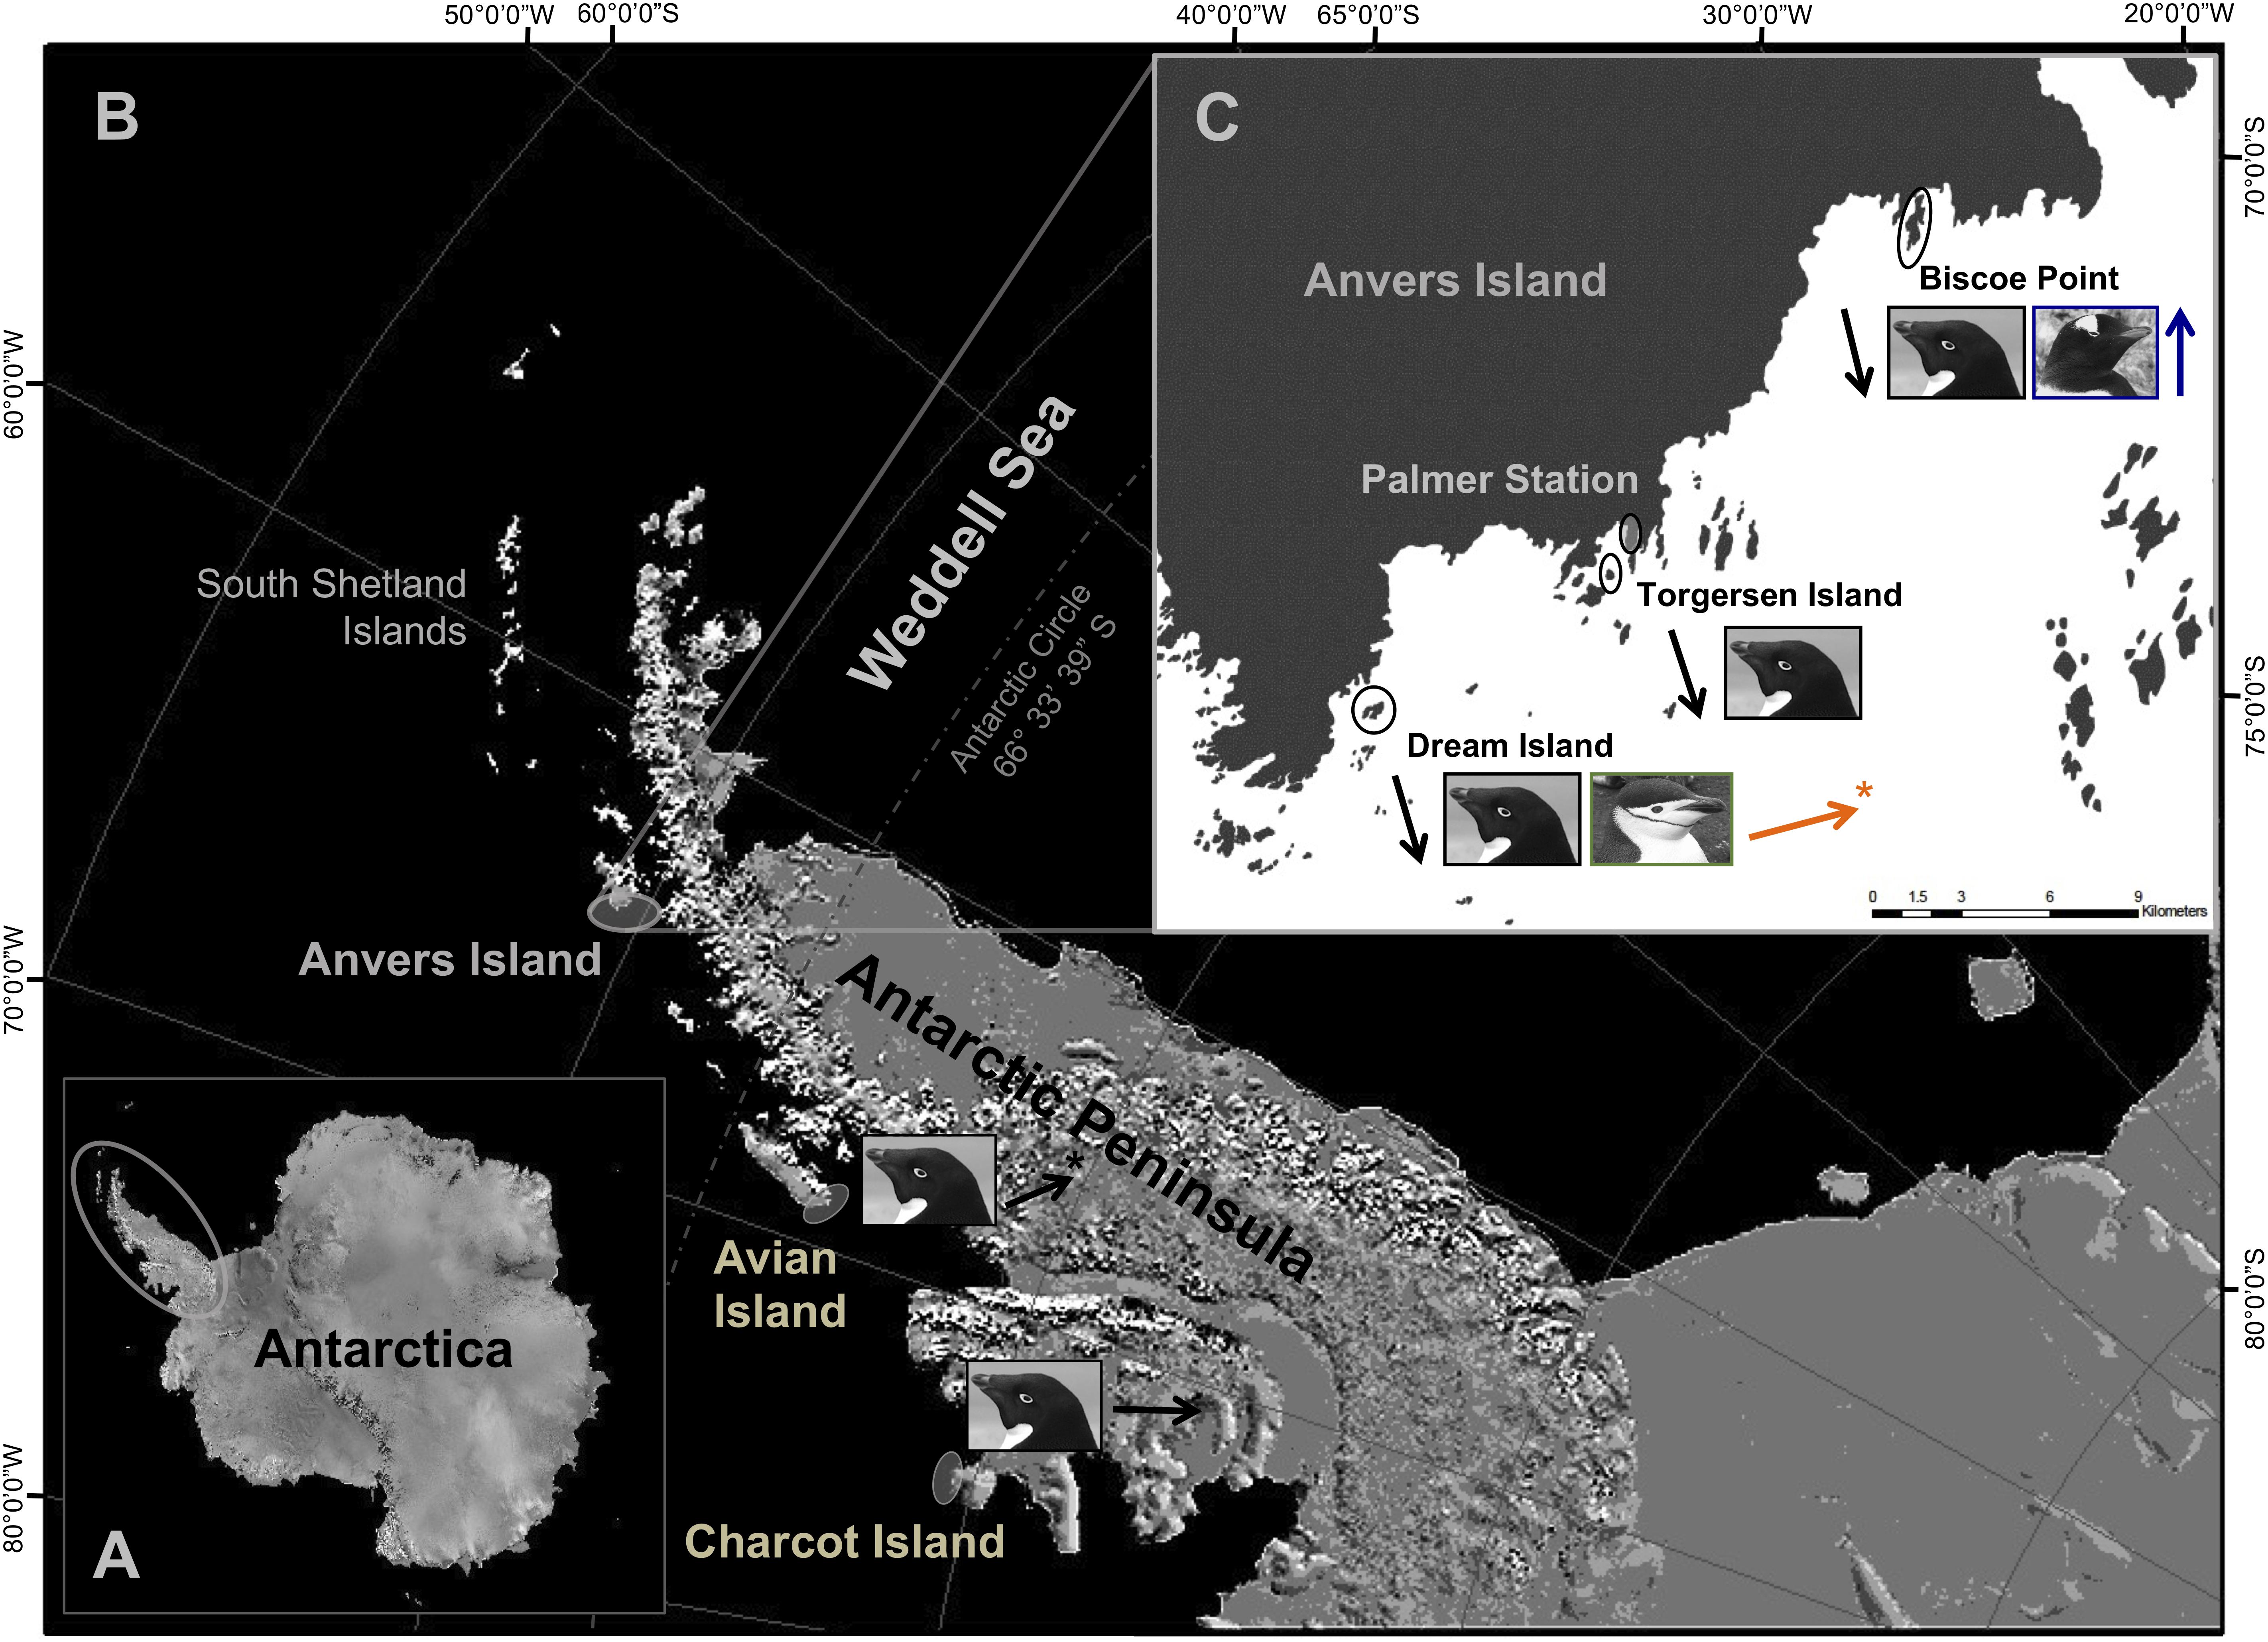
Figure 1. The marine ecosystem west of the Antarctic Peninsula (A) extends from northern Alexander Island (i.e., Charcot Island) to the South Shetland Islands (B). The Scotia Sea extends northeast from the South Shetland Islands (B) to include islands throughout the Scotia Arc (not pictured). Fieldwork was conducted at major penguin breeding colonies within the Palmer Archipelago near Anvers Island, as well as at Avian and Charcot Islands (B,C). Northern penguin colonies were located at Dream [Adélie (■) and chinstrap ( )] and Torgersen (Adélie only) Islands, as well as Biscoe Point [Adélie (■) and gentoo (
 )] (C). Southern Adélie penguin colonies were located approximately 400 and 700 km south of Anvers Island at Avian and Charcot Islands, respectively. Arrows are color coded for each species at breeding colonies and indicate associated breeding population trends [i.e., declining (↓), moderately increasing (
 ,
, ), rapidly increasing (
 ), or stable (→)]. Image generated from base maps provided by the National Snow and Ice Data Center’s map server A-CAP.
Here, we advance the sea ice hypothesis (see Fraser et al., 1992; Trivelpiece et al., 2011) by considering trophic interactions, over a temporal and spatial gradient in sea ice conditions, occurring among populations of all three Pygoscelis penguin species throughout major breeding colonies of the western AP (Figures 1B,C). Study populations represent species at their relative northern, core, or southern breeding distribution in the region that are characterized by long-term divergent population trends (Ducklow et al., 2007, 2013; Forcada and Trathan, 2009). We rely on values of naturally occurring carbon (13C/12C, δ13C) and nitrogen (15N/14N, δ15N) stable isotopes (SI), a time-integrated, biogeochemical parameter that specifically reflects assimilated prey (Deniro and Epstein, 1978, 1981; Peterson and Fry, 1987), as proxies of penguin diet. We examined variation in isotopic diet among breeding adults and their chicks of the sea ice-obligate Adélie penguin, and sea ice-intolerant chinstrap and gentoo penguins along the Palmer Archipelago, near Anvers Island (Figures 1B,C). Here, Adélie penguins occur at their northern breeding range margin along the western AP (Fraser et al., 1992; Polito et al., 2011a), which has contracted given extensive population declines of 80% from historical numbers (Ducklow et al., 2007, 2013) and reflects trends for the species throughout other breeding colonies of the region (Trivelpiece et al., 2011; Lynch et al., 2012). Adélie penguin breeding population declines have occurred in association with significant, long-term reductions in annual sea ice coverage within the northern seasonal sea ice zone along the western AP (Jacobs and Comiso, 1997; Ducklow et al., 2007, 2013; Stammerjohn et al., 2008, 2012). Regional environmental warming is also associated with moderate to more rapid breeding population expansions at southern range margins for sympatric nesting chinstrap and gentoo penguins near Anvers Island (Ducklow et al., 2007, 2013). Regional trends for breeding gentoo penguins generally corroborate those of our study population (Lynch et al., 2012). However, chinstrap penguins nesting near Anvers Island represent one of only several stable or increasing regional colonies among many that appear to be declining up to 60% (Carlini et al., 2009; Trivelpiece et al., 2011; Barbosa et al., 2012; Lynch et al., 2012; Strycker et al., 2020).
Annual sea ice coverage increases with higher latitude along the western AP (Ducklow et al., 2007; Stammerjohn et al., 2008). Importantly, breeding ranges of chinstrap and gentoo penguins do not extend into these sea ice-dominated regions. However, major Adélie penguin breeding colonies are located at Avian and Charcot Islands (Schofield et al., 2013) within the species core to more southern distribution along the western AP, respectively (Figure 1B; see also Lynch and LaRue, 2014). Here, breeding populations of Adélie penguins have increased at Avian Island (Sailley et al., 2013; W. R. Fraser unpubl. data) or appear stable at Charcot Island based on currently available census data (Henderson, 1976; W. R. Fraser unpubl. data).
Progress in understanding marine environmental drivers of Pygoscelis penguin demography has been hindered by a staunch focus on Antarctic krill as the only critical trophic link between penguins and sea ice variability in this region of the Southern Ocean. Thus, we evaluated annual and regional variation in isotopic diet during the reproductive period among populations of Pygoscelis penguins nesting throughout the western AP to test the hypothesis that breeding populations with divergent trends, i.e., declining or increasing, are reliant on differing food webs (hereafter sea ice trophic interaction hypothesis) as dietary variation can contribute to differences in survival and subsequent recruitment probability of chicks to their natal breeding population (e.g., Ainley et al., 2018), and ultimately population changes (Fraser et al., 1992; Trivelpiece et al., 2011). To address this overarching hypothesis, we explored a suite of food web correlates using δ13C and δ15N SI metrics including (1) dietary analysis based on δ13C and δ15N values of penguin blood tissue throughout four stages of the reproductive period, (2) trophic position of crèched penguin chicks based on a Bayesian analysis of δ15N values of chick blood tissue and a primary food web consumer (Antarctic krill), (3) Bayesian analysis of the proportion of diet items provisioned to crèched penguin chicks using mixing models based on δ13C and δ15N values of chick blood tissue and key penguin prey items, and finally (4) a Bayesian analysis of dietary niche width based on δ13C and δ15N values of crèched chick blood tissue calculated as standard ellipse area (SEA-B).
We predicted that (1) blood tissue of adult Pygoscelis penguins breeding at northern colonies near Anvers Island, which integrates dietary information over approximately the previous 30–60 days given allometric turn-over rates for the cellular fraction of blood (Hobson and Clark, 1992; Bearhop et al., 2002, 2006; Cherel et al., 2007; Barquete et al., 2013), would be isotopically distinct during primary reproductive effort (i.e., egg laying) given the differing associations each species’ late winter foraging areas have with sea ice habitats (Fraser et al., 1992; Williams, 1995; Ainley, 2002; Tanton et al., 2004; Trivelpiece et al., 2007). However, we predicted that isotopic values of blood tissue of Pygoscelis chicks reared from these same northwestern AP colonies would become increasingly similar over the breeding season as the isotopic values of the chicks change from those reflective of egg nutrients to those of the prey provisioned to growing chicks (e.g., Sears et al., 2009) and all three species are central place foragers that rely on local prey generally dominated by Antarctic krill (Volkman et al., 1980; Fraser and Hofmann, 2003; Polito et al., 2011b; Trivelpiece et al., 2011). Conversely, we expected that Adélie penguin chicks reared from southwestern AP colonies at Avian and Charcot Islands, where winter sea ice coverage is more prominent, would have higher isotopic values relative to conspecifics reared at Anvers Island as crystal krill (Euphausia crystallorophias) and neritic (i.e., notothenoid) fishes that have life history affinities for the presence of sea ice are critical components of energy transfer to higher trophic levels in this region (Donnelly and Torres, 2008; W. R. Fraser unpubl. data), and have higher isotopic values relative to Antarctic krill (Polito et al., 2011b, see also Table 1).
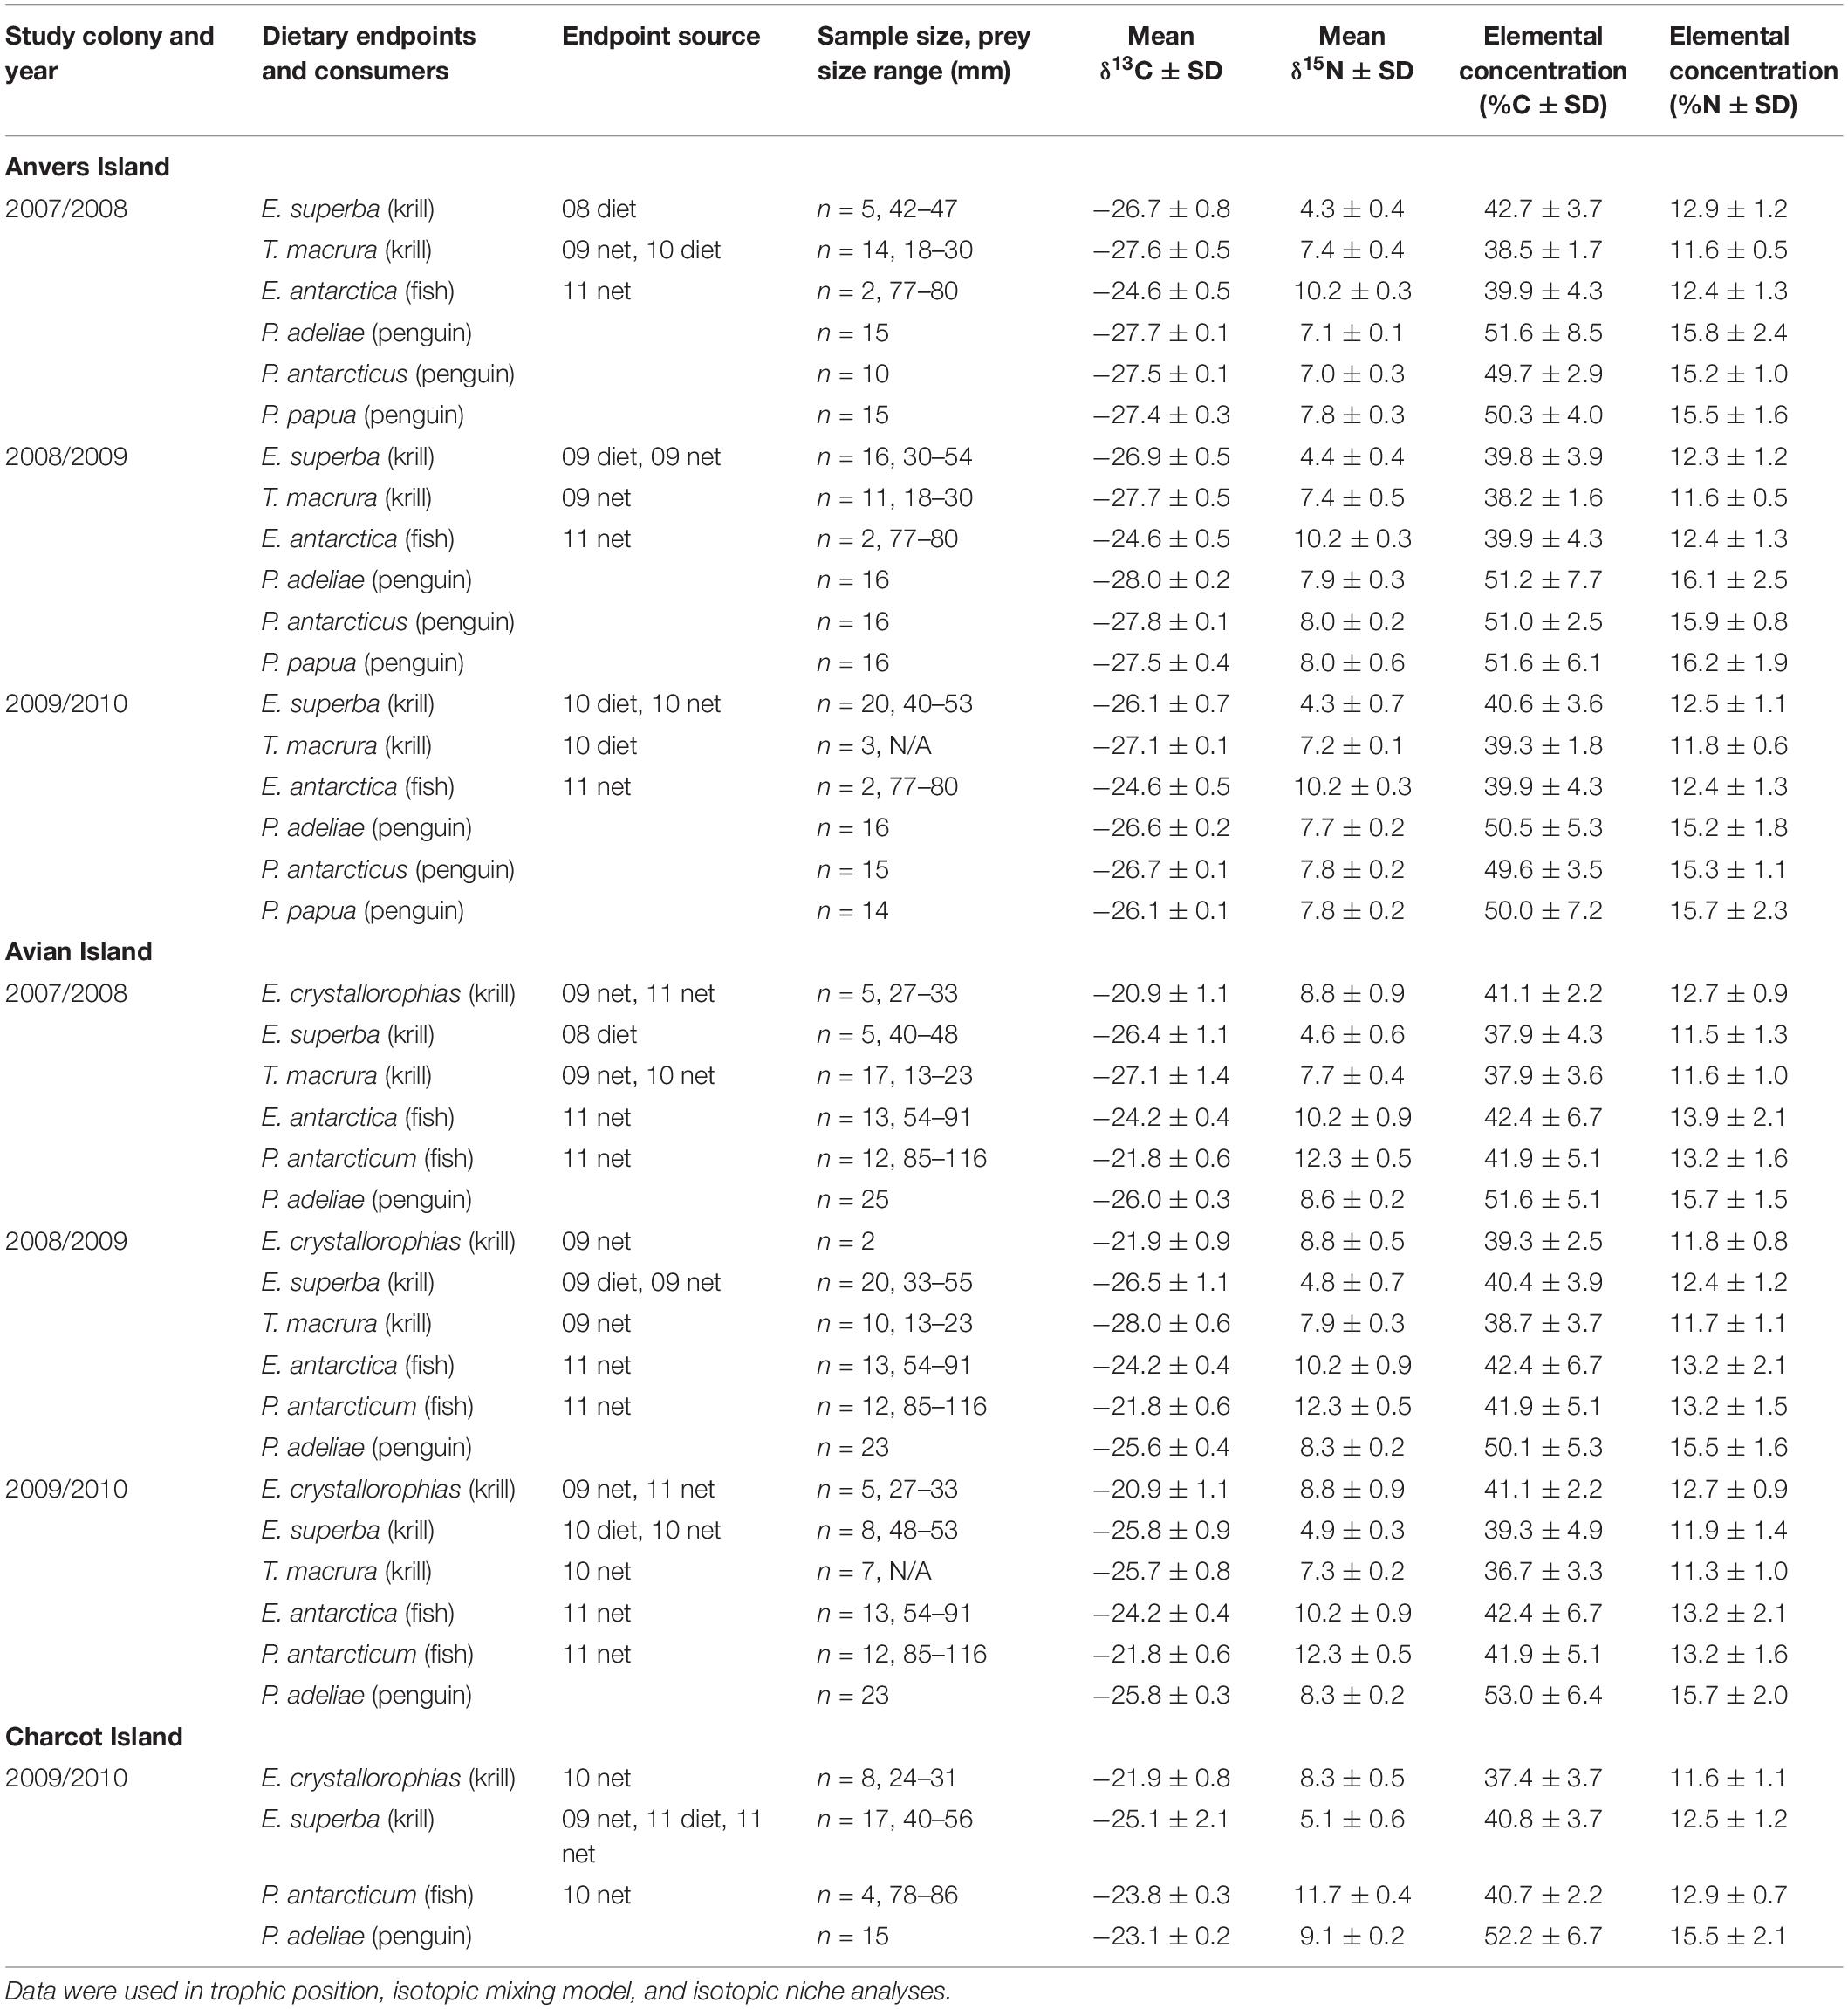
Table 1. Mean stable isotope [δ13C and δ15N ± standard deviation (SD)] values and elemental concentrations of dietary endpoints and red blood cell tissue of Pygoscelis penguin chicks.
The above predictions were extended to analyses of (2) trophic position, (3) the proportions of prey provisioned to older penguin chicks, and (4) dietary niche width of crèched Pygoscelis penguin chick blood tissue. Our focus on older chicks at 5 weeks of age for these analyses stems from the fact that these individuals are considered a demographically important group within the context of population change (Fraser and Hofmann, 2003; Hinke et al., 2007; Trivelpiece et al., 2011). We predicted that 5-week-old crèched Pygoscelis penguin chicks at Anvers Island would occupy similar trophic positions due to the similar reliance on local prey across species during nesting. Likewise, the proportion of diet items provisioned to crèched penguin chicks at Anvers Island were predicted to be similar across species within each season. However, crèched Adélie penguin chicks were predicted to occupy higher trophic positions at southern breeding colonies due to the reliance on prey such as crystal krill and notothenoid fishes in regions with greater sea ice coverage along the western AP. Similarly, increased proportions of prey items associated with high Antarctic marine food webs were predicted to be provisioned to penguin chicks at southern breeding colonies. Finally, we predicted that dietary niche width of crèched penguin chicks would be similar across each species breeding at Anvers Island due to a reliance on similar prey items. However, crèched Adélie penguin chicks at southern colonies were predicted to have a larger dietary niche width given the importance of higher trophic position prey in these regions to penguin predators. See Supplementary Text 1 for specific details regarding each analysis.
Materials and Methods
Field Methods
Pygoscelis penguins nesting on several islands within the Palmer Archipelago west of the AP near Anvers Island (Figures 1B,C) were studied during the austral summers of 2007/2008, 2008/2009, and 2009/2010. Specifically, study nests were located on Biscoe Point, Torgersen, and Dream Islands (Figure 1C). Each study season, Adélie penguin study nests (n = 30) were distributed equally between the three study islands, with 10 nests located on each island. Gentoo penguin study nests (n = 30) were all located on Biscoe Point, while chinstrap penguin study nests (n = 15) were all located on Dream Island (Figure 1C). The reduced sample size for chinstraps was due to the overall smaller number of individuals breeding at colonies on Dream Island. During annual oceanographic research cruises aboard the A.R.S.V. Laurence M. Gould in January of each study year, as part of the Palmer Station Antarctica, Long-Term Ecological Research Program (PAL-LTER), we further sampled Adélie penguin chicks from colonies at Avian (n = 25) and Charcot (n = 15) Islands (Figure 1B).
Each season, study nests, where pairs of adults were present, were individually marked and chosen before the onset of egg laying and monitored. When study nests were found at the one-egg stage, both adults were captured to obtain blood samples for SI analysis. At the time of capture, each adult penguin was blood sampled (∼1 ml) from the brachial vein. After handling, individuals at study nests were further monitored to ensure the pair reached clutch completion (i.e., two eggs). Study nests were monitored for hatch of the first egg. At day 6 and 16 post-hatch for first chicks, resulting in an approximate average nest age of 5 and 15 days given hatching asynchrony, offspring from study nests were captured, blood sampled (≤∼500 μl for day 5 chicks, and ≤∼1 ml for day 15 chicks) to obtain blood samples for SI analysis, and individually marked on the side of their body (under the flipper) using a non-toxic All Weather Paintstik (i.e., cattle marker). Study nests were monitored for chick survival to 25 days, prior to crèche. At 5 weeks into chick-rearing, based on a seasonal population average hatch date for each species, older crèched chicks of all three species at colonies near Anvers Island were captured and blood sampled. Adélie penguin chicks at Avian Island were sampled on the same day Anvers Island Adélie penguin chicks were sampled. Adélie penguin chicks at Charcot Island, sampled during one season only on 25 January 2010, were handled 3 days after Anvers Island and Avian Island Adélie penguin chicks were sampled that year. Blood samples from crèched chicks (∼1 ml) were taken from the brachial vein to obtain blood tissue for SI analysis. Blood samples from adults and older crèched chicks were obtained using a sterile 3 ml syringe and heparinized infusion needle. Young chicks were blood sampled from the tarsus vein using a sterile needle and heparinized capillary tubes (5-day-old chicks) or infusion needles (15-day-old chicks). All collected blood was stored in 1.5 ml microcentrifuge tubes and kept cool in the field until further processing.
Food web samples including primary prey items of penguins such as myctophid, i.e., lanternfish (Electrona antarctica), and notothenoid, i.e., Antarctic silverfish (Pleuragramma antarcticum), fishes as well as three species of euphausiids including Antarctic krill, Thysanoessa macrura, and crystal krill were primarily collected during a PAL-LTER oceanographic cruise in January 2009. Additional samples were obtained during seasonal diet sampling that occurred each year as part of PAL-LTER monitoring activities, as well as oceanographic cruises in January of 2010 and 2011 to increase sample sizes for some taxa. Zooplankton were sampled using oblique tows of 1 m × 1 m frame net (300 μm mesh) towed to a depth of approximately 300 m or a 2 m × 2 m frame net (700 μm mesh) towed to a depth of approximately 120 m. Food web samples were collected along PAL-LTER regional study grid lines in association with colonies at Anvers (600 – 500 lines), Avian (200 – 100 lines), and Charcot (000 to −100 lines) Islands (Figures 1B, 2A) to obtain a representative sample of prey items (see Table 1) known to be provisioned to chicks based on the general distribution of prey from traditional diet sampling (i.e., stomach lavage) of reproductive adults (see Supplementary Table 1 for traditional diet composition of study populations, see also long-term penguin diet datasets within the PAL-LTER data system)1. No statistical differences were detected in the isotopic values between food web items collected via net tows versus those obtained from diet samples.
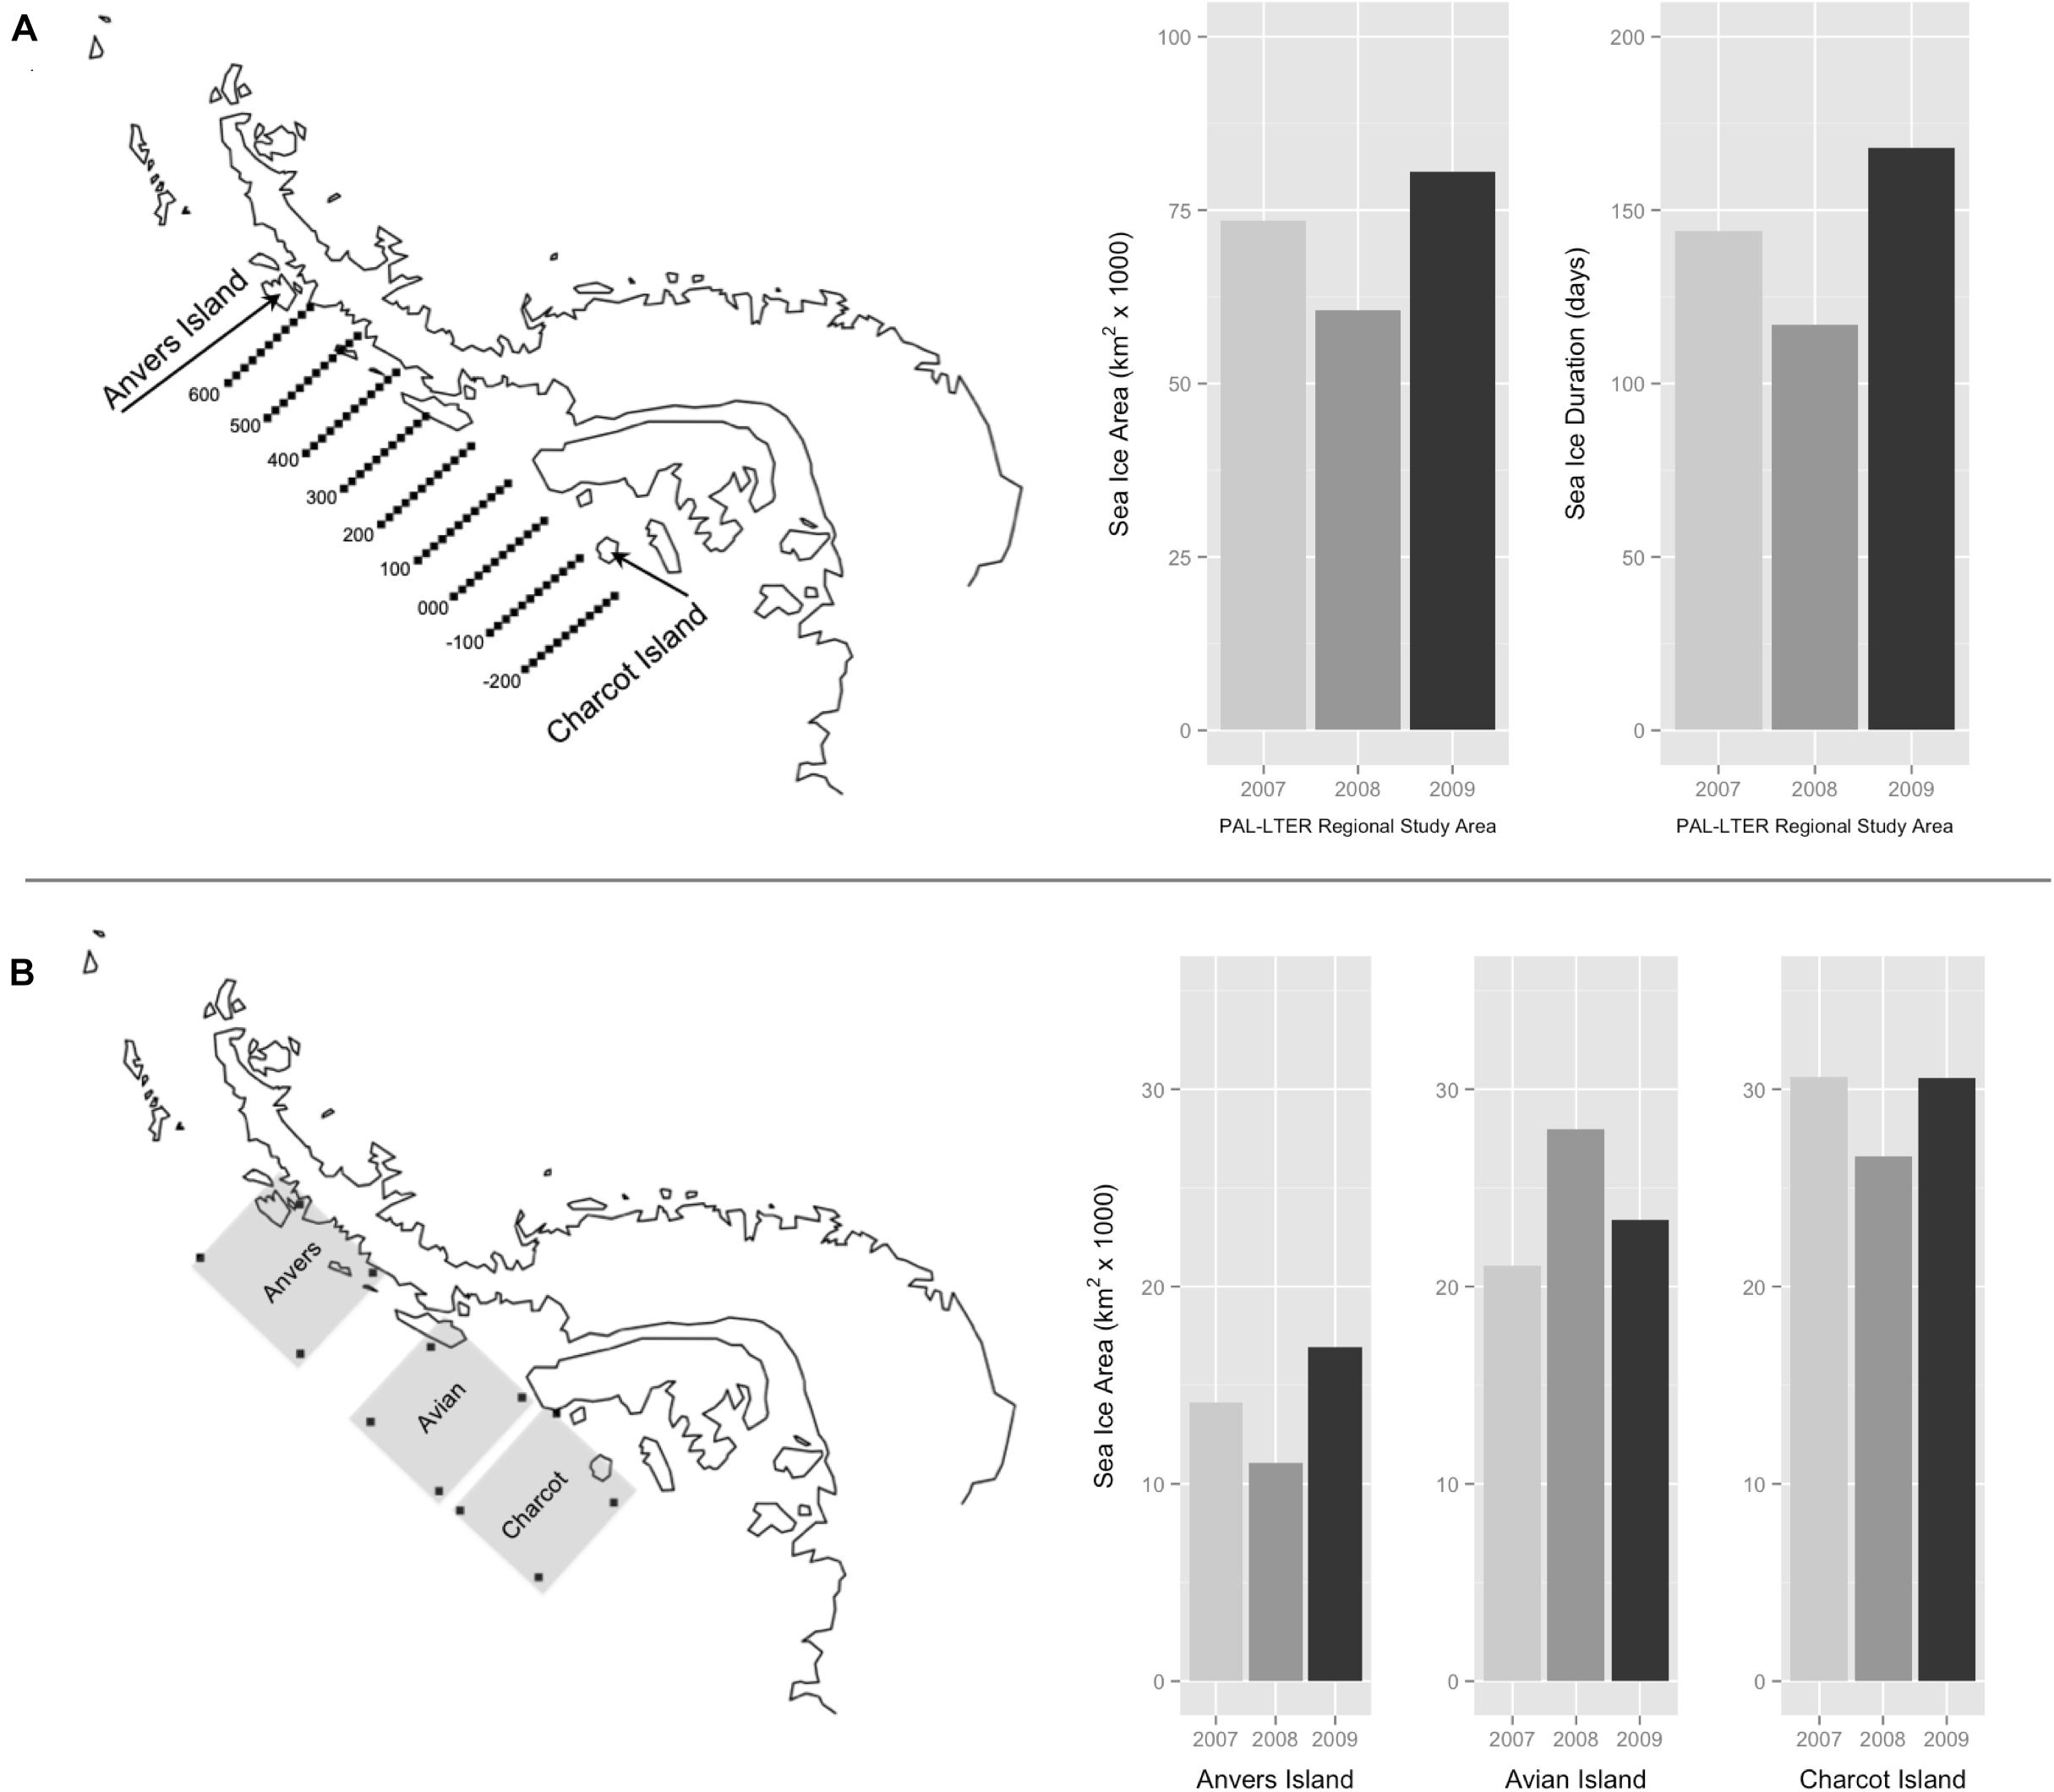
Figure 2. Palmer Long Term Ecological Research (PAL-LTER) program’s regional study area west of the Antarctic Peninsula, extending 800 km from Anvers Island (600 line) to Charcot Island (–200 line) and 220 km inshore to offshore (A). Winter average sea ice area (km2) and sea ice duration (days) within the PAL-LTER regional study area for each year of the study (A). Penguin foraging grids (200 km2) of Anvers, Avian, and Charcot Islands west of the Antarctic Peninsula (B). Winter average sea ice area (km2) within regional penguin foraging grids for each year of the study (B).
Sea ice data were based on satellite estimates of sea ice concentration (SIC) within two regions, (1) the PAL-LTER regional study grid (Figure 2A) and (2) three 200 km2 penguin foraging grids associated with major penguin rookeries at Anvers, Avian and Charcot Islands (Figure 2B). Daily and monthly time series of SIC were used to calculate two metrics within the PAL-LTER regional grid, (1) average winter sea ice area (km2) representing the yearly average area of the ocean covered by winter sea ice, and (2) duration (days) representing the yearly total length of the winter sea ice season. For the 200 km2 penguin foraging grids, the only sea ice metric calculated was average winter sea ice area within each foraging grid. Sea ice metrics were calculated using time series based on Version 2 of the Goddard Space Flight Center (GSFC) Bootstrap algorithm (Comiso, 1999) provided by the United States National Snow and Ice Data Center (NSIDC)2, and derived based on monthly averages between the winter months of sea ice advance and retreat, and the day of first and last appearance of sea ice within the same region and averaged for the PAL-LTER grid. These metrics are useful for describing both the winter spatial and temporal variability of Southern Ocean sea ice (Stammerjohn et al., 2008).
Laboratory Methods
Within 12 h of field collection, tubes containing whole blood were centrifuged to separate plasma and red blood cell (RBC) fractions, which were stored separately and frozen at −80°C. Collected food web items were also stored frozen at −80°C.
Samples of krill and fish were first thawed and rinsed with double-distilled water (ddH2O). Samples of whole krill and fish, along with tubes containing RBCs, were allowed to dry to a consistent mass in a drying oven at 60°C. Dried krill, fish, and RBCs were homogenized into a powder using a clean, dry mortar and pestle. Lipids of homogenized krill and fish samples were removed prior to SI analysis using a 2:1 chloroform:methanol by volume solution (Bligh and Dyer, 1959) first for 24 h, and 12 h thereafter until the solvent was clear. Lipid-free krill and fish samples were allowed to dry under the hood and subsequently in a drying oven for 24 h. Lipid-free krill were further treated with 0.1 N HCl for 24 h to remove carbonates in exoskeletons (Soreide et al., 2006) and again dried. RBC samples were not removed of lipids since the plasma portion, which tends to be more lipid-rich than RBC fractions (Bearhop et al., 2000 and references therein), was previously separated and others have shown no need to remove lipids from avian blood tissue (Bearhop et al., 2000; Cherel et al., 2005). Aliquots of lipid- and carbonate-free krill, fish and RBC samples were transferred to 8 mm × 5 mm pressed tin capsules (Elemental Microanalysis) and weighed (∼2 mg) using a microbalance. Samples were analyzed for δ13C and δ15N SI values using an elemental analyzer interfaced with an isotope ratio mass spectrometer at the Stable Isotope Facility, University of California, Davis. Data expressed as δ13C or δ15N were calculated using the following equation: δ13C or δ15N = [(Rsample/Rstandard)−1] × 1000, where Rsample is the ratio of the heavy to light isotope for either 13C/12C or 15N/14N, and Rstandard is the heavy to light isotope ratios for international standards, Vienna PeeDee Belemnite for carbon and atmospheric N2 (Air) for nitrogen. Raw δ values were normalized on a two-point scale using glutamic acid reference materials [i.e., USGS-40 (δ13CVPDB–LSVEC = −26.39 ± 0.04‰, δ15NAIR = −4.52 ± 0.06‰), USGS-41 (δ13CVPDB–LSVEC = +37.63 ± 0.05‰, δ15NAIR = +47.57 ± 0.11‰)]. Based on replicates of a laboratory standard (bovine liver, n = 31), the measurement error (SD) for each run was ±0.06‰ (n = 2), ±0.03‰ (n = 6), ±0.07‰ (n = 4), ±0.04‰ (n = 8), ±0.09‰ (n = 3), ±0.09‰ (n = 6), ±0.05‰ (n = 2) for δ13C. The within run measurement error for δ15N was ±0.23‰ (n = 2), ±0.13‰ (n = 6), ±0.43‰ (n = 4), ±0.12‰ (n = 8), ±0.15‰ (n = 3), ±0.17‰ (n = 6), ±0.05‰ (n = 2). Across all runs, the laboratory standard measurement error was ±0.06‰ for δ13C and ±0.20‰ for δ15N. Measurement error based on the analysis of replicate krill samples (n = 6) collected for this study was ±0.16‰ for δ13C and ±0.08‰ for δ15N. Importantly, sodium heparin does not alter the stable isotope values of blood tissue (Hobson et al., 1997; Lemons et al., 2012).
Statistical Methods
Isotopic Dietary Analysis (IDA)
Statistical analyses were delineated by reproductive stage and location, and were performed in the R language environment (R Core Team, 2020). Pygoscelis adult and crèched chick analyses at Anvers Island (IDA analyses 1 and 4) employed least-squares general linear models (hereafter LM) to examine continuous variation in δ13C and δ15N SI values in relation to two parameters treated as main effects including (1) species and (2) year, both treated as categorical variables. An a priori set of five candidate models consisted of an equal-means (null) model, each predictor variable as a main effect (two models), a multiple predictor model that included both main effect parameters (one model), and an interaction model including both main effect parameters and their interaction (one model). This same candidate model set was evaluated for each isotope separately using unique datasets for each reproductive stage (Pygoscelis adults: n = 296 for both δ13C and δ15N analyses, Pygoscelis crèched chicks: n = 133 for both δ13C and δ15N analyses). For each candidate model, Akaike’s Information Criterion (AICc), corrected for small sample size, in addition to ΔAICc and Akaike weight (w) values were calculated and used to compare models (Burnham and Anderson, 2002). An R2 value was also calculated, defined as the fraction of the total variance explained by the model and given by the Multiple R-squared calculation in R (Crawley, 2007), to provide a measure of fit for each model. Inference was based on the relative support for parameters across all models and weighted parameter estimates (i.e., model averaging). Parameter estimation included calculation of model-averaged parameter estimates based on w values for all candidate models. Standard errors for parameter estimates were based on unconditional variances calculated across the same models. Parameter likelihood values were evaluated by summing w values across all models that included each parameter under consideration (Burnham and Anderson, 2002).
Adélie crèched chick analyses at Anvers, Avian, and Charcot Islands (IDA analysis 5) also used LM to examine continuous variation in δ13C and δ15N SI values in relation to two parameters treated as main effects including (1) location and (2) year, both treated as categorical variables. An a priori set of five candidate models considered location and year as main effects following the same model structure described above for IDA analyses 1 and 4. This same candidate model set was evaluated for each isotope separately (n = 132 for δ13C analyses, n = 133 for δ15N analyses). Again, for each candidate model, AICc, ΔAICc, and w values were calculated and used to compare models (Burnham and Anderson, 2002), as well as calculation of an R2 value. Inference was based on model averaging with parameter estimation following that described previously.
Pygoscelis chick analyses at 5 and 15 days of age (IDA analyses 2 and 3) employed linear mixed effects models (hereafter LME) using the nlme package in R (Pinheiro et al., 2019) to examine continuous variation in δ13C and δ15N SI values in relation to two parameters treated as fixed main effects including (1) species and (2) year, both treated as categorical variables. An a priori set of five candidate models consisted of an equal-means (null) model, each predictor variable as a fixed main effect (two models), a multiple predictor model that included both fixed main effect parameters (one model), and an interaction model including both fixed main effect parameters and their interaction (one model). This same candidate model set was evaluated for each isotope separately (Day 5: n = 223 for both δ13C and δ15N analyses, Day 15: n = 202 for both δ13C and δ15N analyses). A random effect of nest on intercept (random = ∼1| nest) was included in all candidate LME models to control for non-independence of data given that sibling chicks were sampled and presumably more similar in isotope values. Again, for each candidate model, AICc, ΔAICc, and w values were calculated and used to compare models (Burnham and Anderson, 2002). Inference was based on model averaging with parameter estimation following that described previously. The random effect of nest on intercept was included based on results from preliminary analyses that compared the fit (i.e., AICc value) of two models for each isotope: the most parameterized fixed effect model, both with and without, the random effect. A linear generalized least squares (GLS) model was fit without a random effect where the restricted log-likelihood was maximized (method = REML). A LME model was also fit with a random effect of nest on intercept, again maximizing the restricted log-likelihood. Both models included the same fixed main effect parameters and their interaction. For each isotope (δ13C and δ15N) and reproductive stage (5 or 15 days of age) it was determined that inclusion of the random effect provided a better fit to the data as AICc values were minimized for LME models.
For each analysis described above, we discuss yearly variation in penguin SI values within the context of qualitative variation in the previous winter’s average sea ice coverage, i.e., low, intermediate, or high. We made no a priori predictions regarding relationships between penguin SI values and winter sea ice coverage as isotopic studies of the western AP marine ecosystem have not been conducted previously in this context, i.e., across several years and regions at lower and higher latitudes. In general, we expect winter sea ice to be a primary environmental driver of the prey-base encountered by penguins during the breeding season.
Trophic Position Analysis (TPA)
Trophic position of Pygoscelis crèched chicks at a population average of 5 weeks old was calculated for all species, locations, and years using a Bayesian model (tRophicPosition) described by Quezada-Romegialli et al. (2018) implemented in the R language environment (R Core Team, 2020). The model generally follows earlier work (Hobson and Welch, 1992; Hobson et al., 1994; Vander Zanden et al., 1997; Post, 2002) where the trophic position of a consumer can be estimated as λ + (δ15Nconsumer – δ15Nbase)/Δn. Values of δ15N for individual RBCs of Pygoscelis crèched chicks at Anvers, Avian, and Charcot Islands were used for δ15Nconsumer, δ15Nbase was estimated from δ15N values of Antarctic krill collected annually along PAL-LTER regional study grid lines in association with breeding colonies at Anvers, Avian, and Charcot Islands (Table 1), and a λ value for Antarctic krill (trophic position of the baseline) was set at 2.5 following Stowasser et al. (2012) and Schmidt and Atkinson (2016). The one Baseline model was parameterized using the trophic discrimination factors of Post (2002), i.e., 3.4 ± 0.98 SD. Seven individual TPA models were run for 100,000 iterations with a burn in of 20,000 iterations reflecting the need to incorporate different baseline values for year and location considered in the analysis. Trophic position models for Anvers Island included data for all three species of penguin chicks for each year of the study (TPA models 1–3), while models for Avian (TPA models 4–6), and Charcot (TPA model 7) Islands included only data for Adélie penguin chicks during each year. Sample sizes for penguin chick consumers and Antarctic krill baselines used in TPA models are reported in Table 1.
Isotopic Mixing Model Analysis (IMMA)
The MixSIAR package, implemented in R (Stock et al., 2018; R Core Team, 2020), was used to generate quantitative estimates of the proportion of diet items provisioned by adult penguins to 5-week-old crèched chicks of all three species at Anvers Island (IMMA analyses 1–3, 2007/2008: n = 40, 2008/2009: n = 48, 2009/2010: n = 45), and Adélie penguin chicks at Avian (IMMA analyses 4–6, 2007/2008: n = 25, 2008/2009: n = 23, 2009/2010: n = 23), and Charcot (IMMA analysis 7, 2009/2010: n = 15) Islands, for each year of the study, using dual δ13C or δ15N values of key prey items and chick RBCs (see Table 1). Within a Bayesian framework, MixSIAR functions model probability distributions by incorporating sources of variability such as that within isotopic dietary endpoints and consumers, isotopic discrimination, and elemental concentration. For all IMMA models, species was modeled as a fixed effect. Isotopic dietary endpoints were collected annually in association with each regional study colony to describe yearly variation in SI values of 5-week-old crèched chicks reared at those same colonies. For some years and locations, it was necessary to use a dietary endpoint collected in a different year due to difficulty in obtaining some prey species (see Table 1). The various dietary endpoints considered for each major study colony reflected the general distribution of dominant prey based on traditional diet sampling of reproductive adults nesting at Anvers, Avian, and Charcot Islands (W. R. Fraser unpubl. data, see Supplementary Table 1). Of note, long-term monitoring data collected by PAL-LTER was restricted to Adélie penguins only. The work reported here was a first effort to quantify the diet of chinstrap and gentoo penguins nesting within the PAL-LTER study area. Thus, Supplementary Table 1 mainly reports traditional diet information for Adélie penguins. Information on gentoo penguin diets did not begin until 2010, and even later for chinstrap penguins. Mean δ13C and δ15N values of dietary endpoints and associated mean elemental concentrations are reported in Table 1. We calculated isotopic discrimination factors and associated standard deviations (SD) using data based on king penguin (Aptenodytes patagonicus) whole blood and a diet of Atlantic herring (Clupea harengus) and Icelandic capelin (Mallotus villosus) (δ13C: −0.806 ± 0.428 SD and δ15N: 2.067 ± 0.165 SD, Cherel et al., 2005). The same discrimination factors were applied to all prey types. MixSIAR models were run under normal parameters with a chain length of 100,000, a burn in of 50,000, and thinned by 50 using three chains.
Isotopic Niche Analysis (INA)
Functions within the SIBER package (v2.1.5, Jackson et al., 2011) also implemented in R (R Core Team, 2020) were used to generate a Bayesian-derived metric based on the standard ellipse area (SEA-B) of δ13C and δ15N values of chick RBCs (see Supplementary Figure 1) to describe dietary niche width of penguin chicks for each species, location, and year of the study (see Table 1 for sample sizes used in INA analyses 1–7). This Bayesian-derived metric is based on that described by Layman et al. (2007) for the convex hull of isotope data as an estimate of standard ellipse area. Within a Bayesian framework, SIBER functions modeled probability distributions by incorporating sources of variability such as that within the originally derived means of populations. SIBER models were run for one million iterations with a burn in of the first 50,000 iterations, and thinned by 50 using two chains.
Results
Sea Ice
Sea ice metrics indicated that the austral winters preceding each study year were generally characterized by lower than average sea ice coverage, with winter 2008 being the second lowest sea ice season in the Palmer LTER record since 1979 (Stammerjohn et al., 2008, see also sea ice datasets within http://pal.lternet.edu/data/). Relative yearly variability in sea ice area and duration (Figure 2A) over the course of the study suggested that 2007 was an intermediate sea ice season relative to 2008 (low) and 2009 (high). Results for inter-annual variability in dietary niche of adult Pygoscelis penguins at the one-egg stage are discussed within the context of these qualitative differences in each year’s winter sea ice season over the entire PAL-LTER regional study grid (Figure 2A).
Variation in average winter sea ice area across the 200 km2 penguin foraging grids (Figure 2B) confirmed that in general sea ice area increased to the south during the austral winters preceding each study year (Figure 2B). However, this trend was not as strong during the winter of 2008 (Figure 2B) when sea ice area within the Avian Island penguin foraging grid (27,990 km2) was slightly greater than that for Charcot Island (26,608 km2). Yearly variation in average winter sea ice area within penguin foraging grids at Anvers and Charcot Islands confirmed our previous finding based on sea ice metrics calculated over the entire PAL-LTER regional study grid (Figure 2A) that 2007 was an intermediate winter sea ice season relative to 2008 (low) and 2009 (high). This trend was not apparent within the Avian Island penguin foraging grid (Figure 2B) where 2009 was an intermediate winter sea ice season relative to 2007 (low) and 2008 (high). Results for inter-annual variability in isotopic diet of 5-week-old Pygoscelis penguin chicks at all locations are discussed within the context of these qualitative differences in each foraging grid’s winter sea ice season (Figure 2B).
Isotopic Dietary Analysis
Analyses of variation in δ13C and δ15N SI values of Pygoscelis adults at Anvers Island (IDA analysis 1, Figures 1B,C) resulted in only one model receiving a ΔAICc value ≤ 2 for each isotope. The most parsimonious model for each isotope was the global model that included terms for species, year, and an interaction for species × year. Both models received very high w values (1.00 for each isotope) and R2 values (δ13C: 0.91, δ15N: 0.71, Table 2). All other models in the candidate set received no support. Parameter likelihoods indicated strong support for all terms in both analyses (Table 3). On average, adult chinstrap penguins had the highest δ13C and δ15N values, adult Adélie penguins were intermediate, while gentoo penguin adults had the lowest isotope values of the three species at the one-egg stage (Figure 3A and Table 3). Adult Adélie penguins had lower δ13C values, and especially δ15N values, following the 2008 winter of very low sea ice within the PAL-LTER regional study grid (Figures 2A, 3A and Supplementary Figures 2A,B). Conversely, adult gentoo penguins had higher δ15N values, but lower δ13C values, following the 2008 winter of very low sea ice coverage within the PAL-LTER regional study grid (Figures 2A, 3A, Table 3, and Supplementary Figures 2E,F). However, δ15N values of adult gentoo penguins were only slightly lower following the winter of 2009 with the highest sea ice coverage (Figures 2A, 3A, Table 3, and Supplementary Figures 2E,F). Yearly variation in adult chinstrap penguin SI values showed no apparent relationship with over-winter sea ice conditions as adults had higher values for both δ13C and δ15N in the second and third years of the study (Figure 3A, Table 3, and Supplementary Figures 2C,D).
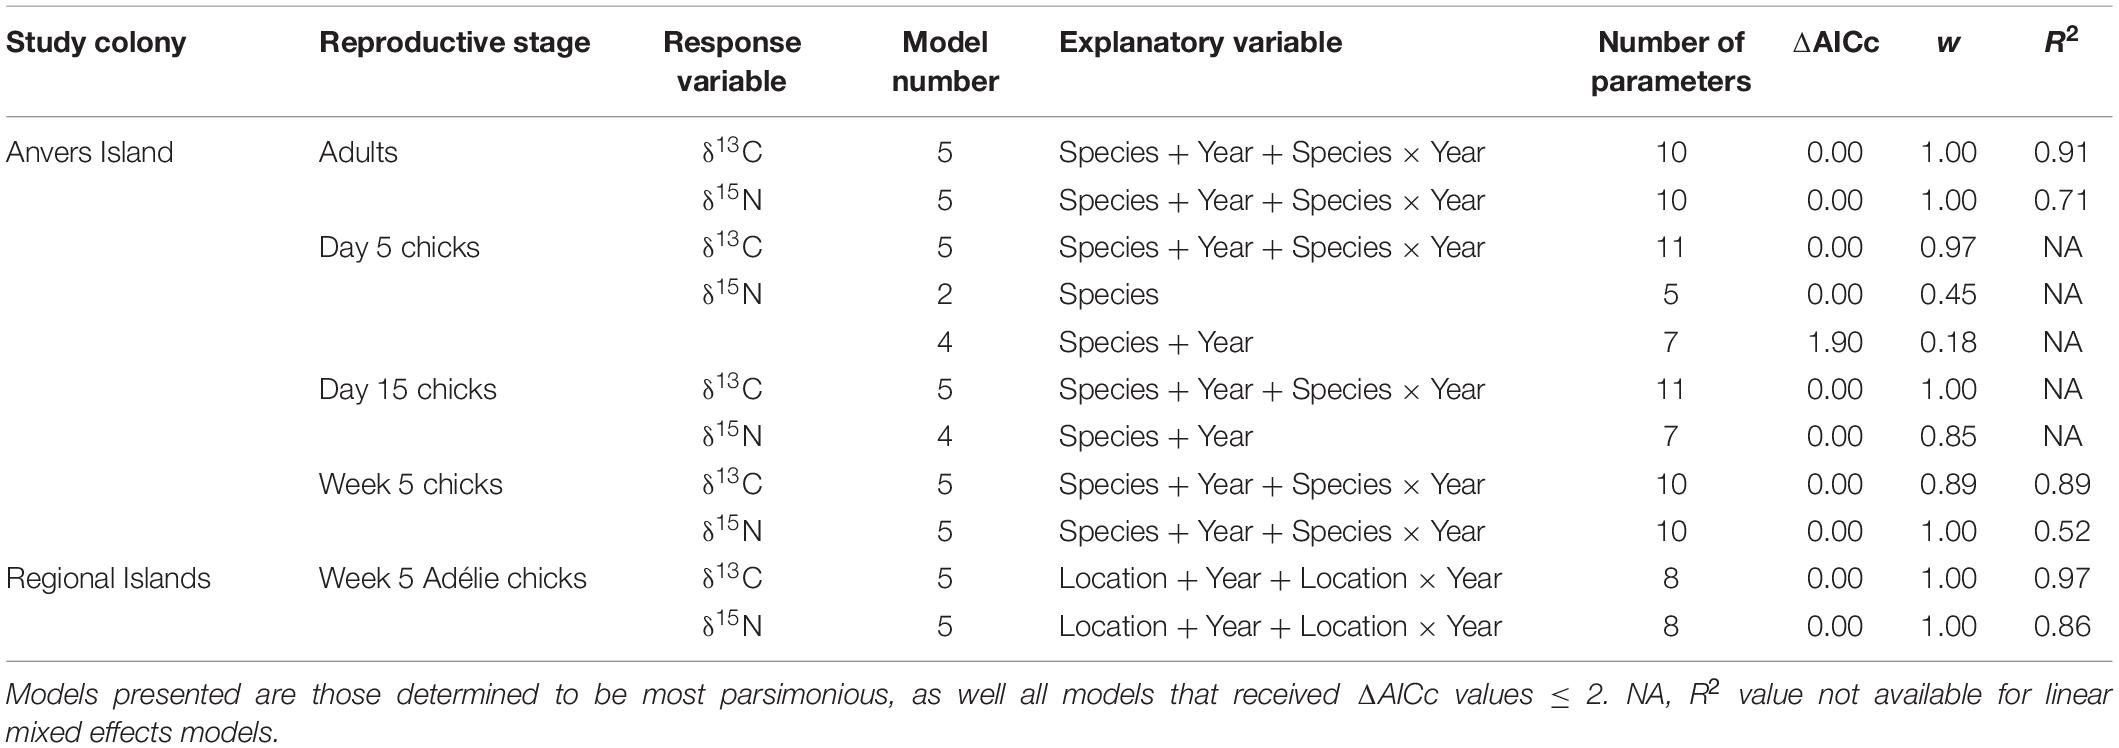
Table 2. Candidate models describing variation in isotopic diet during the reproductive period of Pygoscelis penguins throughout the western Antarctic Peninsula (IDA analyses 1–5).
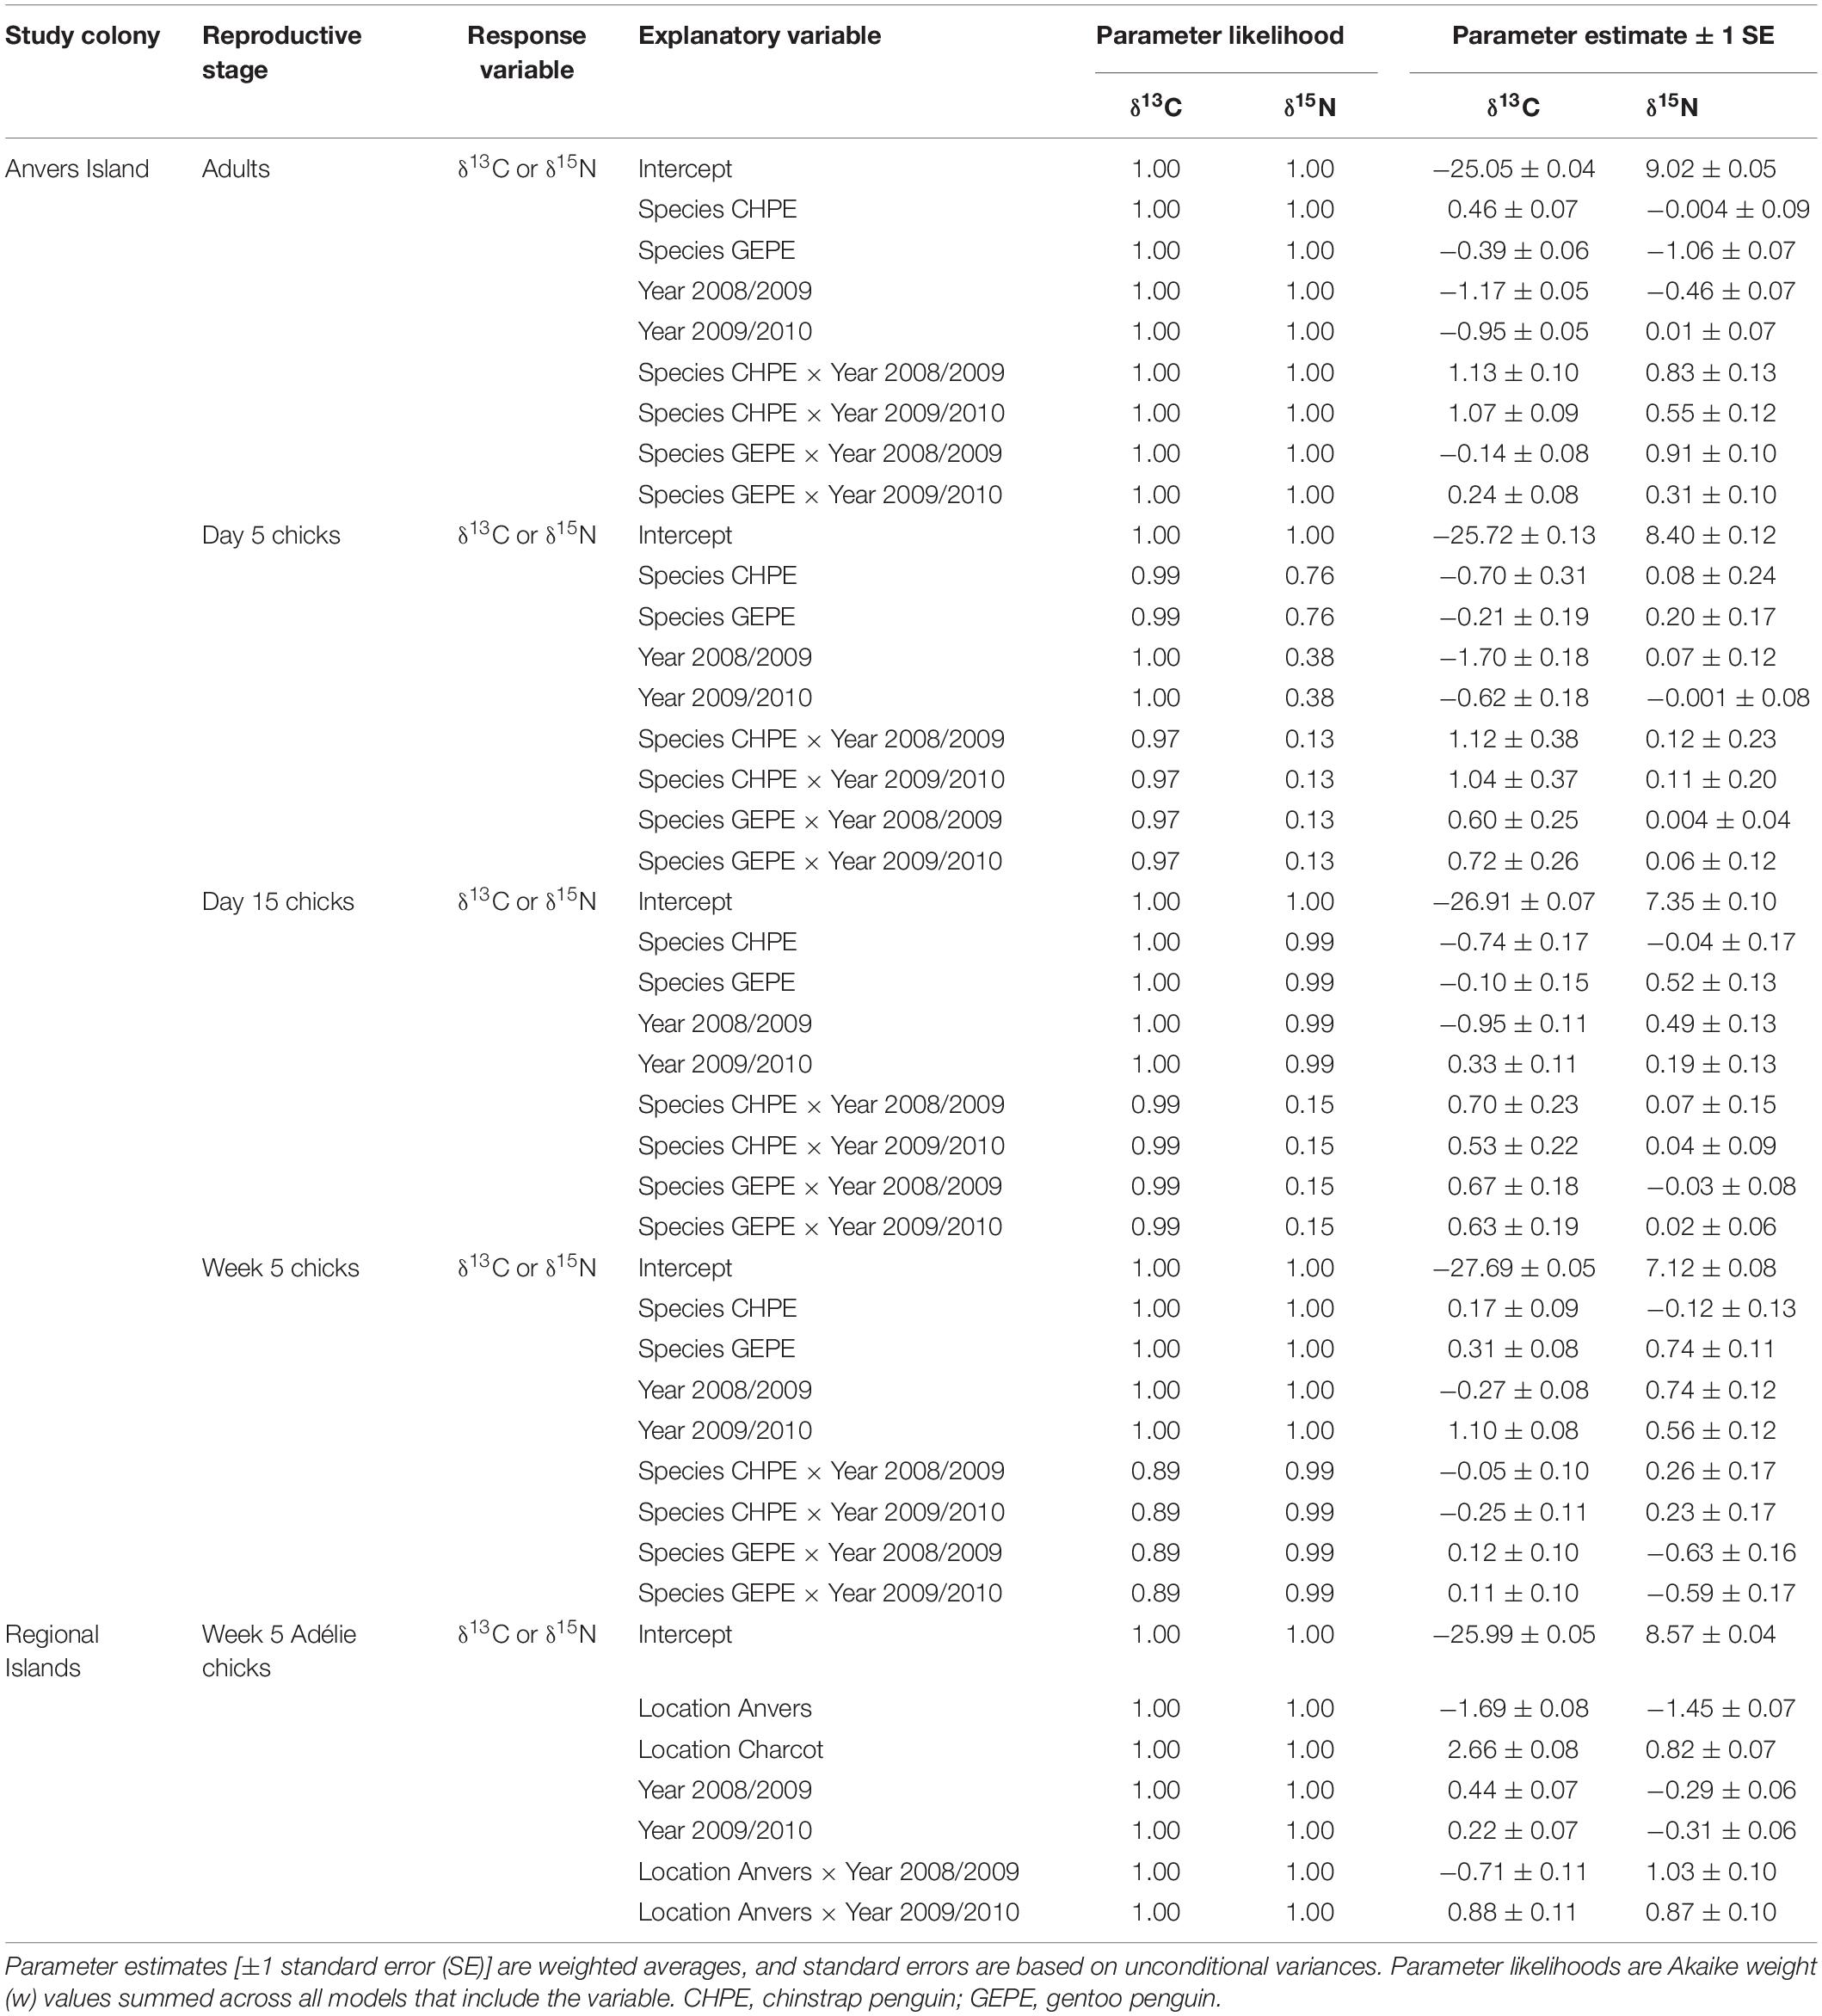
Table 3. Parameter estimates and likelihoods from candidate models describing variation in isotopic diet during the reproductive period of Pygoscelis penguins throughout the western Antarctic Peninsula (IDA analyses 1–5).
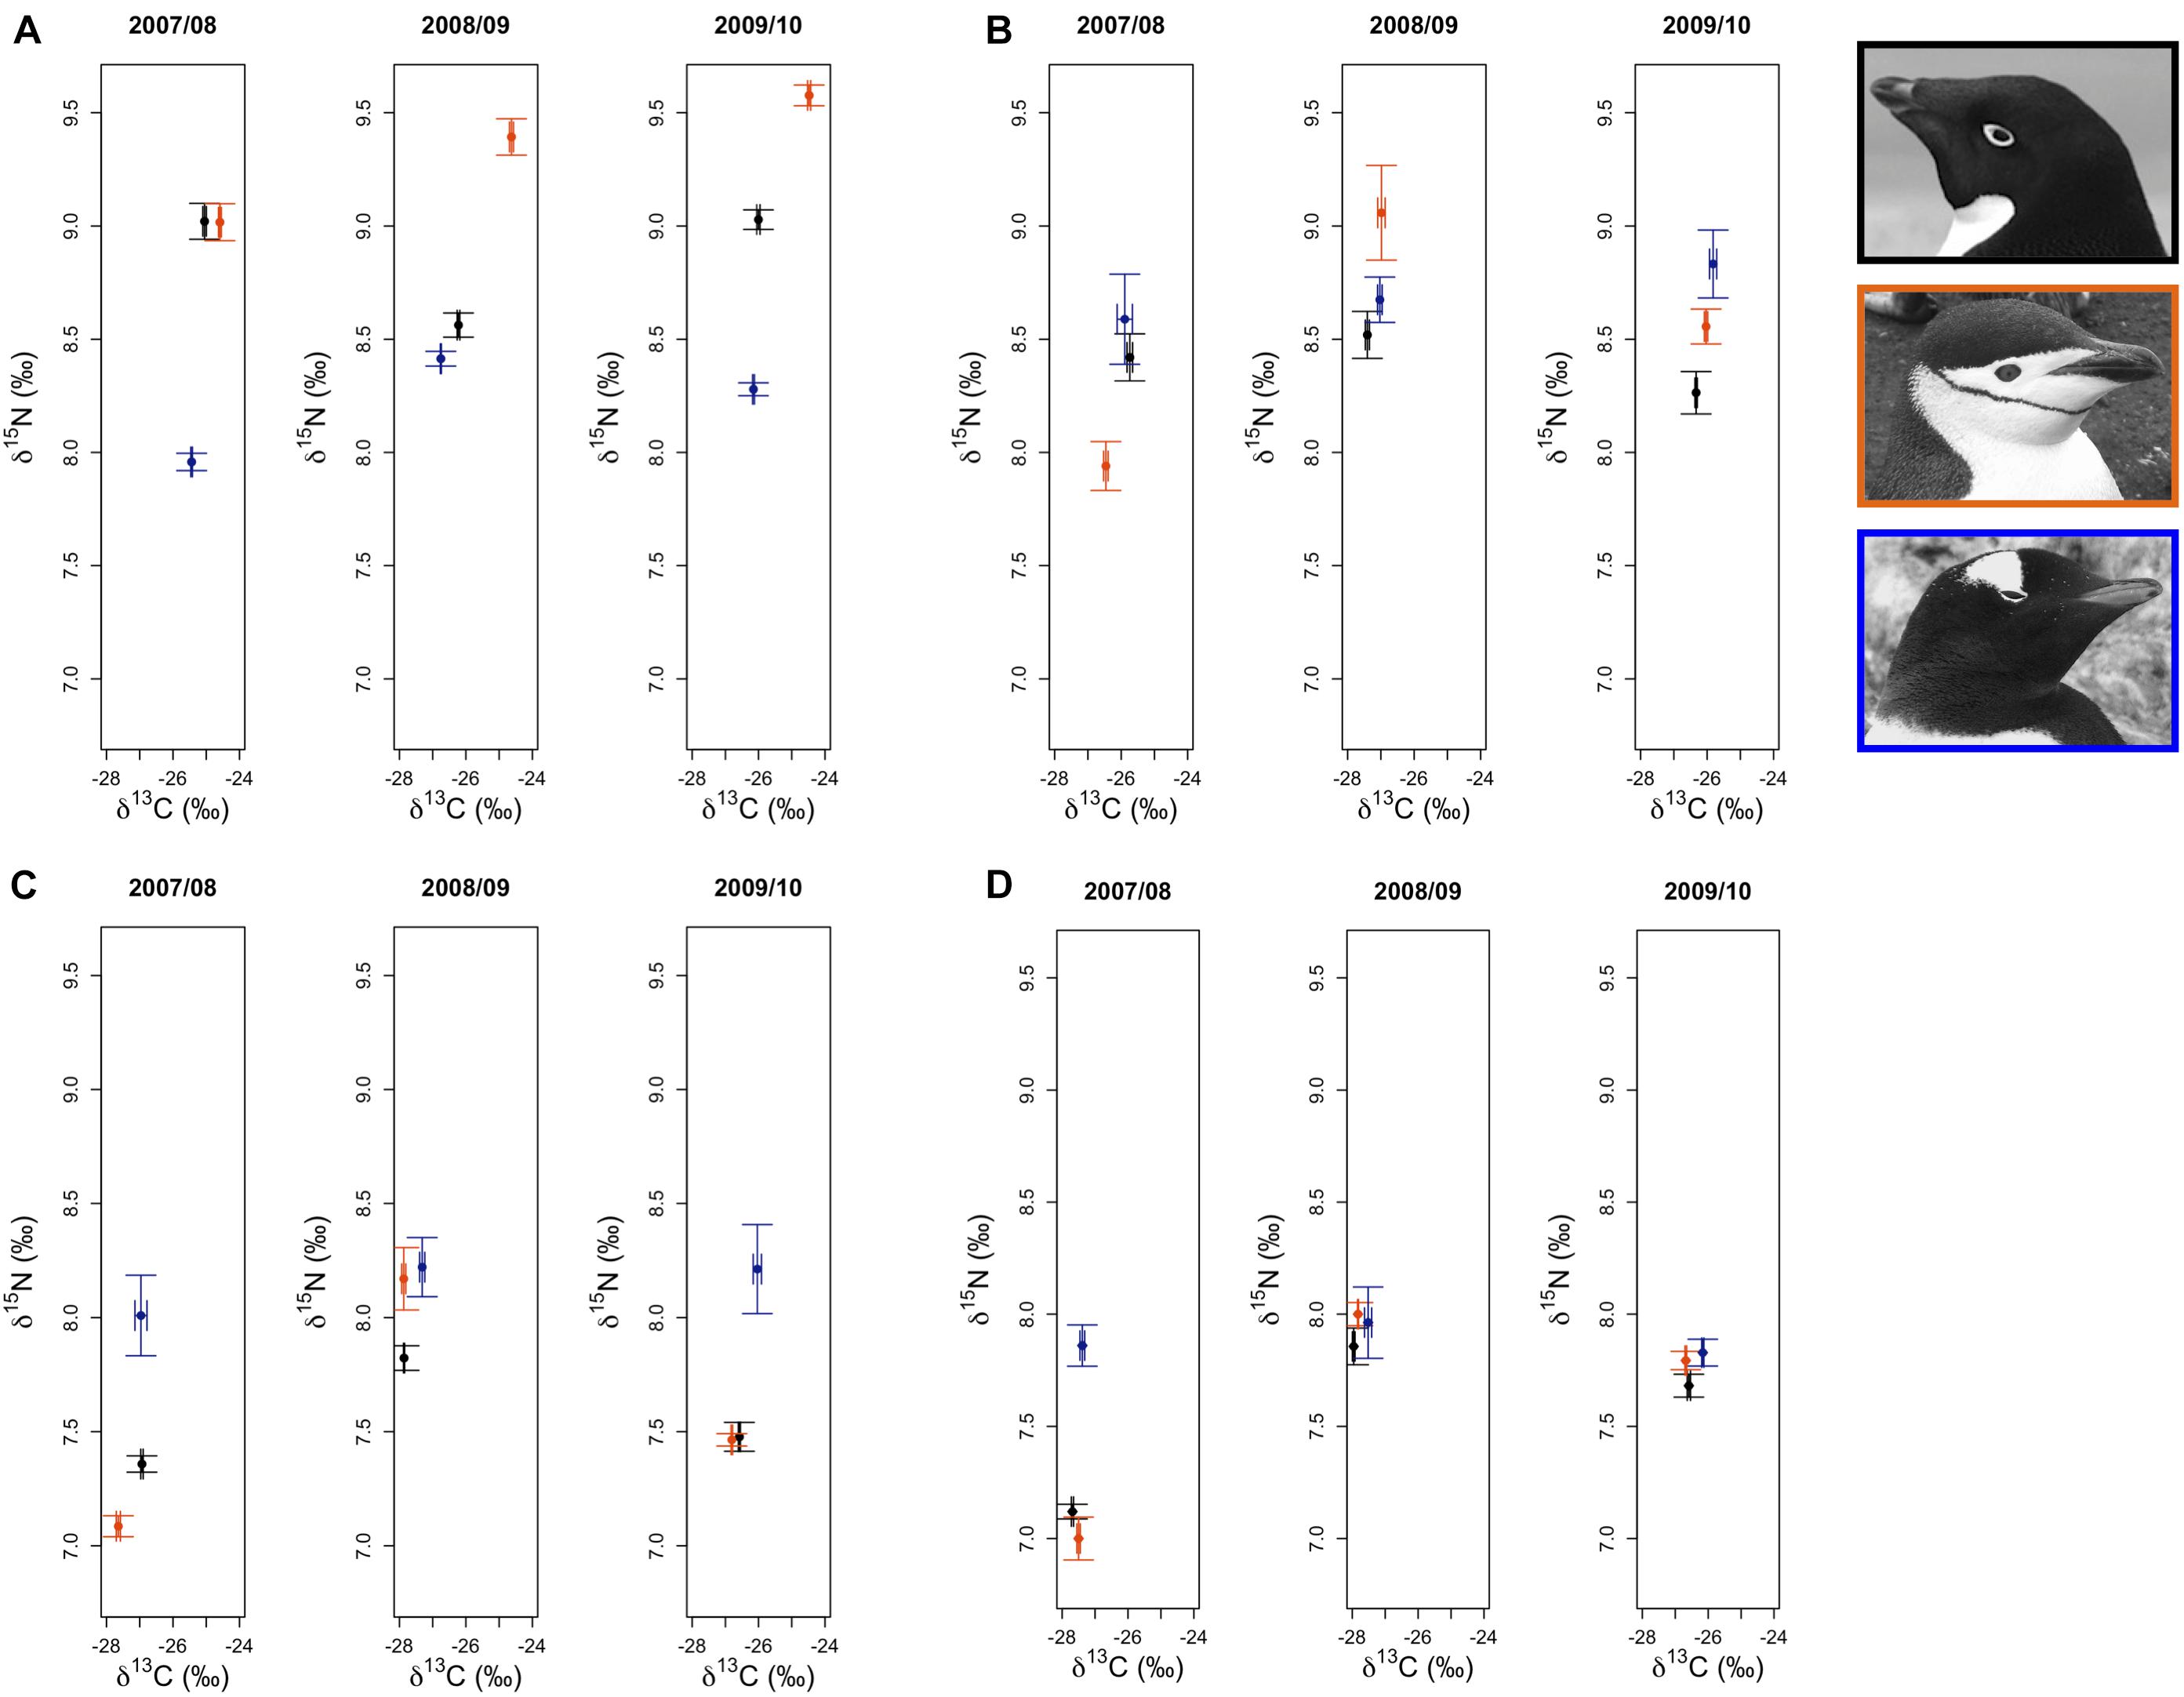
Figure 3. Variation in δ13C and δ15N stable isotope values of Adélie (•), chinstrap ( ), and gentoo (
 ) penguin red blood cell tissue for adults at the one-egg stage (A), and their young chicks at five (B) and 15 (C) days of age, as well as older chicks at a population level age of 5 weeks (D). Average isotope values (±1 standard error) for each species are presented for each year.
Analyses of variation in δ13C values of Pygoscelis chicks at 5 days of age reared at Anvers Island (IDA analysis 2, Figures 1B,C) resulted in only one model receiving a ΔAICc value ≤ 2. Again, the most parsimonious model was the global model that included terms for species, year, and an interaction for species × year. This model received a very high w value (0.97, Table 2). Parameter likelihoods indicated strong support for all these terms (Table 3). For δ15N analyses of Pygoscelis chicks at 5 days of age, two models received ΔAICc value ≤ 2. The best-fit model included a term for species only and received more than two-times the support (w = 0.45) of the next best model (w = 0.18, Table 2). Parameter likelihoods indicated moderately strong support for the species term, weaker support for the year term, and no support for the interaction of species × year (Table 3). On average, 5-day-old Adélie and gentoo penguin chicks had similar δ13C values, while chinstrap penguin chicks had lower δ13C values (Figure 3B and Table 3). Gentoo penguin chicks on average had higher δ15N values than the other species (Figure 3B and Table 3).
Analyses of variation in δ13C values of Pygoscelis chicks at 15 days of age reared at Anvers Island (IDA analysis 3, Figures 1B,C) resulted in only one model receiving a ΔAICc value ≤ 2. The best-fit model was the global model that included terms for species, year, and an interaction for species × year, and received a very high w value (1.0, Table 2). Again, parameter likelihoods indicated strong support for all these terms (Table 3). Analyses of δ15N SI values of 15-day-old Pygoscelis chicks resulted in only one model receiving a ΔAICc value ≤ 2. The best-fit model included terms for species and year only, and received a high w value (0.85, Table 2). Parameter likelihoods indicated strong support for both species and year terms (Table 3). Similar to the 5-day-old chicks, on average, 15-day-old Adélie and gentoo penguin chicks had similar δ13C values, while chinstrap penguin chicks had lower δ13C values (Figure 3C and Table 3). Gentoo penguin chicks on average had higher δ15N values than the other species (Figure 3C and Table 3).
Analyses of variation in δ13C and δ15N values of 5-week-old Pygoscelis crèched chicks reared at Anvers Island (IDA analysis 4, Figures 1B,C) resulted in only one model receiving a ΔAICc value ≤ 2 for each isotope. The most parsimonious model for each isotope was the global model that included terms for species, year, and an interaction for species × year. Both models received very high w values (δ13C: 0.89, δ15N: 1.00) and R2 values (δ13C: 0.89, δ15N: 0.52, Table 2). Parameter likelihoods indicated strong support for all terms in both analyses (Table 3). All species had higher δ13C values in association with greater sea ice coverage within the 200 km2 foraging grid at Anvers Island (Figure 3D and Supplementary Figures 2A,C,E). All species had similar δ15N SI values during the second and third years of the study (Figure 3D).
Analyses of regional variation in δ13C and δ15N values of 5-week-old crèched Adélie chicks reared at Anvers, Avian, and Charcot Island breeding colonies (IDA analysis 5, Figure 1B) resulted in only one model receiving a ΔAICc value ≤ 2 for each isotope. The most parsimonious model for each isotope was the global model that included terms for location, year, and an interaction for location × year. Both models received very high w values (1.00 for each isotope) and R2 values (δ13C: 0.97, δ15N: 0.86, Table 2). Parameter likelihoods indicated strong support for all terms in both analyses (Table 3). Across regional colonies, crèched Adélie penguin chicks had higher δ13C and δ15N values at more southern colonies (Figure 4, Table 3, and Supplementary Figures 2A,B,G,H,I,J) with higher over-winter sea ice conditions (Figure 2B). This relationship between sea ice conditions and crèched Adélie penguin δ13C values was also evident across years within regions where years with higher sea ice coverage was associated with higher δ13C values (Figure 4, Table 3, and Supplementary Figures 2A,G). Chicks provisioned at Avian Island had more similar δ13C and δ15N values across years than their northern conspecifics reared at Anvers Island (Figure 4) despite annual sea conditions that varied by approximately 7000 km2 on average (Figures 2A,B).
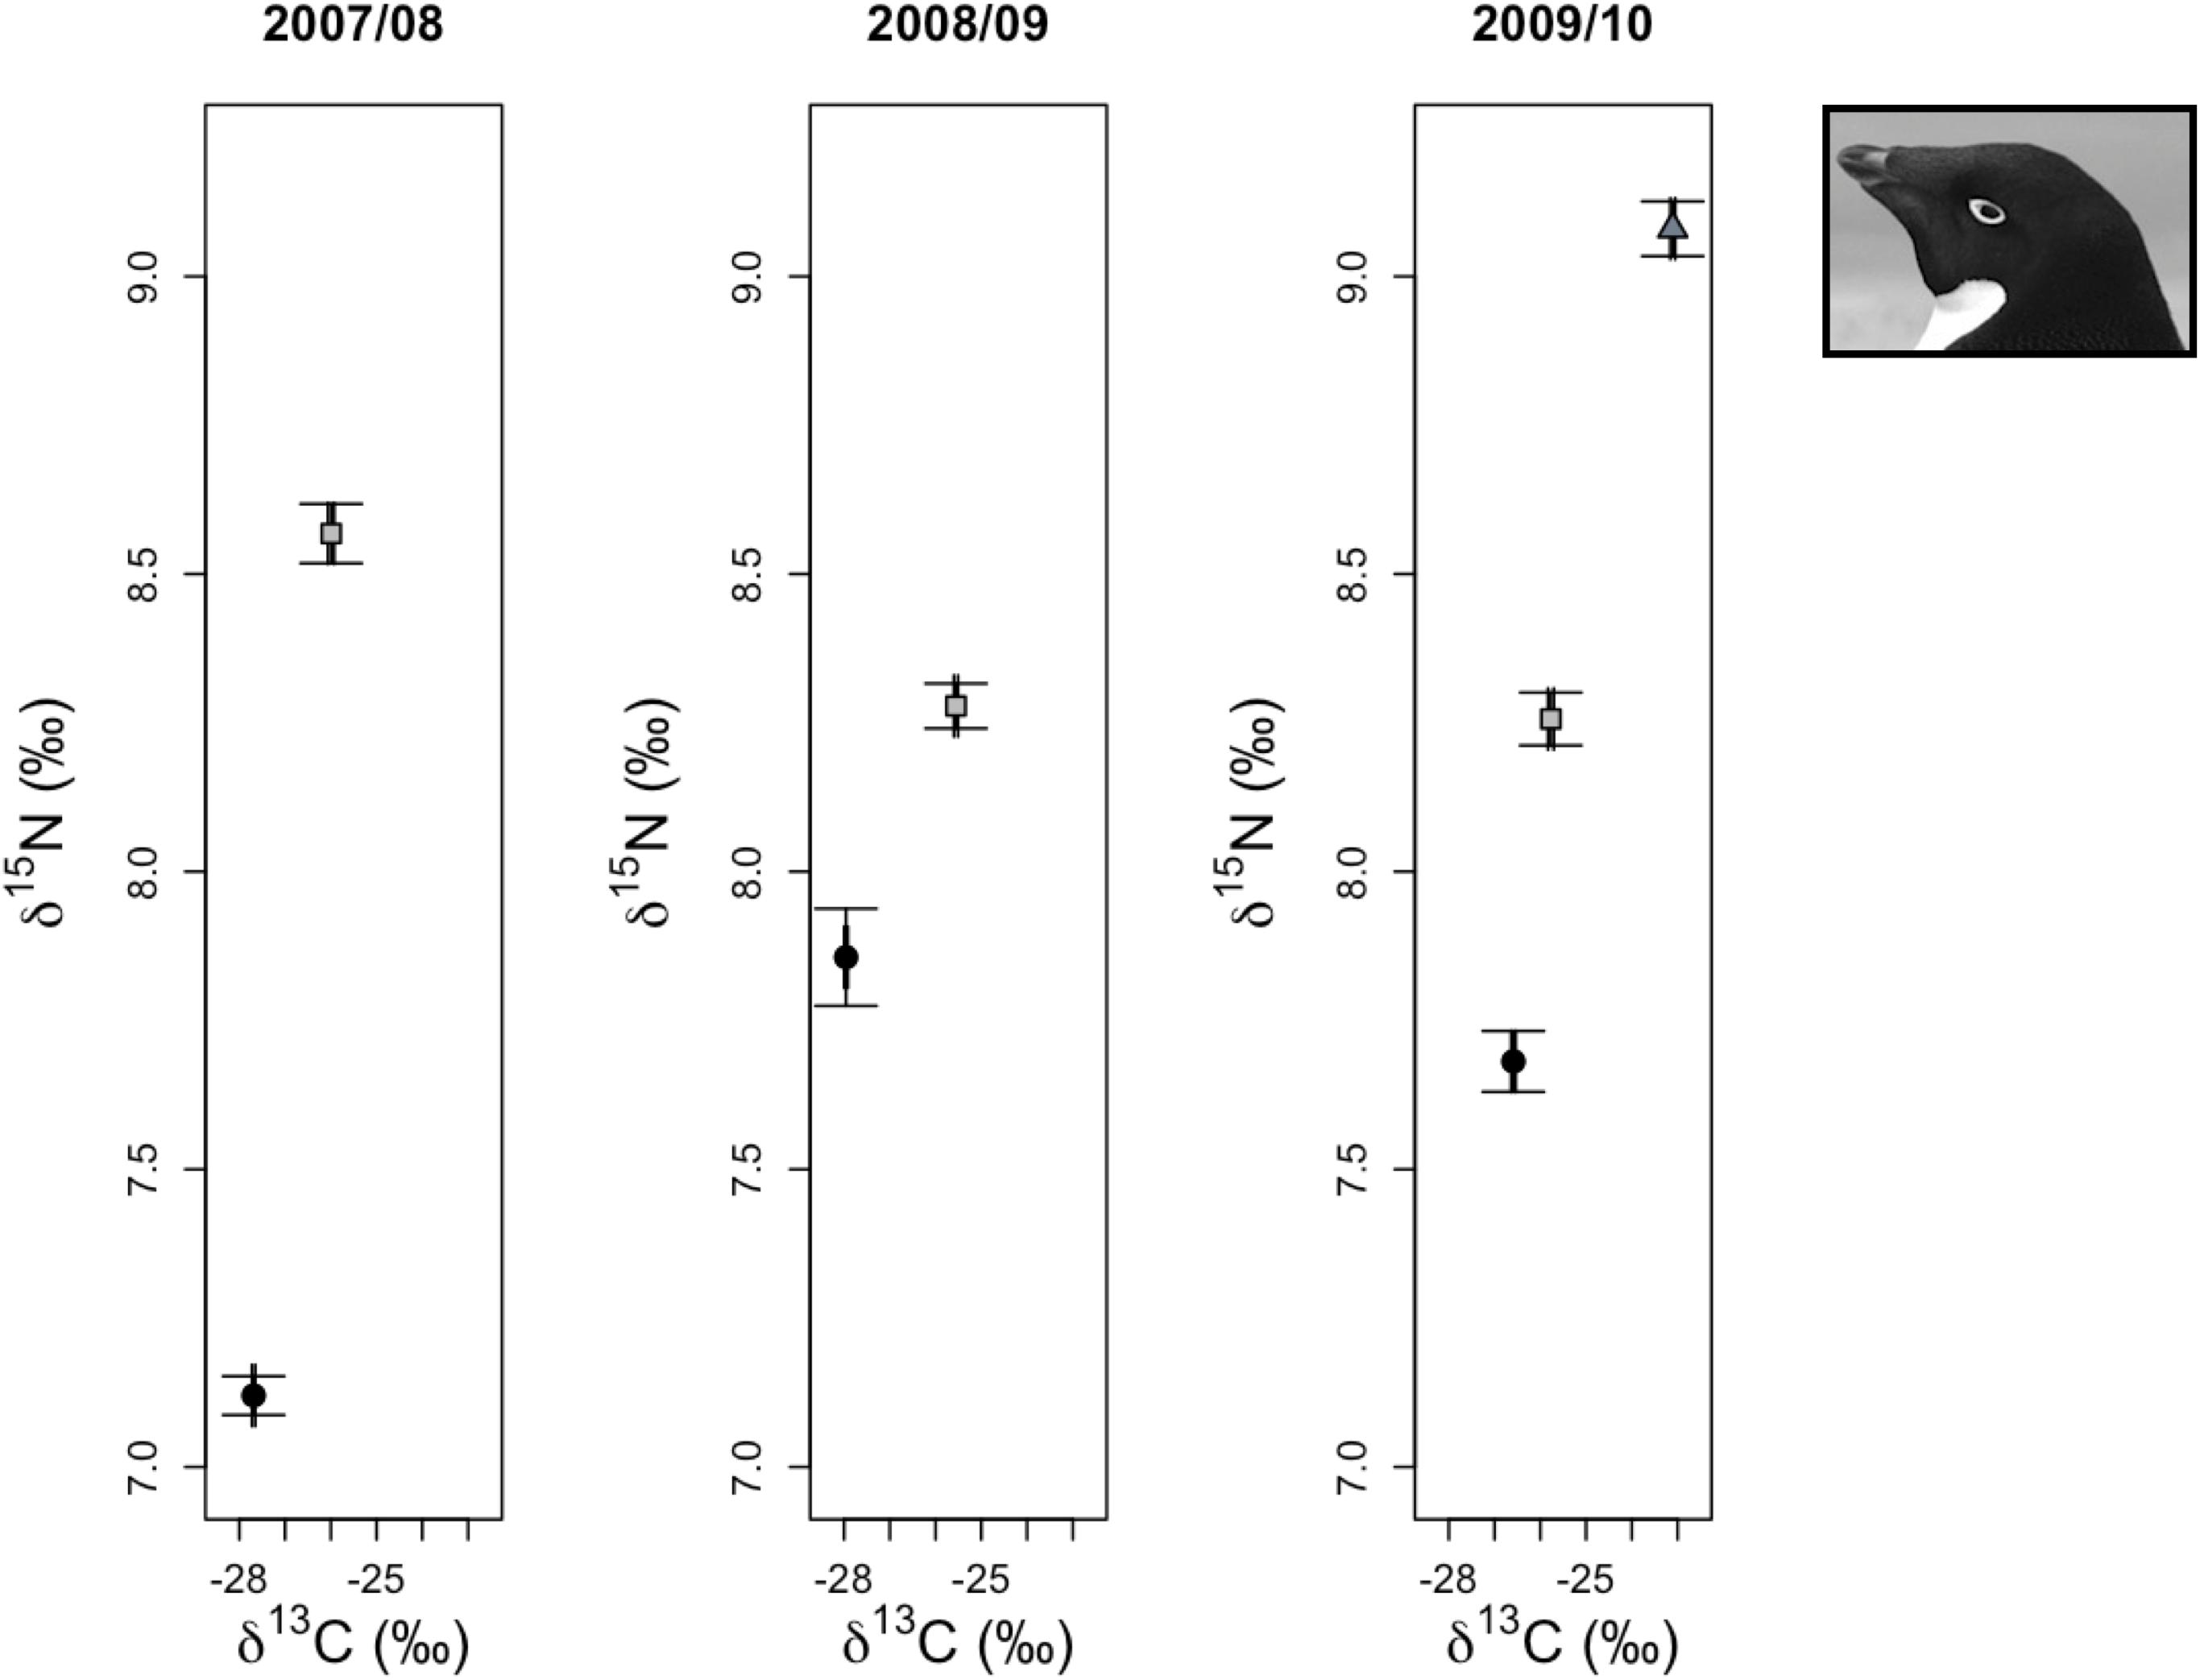
Figure 4. Variation in δ13C and δ15N stable isotope values of Adélie penguin red blood cell tissue for older chicks at a population level age of 5 weeks from Anvers (•), Avian ( ), and Charcot (
 ) Islands. Average isotope values (±1 standard error) for each breeding colony location are presented for each year.
In summary, across all reproductive stages at Anvers Island (Figures 1B,C), the species term was consistently selected in all best-fit models for describing variation in community level δ13C and δ15N values of Pygoscelis penguin RBC tissue (Table 2). Importantly, species were most different in δ13C and δ15N values among adults at the one-egg stage (Figure 5). As parents provisioned chicks from local prey found within the foraging range of Anvers Island, Pygoscelis chicks at 5 weeks of age were much more similar isotopically than their parents at the one-egg stage in having lower values for both δ13C and δ15N (Figure 5). Chicks at 5 and 15 days of age tracked the progressive reduction in community δ13C and δ15N values where chicks at 5 days of age had higher values than chicks at 15 days of age (Figure 5). Regional analyses of 5-week-old crèched Adélie penguin chicks reared at Anvers, Avian, and Charcot Islands (Figure 1B) also demonstrated a gradient in isotopic values where Adélie penguin chicks reared from more southern colonies, which are associated with higher over-winter sea ice coverage (Figure 2B), had higher δ13C and δ15N values than their northern conspecifics (Figure 5).
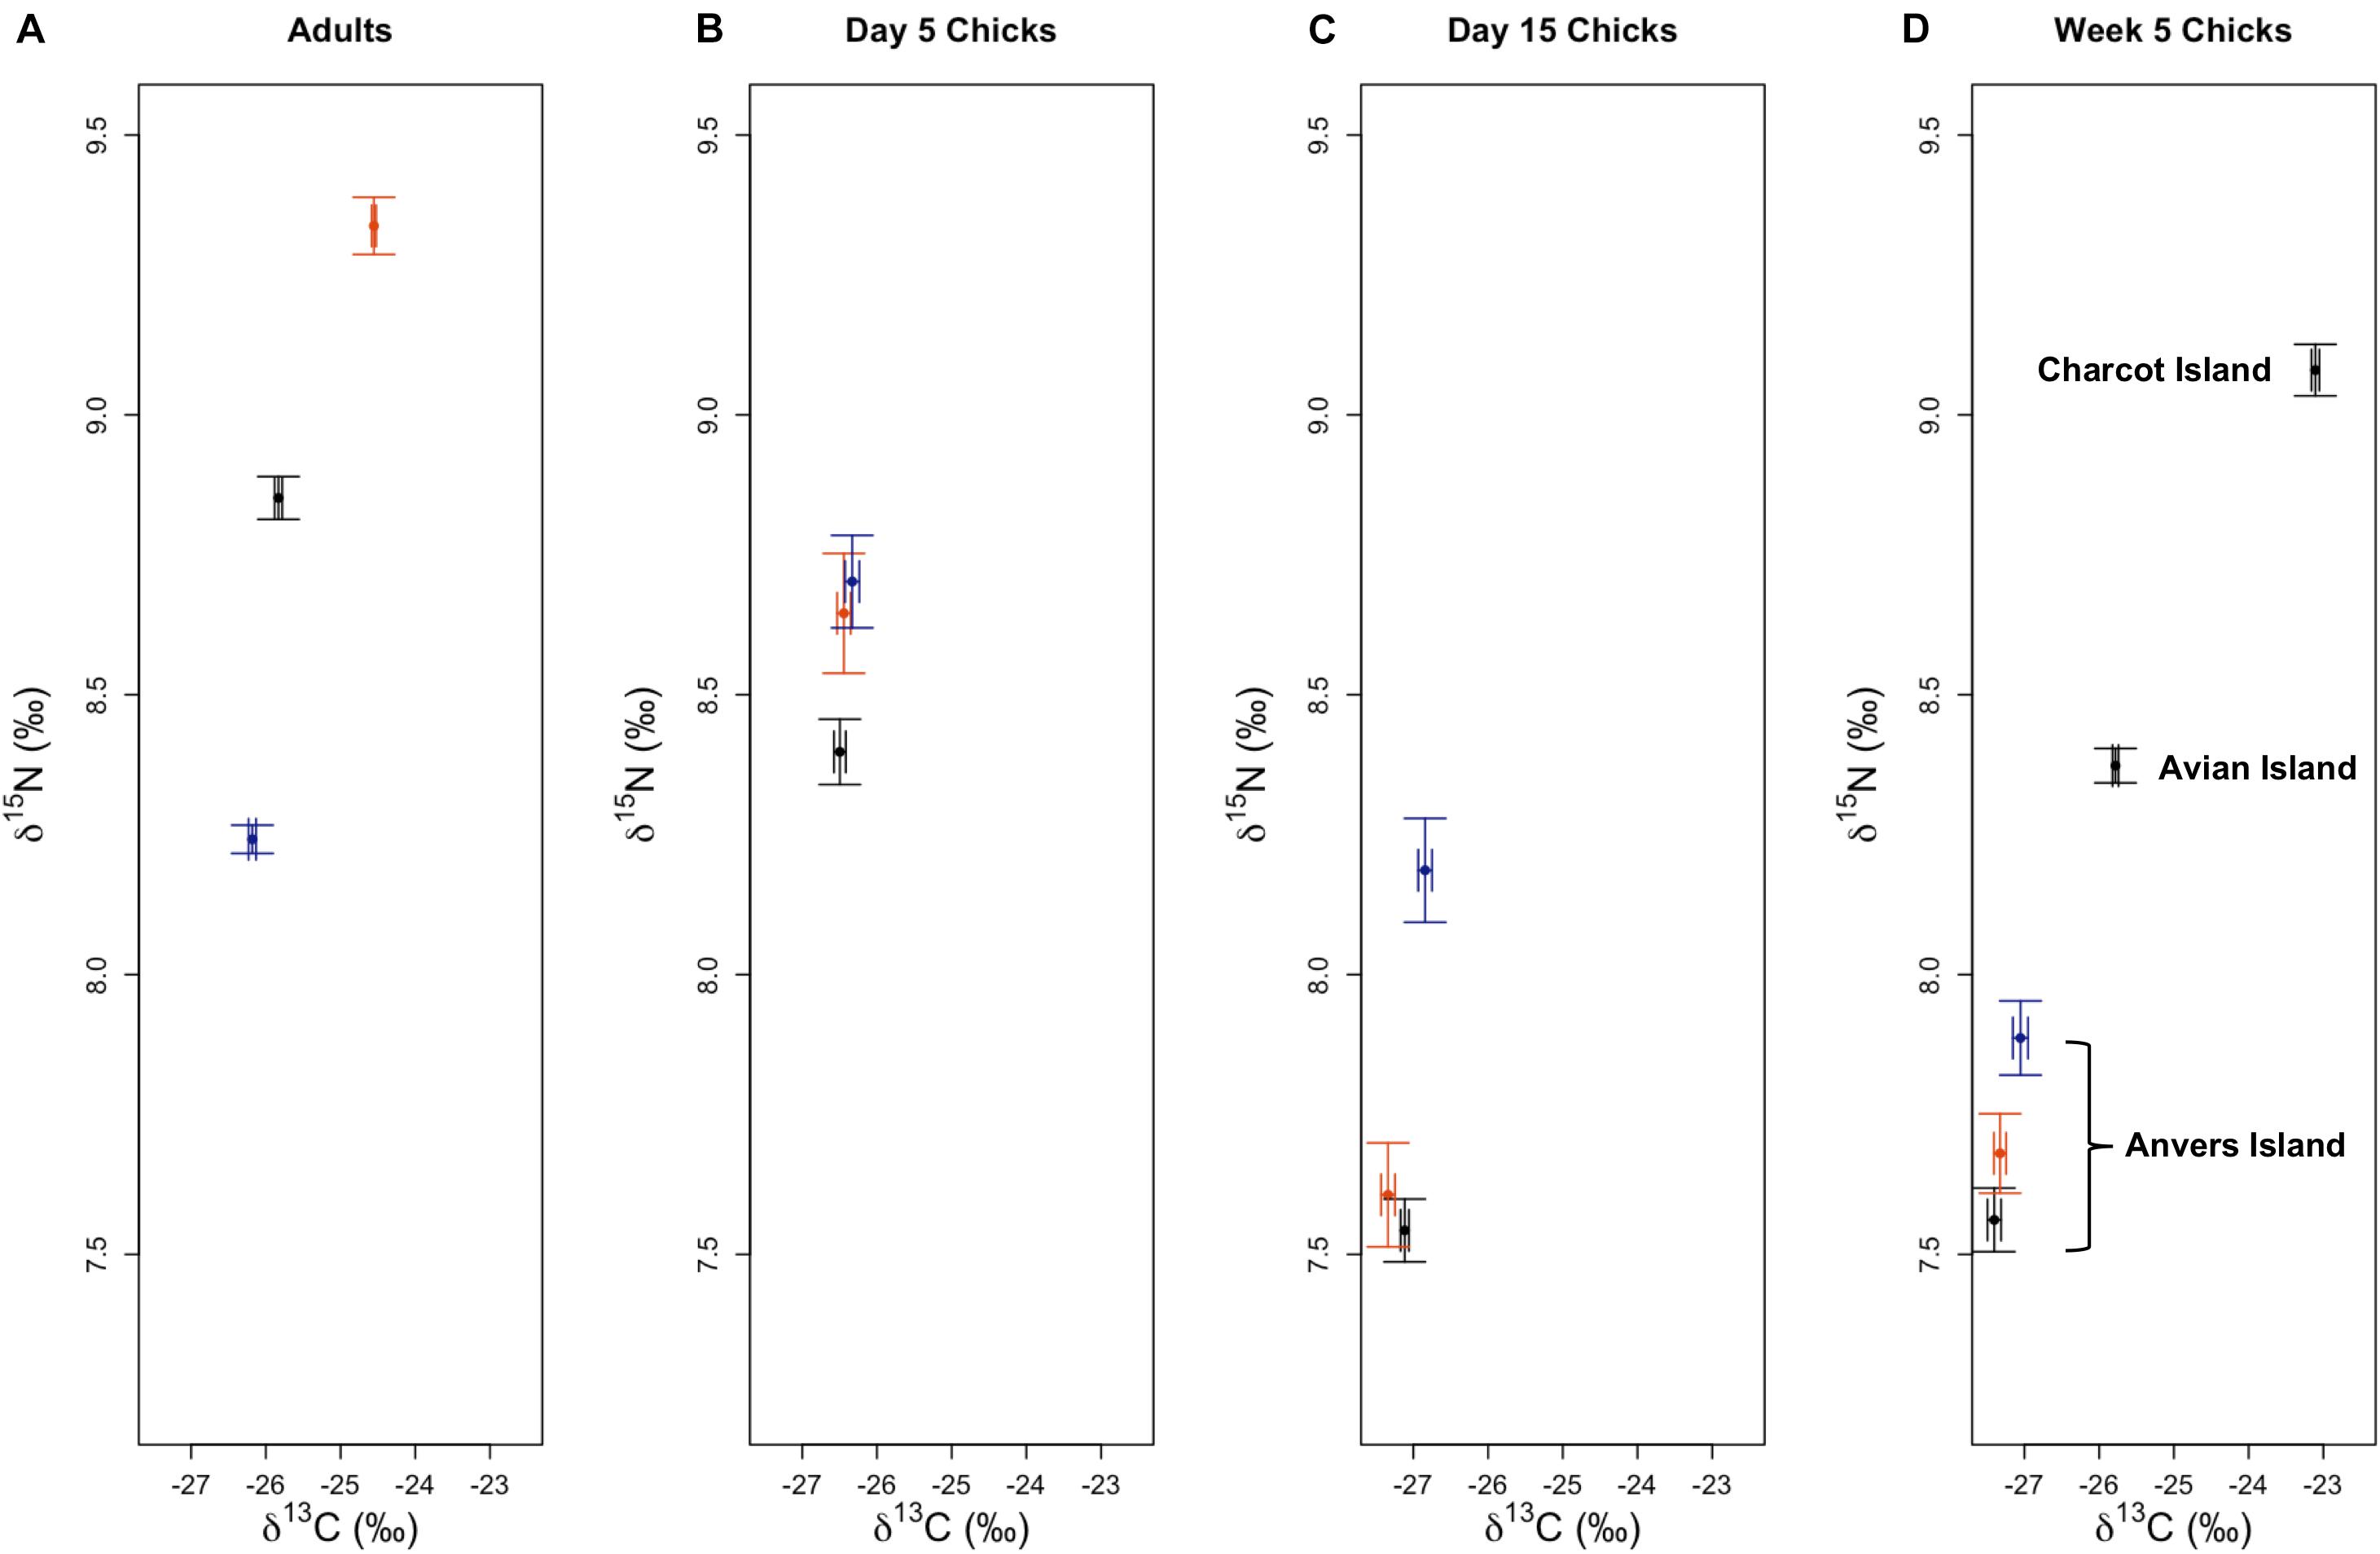
Figure 5. Variation in δ13C and δ15N stable isotope values of Adélie (•), chinstrap (), and gentoo () penguin red blood cell tissue for adults at the one-egg stage (A), and their young chicks at five (B) and 15 (C) days of age, as well as older chicks at a population level age of 5 weeks (D) at regional breeding colonies. Isotope values (±1 standard error), averaged across years, are presented for each reproductive stage.
Trophic Position Analysis
Median trophic position of 5-week-old Pygoscelis crèched chicks reared at Anvers Island (TPA analyses 1–3) were broadly similar across species within a year, as well as across years, as 95% credibility intervals overlapped (Table 4). Similarly, median trophic position of 5-week-old Adélie penguin chicks reared at Anvers, Avian, and Charcot Islands (TPA analyses 1–7) were broadly similar across years and regions as 95% credibility intervals overlapped (Table 4). Adélie and chinstrap penguin chicks at Anvers Island had more variable median trophic position values across years than gentoo penguins (Adélie: 3.34–3.53, chinstrap: 3.31–3.57, gentoo: 3.55–3.56). Adélie penguin chicks reared from southern colonies with greater sea ice coverage at Avian and Charcot Islands had slightly higher median trophic position values (3.49–3.67, Table 4). See also Supplementary Figure 3.
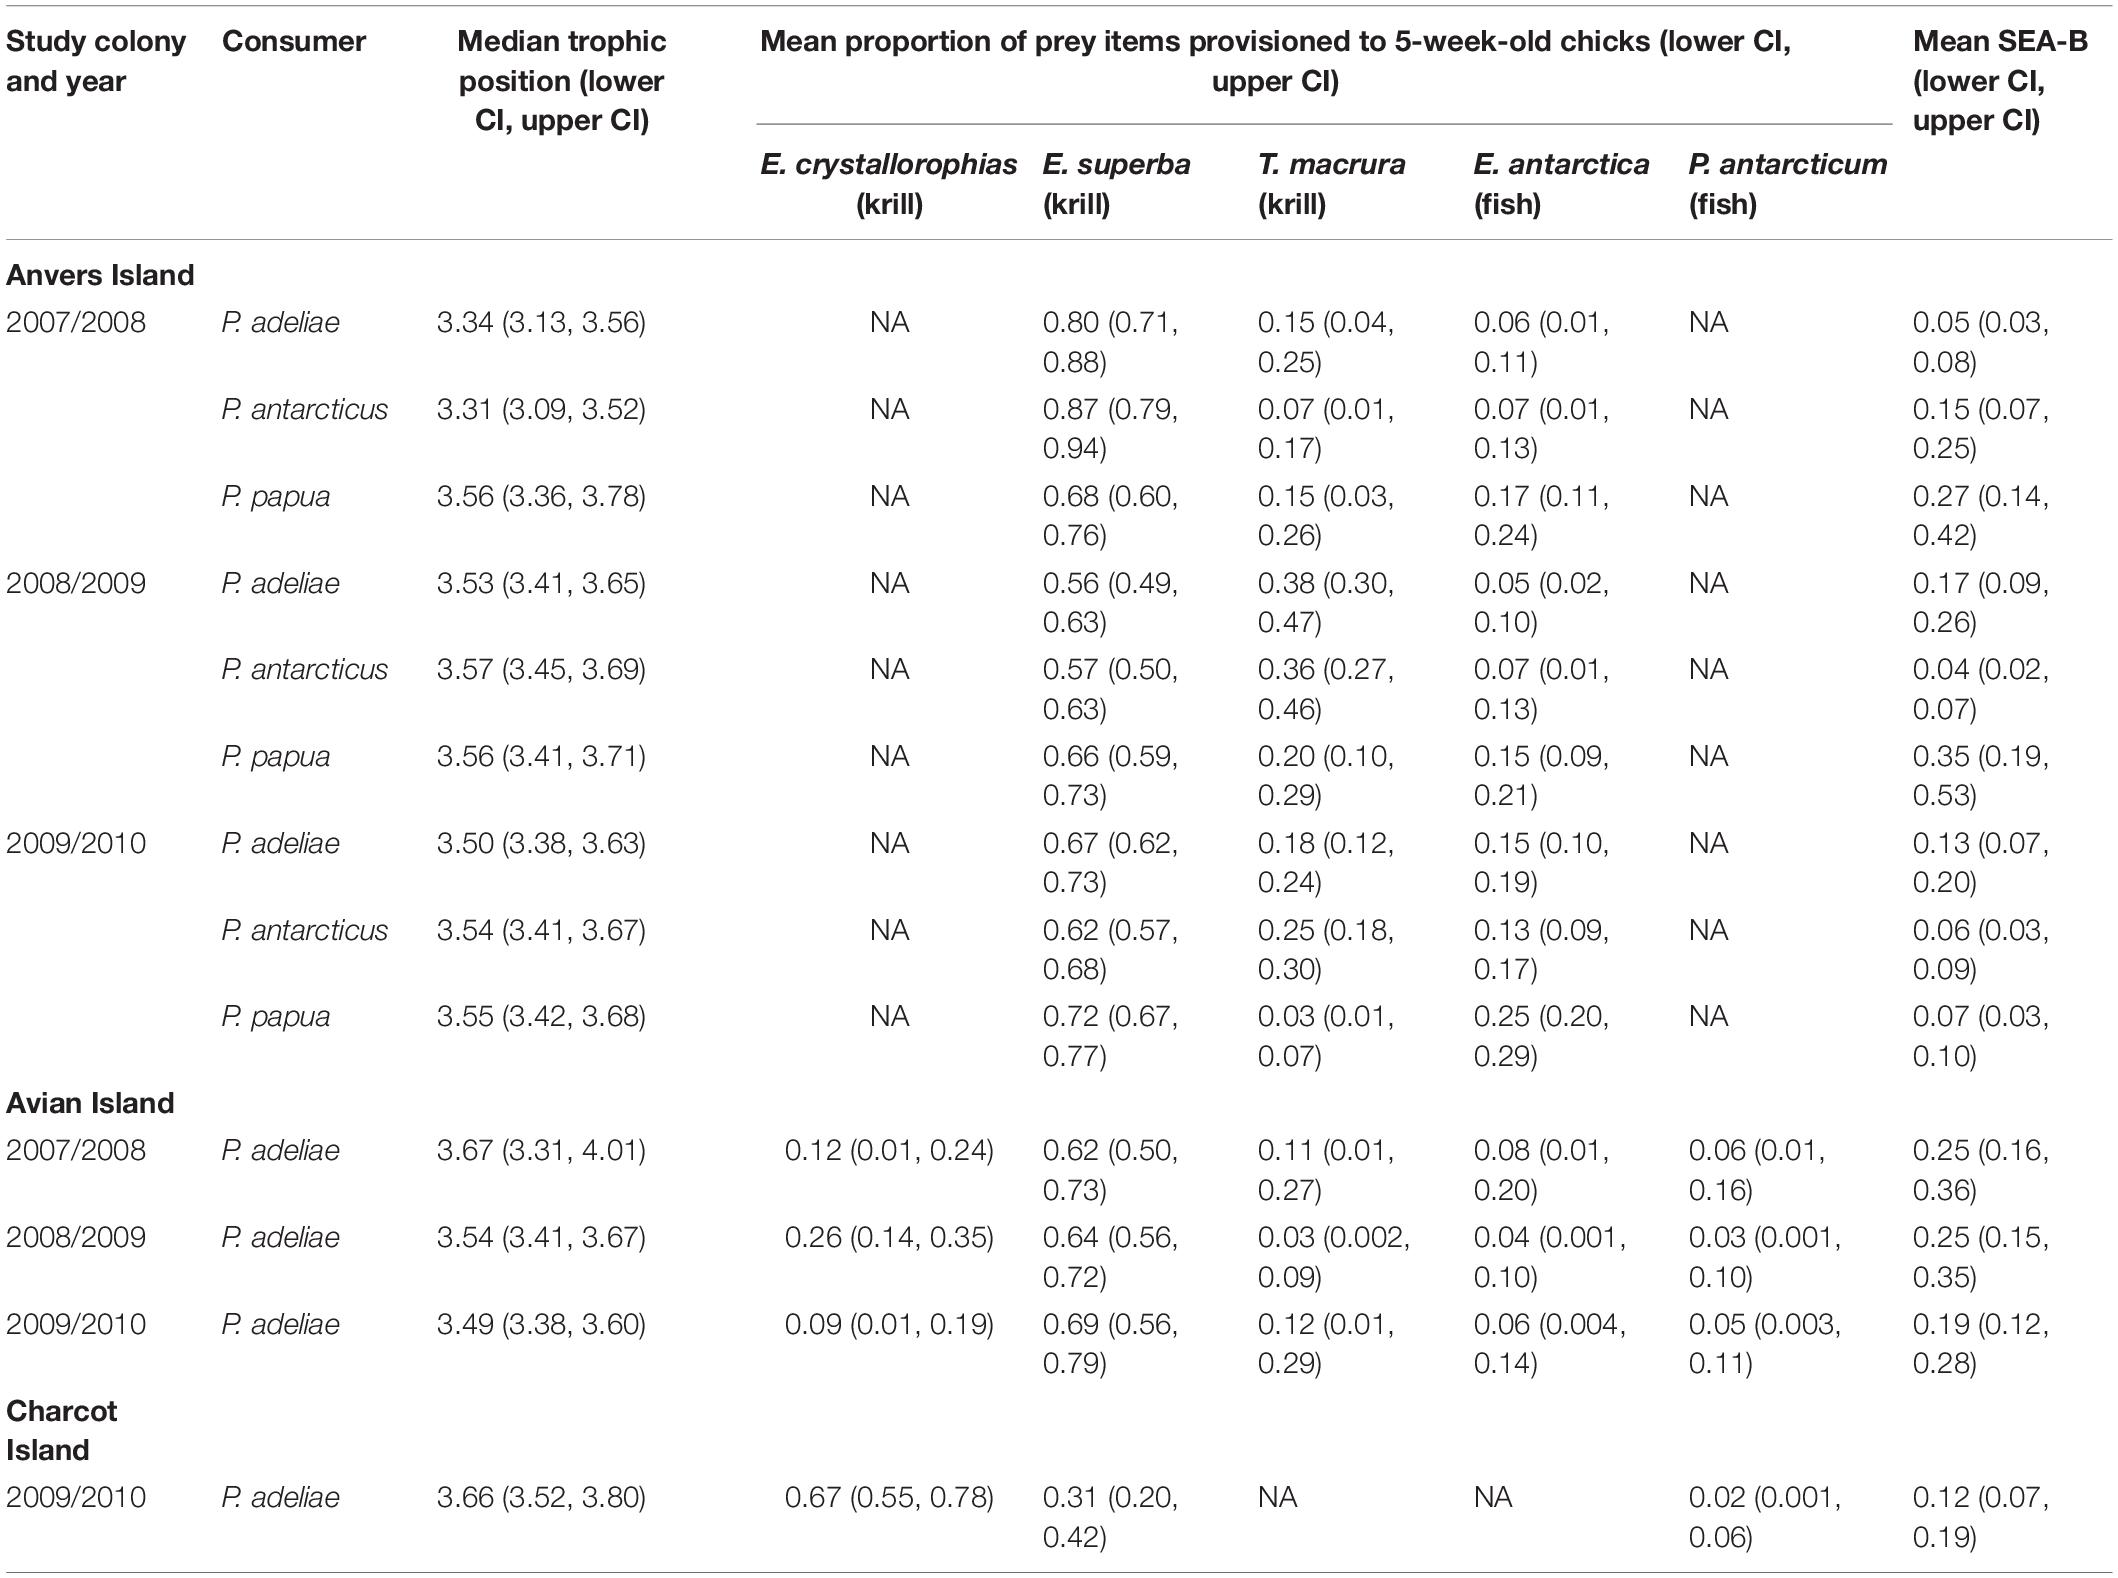
Table 4. Bayesian estimates of trophic position, proportions of prey, and isotopic niche as standard ellipse area (SEA-B) and associated 95% credibility intervals (CI) for 5-week-old Pygoscelis penguin chicks reared at breeding colonies throughout the western Antarctic Peninsula (TPA models 1–7, IMMA models 1–7, and INA models 1–7).
Isotopic Mixing Model Analysis
Bayesian mixing models estimating the proportion of diet items provisioned by adult Pygoscelis penguins to 5-week-old crèched chicks reared at Anvers Island (IMMA analysis 1, Figures 1B,C) considered three main prey types (Table 1) including two species of krill (Antarctic krill and T. macrura) and the myctophid, lanternfish. Within each year, the proportion of these diet items provisioned by adults to chicks were generally similar across Pygoscelis species at Anvers Island, which included 56–87% of the diet each season consisting of Antarctic krill (Figure 6A and Table 4). During the first year of the study, crèched gentoo penguin chicks consumed a lower proportion of Antarctic krill (60–76%) than chinstrap (79–94%) penguin chicks (Figure 6A and Table 4). During the second year of the study characterized by lower sea ice conditions, chicks of all three species consumed greater proportions of Thysanoessa macrura than each species did in other years, in particular Adélie penguins, but also chinstrap penguin chicks between 2007/2008 and 2008/2009, and gentoo chicks between 2008/2009 and 2009/2010 (Figure 6A and Table 4). Smaller proportions of each species’ diet consisted of lanternfish (5–25%) across all 3 years of the study. However, gentoo chicks consumed greater proportions of fish overall (15–25%), and in particular during 2009/2010 (Figure 6A and Table 4).
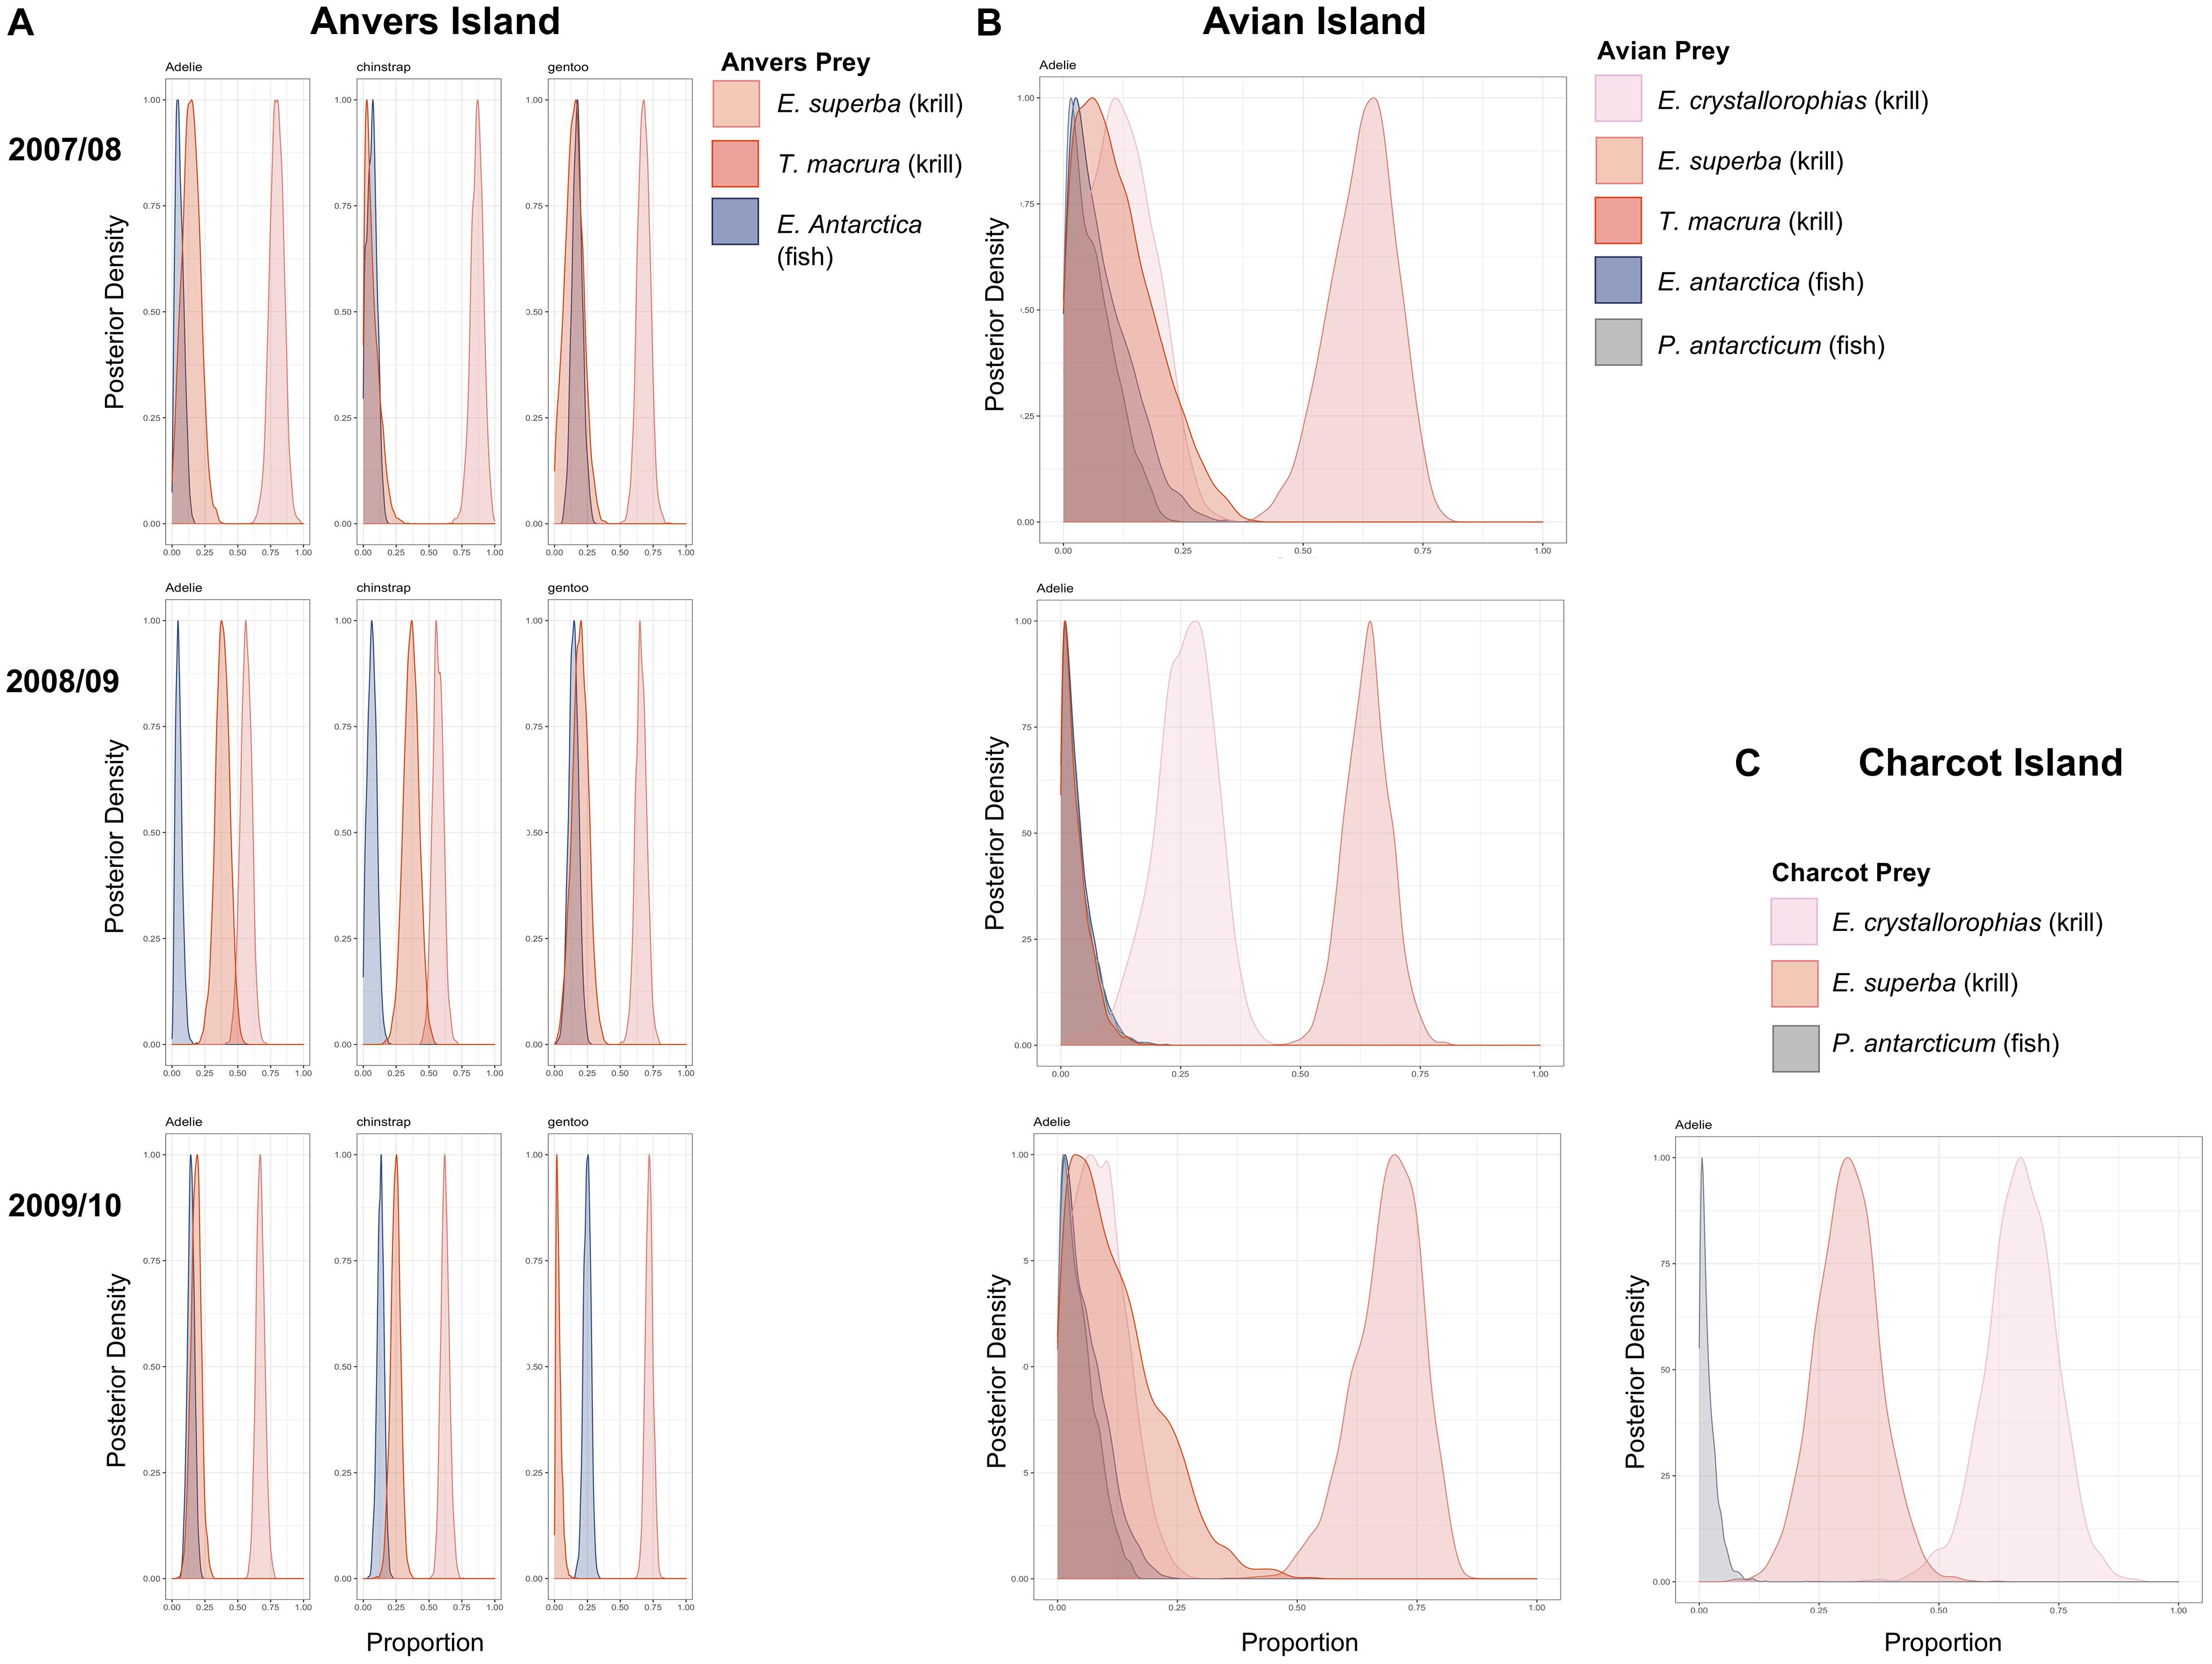
Figure 6. Variation in the proportion of prey items provisioned to crèched Adélie, chinstrap, and gentoo penguin chicks at a population level age of 5 weeks at Anvers Island (A), crèched Adélie penguin chicks at Avian Island (B), and crèched Adélie penguin chicks at Charcot Island (C). Posterior densities are presented. See Table 4 for mean proportions of prey items and associated 95% credibility intervals.
Five main diet items were considered in mixing models estimating the proportion of diet items provisioned by adult penguins to 5-week-old Adélie penguin chicks reared at Avian Island (IMMA analysis 2, Figure 1B and Table 1). Prey items included all species considered by Anvers Island analyses, as well as crystal krill and the notothenoid, Antarctic silverfish. Across study years at Avian Island that were characterized by variability in winter sea ice coverage of approximately 7000 km2 (Figure 2B), the proportion of various diet items consumed by crèched Adélie penguin chicks was remarkably similar, with Antarctic krill consisting of 62–69% of the diet (Figure 6B). Smaller proportions of the diet consisted of crystal krill (9–26%) and T. macrura (3–12%), while fish (lanternfish and Antarctic silverfish) again comprised smaller proportions (3–8%, Figure 6B).
Three main prey types were considered in mixing models estimating dietary proportions consumed by 5-week-old Adélie penguin chicks reared at Charcot Island during the breeding season of 2009/2010 only (IMMA analysis 3, Figure 1B and Table 1). These prey types included dominant species found within high latitude, continental-shelf regions of the Southern Ocean including Antarctic and crystal krill, as well as Antarctic silverfish. Charcot Island has the highest winter sea ice coverage within the PAL-LTER regional study grid (Figure 2B). Interestingly, crystal krill comprised the largest proportion of the diet (55–78%) of the diet provisioned to Adélie penguin chicks at Charcot Island, while Antarctic krill represented 20–42% (Figure 6C). Antarctic silverfish again comprised only a very small proportion of the diet (up to 6%, Figure 6C).
Isotopic Niche Analysis
Isotopic niche analysis estimated SEA-B of crèched penguin chick RBC tissue and indicated that isotopic width was much more variable among Pygoscelis chicks of the northwestern AP located at Anvers Island where reductions in sea ice have been greatest, in comparison with populations farther south at Avian and Charcot Islands where sea ice coverage was greater (Table 4). Based on 95% credibility intervals, SEA-B of Adélie penguin chicks ranged from 3–8‰2 in 2007/2008, to 9–26‰2 in 2008/2009 and 7–20‰2 in 2009/2010 (Table 4). Similarly variable estimates of SEA-B for chinstrap (2007/2008: 7–25‰2, 2008/2009: 2–7‰2, 2010/2009: 3–9‰2) and gentoo (2007/2008: 14–42‰2, 2008/2009: 19–53‰2, 2010/2009: 3–10‰2) penguins were observed, however, gentoo penguins had the largest estimates of SEA-B of all three species (Table 4). This result is not surprising as gentoo penguins were provisioned greater proportions of fish in their diet (Figure 6A) that have higher isotopic values (Table 1). In contrast, SEA-B of Adélie penguin chicks reared at Avian (2007/2008: 16–36‰2, 2008/2009: 15–35‰2, 2010/2009: 12–28‰2) and Charcot (2010/2009: 7–19‰2) Islands was much more consistent across years at Avian Island and both regions in 2010 (Table 4) although not necessarily wider than Adélie penguin chicks at Anvers Island in 2008/2009 and 2009/2010 (Table 4). See also Supplementary Figure 1.
Discussion
Elucidating relationships between sea ice change and associated food web effects on penguin demography has been highlighted as a key component to understanding population responses to climate variability in the Southern Ocean (Forcada and Trathan, 2009). To this end, our study considered regional breeding population trends among western AP Pygoscelis penguins from an integrated food web perspective based on variation in δ13C and δ15N values of penguin blood tissue measured at the individual level, as well as SI values of dominant prey. Many of our specific predictions were supported by the data. First, our analyses at Anvers Island demonstrated that over the course of the breeding season, individuals became increasingly more similar isotopically, as predicted, due to a general decrease in both δ13C and δ15N values of blood tissue (Figures 5A–D). Older chicks at 5 weeks of age near Anvers Island, the most isotopically similar breeding stage (Figures 3D, 5D), also occupied generally similar trophic positions as would be expected, particularly in the second and third year of study (Table 4). Furthermore, isotopic mixing models indicated that the proportion of diet items provisioned by adults to older chicks reared near Anvers Island were generally similar across Pygoscelis species within years (Figure 6A). Secondly, as predicted, Adélie penguin chicks reared at regional breeding colonies had higher isotope values at more southern colonies (Figures 4, 5). Within this context, trophic position values generally increased with latitude (Table 4), while the proportions of dietary items provisioned by Adélie penguin adults to chicks at regional colonies were notably different, particularly at Charcot Island (Figures 6A–C), generally reflecting prey characteristic of a high Antarctic marine food web at more southernly colonies.
Pygoscelis Adults at Anvers Island
Adults at the one egg stage were the most isotopically distinct breeding stage, which suggests that these penguin species are foraging on different prey across the western AP or Scotia Sea during the 30–60 days prior to nest initiation in association with their preferred late winter/early spring habitat. Chinstrap penguins had the highest δ13C and δ15N isotope values at this stage followed by Adélie penguins, whereas gentoo penguins had the lowest δ13C and δ15N values among the species (Figure 5A). These data, coupled with previous research on our study populations demonstrating that male and female Pygoscelis penguins are not greatly segregated in their pre-breeding foraging niche (Gorman et al., 2014), our own field observations, and knowledge of other seabird systems suggest the possibility that adult male and female Adélie and chinstrap penguins may rely on a fish-based diet prior to egg production in association with off-shore winter habitats in sea ice-associated (Williams, 1995; Ainley, 2002) or sea ice-free regions (Trivelpiece et al., 2007), respectively. However, gentoo penguins may rely primarily on krill while wintering near-shore closer to breeding colonies (Tanton et al., 2004). Over the course of our study, depredation of Pygoscelis penguin eggs by brown skuas (Catharacta antarctica) at breeding colonies near Anvers Island revealed consistent species-specific variability across years in the color of penguin egg yolks where Adélie and chinstrap females produce pale yellow colored yolk, while gentoo females produce bright orange to red yolk (K. B. Gorman, pers. obs., see also Supplementary Figure 4). Research on alcids in the North Pacific Ocean has shown yolk coloration to be related to carotenoid deposition by females, including both the types and concentration of carotenoids, as a function of foraging at different tropic levels (Hipfner et al., 2010a, b). These studies confirmed marked variability in carotenoids among crustacean versus fish prey where lower trophic position crustaceans contained high concentrations of astaxanthin, while higher trophic position fish prey contained only low levels of the carotenoids astaxanthin, lutein, and zeaxanthin (Hipfner et al., 2010b). Similarly, yolk of these seabirds with a more red hue contained only astaxanthin, while yolk with a more yellow hue contained all three carotenoid types (Hipfner et al., 2010b). Inter- and intra-specific analyses showed a negative relationship between carotenoid concentration and δ15N values of the yolk tissue, indicating that red colored yolks are derived from nutrients obtained at lower trophic positions with high levels of carotenoids, while yellow colored yolks are derived from higher trophic position diets with lower levels of carotenoids (Hipfner et al., 2010a, b). Similar trophic relationships may govern patterns of carotenoid allocation among Pygoscelis penguins, which would account for the fact that females of the two species with enriched δ15N values of blood at the onset of breeding also produce eggs with pale yellow yolk. In accordance, our δ15N data show forage fishes to be enriched relative to krill (Table 1) similar to results by Polito et al. (2011b). However, unlike Polito et al. (2011a) that concluded female Adélie and gentoo penguins both rely on higher trophic position prey prior to breeding due to their similarity in eggshell δ15N enrichment, our results suggest that adults of these two species may rely on very different prey during the 30–60 days prior to nest initiation. We caution that more detailed studies of relationships between carotenoid content and SI values of Pygoscelis penguin egg yolk are needed to fully support our interpretation of the specific nutrient sources used to fuel egg production. However, our data do suggest that Pygoscelis penguins are associated with different food webs during late winter/early spring, presumably as a function of each species preferred winter habitat. These results have important implications for understanding community variation in nutritional resources critical to the individuals that return to breed, and more specifically egg production itself.
Our study revealed important relationships between each species dietary niche during late winter/early spring and the preceding winter’s average sea ice coverage (Figure 2A and Supplementary Figure 2A). Notably, foraging by Adélie penguins appeared most closely associated with sea ice variability as blood δ15N values of adults were higher in years of relatively higher sea ice conditions, and lower in 2008 following the winter with the lowest sea ice conditions (Supplementary Figure 2B). Conversely, blood δ15N values of gentoo penguins were higher following the 2008 winter of extremely low winter sea ice coverage (Figure 3A). Variation in blood δ15N values of adult chinstrap penguins was independent of winter sea ice conditions as individuals had higher values in the last 2 years of study (Figure 3A and Supplementary Figure 2F). Interestingly, Adélie and gentoo penguins had similar responses in blood δ13C values across years where individuals of both species had higher values in the second year of the study following the winter of low sea ice conditions (Figure 3A). Similar to the blood δ15N results for adult chinstraps, blood δ13C values were independent of winter sea ice conditions as individuals had similar values across the 3 years of study (Figure 3A and Supplementary Figure 2C). Our data suggest that species do hold different foraging affinities with sea ice, where Adélie penguins have higher blood δ15N and δ13C values in years with higher sea ice coverage, gentoo penguins had higher δ15N but lower δ13C values in association with higher sea ice coverage, while blood δ15N and δ13C values chinstrap penguins were independent of sea ice conditions (Supplementary Figures 2A–F; see also Gorman et al., 2014). In this context, it is possible that the higher trophic position prey, possibly fish, Adélie and chinstrap penguins appear to rely upon during late winter/early spring (Figure 3A) may include different communities given each species differing foraging response to sea ice variability and generally disparate wintering locations.
Previous work on pelagic fish communities of the western AP has shown that mesopelagic and neritic assemblages are typically segregated by sea ice coverage, as well as hydrographic properties (Kellerman, 1996; Donnelly and Torres, 2008). Mesopelagic fishes, including the genera Electrona, Gymnoscopelus, Protomyctophum, Bathylagus, Cyclothone, and Notolepis, typically occur in association with circumpolar deep water (CDW), a relatively warm and more saline water mass derived from the Antarctic Circumpolar Current found both at the continental shelf break, and in association with cross-shelf submarine canyons that act as a conduit delivering CDW to more coastal regions (Kellerman, 1996; Donnelly and Torres, 2008). Conversely, notothenoids, in particular Pleuragramma, are found in colder and less saline coastal waters subject to sea ice formation along the western AP (Kellerman, 1996; Donnelly and Torres, 2008). The Notothenoids, which includes approximately 80 species, are critical components of energy transfer within high Antarctic continental shelf regions such as the Ross Sea, with Antarctic silverfish comprising a majority of the mid-water fish biomass (La Mesa et al., 2004). Importantly, Antarctic silverfish hold a strong affinity for the presence of sea ice (Kellerman, 1996), particularly during early life stages (Vacchi et al., 2004; Bottaro et al., 2009). Therefore, we interpret our data to suggest that adult chinstrap penguins may be relying on mesopelagic fish assemblages associated with open water habitats, while adult Adélie penguins may depend on sea ice-associated neritic assemblages during the 30–60 days prior to egg production given each species produces pale yellow colored yolk, forages at relatively high trophic positions based on δ15N values of RBC tissue, but have very different foraging associations with over winter sea ice variability. Emslie et al. (2003) corroborate these ideas in studying prey remains at active chinstrap and Adélie penguin breeding colonies at King George Island where chinstraps preferred the myctophid, lanternfish, while Adélie prey remains primarily included Antarctic silverfish.
Pygoscelis Chicks at Anvers Island
Chicks at day 5, 15, and 5 weeks of age at Anvers Island became increasingly isotopically similar, specifically due to a reduction in blood δ13C and δ15N values (Figures 3B–D, 5B–D). We interpret this trend in isotopic variability over the chick stage to reflect the turnover of nutrients from those originally allocated to egg tissue during late winter/early spring, to those nutrients provisioned by parents to chicks from local foraging areas during summer (e.g., Sears et al., 2009). Interestingly, gentoo chicks appeared to have a slower rate of isotopic change as compared to Adélie or chinstrap chicks (Figures 5B–D). This may reflect, in part, the fact that gentoo chicks have the slowest growth rate of the three Pygoscelis species, broadly corresponding to their more northerly distribution (Volkman and Trivelpiece, 1980; Williams, 1995). Given the extreme similarity in 5-week-old chick isotope values across species, our data suggest that parents of all three species rely on very similar sources of nutrients to raise chicks near Anvers Island. Within this context, our trophic position analyses confirmed that older chicks do occupy generally similar trophic positions across species (Table 4), which appears to be due to the provisioning of similar proportions of prey items as identified by our isotopic mixing model analyses (Figure 6A). Only in year one did gentoo chicks appear to hold a slightly higher trophic position than the other species, which was driven by a larger proportion of T. macrura and E. antarctica being provisioned by adult gentoo penguins (Table 4 and Figure 6A) that have higher δ15N values relative to Antarctic krill (Table 1). Not surprisingly, Antarctic krill was the dominant prey species provisioned to chicks by all species during each study year (Figure 6A). Interspecific variability in δ13C values of penguins has been related to inshore versus offshore foraging habitats of sub-Antarctic penguins (e.g., Cherel and Hobson, 2007; Carpenter-Kling et al., 2020). We detected relatively little variation in δ13C values of chicks across species within each year (Figures 3B–D), which would suggest that adults of all three species are foraging in similar regions while provisioning chicks during the breeding season. More recent tracking results of adult Adélie and gentoo penguins nesting near Anvers Island has confirmed that adults are generally foraging in more nearshore habitats (Pickett et al., 2018), which would explain the similar δ13C values detected among chicks of all species by our study.
Associations between 5-week-old chick blood isotope values and over-winter sea ice conditions within the Anvers Island foraging grid were variable across species (Figures 2B, 3D). Crèched gentoo penguin chicks showed no association between blood δ15N values and the previous winter’s average sea ice coverage. However, 5-week-old gentoo chicks appeared to have higher blood δ13C values during years with higher sea ice coverage (i.e., 2007/2008 and 2009/2010) (Supplementary Figure 2E). Isotopic values of 5-week-old chinstrap chicks were higher in blood δ15N during the second year of study following the winter of very low sea ice coverage in comparison with the first year (Figure 3D), however, this relationship was not as strong between years two and three of the study (Figure 3D). Similar to gentoo chicks, chinstrap penguin chicks had higher blood δ13C values during years with higher sea ice coverage (Supplementary Figure 2C). Crèched Adélie penguin chicks showed similar trends across years as chinstrap chicks where higher blood δ15N values were observed in the second year of the study (Figures 3C,D). Similar to the other species, 5-week-old Adélie penguin chicks had higher blood δ13C values during years with higher sea ice coverage (Supplementary Figure 2A). We note that although our data suggest rather consistent positive relationships between blood δ13C values and over-winter sea ice conditions, our dataset is limited to only 3 years of study. Further, foraging decisions by adult penguins to provisions their chicks are undoubtedly influenced by factors not measured by our study such as competition with other krill predators, or oceanographic conditions other than sea ice that might structure the availability of prey such as small- or meso-scale processes.
Isotopic mixing models indicated that Adélie and chinstrap parents provisioned their chicks greater proportions of T. macrura following the winter of very low sea ice coverage (Figures 2B, 6A), which accounted for these species occupying a higher trophic position in year two of the study (Table 4). During the third year of the study, parent penguins provisioned their chicks slightly higher proportions of the myctophid, E. antarctica. Provisioning of E. antarctica during 2009/2010 appeared to have no relationship with sea ice variability as this prey item was not provisioned as readily during the first year of study characterized by similar winter sea ice conditions. It’s possible the increased presence of E. antarctica in the summer diet during the third year of the study was related to increased CDW intrusion due to wind forcing (Martinson et al., 2008) into the Palmer Deep canyon, where penguins typically forage near Anvers Island (Kahl et al., 2010; Schofield et al., 2013).
Adélie Chicks at Regional Islands
Five-week-old Adélie penguin chicks at regional breeding colonies had increasingly higher blood δ13C and δ15N values at higher latitude colonies (Figures 4, 5) associated with greater over-winter sea ice coverage within foraging grids (Figure 2B). This trend in isotopic variability was strong as it persisted across years at both Anvers and Avian Island colonies and was additionally confirmed by the 1 year of data collected at Charcot Island. Within this context, 5-week-old Adélie chicks had higher trophic position values at regional colonies in association with greater sea ice coverage (Table 4). Our mixing model analyses suggested that higher blood δ13C and δ15N values of regional Adélie chicks, particularly at Charcot Island, was primarily due to greater proportions of crystal krill being provisioned to chicks at higher latitude colonies, as opposed to greater proportions of Antarctic silverfish as we originally predicted. Like Antarctic silverfish, crystal krill are key components of high Antarctic continental shelf food webs (La Mesa et al., 2004). Therefore, it is not surprising that crystal krill are provisioned by adult Adélie penguins to chicks in greater proportions at our highest latitude study site associated with the greatest over-winter sea ice coverage (Figure 2B). However, the lack of a substantial fish component at Charcot Island during the final year of our study was surprising and may be related to a lack of recruitment events of Antarctic silverfish given the relatively low sea ice conditions of the previous winters since 2006 (Ducklow et al., 2013; Parker et al., 2015).
There was no strong relationship between Adélie penguin chick blood isotope values and over-winter sea ice variability within the foraging grid at Avian Island (Figure 4). However, there was less variability among years in chick isotope values at Avian Island than Anvers Island, which is also reflected in our results for SEA-B of penguin chicks (Table 4). Within this context, mixing model results indicated that across years, the proportion of prey provisioned to chicks at Avian Island was more consistent than that modeled for Anvers Island, and importantly suggest the idea that marine foraging areas may be more predictable in regions with greater over-winter sea ice coverage. Environmental predictability is critical to the evolved life history strategies of penguins (Forcada and Trathan, 2009), particularly during the breeding season given that adult penguins must maximize their foraging effort within a restricted geographic range in order to provision and protect chicks at terrestrial nesting sites. Within the northern sector of our regional study area, where changes in sea ice have been most prominent, ocean-climate variability may be impacting penguin populations by altering the predictability of prey critical for successful reproduction of adults and recruitment of chicks.
Isotopic Niche
Results for SEA-B, a proxy for dietary niche width, provided evidence that penguin breeding populations with the most dramatic changes in their population trends (i.e., those at Anvers Island) were much more variable in SEA-B across years than Adélie penguin populations farther south at Avian and Charcot Islands (Table 4). However, dietary niche width of Avian and Charcot Island Adélie populations were not consistently larger than Anvers Island populations as was predicted, only for some species for a given year (Adélie penguins in 2007/2008, chinstrap penguins in 2008/2009, and chinstrap and gentoo penguins in 2009/2010). However, our data provide some intriguing evidence that variability in dietary niche width may be associated with breeding population trends for Adélie penguins along the western AP, particularly for Anvers and Avian populations.
Sea Ice Trophic Interaction Hypothesis
The data we present here lends insight on key marine food web drivers of Pygoscelis penguin reproduction at the regional scale along the western AP. Within the context of divergent breeding population responses among all three species occurring near Anvers Island, our most northern study site, our results question the long standing paradigm that Antarctic krill are the key food web component critical to the reproductive survival of these species in this region of the Antarctic (e.g., Fraser et al., 1992; Fraser and Hofmann, 2003; Hinke et al., 2007; Trivelpiece et al., 2011). Trivelpiece et al. (2011) argued that populations of both chinstrap and Adélie and penguins breeding at the South Shetland Islands (Figure 1B) are regulated by the availability of Antarctic krill, which would explain why both species appear to be declining in this region in association with reductions in krill stocks due to sea ice loss, increased pressures from krill fishery expansions, as well as recovering populations of other krill predators such as seals and whales. Demographically, the decline of these populations is considered driven by reduced survival and recruitment of young birds as breeding adults due to a reduction in krill availability that has reduced fledgling condition, which impacts energetic buffers following departure from natal colonies when young birds are learning to self-feed. While our data confirm that Antarctic krill are in fact a dominant prey item in the summer provisioning diet of both chinstrap and Adélie penguins at Anvers Island (Figure 6A), and therefore, undoubtedly play a major role in determining variation in fledging condition, our data also suggest that adults of these species that return to breed may rely on higher trophic position prey that we argue may be comprised of two differing communities of fish as discussed previously. Within this context, juveniles of these species may also rely on these same fish communities after the breeding season and throughout the winter months in order to survive. Therefore, an alternative hypothesis to that offered by Trivelpiece et al. (2011), specifically for the western AP populations, is that variation in the availability of critical fishes may be an important, and underappreciated, driver of juvenile survival and recruitment as breeding adults for these species. If in fact chinstrap and Adélie penguins breeding near Anvers Island are linked to mesopelagic (myctophid) and neritic (notothenoid) fish fauna during the non-breeding period, respectively, this may explain differing population trends near Anvers Island in association with regional reductions in sea ice as notothenoids such as Antarctic silverfish hold life histories tightly associated with the presence of sea ice (Kellerman, 1996; La Mesa et al., 2004; Vacchi et al., 2004; Bottaro et al., 2009), while mesopelagic fishes are typically found in sea ice free regions in association with ACC-derived warmer water masses (Kellerman, 1996; Donnelly and Torres, 2008) – an oceanic habitat that has been enhanced by ongoing regional climate changes. Of all three species, gentoo penguins showed less variability across breeding stages in stable isotope values (Figures 5A–D), reflecting a more consistently available nutrient source, likely krill, important to this population’s breeding effort. Dietary niche stability may partly explain why numbers of gentoo penguins have increased dramatically near Anvers Island since the mid-1990’s. However, the rapid rate of increase suggests that immigration of individuals into the population is clearly an important factor as well. These issues underscore the importance of research that can address not only the spatial distribution and foraging ecology of these species outside the breeding season (e.g., Bost et al., 2009), but also carry-over or cross-seasonal effects on breeding performance (e.g., Harrison et al., 2011), as well the role of dispersal as a contributing factor in population change (e.g., Dugger et al., 2010; Clucas et al., 2014; Gorman et al., 2017).
Our results further develop an understanding of marine food web drivers of Adélie penguin reproduction during late chick-rearing at the regional scale throughout the western AP demonstrating higher latitude breeding populations, which have increased or are stable, to be reliant upon sea ice-associated food webs more characteristic of high Antarctic regions due to the greater provisioning of crystal krill to chicks (Figures 6A–C). Recent research reported by Ainley et al. (2018) for Adélie penguin populations of the Ross Sea confirms a link between a high Antarctic marine diet and enhanced demographic trends as chicks reared on Antarctic silverfish had a higher fledge mass and greater probability of returning to the colony as sub-adults. Further, the paleoecological record during the late Holocene suggests that Antarctic silverfish and crystal krill dominated diets of Adélie penguins during periods of colder climate and greater sea ice coverage (Emslie and McDaniel, 2002; Lorenzini et al., 2010), which generally corroborates our understanding of regional variation in the dietary niches occupied by Adélie penguins. Therefore, the onset of the historical decline of breeding Adélie penguins near Anvers Island that started in the late 1980’s and early 1990’s may have resulted from shifts in a high Antarctic marine food web dominated by sea ice, crystal krill and Antarctic silverfish to one more typical of sea ice-free, lower latitude regions characterized by Antarctic krill and myctophid fish assemblages.
Data Availability Statement
Data reported here are publicly available within the PAL-LTER data system (datasets #223, 224, 225, 226, and 227): http://oceaninformatics.ucsd.edu/datazoo/data/pallter/datasets. These data are additionally archived within the US LTER Network’s Information System Data Portal: https://lternet.edu/using-lter-data/. Individuals interested in using these data are therefore expected to follow the US LTER Network’s Data Access Policy, Requirements, and Use Agreement: http://www.lternet.edu/policies/data-access. All datasets and associated R code are available on GitHub: https://github.com/gormankb/Gorman-et-al.-Frontiers-in-Marine-Science.
Ethics Statement
Fieldwork was conducted in accordance with Antarctic Conservation Act permits to WF, in addition to Canadian Committee on Animal Care guidelines (Simon Fraser University Animal Care Permit 890B-08 to KG and TW).
Author Contributions
KG, TW, and WF conceived and designed the study. KG and KR performed fieldwork and lab analysis. KG, KR, TW, and WF contributed reagents/materials/analysis tools. KG analyzed the data and wrote the manuscript with contributions from KR, TW, and WF. All authors approved the submitted version of the manuscript.
Funding
This research was conducted in collaboration with Palmer Station Antarctica, Long-Term Ecological Research (PAL-LTER) program (http://pal.lternet.edu). Fieldwork and stable isotope analysis were supported by National Science Foundation (NSF), Office of Polar Programs (OPP) awards (#0217282 and #0823101) to WF. Supplemental funds were provided by NSF-OPP award #0741351 to WF. Funding by the Virginia Institute of Marine Science Graduate Student Association Student Research Grant to KR supported stable isotope analysis of additional prey samples. KG was partially supported by Simon Fraser University Graduate Fellowships and the Glen Geen Graduate Scholarship in Marine Biology, in addition to Canada Natural Sciences and Engineering Research Council Discovery Grants to TW. Publication costs for this manuscript were partially supported by the University of Alaska Fairbanks Vice Chancellor for Research Office.
Conflict of Interest
The authors declare that the research was conducted in the absence of any commercial or financial relationships that could be construed as a potential conflict of interest.
Publisher’s Note
All claims expressed in this article are solely those of the authors and do not necessarily represent those of their affiliated organizations, or those of the publisher, the editors and the reviewers. Any product that may be evaluated in this article, or claim that may be made by its manufacturer, is not guaranteed or endorsed by the publisher.
Acknowledgments
An early draft of this manuscript was originally published online by Simon Fraser University as part of a dissertation (see Gorman, 2015). We thank S. Stammerjohn for summarizing sea ice data provided by NASA and the United States National Snow and Ice Data Center at the University of Colorado Boulder (http://www.nsidc.org). D. Esler, S. Franks, and J. Barrett-Winch provided statistical advice. S. Stammerjohn and H. Ducklow provided useful comments on an early draft of the manuscript. We are grateful to D. Phillips, J. Moore, and Y. Cherel for guidance and data regarding isotope mixing models. Comments by two reviewers improved the writing and quantitative approach used in the study. We sincerely appreciate J. Matthews and staff at the Stable Isotope Facility (University of California, Davis) for their assistance with sample analysis. J. Blum and D. Patterson-Fraser provided field and logistical support. H. Lucas, H. Geisz, E. Erdmann, R. Smaniotto, T. Morgan, K. Yeager, and S. Farry assisted with fieldwork. Raytheon Polar Services Company and Edison Chouest Offshore provided logistical support.
Supplementary Material
The Supplementary Material for this article can be found online at: https://www.frontiersin.org/articles/10.3389/fmars.2021.526092/full#supplementary-material
Footnotes
References
Ainley, D. G. (2002). The Adélie Penguin: Bellwether of Climate Change. New York: Columbia University Press.
Ainley, D. G., and Blight, L. K. (2009). Ecological repercussions of historical fish extraction from the Southern Ocean. Fish Fish. 10, 13–38. doi: 10.1111/j.1467-2979.2008.00293.x
Ainley, D. G., Dugger, K. M., La Mesa, M., Ballard, G., Barton, K. J., Jennings, S., et al. (2018). Post-fledging survival of Adelie penguins at multiple colonies: chicks raised on fish do well. Mar. Ecol. Prog. Ser. 601, 239–251. doi: 10.3354/meps12687
Baker, A. J., Pereira, S. L., Haddrath, O. P., and Edge, K. A. (2006). Multiple gene evidence for expansion of extant penguins out of Antarctica due to global cooling. Proc. R. Soc. B Biol. Sci. 273, 11–17. doi: 10.1098/rspb.2005.3260
Barbosa, A., Benzal, J., De Leon, A., and Moreno, J. (2012). Population decline of chinstrap penguins (Pygoscelis antarctica) on deception Island, South Shetlands, Antarctica. Polar Biol. 35, 1453–1457. doi: 10.1007/s00300-012-1196-1
Barquete, V., Strauss, V., and Ryan, P. G. (2013). Stable isotope turnover in blood and claws: a case study in captive African Penguins. J. Exp. Mar. Biol. Ecol. 448, 121–127. doi: 10.1016/j.jembe.2013.06.021
Bearhop, S., Phillips, R. A., Mcgill, R., Cherel, Y., Dawson, D. A., and Croxall, J. P. (2006). Stable isotopes indicate sex-specific and long-term individual foraging specialisation in diving seabirds. Mar. Ecol. Prog. Ser. 311, 157–164. doi: 10.3354/meps311157
Bearhop, S., Teece, M. A., Waldron, S., and Furness, R. W. (2000). Influence of lipid and uric acid on delta C-13 and delta N-15 values of avian blood: implications for trophic studies. Auk 117, 504–507. doi: 10.2307/4089734
Bearhop, S., Waldron, S., Votier, S. C., and Furness, R. W. (2002). Factors that influence assimilation rates and fractionation of nitrogen and carbon stable isotopes in avian blood and feathers. Physiol. Biochem. Zool. 75, 451–458. doi: 10.1086/342800
Bestelmeyer, B. T., Ellison, A. M., Fraser, W. R., Gorman, K. B., Holbrook, S. J., Laney, C. M., et al. (2011). Analysis of abrupt transitions in ecological systems. Ecosphere 2:art129. doi: 10.1890/es11-00216.1
Bligh, E. G., and Dyer, W. J. (1959). A rapid method of total lipid extraction and purification. Can. J. Biochem. Physiol. 37, 911–917. doi: 10.1139/y59-099
Bost, C. A., Thiebot, J. B., Pinaud, D., Cherel, Y., and Trathan, P. N. (2009). Where do penguins go during the inter-breeding period? using geolocation to track the winter dispersion of the macaroni penguin. Biol. Lett. 5, 473–476. doi: 10.1098/rsbl.2009.0265
Bottaro, M., Oliveri, D., Ghigliotti, L., Pisano, E., Ferrando, S., and Vacchi, M. (2009). Born among the ice: first morphological observations on two developmental stages of the Antarctic silverfish Pleuragramma antarcticum, a key species of the Southern Ocean. Rev. Fish Biol. Fish. 19, 249–259. doi: 10.1007/s11160-009-9106-5
Burnham, K. P., and Anderson, D. R. (2002). Model Selection and Multi-Model Inference: a Practical Information Theoretic Approach. New York, NY: Springer-Verlag.
Carlini, A. R., Coria, N. R., Santos, M. M., Negrete, J., Juares, M. A., and Daneri, G. A. (2009). Responses of Pygoscelis adeliae and P. papua populations to environmental changes at Isla 25 de Mayo (King George Island). Polar Biol. 32, 1427–1433. doi: 10.1007/s00300-009-0637-y
Carpenter-Kling, T., Pistorius, P., Reisinger, R., Cherel, Y., and Connan, M. (2020). A critical assessment of marine predator isoscapes within the southern Indian Ocean. Mov. Ecol. 8:29.
Cherel, Y., and Hobson, K. A. (2007). Geographical variation in carbon stable isotope signatures of marine predators: a tool to investigate their foraging areas in the Southern Ocean. Mar. Ecol. Prog. Ser. 329, 281–287. doi: 10.3354/meps329281
Cherel, Y., Hobson, K. A., Guinet, C., and Vanpe, C. (2007). Stable isotopes document seasonal changes in trophic niches and winter foraging individual specialization in diving predators from the Southern Ocean. J. Anim. Ecol. 76, 826–836. doi: 10.1111/j.1365-2656.2007.01238.x
Cherel, Y., Hobson, K. A., and Hassani, S. (2005). Isotopic discrimination between food and blood and feathers of captive penguins: implications for dietary studies in the wild. Physiol. Biochem. Zool. 78, 106–115. doi: 10.1086/425202
Clucas, G. V., Dunn, M. J., Dyke, G., Emslie, S. D., Levy, H., Naveen, R., et al. (2014). A reversal of fortunes: climate change ‘winners’ and ‘losers’ in Antarctic Peninsula penguins. Sci. Rep. 4:5024.
Comiso, J. C. (1999). Bootstrap Sea Ice Concentrations from NIMBUS-7 SMMR and DMSP SSM/I 1979-2007. Boulder, Colorado USA: National Snow and Ice Data Center.
Croxall, J. P., Trathan, P. N., and Murphy, E. J. (2002). Environmental change and Antarctic seabird populations. Science 297, 1510–1514. doi: 10.1126/science.1071987
Deniro, M. J., and Epstein, S. (1978). Influence of diet on distribution of carbon isotopes in animals. Geochim. Cosmochim. Acta 42, 495–506. doi: 10.1016/0016-7037(78)90199-0
Deniro, M. J., and Epstein, S. (1981). Influence of diet on the distribution of nitrogen isotopes in animals. Geochim. Cosmochim. Acta 45, 341–351. doi: 10.1016/0016-7037(81)90244-1
Donnelly, J., and Torres, J. J. (2008). Pelagic fishes in the marguerite bay region of the West Antarctic Peninsula continental shelf. Deep Sea Res. Part II Top. Stud. Oceanogr. 55, 523–539. doi: 10.1016/j.dsr2.2007.11.015
Ducklow, H. W., Baker, K., Martinson, D. G., Quetin, L. B., Ross, R. M., Smith, R. C., et al. (2007). Marine pelagic ecosystems: the West Antarctic Peninsula. Philos. Trans. R. Soc. B Biol. Sci. 362, 67–94. doi: 10.1098/rstb.2006.1955
Ducklow, H. W., Fraser, W. R., Meredith, M. P., Stammerjohn, S. E., Doney, S. C., Martinson, D. G., et al. (2013). West Antarctic Peninsula: an ice-dependent coastal marine ecosystem in transition. Oceanography 26, 190–203. doi: 10.5670/oceanog.2013.62
Dugger, K. M., Ainley, D. G., Lyver, P. O., Barton, K., and Ballard, G. (2010). Survival differences and the effect of environmental instability on breeding dispersal in an Adelie penguin meta-population. Proc. Natl. Acad. Sci. USA 107, 12375–12380. doi: 10.1073/pnas.1000623107
Emslie, S. D., and McDaniel, J. D. (2002). Adelie penguin diet and climate change during the middle to late Holocene in northern Marguerite Bay, Antarctic Peninsula. Polar Biol. 25, 222–229. doi: 10.1007/s00300-001-0334-y
Emslie, S. D., Ritchie, P., and Lambert, D. (2003). “Late-holocene penguin occupation and diet at king george Island, Antarctic Peninsula,” in Antarctic Peninsula Climate Variability: Historical and Paleoenvironmental Perspectives, eds E. Domack, A. Leventer, A. Burnett, R. Bindshadler, P. Convey, and M. Kirby (Washington: American Geophysical Union), 171–180. doi: 10.1029/ar079p0171
Forcada, J., and Trathan, P. N. (2009). Penguin responses to climate change in the Southern ocean. Glob. Change Biol. 15, 1618–1630. doi: 10.1111/j.1365-2486.2009.01909.x
Forcada, J., Trathan, P. N., Reid, K., Murphy, E. J., and Croxall, J. P. (2006). Contrasting population changes in sympatric penguin species in association with climate warming. Glob. Change Biol. 12, 411–423. doi: 10.1111/j.1365-2486.2006.01108.x
Fraser, W. R., and Hofmann, E. E. (2003). A predator’s perspective on causal links between climate change, physical forcing and ecosystem response. Mar. Ecol. Prog. Ser. 265, 1–15. doi: 10.3354/meps265001
Fraser, W. R., Trivelpiece, W. Z., Ainley, D. G., and Trivelpiece, S. G. (1992). Increases in Antarctic penguin populations - reduced competition with whales or a loss of sea ice due to environmental warming? Polar Biol. 11, 525–531.
Gorman, K. B. (2015). Integrative Studies of Southern Ocean Food Webs and Pygoscelis Penguin Demography: Mechanisms of Population Response to Environmental Change. Ph.D. dissertation. Canada: Simon Fraser University.
Gorman, K. B., Talbot, S. L., Sonsthagen, S. A., Sage, G. K., Gravely, M. C., Fraser, W. R., et al. (2017). Population genetic structure and gene flow of Adelie penguins (Pygoscelis adeliae) breeding throughout the western Antarctic Peninsula. Antarct. Sci. 29, 499–510. doi: 10.1017/s0954102017000293
Gorman, K. B., Williams, T. D., and Fraser, W. R. (2014). Ecological sexual dimorphism and environmental variability within a community of Antarctic penguins (genus Pygoscelis). PLoS One 9:e90081. doi: 10.1371/journal.pone.0090081
Grebmeier, J. M., Overland, J. E., Moore, S. E., Farley, E. V., Carmack, E. C., Cooper, L. W., et al. (2006). A major ecosystem shift in the northern Bering Sea. Science 311, 1461–1464. doi: 10.1126/science.1121365
Harrison, X. A., Blount, J. D., Inger, R., Norris, D. R., and Bearhop, S. (2011). Carry-over effects as drivers of fitness differences in animals. J. Anim. Ecol. 80, 4–18. doi: 10.1111/j.1365-2656.2010.01740.x
Henderson, I. (1976). Summer log of Travel and Work of Sledge Kilo in Northern Alexander Island and Charcot Island, 1975/1976. Unpublished British Antarctic Survey Internal Report Ref. T/1975/K11. Cambridge: British Antarctic Survey.
Hinke, J. T., Salwicka, K., Trivelpiece, S. G., Watters, G. M., and Trivelpiece, W. Z. (2007). Divergent responses of Pygoscelis penguins reveal a common environmental driver. Oecologia 153, 845–855. doi: 10.1007/s00442-007-0781-4
Hipfner, J. M., Dale, J., and Mcgraw, K. J. (2010a). Yolk carotenoids and stable isotopes reveal links among environment, foraging behavior and seabird breeding success. Oecologia 163, 351–360. doi: 10.1007/s00442-010-1618-0
Hipfner, J. M., Hobson, K. A., Dale, J., and Mcgraw, K. J. (2010b). Stable isotopes link diet to avian yolk carotenoid allocation: a comparative study of five auk species (Charadriiformes: Alcidae). Physiol. Biochem. Zool. 83, 481–489. doi: 10.1086/651515
Hobson, K. A., and Clark, R. G. (1992). Assessing avian diets using stable isotopes. 1. Turnover of C-13 in tissues. Condor 94, 181–188. doi: 10.2307/1368807
Hobson, K. A., Gibbs, H. L., and Gloutney, M. L. (1997). Preservation of blood and tissue samples for stable-carbon and stable-nitrogen isotope analysis. Can. J. Zool. Revue Canadienne Zool. 75, 1720–1723. doi: 10.1139/z97-799
Hobson, K. A., Piatt, J. F., and Pitocchelli, J. (1994). Using stable isotopes to deterine seabird trophic relationships. J. Anim. Ecol. 63, 786–798. doi: 10.2307/5256
Hobson, K. A., and Welch, H. E. (1992). Determination of trophic relationships within a high arctic marine food web using delta-C-13 and delta-N-15 analysis. Mar. Ecol. Prog. Ser. 84, 9–18. doi: 10.3354/meps084009
Jackson, A. L., Inger, R., Parnell, A. C., and Bearhop, S. (2011). Comparing isotopic niche widths among and within communities: SIBER - Stable Isotope Bayesian Ellipses in R. J. Anim. Ecol. 80, 595–602. doi: 10.1111/j.1365-2656.2011.01806.x
Jacobs, S. S., and Comiso, J. C. (1997). Climate variability in the Amundsen and Bellingshausen Seas. J. Clim. 10, 697–709. doi: 10.1175/1520-0442(1997)010<0697:cvitaa>2.0.co;2
Kahl, L. A., Schofield, O., and Fraser, W. R. (2010). Autonomous gliders reveal features of the water column associated with foraging by Adelie penguins. Integr. Comp. Biol. 50, 1041–1050. doi: 10.1093/icb/icq098
Kellerman, A. L. (1996). “Midwater fish ecology,” in Foundations for Ecological Research West of the Antarctic Peninsula, eds R. M. Ross, E. E. Hofmann, and L. B. Quetin (Washington, D.C: American Geophysical Union), 231–256. doi: 10.1029/ar070p0231
La Mesa, M., Eastman, J. T., and Vacchi, M. (2004). The role of notothenioid fish in the food web of the Ross Sea shelf waters: a review. Polar Biol. 27, 321–338. doi: 10.1007/s00300-004-0599-z
Laws, R. M. (1977). Seals and whales of the Southern Ocean. Philos. Trans. R. Soc. Lond. Ser. B Biol. Sci. 279, 81–96. doi: 10.1098/rstb.1977.0073
Layman, C. A., Arrington, D. A., Montana, C. G., and Post, D. M. (2007). Can stable isotope ratios provide for community-wide measures of trophic structure? Ecology 88, 42–48. doi: 10.1890/0012-9658(2007)88[42:csirpf]2.0.co;2
Lemons, G. E., Eguchi, T., Lyon, B. N., Leroux, R., and Seminoff, J. A. (2012). Effects of blood anticoagulants on stable isotope values of sea turtle blood tissue. Aquat. Biol. 14, 201–206. doi: 10.3354/ab00397
Lorenzini, S., Baroni, C., Fallick, A. E., Baneschi, I., Salvatore, M. C., Zanchetta, G., et al. (2010). Stable isotopes reveal Holocene changes in the diet of Adélie penguins in northern Victoria Land (Ross Sea. Antarctica). Oecologia 164, 911–919. doi: 10.1007/s00442-010-1790-2
Lynch, H. J., and LaRue, M. A. (2014). First global census of the Adélie Penguin. Auk 131, 457–466. doi: 10.1642/auk-14-31.1
Lynch, H. J., Naveen, R., Trathan, P. N., and Fagan, W. F. (2012). Spatially integrated assessment reveals widespread changes in penguin populations on the Antarctic Peninsula. Ecology 93, 1367–1377. doi: 10.1890/11-1588.1
Martinson, D. G., Stammerjohn, S. E., Iannuzzi, R. A., Smith, R. C., and Vernet, M. (2008). Western Antarctic Peninsula physical oceanography and spatio-temporal variability. Deep Sea Res. Part II Top. Stud. Oceanogr. 55, 1964–1987. doi: 10.1016/j.dsr2.2008.04.038
McMahon, K. W., Michelson, C. I., Hart, T., Mccarthy, M. D., Patterson, W. P., and Polito, M. J. (2019). Divergent trophic responses of sympatric penguin species to historic anthropogenic exploitation and recent climate change. Proc. Natl. Acad. Sci. U.S.A. 116:25721. doi: 10.1073/pnas.1913093116
Parker, M. L., Fraser, W. R., Ashford, J., Patarnello, T., Zane, L., and Torres, J. J. (2015). Assemblages of micronektonic fishes and invertebrates in a gradient of regional warming along the Western Antarctic Peninsula. J. Mar. Syst. 152, 18–41. doi: 10.1016/j.jmarsys.2015.07.005
Peterson, B. J., and Fry, B. (1987). Stable isotopes in ecosystem studies. Annu. Rev. Ecol. Syst. 18, 293–320. doi: 10.1146/annurev.es.18.110187.001453
Pickett, E. P., Fraser, W. R., Patterson-Fraser, D. L., Cimino, M. A., Torres, L. G., and Friedlaender, A. S. (2018). Spatial niche partitioning may promote coexistence of Pygoscelis penguins as climate-induced sympatry occurs. Ecol. Evol. 8, 9764–9778. doi: 10.1002/ece3.4445
Pinheiro, J., Bates, D., Debroy, S., Sarkar, D., and R Core Team. (2019). Linear and Nonlinear Mixed Effects Models. Vienna: R Foundation for Statistical Computing.
Polito, M. J., Lynch, H. J., Naveen, R., and Emslie, S. D. (2011a). Stable isotopes reveal regional heterogeneity in the pre-breeding distribution and diets of sympatrically breeding Pygoscelis spp. penguins. Mar. Ecol. Prog. Ser. 421, 265–277. doi: 10.3354/meps08863
Polito, M. J., Trivelpiece, W. Z., Karnovsky, N. J., Ng, E., Patterson, W. P., and Emslie, S. D. (2011b). Integrating stomach content and stable isotope analyses to quantify the diets of pygoscelid penguins. PLoS One 6:e26642. doi: 10.1371/journal.pone.0026642
Post, D. M. (2002). Using stable isotopes to estimate trophic position: models, methods, and assumptions. Ecology 83, 703–718. doi: 10.1890/0012-9658(2002)083[0703:usitet]2.0.co;2
Quezada-Romegialli, C., Jackson, A. L., Hayden, B., Kahilainen, K. K., Lopes, C., and Harrod, C. (2018). tRophicPosition, an r package for the Bayesian estimation of trophic position from consumer stable isotope ratios. Methods Ecol. Evol. 9, 1592–1599. doi: 10.1111/2041-210x.13009
R Core Team. (2020). R: a Language and Environment for Statistical Computing. Vienna: R Foundation for Statistical Computing.
Sailley, S. F., Ducklow, H. W., Moeller, H. V., Fraser, W. R., Schofield, O. M., Steinberg, D. K., et al. (2013). Carbon fluxes and pelagic ecosystem dynamics near two Western Antarctic Peninsula Adelie penguin colonies: an inverse model approach. Mar. Ecol. Prog. Ser. 492, 253–272. doi: 10.3354/meps10534
Schmidt, K., and Atkinson, A. (2016). “Feeding and food processing in Antarctic krill (Euphausia superba Dana),” in Biology and Ecology of Antarctic Krill, ed. V. Siegel (Cham: Springer International Publishing), 175–224. doi: 10.1007/978-3-319-29279-3_5
Schofield, O., Ducklow, H., Bernard, K., Doney, S., Patterson-Fraser, D., Gorman, K., et al. (2013). Penguin biogeography along the West Antarctic Peninsula: testing the canyon hypothesis with Palmer LTER observations. Oceanography 26, 78–80.
Sears, J., Hatch, S. A., and O’brien, D. M. (2009). Disentangling effects of growth and nutritional status on seabird stable isotope ratios. Oecologia 159, 41–48. doi: 10.1007/s00442-008-1199-3
Soreide, J. E., Tamelander, T., Hop, H., Hobson, K. A., and Johansen, I. (2006). Sample preparation effects on stable C and N isotope values: a comparison of methods in Arctic marine food web studies. Mar. Ecol. Prog. Ser. 328, 17–28. doi: 10.3354/meps328017
Stammerjohn, S., Massom, R., Rind, D., and Martinson, D. (2012). Regions of rapid sea ice change: an inter-hemispheric seasonal comparison. Geophys. Res. Lett. 39:L06501.
Stammerjohn, S. E., Martinson, D. G., Smith, R. C., and Iannuzzi, R. A. (2008). Sea ice in the Western Antarctic Peninsula region: spatio-temporal variability from ecological and climate change perspectives. Deep Sea Res. Part II Top. Stud. Oceanogr. 55, 2041–2058. doi: 10.1016/j.dsr2.2008.04.026
Stock, B. C., Jackson, A. L., Ward, E. J., Parnell, A. C., Phillips, D. L., and Semmens, B. X. (2018). Analyzing mixing systems using a new generation of Bayesian tracer mixing models. PeerJ 6:e5096. doi: 10.7717/peerj.5096
Stowasser, G., Atkinson, A., Mcgill, R. A. R., Phillips, R. A., Collins, M. A., and Pond, D. W. (2012). Food web dynamics in the Scotia Sea in summer: a stable isotope study. Deep Sea Res. Part II Top. Stud. Oceanogr. 59, 208–221. doi: 10.1016/j.dsr2.2011.08.004
Strycker, N., Wethington, M., Borowicz, A., Forrest, S., Witharana, C., Hart, T., et al. (2020). A global population assessment of the Chinstrap penguin (Pygoscelis antarctica). Sci. Rep. 10:19474.
Tanton, J. L., Reid, K., Croxall, J. P., and Trathan, P. N. (2004). Winter distribution and behaviour of gentoo penguins Pygoscelis papua at South Georgia. Polar Biol. 27, 299–303. doi: 10.1007/s00300-004-0592-6
Trathan, P. N., and Agnew, D. (2010). Climate change and the Antarctic marine ecosystem: an essay on management implications. Antarct. Sci. 22, 387–398. doi: 10.1017/s0954102010000222
Trathan, P. N., Forcada, J., and Murphy, E. J. (2007). Environmental forcing and Southern Ocean marine predator populations: effects of climate change and variability. Philos. Trans. R. Soc. B Biol. Sci. 362, 2351–2365. doi: 10.1098/rstb.2006.1953
Trathan, P. N., Fretwell, P. T., and Stonehouse, B. (2011). First recorded loss of an emperor penguin colony in the recent period of Antarctic regional warming: implications for other colonies. PLoS One 6:e14738. doi: 10.1371/journal.pone.0014738
Trivelpiece, W. Z., Buckelew, S., Reiss, C., and Trivelpiece, S. G. (2007). The winter distribution of chinstrap penguins from two breeding sites in the South Shetland Islands of Antarctica. Polar Biol. 30, 1231–1237. doi: 10.1007/s00300-007-0283-1
Trivelpiece, W. Z., Hinke, J. T., Miller, A. K., Reiss, C. S., Trivelpiece, S. G., and Watters, G. M. (2011). Variability in krill biomass links harvesting and climate warming to penguin population changes in Antarctica. Proc. Natl. Acad. Sci. USA 108, 7625–7628. doi: 10.1073/pnas.1016560108
Vacchi, M., La Mesa, M., Dalu, M., and Macdonald, J. (2004). Early life stages in the life cycle of Antarctic silverfish, Pleuragramma antarcticum in Terra Nova Bay, Ross Sea. Antarct. Sci. 16, 299–305. doi: 10.1017/s0954102004002135
Vander Zanden, M. J., Cabana, G., and Rasmussen, J. B. (1997). Comparing trophic position of freshwater fish calculated using stable nitrogen isotope ratios (δ15N) and literature dietary data. Can. J. Fish. Aquat. Sci. 54, 1142–1158. doi: 10.1139/f97-016
Volkman, N. J., Presler, P., and Trivelpiece, W. (1980). Diets of pygoscelid penguins at King George Island, Antarctica. Condor 82, 373–378. doi: 10.2307/1367558
Volkman, N. J., and Trivelpiece, W. Z. (1980). Growth in pygoscelid penguin chicks. J. Zool. 191, 521–530. doi: 10.1111/j.1469-7998.1980.tb01483.x
Keywords: δ13C and δ15N stable isotopes, food web, Pygoscelis penguin, reproduction, sea ice, western Antarctic Peninsula
Citation: Gorman KB, Ruck KE, Williams TD and Fraser WR (2021) Advancing the Sea Ice Hypothesis: Trophic Interactions Among Breeding Pygoscelis Penguins With Divergent Population Trends Throughout the Western Antarctic Peninsula. Front. Mar. Sci. 8:526092. doi: 10.3389/fmars.2021.526092
Received: 11 January 2020; Accepted: 19 July 2021;
Published: 08 September 2021.
Edited by:
Angel Borja, Technological Center Expert in Marine and Food Innovation (AZTI), SpainReviewed by:
Andres Barbosa, National Museum of Natural Sciences (MNCN), SpainIsabel García-Barón, Marine Research Division, Technology Center Expert in Marine and Food Innovation (AZTI), Spain
Copyright © 2021 Gorman, Ruck, Williams and Fraser. This is an open-access article distributed under the terms of the Creative Commons Attribution License (CC BY). The use, distribution or reproduction in other forums is permitted, provided the original author(s) and the copyright owner(s) are credited and that the original publication in this journal is cited, in accordance with accepted academic practice. No use, distribution or reproduction is permitted which does not comply with these terms.
*Correspondence: Kristen B. Gorman, a2Jnb3JtYW5AYWxhc2thLmVkdQ==