
94% of researchers rate our articles as excellent or good
Learn more about the work of our research integrity team to safeguard the quality of each article we publish.
Find out more
ORIGINAL RESEARCH article
Front. Mar. Sci., 21 December 2020
Sec. Marine Biogeochemistry
Volume 7 - 2020 | https://doi.org/10.3389/fmars.2020.611870
This article is part of the Research TopicUnraveling Mechanisms Underlying Annual Plankton Blooms in the North Atlantic and their Implications for Biogenic Aerosol Properties and Cloud FormationView all 22 articles
 Cleo L. Davie-Martin1†
 Stephen J. Giovannoni1
 Michael J. Behrenfeld2
 William B. Penta1
 Kimberly H. Halsey1*
Marine-derived volatile organic compounds (VOCs) influence global carbon cycling, atmospheric reactions, and climate. Yet, the biogenic production (sources) and consumption (sink) rates of marine VOCs are not well-constrained and are currently excluded from global chemical transport models. We directly measured the net biogenic production rates of seven VOCs (acetaldehyde, acetone, acetonitrile, dimethylsulfide, isoprene, methanethiol, and methanol) in surface seawater during four field campaigns in the North Atlantic Ocean that targeted different stages of the phytoplankton annual cycle. All of the VOCs exhibited strong seasonal trends, with generally positive rates during May (peak spring bloom) and lower, sometimes negative rates (net consumption), during November and/or March (the winter bloom minimum transition). Strong latitudinal gradients were identified for most VOCs during May and September, with greater production observed in the northern regions compared to the southern regions. These gradients reflect the interplay between high phytoplankton and bacterial productivity. During the bloom transition stages (March and September), acetaldehyde and acetone exhibited net production rates that bracketed zero, suggesting that biogenic production was either very low or indicative of a tightly coupled system with more complex underlying microbial VOC cycling. Our data provides the first direct evidence for widespread biogenic acetonitrile production and consumption in the surface ocean and the first net biogenic production rates for methanethiol in natural seawater.
Volatile organic compounds (VOCs), such as isoprene and acetaldehyde, have high vapor pressures (US EPA, 2017) that expedite their transfer from aqueous systems into the atmosphere. VOCs produced in marine systems can ultimately influence the oxidative capability and chemistry of the atmosphere through the formation of radicals, secondary organic aerosols, and cloud condensation nuclei (Quinn and Bates, 2011). Furthermore, while it is recognized that VOCs are actively cycled in marine ecosystems, little is known about the biological mechanisms and sources of VOCs, their diversity, and the conditions that influence VOC accumulation in the surface ocean. Numerous studies have hypothesized that phytoplankton and bacterial metabolism are marine biogenic sources and sinks of VOCs, including methanol (Millet et al., 2008) and acetonitrile (de Gouw, 2003; Singh et al., 2003). Until recently, challenges in VOC detection due to instrumental limitations and VOC reactivity have resulted in relatively few VOC measurements in marine ecosystems. Dixon et al. (2013) reported the first gross production rates of methanol, acetaldehyde, and acetone (ranging from 2-103 mol L–1 d–1) from natural seawater communities in the Atlantic Ocean. However, abiotic VOC production from the photochemical degradation of chromophoric dissolved organic matter (CDOM) is known to play a significant role in the production of various carbonyl compounds in marine surface waters (Kieber et al., 1990; Mopper et al., 1991; de Bruyn et al., 2011) and distinctions between these abiotic and biogenic production processes are often overlooked. Numerous studies have revealed the capacity of marine phytoplankton cultures to produce a variety of VOCs (Moore et al., 1994; Shaw et al., 2003), although measurements of biogenic production and consumption in the natural marine environment are currently lacking.
Volatile organic compounds measured in algal cultures vary with the species employed and environmental conditions (Halsey et al., 2017; Lawson et al., 2019). Yet, a growing body of work provides evidence for VOC cycling between planktonic groups in the surface ocean. For example, the range of VOCs consumed by abundant chemoheterotrophic bacteria, Pelagibacter, includes methanol (Sun et al., 2011), acetaldehyde (Halsey et al., 2017), acetone, cyclopentanol, cyclohexanol, and other yet unidentified compounds (Moore et al., 2020), but Pelagibacter can also simultaneously produce the climate-active gases, dimethylsulfide (DMS) and methanethiol, through metabolism of dimethylsulfoniopropionate (DMSP) (Sun et al., 2016). Other bacterioplankton are known to utilize assortments of single-carbon compounds for energy production or, in the cases of methanol and formaldehyde, a carbon source for assimilation into biomass (i.e., growth) (Dixon et al., 2011a, b; Sun et al., 2011; Halsey et al., 2012). Thus, cycling patterns are emerging, where carbon-based metabolites released by phytoplankton (e.g., VOCs and DMSP) provide nutritional requirements and serve as energy sources for bacterioplankton. In a diatom-Pelagibacter co-culture, the magnitude of these cycles summed to 20% of the total carbon fixed by the diatom (Moore et al., 2020). That work revealed the potential importance of these cycles in controlling VOC accumulation in the surface ocean, but they have not been explored across large spatial and temporal scales in natural seawater plankton populations.
Marine-derived VOCs released to the atmosphere constitute a loss of photosynthetically fixed carbon. The contributions of biogenic VOCs to the marine carbon cycle are not well constrained and are often ignored in global chemical transport models. New information about the ecology of VOC production in the marine surface ocean is needed to advance models for which the underlying biological source terms for VOC air-sea exchange are unknown. Here, we present new approaches that couple proton-transfer-reaction time-of-flight mass spectrometry (PTR-ToF/MS) with incubation chambers to measure net rates of biogenic VOC production in natural seawater suspensions. Our methods build on a previously published approach (Halsey et al., 2017) to measure VOC production in axenic cultures in the laboratory. Throughout four field campaigns in the North Atlantic Ocean (November 2015, May 2016, September 2017, and March 2018), we assessed biologically mediated VOC production during different stages of the annual phytoplankton cycle. In this manuscript, we use “biogenic production” to refer to the direct (e.g., metabolism) or indirect (e.g., diffusion or cell lysis) emissions of VOCs by marine phytoplankton and bacterioplankton. We use “microbial consumption” to refer to the processes of VOC oxidation to CO2 for energy and assimilation of VOCs into bacterial biomass for growth. Our measurements allow us to discriminate between the biogenic contributions to VOC production and abiotic processes, such as the photochemical degradation of CDOM and physically driven sea-air gas exchange. This work was carried out as part of the North Atlantic Aerosols and Marine Ecosystems Study (NAAMES), a 5-year multidisciplinary investigation into the drivers and controls on annual phytoplankton bloom dynamics and the interplay between surface ocean, marine aerosol, and cloud properties. For reference, Behrenfeld et al. (2019) provide a scientific overview and summary of the overarching NAAMES objectives, including a more detailed account of the measurement strategies and conditions encountered during each of the field campaigns.
The NAAMES study region in the Western North Atlantic Ocean covers a wide range of both temporal and spatial ecosystem variability (18–56°N and 71–37°W). We assessed biologically mediated VOC production during different stages of the annual phytoplankton bloom through field campaigns in November 2015, May 2016, September 2017, and March 2018 (Figure 1) (Behrenfeld et al., 2019). Discrete natural surface seawater samples (∼5 m) were collected 2–5 times a day, during daylight and nighttime hours, throughout each campaign from either the in-line flow-through seawater system during transit or from overboard casts with a conductivity temperature depth (CTD) rosette system while on station. Six to eleven stations along a north-to-south transect at approximately 40°W were occupied during each campaign (Figure 1). Supplementary Table S1 provides a summary of station locations and occupation dates, as well as the physical and biological parameters characterizing each site. Lagrangian drifters were deployed upon arrival at each station and were used to maintain our position within a water mass throughout each occupation (9–97 h).
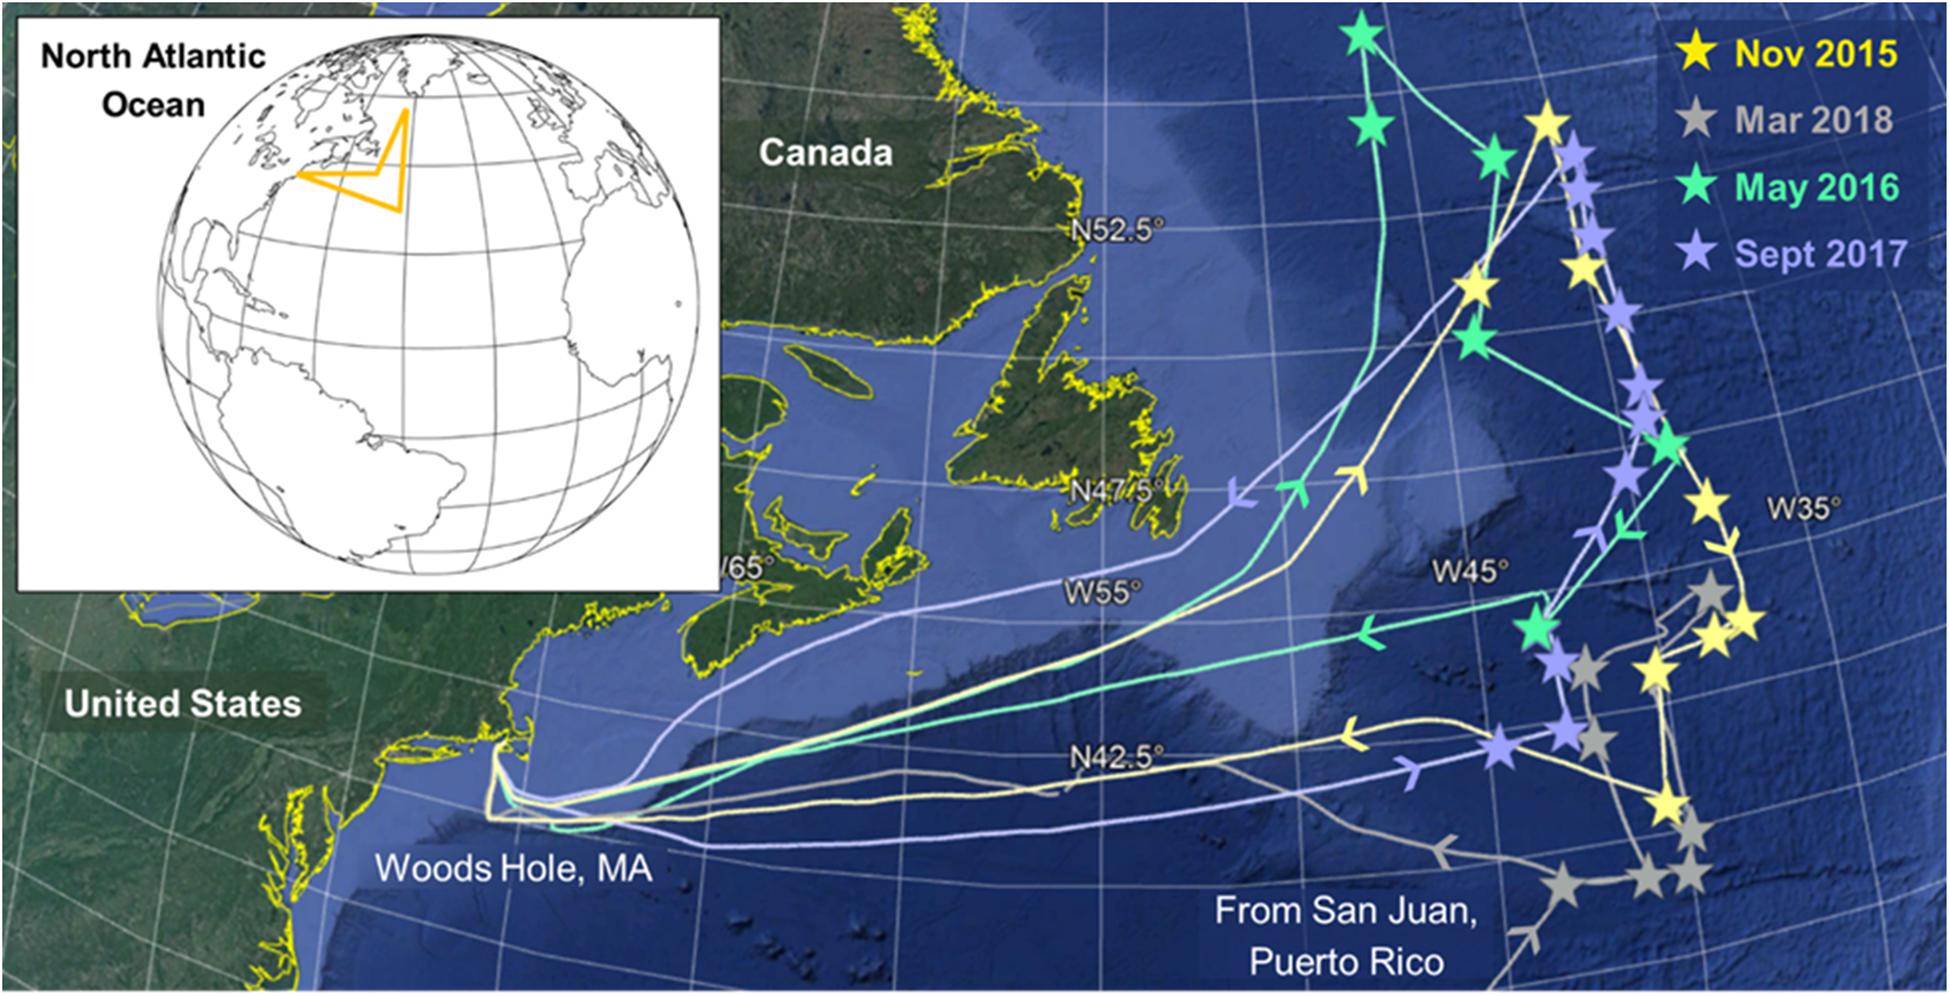
Figure 1. Cruise tracks and station locations (stars) in the Western North Atlantic Ocean during the four North Atlantic Aerosols and Marine Ecosystem Study (NAAMES) field campaigns. The main sampling intensives occurred along a north-to-south transect at approximately 40°W. During March 2018, we departed from San Juan, Puerto Rico instead of Woods Hole, MA, United States.
Natural seawater suspensions (100 mL) were incubated in 200 mL polycarbonate dynamic stripping chambers (Supplementary Figure S1) at temperatures and light intensities (provided from white and blue LEDs; Aqua Illumination, Ames, IA, United States) equivalent to those in the surface ocean at the time of collection. Light intensities were calibrated using a quantum scalar laboratory radiometer (Biospherical Instruments Inc., San Diego, CA, United States). Our set-up consisted of two low-temperature incubators (VWR International, Radnor, PA, United States) with the combined capacity for six dynamic stripping chambers that could be monitored and experimentally manipulated simultaneously. Abiotic controls were prepared by gravity filtration of natural seawater through 0.22 μm Sterivex filters (Millipore Sigma, Burlington, MA, United States) and the filtrate was stored in the dark prior to analysis to prevent formation of VOCs by photochemical degradation of CDOM. Each incubator contained one abiotic control chamber and two replicate natural seawater sample chambers. During measurements, synthetic air containing 320 ppm carbon dioxide was bubbled at a flow rate of 250 sccm (delivered by gas flow controllers; Sierra Instruments, Monterey, CA, United States) through sintered glass frits (2–2.5 μm) at the base of the polycarbonate chambers for 1 h (Supplementary Figure S1). Neither seawater acidification (measured by pH meter) nor significant algal lysis (assessed using flow cytometry that detected cells up to 60 μm in diameter) resulted from continuous bubbling during the measurement period. Nevertheless, we cannot discount the possibility that some VOC production was caused by bubbling-induced stress.
A PTR-TOF-1000 (IONICON Analytik GmbH, Innsbruck, Austria) was used to quantify the net biogenic production rates of seven target VOCs (acetaldehyde, acetone, acetonitrile, DMS, isoprene, methanethiol, and methanol) that are known to be present in marine environments and produced and/or consumed by marine plankton. PTR-ToF/MS data were acquired at 1 or 5 s intervals across the mass range 18–363 a.m.u. The PTR-ToF/MS can acquire data for only one chamber at a time and as such, a flow-through multiport valve (RJ Lee Group Inc., Monroeville, PA, United States) was used to sequentially switch between chambers and divert the headspace sample from the selected chamber into the PTR-ToF/MS inlet for 60 s each. Chambers were bubbled for 2 min prior to data acquisition to flush out the initial headspace and allow the bubbling to stabilize after activation of the air flow. Initiation of bubbling was also staggered by 1 min intervals so that each chamber was sampled at the same time periods relative to initial data acquisition. All sample lines between the incubators and the PTR-ToF/MS inlet were heated to approximately 60°C to prevent condensation within the tubing.
The fundamentals of PTR-ToF/MS technology have been described elsewhere (Lindinger and Jordan, 1998; de Gouw et al., 2003). Briefly, primary ions (protonated water, H3O+) are produced from pure water vapor in a hollow cathode ion source at a flow rate of 5.5 sccm. When the sample headspace reaches the PTR-ToF/MS inlet, it enters the sample drift tube, where proton-transfer reactions (ionization) occur between H3O+ and gaseous VOCs with proton affinities greater than that of water (691 kJ mol–1). The conditions within the drift tube were 2.3 mbar, 80°C, and 600 V, which equated to a field strength (E/N) of 133 Td (where Td = 10–17 cm2 V molecule–1). Reactions occurring in the drift tube are usually non-dissociative and thus, compounds do not fragment during ionization and exhibit a protonated mass of M + 1. Data analysis of the PTR-ToF/MS files was performed in PTR-Viewer version 3.2.8.0 software (IONICON Analytik GmbH, Innsbruck, Austria). Further details on the instrument mass calibration, peak fitting procedures, and calculation of mixing ratios are available in Supplementary Section 1 and Supplementary Table S2.
Background concentrations of VOCs arising from the experimental setup were determined by monitoring the VOCs evolved from autoclaved, bubbled artificial seawater (ASW, i.e., “VOC-free” seawater) at different temperatures (Figure 2 and Table 1). Further details on the derivation and temperature-dependence of the background VOC concentrations and ASW composition are provided in Supplementary Section 1 and Supplementary Figure S2. Abiotic controls (0.22 μm gravity filtered natural seawater) were used to account for the physical removal (“stripping”) of VOCs from the seawater due to the bubbling process (Figure 2). VOC concentrations in abiotic controls were calculated for each measurement using the regression models listed in Supplementary Table S3. Additional details on the temperature-dependence and computation of abiotic control concentrations is available in Supplementary Section 1 and Supplementary Table S3. Note that isoprene was very quickly stripped from the seawater (<30 s) and as such, it was not possible to fit a regression model to the abiotic controls for isoprene.
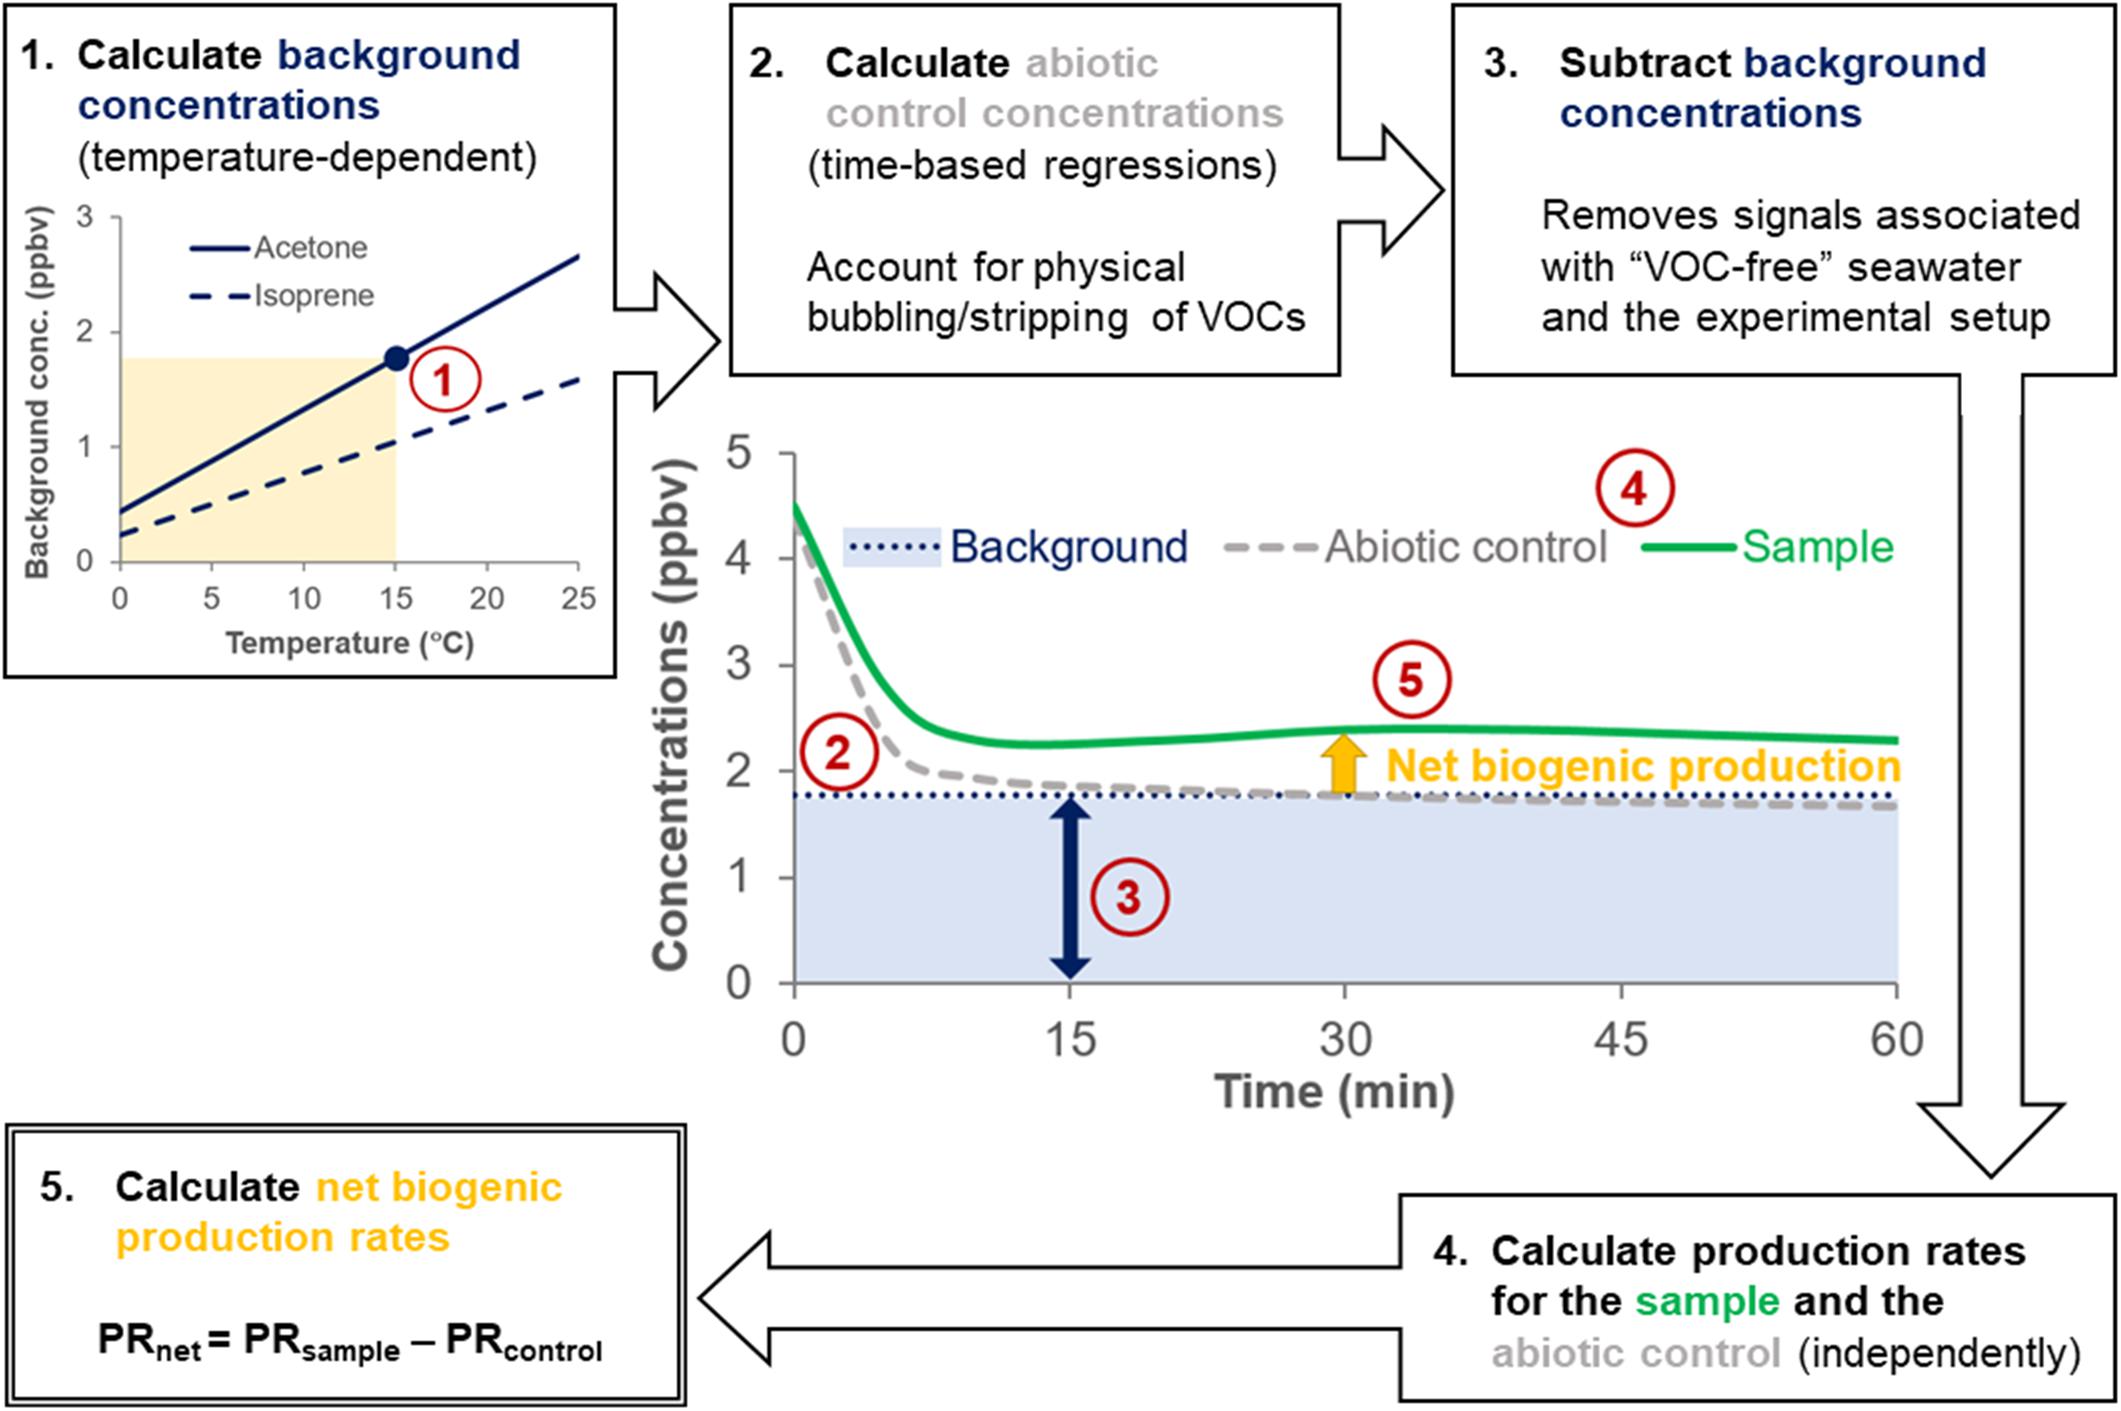
Figure 2. Flow chart showing the calculation steps to obtain net VOC production rates. The flowchart is illustrated with hypothetical data. For example, in step 1, a background acetone concentration of 1.77 ppbv was calculated for a surface seawater sample collected at 15°C (yellow shading). Temperature-dependent background concentrations determined from measurements of autoclaved and bubbled (“VOC-free”) artificial seawater (blue line) are subtracted from sample concentrations (green line) and abiotic control concentrations (gray line) to account for signals arising from the experimental setup. VOC production rates from abiotic controls are subtracted from the sample VOC production rates to account for the physical removal (“stripping”) of VOCs caused by bubbling, yielding the net biogenic production rate (yellow arrow).
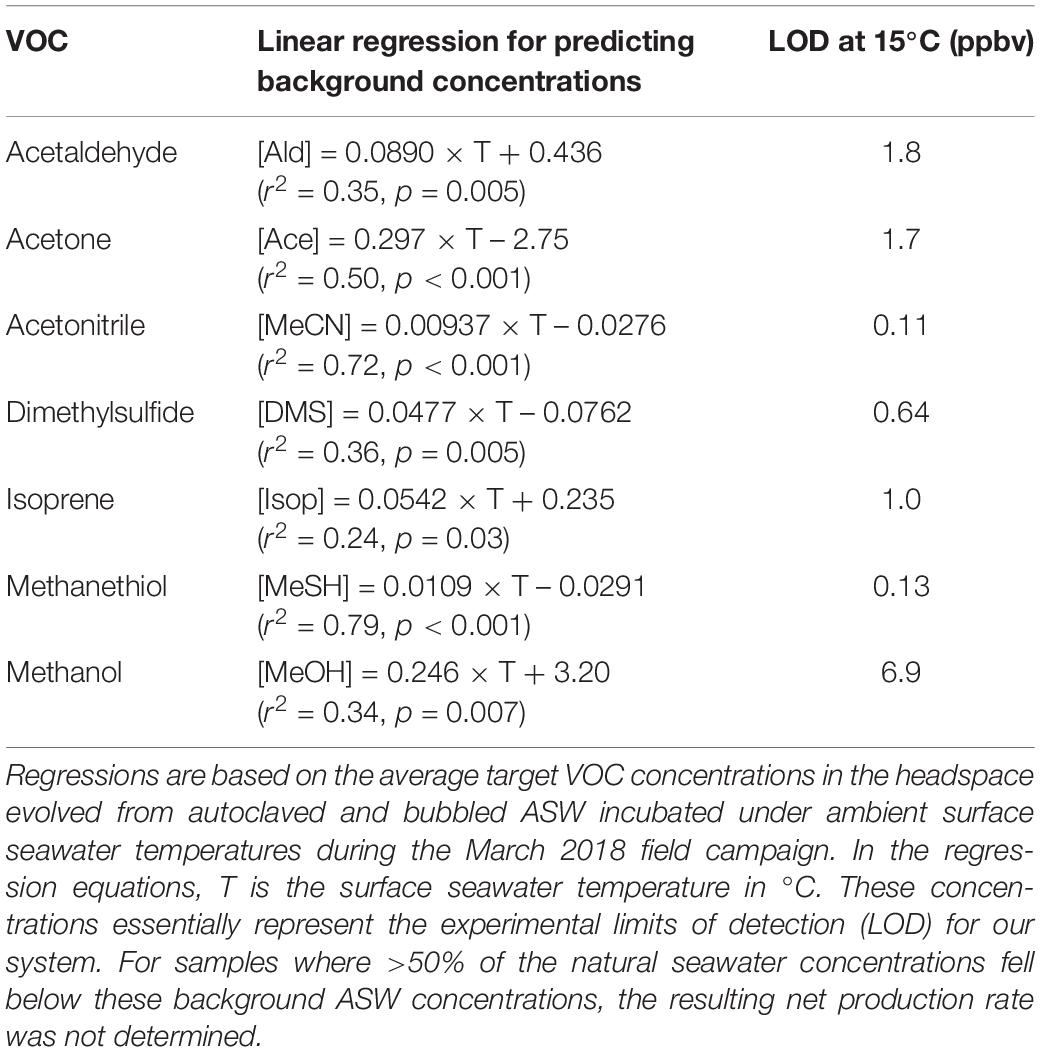
Table 1. Linear temperature regressions used to derive background concentrations (ppbv) of target VOCs.
Production rates (PR, nmol L–1 h–1) for samples and abiotic controls were calculated as:
where Cnatural is the mixing ratio of the VOC in the headspace of the bubbled natural (sample) or filtered (abiotic control) seawater, CASW is the temperature-corrected mixing ratio of the VOC in the headspace of the bubbled autoclaved ASW, Q is the air flow rate bubbled through the seawater (15 L h–1), p is the atmospheric pressure (1 atm assumed), VW is the volume of seawater in the sample (0.1 L), R is the gas constant (0.0821 L atm K–1 mol–1), and T is the seawater temperature (K) at the time of sample collection. Production rates were only calculated when > 50% of the blank-subtracted sample concentrations (Cnatural - CASW) were > 0 ppbv for each VOC and were averaged over a 1-h period. Net biogenic rates of production (PRnet) for each target VOC were calculated by subtraction of the abiotic control production rates (PRcontrol) from the sample production rates (PRsample) for each experiment (Figure 2):
Sample replicates (where n = 1–4) were averaged and where reported, standard errors are based on replicate error. Here, it is also important to note that negative net production rates could not be calculated for isoprene, because it was stripped too quickly from the seawater and it was not possible to fit an abiotic control (i.e., PRcontrol = 0).
Gas standards containing ∼1 ppm of acetaldehyde, acetone, DMS, and isoprene were obtained from Matheson Tri-Gas (Newark, CA, United States). Serial dilutions were performed with synthetic air that had passed through a dynamic stripping chamber filled with 100 mL of ASW media (to mimic the viscosity and relative humidity produced during the bubbling of natural seawater samples). The full dilution series (0–160 ppbv) was used to test the dynamic linear range of the instrument approximately once every fortnight. Two-point calibration curves (0 and 80–120 ppbv) were run daily to calculate multiplier factors for each target VOC from the inverse slope of the linear regression between measured and expected concentrations (Supplementary Table S4). Calibration with gas standards of known concentration enhances the quantification accuracy (±20%) (de Gouw and Warneke, 2007) because it inherently accounts for any uncertainties associated with the instrumental parameters and allows dynamic (linear) response ranges to be established. Where gas standards were unavailable or absent (e.g., acetonitrile, methanethiol, and methanol), we used the pseudo-absolute kinetic-based approach for quantification, which is typically associated with higher uncertainties (±50%) (Ionicon Analytik GmbH, 2016).
R Studio version 1.1.463 (Boston, MA, United States) was used for all statistical analyses, including one-way analysis of variance (ANOVA) to assess seasonal trends in net VOC production rates and pairwise t-tests with Bonferroni corrections for determining statistically significant differences between seasons for target VOCs. Linear regressions were fitted to obtain Spearman’s correlation coefficients and p-values to explore spatial trends in north-to-south and west-to-east gradients.
Additional physical, chemical, and biological measurements and the underway ship data collected across all four NAAMES campaigns [e.g., net primary production (NPP), dissolved organic carbon (DOC), photosynthetically active radiation (PAR), chlorophyll-a etc.] are publically available at: doi: 10.5067/SeaBASS/NAAMES/DATA001 (National Aeronautics, and Space Administration [NASA], 2020; Werdell and Bailey, 2002). Documentation includes descriptions of collection methods, sample processing, calibration, and analysis.
Here we report net rates of biogenic VOC production from natural seawater communities (including phytoplankton and bacterioplankton). Positive net rates indicate that the biogenic production or release of VOCs by the population as a whole (directly via metabolism or indirectly due to diffusion or cell lysis) are greater than the biological losses, which may be due to microbial consumption (assimilation into biomass for growth and/or microbial oxidation to carbon dioxide for energy) or adsorption/diffusive processes. Negative net rates mean that the loss term outpaced the production term. Our abiotic controls account for physical processes leading to VOC production (e.g., photodegradation of CDOM) and losses (e.g., removal via experimental bubbling). It is also important to keep in mind that the magnitude of the net biogenic production rate is not necessarily in agreement with the magnitude of biological cycling or directly comparable between different VOCs. For example, a small, positive net production rate could be indicative of slow biogenic production or a highly active biological VOC cycle, in which the biogenic production rate is essentially equivalent to the biological loss rate. We refer to the latter phenomenon as “tightly coupled,” which results in a net biogenic production rate close to zero. Large deviations from zero in the net production rates indicate that the system is uncoupled (i.e., biogenic VOC production is > or < biological consumption). It is also important to note that negative net production rates do not preclude VOC release to the atmosphere via physical and abiotic drivers. In later sections, we explore the coupled state of VOC production in the North Atlantic Ocean and environmental factors that influence the balance between the biological VOC production and consumption terms.
Rates of net biogenic VOC production in surface waters were determined across wide spatial and temporal scales in the North Atlantic Ocean. Figure 3 shows the median and range of net production rates for our seven target VOCs during four phases of the annual phytoplankton bloom cycle (monthly averages ± standard errors are available in Supplementary Table S5). Net production rates were generally positive across all seasons for dimethylsulfide, isoprene, and methanethiol, and for all target VOCs during the peak of the annual spring phytoplankton bloom in May. We observed largely negative net production rates for acetaldehyde and methanol during November and March, whereas in September, net acetaldehyde production bracketed zero. Net production rates were statistically different from zero (p < 0.05, one-sided t-test) for all target VOCs and seasons, except for acetaldehyde and acetone during March and September. The absolute net production rates of methanol were generally an order of magnitude higher than most target VOC measurements, whereas acetonitrile and methanethiol typically exhibited rates approximately one order of magnitude lower than acetone, acetaldehyde, DMS, and isoprene (Figure 3).
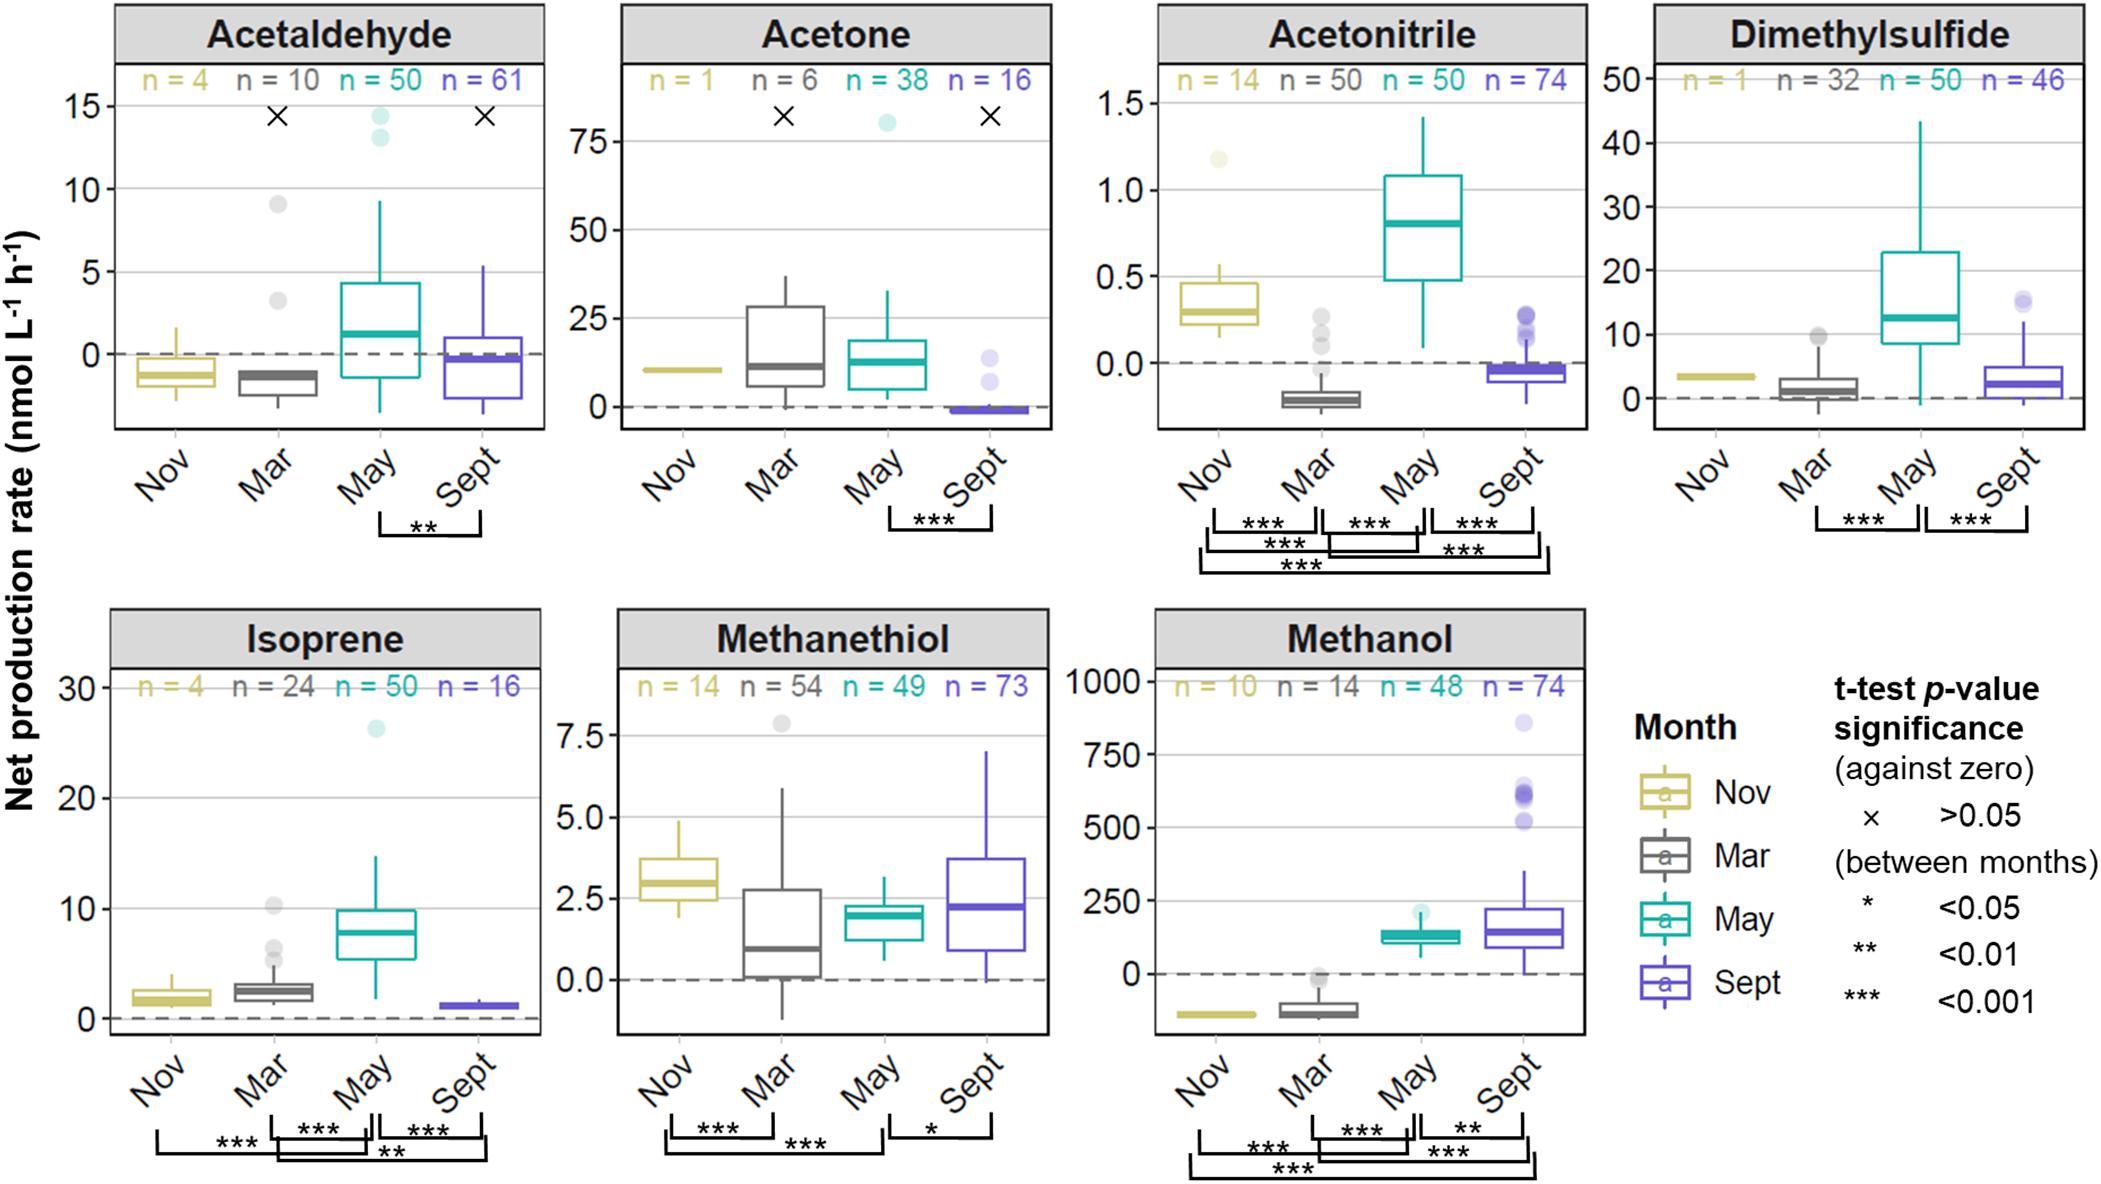
Figure 3. Box and whisker plots showing the range, median, and interquartile range of net VOC production rates for each of four field campaigns that targeted different stages of the annual phytoplankton bloom. Outliers displayed as independent points reflect measurements greater than 1.5 times the interquartile range above and below the median. The number of measurements for each VOC in each month is displayed at the top of each box. These measurements were made from a total of 14, 56, 50, and 74 experiments in November, March, May, and September, respectively. Rates of VOC production that showed no statistical difference (p > 0.05) from zero are indicated with ×. Rates of VOC production that were significantly different between months (pairwise t-tests, p < 0.05) are bracketed and p-value significance indicated with asterisks according to the legend displayed.
Measurements of net production rates were rare during November for most targeted VOCs, as well as for acetaldehyde and acetone during March, because the sample VOC concentrations were lower than background concentrations in >50% of measurements within the 1 h incubation period. These rates were deemed below the limits of detection for our system and not calculated. In addition, we only report herein measurements carried out using the same experimental protocols. Because November was the first of the NAAMES campaigns and the first opportunity to employ our incubation system at sea, we experimented with different bubbling rates and light conditions. Thus, those experimental data are not considered, causing the coverage of net VOC production rates reported during November to be greatly reduced (14 sample measurements) compared to the other months (50–74 sample measurements).
One-way ANOVA revealed statistically significant seasonal differences in net biogenic production rates for all targeted VOCs (p < 0.01). Additional pairwise t-tests were performed to explore differences in net biogenic production between months (levels of significance are indicated with asterisks in Figure 3). Mean net VOC production rates were 4 – 45 times higher during May than September for all targeted VOCs except for methanethiol and methanol, which exhibited slightly higher net production rates during September (Supplementary Table S5). The lowest net VOC production rates were in November and March for the majority of compounds, but net production rates for acetonitrile and methanethiol were approximately two times higher during the deep seasonal mixing in November, than in March. Negative net production rates were measured for methanol during November and March and differed significantly from the positive rates measured during May and September. Net acetonitrile production rates were statistically different between each season, ranging from the most negative net production during March and September to positive net production in November and May. Isoprene was the only target VOC to exhibit higher net production rates (by 2.5 times) in March compared to September.
Our four field campaigns covered wide spatial gradients in the North Atlantic Ocean from 18 to 56°N and 37 to 71°W. Supplementary Figure S3 illustrates measurement locations and overlap between each of the NAAMES field campaigns. There was generally good overlap along the west-to-east transit periods during November, March, and September, and on the north-to-south transect during May and September. However, measurements did not overlap spatially during the November and May or March and May field campaigns. These spatial shifts could influence the interpretation and comparisons of net biogenic production rates between these months. Figure 4 shows sample locations and the relative magnitudes of net biogenic production rates observed for each of the target VOCs during all field campaigns.
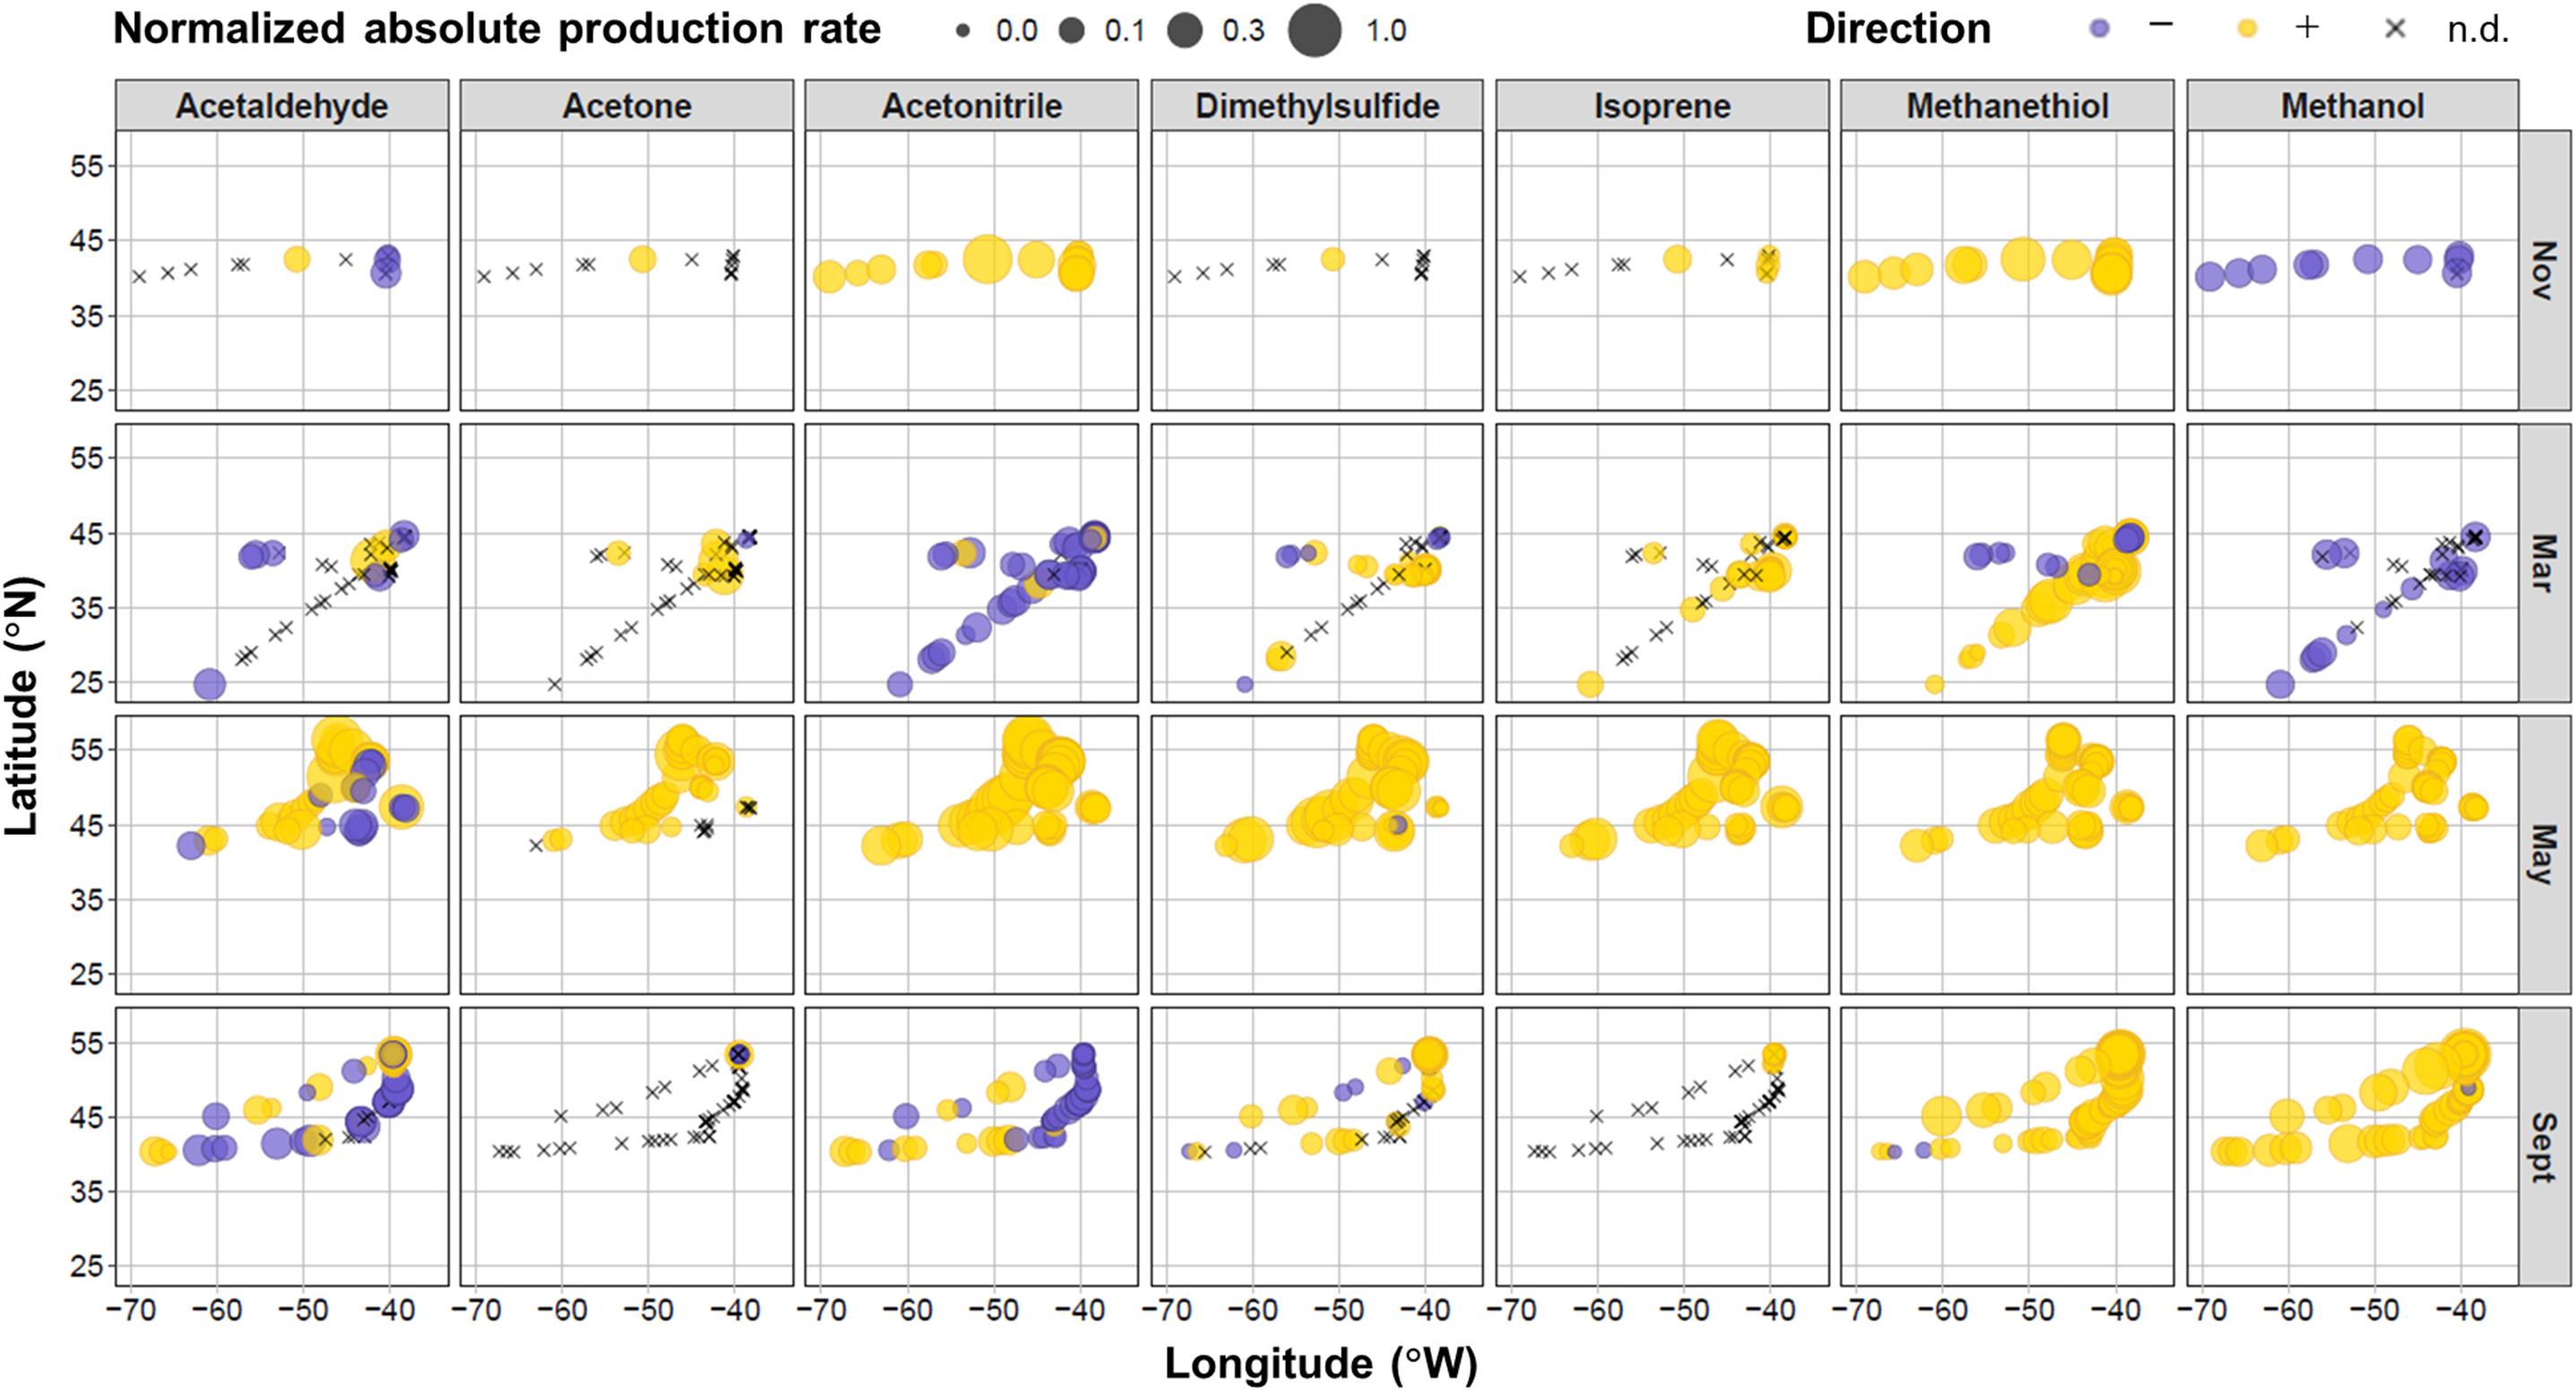
Figure 4. Location of measurements and relative net production rates for target VOCs during the four field campaigns in the North Atlantic Ocean. Net production rates colored purple were negative, yellow were positive, or shown as black crosses when below the experimental limit of detection (n.d.). The size of the bubbles represents the absolute magnitude of the net production rate normalized to the maximum absolute net production rate for each VOC (which were 14.4, 80.2, 1.42, 43.3, 26.3, 7.86, and 859 nmol L− 1 h− 1 for acetaldehyde, acetone, acetonitrile, DMS, isoprene, methanethiol, and methanol, respectively).
A number of spatial patterns emerge in the sign and magnitude of net VOC production rates. Net acetaldehyde production was higher in May at more northerly stations, whereas we primarily observed negative net rates in the easterly and southern locations. Acetone, DMS, and isoprene net production rates were also generally higher in the more northern latitudes during May. These three compounds were generally below the detection limits of our system at more southerly locations. Trends in net acetonitrile production were more strongly determined by seasonal differences than geography, except during September, where net production was positive toward coastal shelf waters and negative in the open ocean to the east. Net methanethiol production was more spatially consistent (largely positive net rates), except during the west-to-east transect in March, where negative production rates were observed. There was no apparent spatial variability in net methanol production. Next, we examine trends in areas of spatial overlap along the west-to-east longitudinal and north-to-south latitudinal gradients.
Table 2 and Supplementary Figure S4 show emergent relationships between net biogenic production rates and latitudinal/longitudinal gradients for our target. VOCs Net production rates of all target VOCs, except methanethiol, were more positive toward more northerly locations during May. The same was true in September for all target VOCs, except acetone and isoprene. The trends we observed with longitude were less consistent. We found that net production rates of DMS, isoprene, and methanethiol were lower nearer the coastal shelf and more positive toward the open ocean to the east during March. In September, methanethiol was positively correlated with longitude (rs = 0.71, p = 0.003), exhibiting more positive net production in the open ocean and more tightly coupled production nearer the coast. In contrast, acetonitrile was negatively correlated with longitude during September (rs = −0.55, p = 0.03) and showed more positive net production in the coastal shelf waters and tighter coupling toward the open ocean.
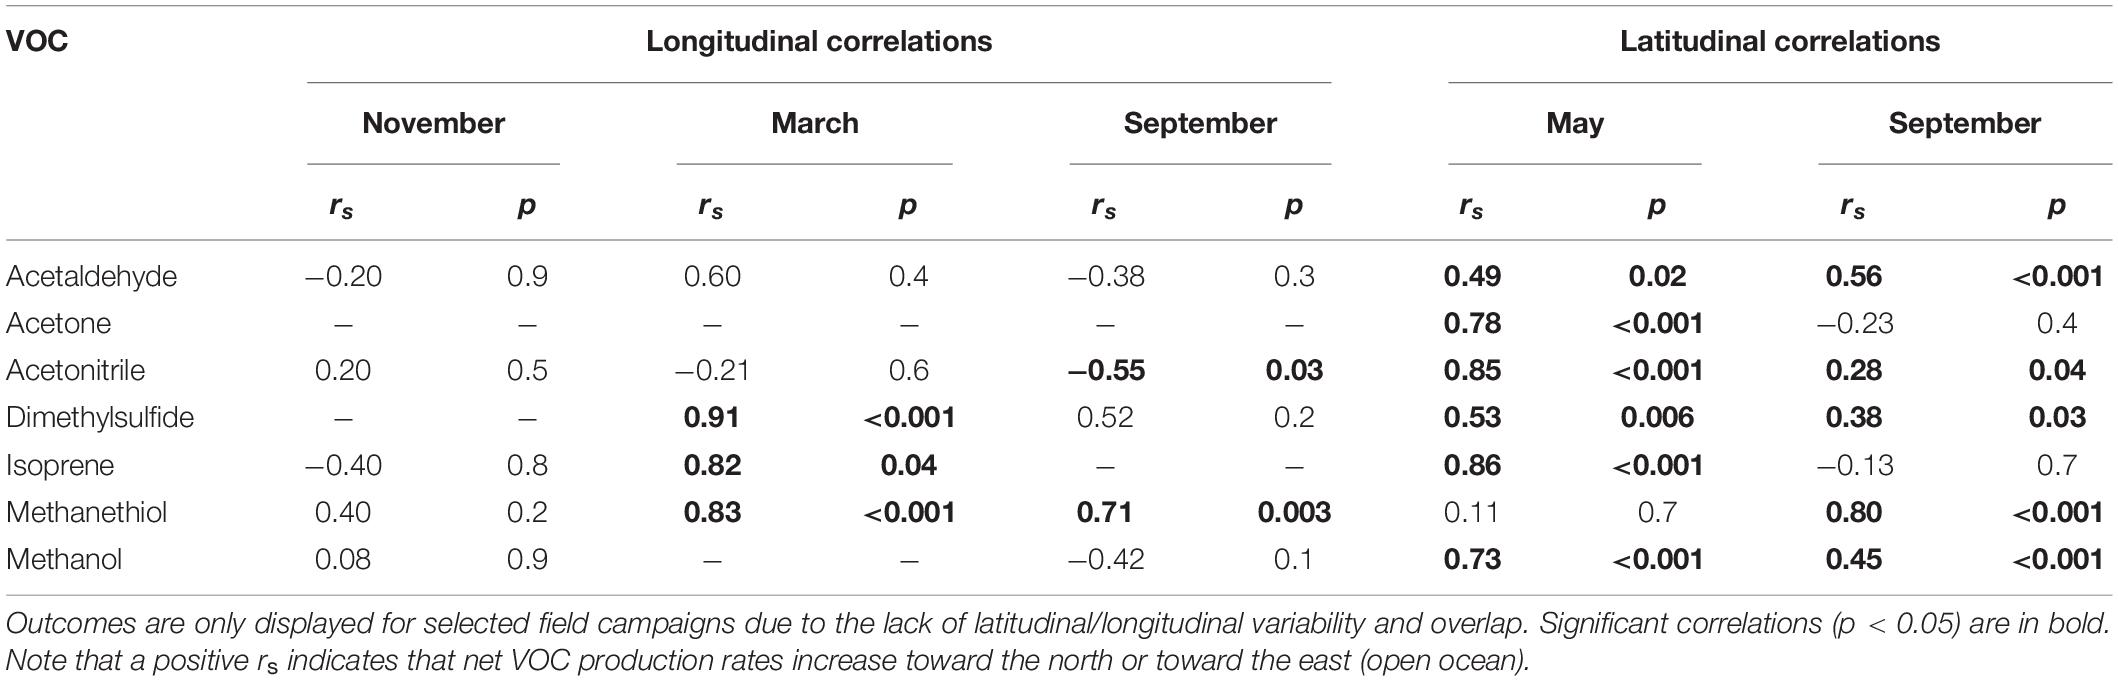
Table 2. Spearman’s rank outcomes (rs and p) for correlations between net VOC production rates and latitude (for north-to-south gradients between 44 and 38°W) or longitude (for west-to-east gradients between 40 and 44°N) during different months.
During the September field campaign, we occupied the northernmost station (S6 at 53.376°N, −39.542°W) for 97 h and performed round-the-clock measurements to investigate diel variability in VOC production rates. Figure 5 shows time series for the normalized net production rates of each target VOC during the long-term S6 occupation. Acetaldehyde, DMS, and methanethiol exhibited peaks in biogenic net production during dawn to midday on days 2 and 3. The lack of measurements during daylight hours on day 4 makes it unclear whether the morning net production peak is a consistent feature that gradually decreased in intensity over the period of station occupation. However, the last measurements collected on day 5 indicate that this pattern likely occurred for acetaldehyde and DMS (Figure 5). DMS sometimes revealed a second peak on or shortly after nightfall that decreased toward a more tightly coupled state by dawn.
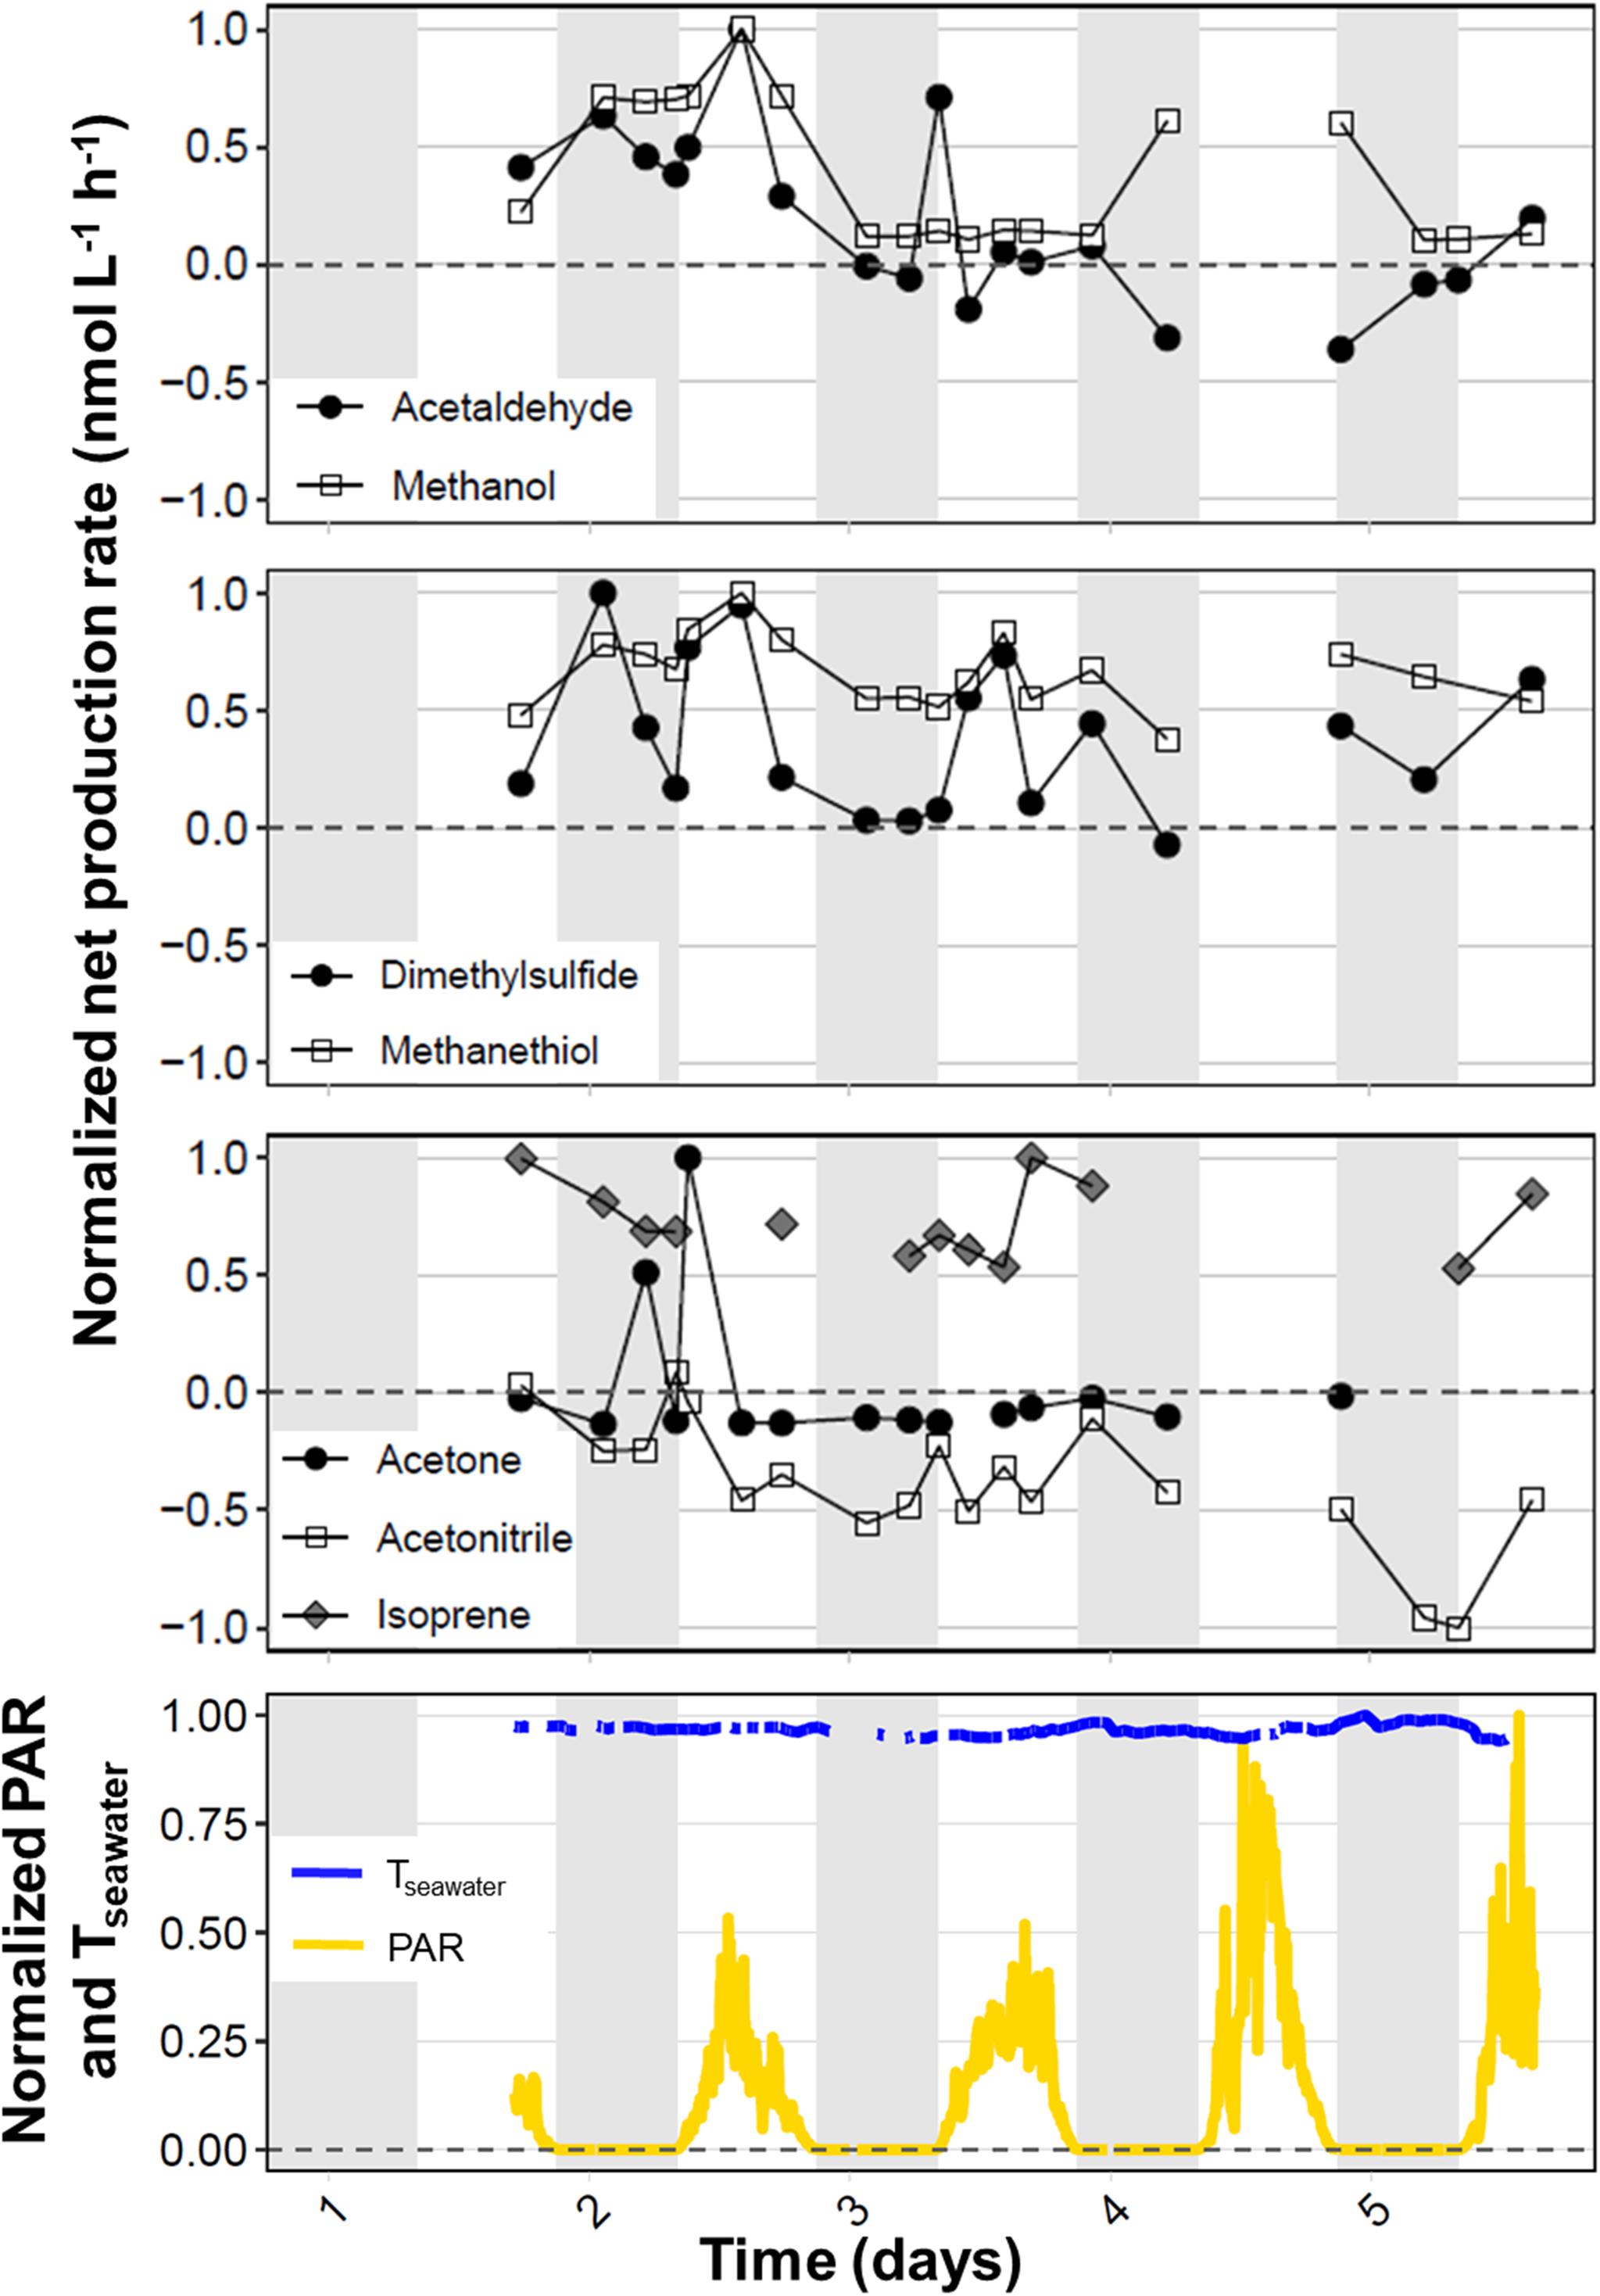
Figure 5. Timeseries showing diel variability in net VOC production rates during a 97-h occupation at the northernmost station (53.376°N, –39.542°W) during the September field campaign. Net production rates were normalized to the highest absolute net production rate observed for each target VOC during the long-term station. The horizontal dotted line represents a net production rate of zero and the gray shading indicates periods of darkness (∼21:00 to 08:00 UTC). The bottom panel shows the photosynthetically active radiation (PAR, μmol photons m− 2 s− 1) and seawater temperature (Tseawater, °C), also normalized to their highest values (1657 μmol photons m− 2 s− 1 and 12.1°C, respectively).
Net methanol production was very high during day 2 at station S6, with a peak during midday that was, in fact, the highest net methanol production rate recorded during the four NAAMES campaigns. During days 3 and 5, net methanol production appeared to reach a steady net production rate of approximately 100 nmol L–1 h–1, but net production increased again during nighttime on day 4. Acetone exhibited strong net production during the night and again in the early morning of day 2, but these higher production rates were not repeated throughout subsequent days on station. Instead, net acetone production stabilized near zero. Acetonitrile displayed less diel variability than the other target VOCs, with generally small negative net production rates that gradually decreased over the 5 days. Trends in diel isoprene cycling are difficult to interpret due to the lack of consistent measurements above detection limit, but it appears that net isoprene production rates decreased gradually during days 1–3, with higher afternoon production on days 3 and 5.
Net biogenic production rates for seven target VOCs varied widely across time and space in the North Atlantic Ocean, but also exhibited patterns that reveal the ecological interplay between phytoplankton emission and bacterioplankton consumption processes. Net production rates for the seven VOCs were sometimes negative, sometimes positive, and sometimes balanced, such that they were very close to zero. Thus, the plankton community in the surface ocean can act as both a net source and net sink of VOCs to/from the atmosphere, which is consistent with previous production measurements on a subset of the VOCs we measured: acetaldehyde, acetone, DMS, and methanol (Supplementary Table S6 and references therein). The net biogenic production rates we report here span ranges that are 1–2 orders of magnitude larger than previous measurements. The most likely explanations for these higher values are our measurement approach and the wide spatial and temporal variations encountered during the NAAMES campaigns (Behrenfeld et al., 2019). Our net biogenic production rates were calculated from measurements made in real-time over short, 1 h durations, compared to the more traditional 12–24 h incubation approaches that can inherently dampen peaks in VOC production caused by diel metabolic process (Figure 5) or other ecosystem interactions that have not yet been described. Nevertheless, the VOC concentrations used to calculate the net biogenic production rates are in the range of VOC concentrations reported previously in seawater (methanol > acetone, DMS > acetaldehyde, acetonitrile, isoprene, methanethiol, Supplementary Table S7).
Significant seasonal variations in net production rates were observed for all targeted VOCs (Figure 3). Net production rates were consistently positive and usually highest in May during the peak phytoplankton bloom transition, particularly toward the northernmost stations. In contrast, the lowest (and sometimes negative) net production rates were typically observed during November and March, during deep seasonal mixing, when the days were shortest, PAR levels were low, and NPP and bacterial abundances were low. Our results are consistent with expectations based on the body of available literature, most of which provides evidence for increased biogenic production during periods of high light and increased phytoplankton abundance/productivity (Broadgate et al., 1997; Sinha et al., 2007; Gantt et al., 2009; Iyadomi et al., 2016; Royer et al., 2016; Halsey et al., 2017). The May field campaign was characterized by the longest daylight hours, high chlorophyll-a concentrations, and high NPP and bacterial abundance (Supplementary Figure S5). For acetaldehyde, acetone, DMS, and isoprene, the trend of higher net production in the northern region during May was particularly pronounced, whereas their concentrations were often below detection limits in the south. These observations were likely driven by higher phytoplankton accumulation rates in the northern stations (Fox et al., 2020) and warmer surface seawater temperatures in the south that could increase bacterial VOC consumption rates and facilitate the diffusive loss of surface seawater VOCs to the atmosphere.
The drivers of spatial variability in VOC production are intertwined and reflect contributions from a variety of factors, such as temperature, light intensity, water mass circulation, and shifts in community composition, to name a few. The spatial gradients within each field campaign can also help reveal the relationship between VOC production and the seasonality of the massive phytoplankton bloom as we transited from north to south (or vice versa).
In this section, we review the biological context for the net production and/or consumption rates (i.e., biological cycling) of each targeted VOC and relate these activities to the temporal (seasonal/diel) and spatial gradients encountered during the NAAMES project.
Biogenic acetaldehyde production was initially inferred from observations above phytoplankton cultures (Collins and Bean, 1963; Collins and Kalnins, 1966) and field-based mesocosm experiments, where atmospheric concentrations of acetaldehyde were enhanced during periods of high light and increased phytoplankton abundance (Sinha et al., 2007). Net acetaldehyde production rates between 0 and 35 nmol L–1 d–1 have been reported previously in the Atlantic Ocean (Dixon et al., 2013). These rates were determined from changes in seawater concentrations of acetaldehyde attributable to both abiotic and biological processes over a 12-h light/12-h dark cycle. However, microbial oxidation of acetaldehyde was a dominant process, with rates as high as 65 nmol L–1 d–1, highlighting the role of microbial consumption in controlling VOC accumulation in surface seawater. Moreover, depth profiles of acetaldehyde concentrations in coastal shelf waters revealed a surface maximum that rapidly declined with depth, even within the mixed layer (Beale et al., 2015). The authors postulated that there is a biological source of surface acetaldehyde that is rapidly consumed within the water column before homogeneity is attained within the mixed layer (Beale et al., 2015). Thus, evidence points toward biological controls on both the production and consumption of acetaldehyde in marine surface waters. This idea was confirmed by the demonstration of an acetaldehyde cycle between a diatom and bacterium, whereby acetaldehyde was produced in a light-dependent manner by Thalassiosira pseudonana (Halsey et al., 2017) and then rapidly metabolized by an aldehyde dehydrogenase in the abundant heterotrophic bacterium, Pelagibacter ubique (Halsey et al., 2017; Moore et al., 2020).
Despite methodological differences, our finding that net microbial consumption of acetaldehyde often outcompetes its production is similar to previous observations (Dixon et al., 2013). During the NAAMES study, acetaldehyde production and consumption in the bloom-transition months (March and September) were more tightly coupled, yielding net rates that bracketed zero. The highest net acetaldehyde production rates were measured in May, coincident with the highest mean rates of net primary productivity (averaging 40.1 ± 18 mg C m–3 d–1), suggesting that periods of rapid phytoplankton growth cause acetaldehyde to be produced at rates that significantly outpace the capacity for its consumption. However, phytoplankton community growth rate alone is insufficient to explain the high net rates of acetaldehyde production in May, because phytoplankton growth rates were similar in September and May (Fox et al., 2020).
It is tempting to consider that specific members of the phytoplankton community may impact the balance of the acetaldehyde cycle. The relative abundances of pico- and nano-eukaryotic cells dominated during May, and the latter is significantly and positively correlated with net acetaldehyde production (Supplementary Figure S6). In contrast, the phytoplankton community was always dominated by Synechococcus cells in September, but phytoplankton abundance was not correlated with acetaldehyde production rates. Direct or indirect effects of seasonal and spatially variable abiotic factors, such as sea surface temperature, which correlated with net acetaldehyde production during both May and September (Supplementary Figure S6) are certain to influence acetaldehyde cycling. Conversely, net acetaldehyde consumption was common during November or concentrations of acetaldehyde were below our method’s detection limits. These observations were perhaps unsurprising, given that the winter months experienced the deepest mixing, shortest days, lowest daily maximum PAR, and the lowest rates of primary production (averaging 8.27 ± 4 mg C m–3 d–1 during November) (Supplementary Figure S5).
At the northernmost station during September, net acetaldehyde production rates peaked between dawn and midday, and returned to a more tightly coupled state with rates close to zero during the night, particularly during the latter half of our long-term occupation. Because biogenic acetaldehyde production increases with light intensity and photochemical processes (both abiotic and biological), net acetaldehyde production likely outpaces its consumption during the first half of the daylight hours (Figure 5) as acetaldehyde begins to accumulate before it can be consumed by bacterial activity or escape through the sea-air interface. We also noted that the morning production peak of acetaldehyde was clear during days 2–3 but had declined by day 5 toward a more tightly coupled state with net production rates nearer zero. These data indicate that the system experienced a disturbance event (be it physical mixing or shifts in community composition, for example), which allowed the afternoon net production peak to emerge early on in our station occupation. As the system re-stabilized, the diel production peak diminished until the acetaldehyde cycle achieved a coupled state. These data lend support to the idea that a finely tuned balance exists between the biogenic production and bacterial consumption of acetaldehyde in marine surface waters, whereby acetaldehyde can be transferred from phytoplankton to bacterioplankton, prior to entering downstream trophic cascades and/or being released to the atmosphere (Beale et al., 2015; Halsey et al., 2017).
Numerous studies provide evidence of biogenic marine acetone production, by both phytoplankton (direct, light-dependent production) (Sinha et al., 2007; Dixon et al., 2013; Halsey et al., 2017) and bacterioplankton (released during leucine degradation) (Nemecek-Marshall et al., 1995, 1999). Indirect (abiotic) production from the photodegradation of CDOM is also a contributor of acetone in the surface ocean (de Bruyn et al., 2011; Dixon et al., 2013). The existence of a planktonic acetone sink has been postulated to maintain acetone under-saturation in surface waters and explain observations of acetone deposition fluxes (Sinha et al., 2007; Beale et al., 2015). Surface seawater concentrations of acetone were also previously found to negatively correlate with bacterial leucine incorporation and the recent identification of a widely distributed bacterial monooxygenase capable of acetone oxidation (Moore et al., in review) suggests that acetone can be actively removed by bacteria (Beale et al., 2013) at rates ranging from 1.2 to 42 pM h–1 (Dixon et al., 2014).
The strong north-to-south gradient we observed in net acetone production rates during May can be used to develop hypotheses about the factors controlling acetone production in the North Atlantic. Rates of net acetone production were always positive in May, ranging from a mean of 3.2 nmol L–1 h–1 in the south (station 5) to 37.3 nmol L–1 h–1 in the northern latitudes (stations 0). Despite the higher production rates, seawater concentrations of acetone were, in fact, lower in the northern region (Supplementary Figure S7), likely drawn down by high rates of bacterial acetone metabolism and wind-driven sea-air flux. Thus, the magnitude of the biological acetone cycle in the sub-polar region of the North Atlantic Ocean may exert significant control on acetone sea-air flux.
The lower net acetone production rates observed in the southern stations during May are associated with lower chlorophyll-a concentrations and higher seawater acetone and DOC (including amino acid substrates) concentrations compared to the northern stations (Supplementary Figures S5, S8). Acetone is unlikely to be a primary growth substrate for bacteria under high DOC conditions and thus, acetone accumulated to higher concentrations in the southern region, compared to the north. These factors combine to move the acetone cycle toward the more strongly coupled state observed in September.
The role of acetonitrile in the surface ocean has been largely overlooked. However, atmospheric acetonitrile concentrations (whose sources are dominated by terrestrial biomass burning) have been shown to rapidly decline in the marine boundary layer, leading to suppositions of a biogenic oceanic sink for acetonitrile (de Gouw, 2003; Jost et al., 2003; Singh et al., 2003). In contrast, measurements of acetonitrile flux in the tropical Atlantic Ocean provide limited evidence that the ocean may act as a source of acetonitrile (∼1.6 μM m–2 d–1) (Williams et al., 2004). Acetonitrile has also been observed in a diatom culture, suggesting that some phytoplankton could serve as sources of this VOC (Moore et al., 2020). Our results provide the first direct evidence for both biogenic sources and sinks of acetonitrile in the surface ocean. Metabolic mechanisms acting upon acetonitrile are not known in the marine ecosystem. For example, can heterotrophic bacterial populations use acetonitrile as a carbon and/or nitrogen source? Also, could bacterial degradation of complex carbon and nitrogen-rich organic matter, such as proteins and amino acids, release acetonitrile for further consumption or recycling back into the atmosphere?
Net acetonitrile production rates exhibited statistically significant seasonal trends, whereby observations were highest and positive during May and November, and lowest and most often negative during the bloom transition months of March and September. We postulate that acetonitrile is produced through bacterial metabolism of DOC, including protein-rich substrates. Interestingly, and in keeping with this protein-degradation hypothesis, rates of net acetonitrile production were higher nearer the coast than in the open ocean during September. Additionally, net acetonitrile production was more positive toward the more nutrient rich northern regions during May and September (Table 2 and Supplementary Figure S4). The small negative production rates we observed in March and September could be associated with an as yet, unidentified, bacterial metabolism pathway. Heterotrophic bacteria are known to utilize an array of small carbon-based compounds to meet energy requirements and thus, they may use methyl transferase activity and methyl group oxidation to capture the energy available in acetonitrile (Sun et al., 2011; Halsey et al., 2012).
Dimethylsulfide is a well-known, climate-active gas implicated in the formation of cloud condensation nuclei. It is the most prevalent and well-studied marine-derived sulfur compound and the ocean represents a major source of DMS (biogenic sulfur) to the atmosphere. In marine ecosystems, the ubiquitous precursor, dimethylsulfoniopropionate (DMSP), is produced and/or released by phytoplankton and bacteria, for regulation of osmotic pressure and protection against multiple stressors (e.g., light, temperature, nitrogen limitation, viral lysis, and grazing by zooplankton) (Stefels, 2000; Yoch, 2002). DMSP is degraded via abiotic (photochemical oxidation) or biogenic (bacterial catabolism) pathways to produce DMS and methanethiol (discussed later) (Yoch, 2002; Sun et al., 2016). The primary removal pathway for DMS in surface waters is by microbial consumption for incorporation into biomass (e.g., to meet bacterial sulfur demands for growth) or transformation/oxidation to dimethylsulfoxide (DMSO) (Lidbury et al., 2016), sulfate, and carbon dioxide (Schäfer et al., 2010).
Our data shows that biogenic production of DMS dominates over microbial consumption, particularly during the peak phytoplankton bloom in May and in the northern regions (Figures 3, 4, and Supplementary Figure S4). As already stated, phytoplankton and bacterial abundance and production were high during May and are suggestive of actively growing microbial populations, through which DMS precursors are cycled, resulting in DMS production. Our long-term occupation of the northernmost station during September revealed morning peaks in DMS production. Sometimes, secondary peaks in DMS production were observed on or shortly following nightfall, which gradually declined to a more tightly coupled state by dawn. Previous work has also identified DMS maxima in the early evening that decreased throughout the night (Omori et al., 2017). We hypothesize that the onset of zooplankton diel vertical migration up to the surface waters in the early evening leads to grazing pressure and the subsequent stress-induced production of DMSP and DMS (Wolfe and Steinke, 1996; Yu et al., 2015).
Light-dependent biogenic production of isoprene has been previously observed in cultures of marine phytoplankton (Moore et al., 1994; Milne et al., 1995; Shaw et al., 2003; Colomb et al., 2008; Gantt et al., 2009; Halsey et al., 2017) and inferred from patterns of emission and air-sea fluxes correlating with light intensity and phytoplankton abundance in natural seawater (Sinha et al., 2007). During November, and to a lesser extent, March and September, isoprene concentrations were often below our detection limits and thus, net isoprene production rates were not calculated. Measurements of microbial isoprene oxidation rates are not available in the literature, but a recent report showed the unexpected capacity for isoprene uptake in the abundant heterotrophic bacterioplankton, Pelagibacter ubique (Moore et al., in review). Additionally, some bacteria isolated from coastal marine waters can use isoprene as a carbon source (Mcgenity et al., 2018) and a biogenic sink was previously proposed to account for losses of isoprene observed below the mixed layer (Moore and Wang, 2006). Thus, the numerous instances of isoprene concentrations below our limits of detection and near zero net isoprene production rates provide good support for the existence of a marine isoprene cycle. Nevertheless, isoprene’s high Henry’s constant and low water solubility (Supplementary Table S8) likely also facilitated its removal to the atmosphere, preventing its accumulation in surface waters.
We speculate that the colder waters and phytoplankton bloom conditions (e.g., high chlorophyll-a concentrations and actively growing biomass – see Supplementary Table S1) allowed isoprene to accumulate in the surface ocean during May to concentrations above our background levels (allowing us to calculate net isoprene production rates). Net isoprene production rates were highest during May and in the northern regions, which exhibited the longest daylight hours and greatest chlorophyll concentrations, which have previously been associated with enhanced isoprene production. We also found some evidence for afternoon diel peaks in isoprene production during our long-term stay at the northernmost station, which coincide with periods of the highest PAR and concurs with the light-dependent biogenic isoprene production observed previously. Thus, biogenic production of isoprene by phytoplankton exceeds microbial consumption.
It was recently revealed that the abundant marine bacterium, Pelagibacter, was capable of simultaneously producing DMS and methanethiol from the metabolism of DMSP (Sun et al., 2016). Furthermore, evidence suggests that a large proportion of the marine microbial community possesses the genetic capacity to degrade methanethiol (Eyice et al., 2017). Significantly less is known about methanethiol dynamics in the marine ecosystem and its role in global sulfur cycling than DMS, and we can find only one report detailing methanethiol concentrations in seawater (Eyice et al., 2017). However, recent measurements showed atmospheric methanethiol concentrations in the southwest Pacific Ocean were correlated with atmospheric DMS concentrations, particularly over a coccolithophore-dominated phytoplankton bloom, providing further evidence for the presence of a (likely biological) marine source of methanethiol (Lawson et al., 2020).
Our data provide direct evidence of biogenic methanethiol production by natural seawater populations, throughout all stages of the phytoplankton annual cycle. To the best of our knowledge, there is currently no evidence for direct methanethiol production by phytoplankton and we theorize that the net production we observe is most likely due to microbial degradation of DMSP. We observed higher net biogenic methanethiol production during November than in March and May. During March and September, we observed a longitudinal gradient whereby net biogenic methanethiol production increased away from the coast toward the open ocean. We also observed a latitudinal gradient during September, with higher net methanethiol production toward the north. Concentrations of DOC, of which DMSP is a large component (Yoch, 2002), were significantly higher in September (and in northern regions) than in other months (Supplementary Figure S5), and thus, it is plausible that bacterial degradation of DOC, further concentrated by the shallower mixed layer during September, increased methanethiol production (unfortunately, DOC concentrations were unavailable for our longitudinal cruise transects).
The foundations for biological methanol cycling have been well-documented in recent years. Modeling and field measurements provide indications of a large biogenic source of methanol (Millet et al., 2008; Dixon et al., 2011a, b; Beale et al., 2015; Mincer and Aicher, 2016) that is not thought to originate from abiotic photochemical degradation processes (Dixon et al., 2013), but rather is a byproduct of cell wall biosynthesis (Heikes et al., 2002; Hüve et al., 2007). In addition, the model green algae, Dunaliella tertiolecta, was shown to produce methanol in the light, providing evidence for green algae serving as a source of methanol (Halsey et al., 2017). Biogenic consumption of methanol has been reported, both in culture (Sun et al., 2011; Halsey et al., 2012) and in natural seawater communities (Dixon et al., 2011a, b, 2013; Beale et al., 2015; Sargeant et al., 2016), with the proportion of methanol carbon assimilated into biomass (versus dissimilated for energy production) dependent on the microbial community (Halsey et al., 2012; Sargeant et al., 2016).
The data we present here suggest that methanol production rates were dependent on phytoplankton production, with methanol consumption causing the system to become a methanol sink with negative production rates during November and March. Low phytoplankton abundance, growth rates, and productivity during November (Fox et al., 2020) were driven by low PAR and shorter days (Supplementary Figure S5) and likely underlie the low biological methanol production rates, with any accumulated methanol rapidly consumed by the bacterial community. In contrast, the positive net methanol production in the northern region during both May and September were associated with higher growth rates and biomass compared to stations in the south (Figure 3).
We present net biogenic production rates for seven VOCs in natural seawater communities during four field campaigns in the North Atlantic Ocean that targeted different stages of the annual phytoplankton biomass cycle. We observed seasonal and spatial trends related to bloom dynamics, particularly as we transitioned from north-to-south during May and September. These findings highlight the roles of plankton communities and interactions among phytoplankton and bacteria in determining VOC accumulation and production rates. We provide the first direct evidence for biogenic acetonitrile production and consumption, and postulate mechanisms that could explain acetonitrile as a product and substrate of carbon-cycling activity of bacterioplankton. Our data illuminate multi-domain interactions among marine phytoplankton and bacterioplankton that contribute to the cycling of VOCs in the surface ocean and indicate their potential to modulate VOC release to the atmosphere. Further work is warranted to gain a more complete picture of the mechanisms governing VOC cycling in marine surface waters, the nutrient regimes or conditions that determine which carbon sources are preferentially consumed, and the magnitude of the bulk VOC pool cycled among plankton and transferred across the sea-air interface.
The datasets presented in this study can be found in online repositories. Pre-processed PTR-ToF/MS and ancillary datasets from the four NAAMES campaigns are publicly available at: https://seabass.gsfc.nasa.gov/experiment/NAAMES [National Aeronautics and Space Administration (NASA) SeaWiFS Bio-optical Archive and Storage System (SeaBASS); Werdell and Bailey, 2002].
CD-M carried out on-board measurements and performed all data analysis and preparation of the first manuscript draft. WP and KH helped with on-board measurements. KH and SG conceived the original idea. MB lead the North Atlantic Aerosols and Marine Ecosystems Study (NAAMES) and was in charge of all field campaigns and project management. All the authors reviewed and contributed to the final version of the manuscript.
This publication was made possible by the North Atlantic Aerosols and Marine Ecosystems Study (NAAMES), award ID: NNX15AE70G, from the National Aeronautics and Space Administration (NASA). Its contents are solely the responsibility of the authors and do not necessarily represent the official view of NASA.
The authors declare that the research was conducted in the absence of any commercial or financial relationships that could be construed as a potential conflict of interest.
We would like to thank Armin Wisthaler, for his thoughtful comments on an earlier version of the manuscript, and the NAAMES science team and crew aboard the R/V Atlantis for their support and camaraderie.
The Supplementary Material for this article can be found online at: https://www.frontiersin.org/articles/10.3389/fmars.2020.611870/full#supplementary-material
Beale, R., Dixon, J. L., Arnold, S. R., Liss, P. S., and Nightingale, P. D. (2013). Methanol, acetaldehyde, and acetone in the surface waters of the Atlantic Ocean. J. Geophys. Res. Ocean 118, 5412–5425. doi: 10.1002/jgrc.20322
Beale, R., Dixon, J. L., Smyth, T. J., and Nightingale, P. D. (2015). Annual study of oxygenated volatile organic compounds in UK shelf waters. Mar. Chem. 171, 96–106. doi: 10.1016/j.marchem.2015.02.013
Behrenfeld, M. J., Moore, R., Hostetler, C. A., Graff, J., Gaube, P., Russell, L., et al. (2019). The North Atlantic Aerosol and Marine Ecosystem Study (NAAMES): science motive and mission overview. Front. Microbiol. 6:122. doi: 10.3389/fmars.2019.00122
Broadgate, W. J., Liss, P. S., and Penkett, S. A. (1997). Seasonal emissions of isoprene and other reactive hydrocarbon gases from the ocean. Geophys. Res. Lett. 24, 2675–2678. doi: 10.1029/97GL02736
Collins, R. P., and Bean, G. H. (1963). Volatile constituents obtained from Chlamydomonas globosa I. Carbonyl Fract. 3, 55–59. doi: 10.2216/i0031-8884-3-2-55.1
Collins, R. P., and Kalnins, K. (1966). Carbonyl compounds produced by Cryptomonas ovata var. palustris. J. Protozool. 13, 435–437. doi: 10.1111/j.1550-7408.1966.tb01935.x
Colomb, A., Yassaa, N., Williams, J., Peeken, I., and Lochte, K. (2008). Screening volatile organic compounds (VOCs) emissions from five marine phytoplankton species by head space gas chromatography/mass spectrometry (HS-GC/MS). J. Environ. Monit. 10:325. doi: 10.1039/b715312k
de Bruyn, W. J., Clark, C. D., Pagel, L., and Takehara, C. (2011). Photochemical production of formaldehyde, acetaldehyde and acetone from chromophoric dissolved organic matter in coastal waters. J. Photochem. Photobiol. A Chem. 226, 16–22. doi: 10.1016/J.JPHOTOCHEM.2011.10.002
de Gouw, J. (2003). Emission sources and ocean uptake of acetonitrile (CH 3 CN) in the atmosphere. J. Geophys. Res. 108:4329. doi: 10.1029/2002JD002897
de Gouw, J., and Warneke, C. (2007). Measurements of volatile organic compounds in the earth’s atmosphere using proton-transfer-reaction mass spectrometry. Mass Spectrom. Rev. 26, 223–257. doi: 10.1002/mas.20119
de Gouw, J., Warneke, C., Karl, T., Eerdekens, G., van der Veen, C., and Fall, R. (2003). Sensitivity and specificity of atmospheric trace gas detection by proton-transfer-reaction mass spectrometry. Int. J. Mass Spectrom. 223–224, 365–382. doi: 10.1016/S1387-3806(02)00926-920
Dixon, J. L., Beale, R., and Nightingale, P. D. (2011a). Microbial methanol uptake in northeast Atlantic waters. ISME J. 5, 704–716. doi: 10.1038/ismej.2010.169
Dixon, J. L., Beale, R., and Nightingale, P. D. (2011b). Rapid biological oxidation of methanol in the tropical Atlantic: significance as a microbial carbon source. Biogeosciences 8, 2707–2716. doi: 10.5194/bg-8-2707-2011
Dixon, J. L., Beale, R., and Nightingale, P. D. (2013). Production of methanol, acetaldehyde, and acetone in the Atlantic Ocean. Geophys. Res. Lett. 40, 4700–4705. doi: 10.1002/grl.50922
Dixon, J. L., Beale, R., Sargeant, S. L., Tarran, G. A., and Nightingale, P. D. (2014). Microbial acetone oxidation in coastal seawater. Front. Microbiol. 5:243. doi: 10.3389/fmicb.2014.00243
Eyice, Ö, Myronova, N., Pol, A., Carrión, O., Todd, J. D., Smith, T. J., et al. (2017). Bacterial SBP56 identified as a Cu-dependent methanethiol oxidase widely distributed in the biosphere. ISME J. 12, 145–160. doi: 10.1038/ismej.2017.148
Fox, J., Behrenfeld, M. J., Haëntjens, N., Chase, A., Kramer, S. J., Boss, E., et al. (2020). Phytoplankton growth and productivity in the Western North Atlantic: observations of regional variability from the NAAMES field campaigns. Front. Mar. Sci. 7:24. doi: 10.3389/fmars.2020.00024
Gantt, B., Meskhidze, N., and Kamykowski, D. (2009). A new physically-based quantification of marine isoprene and primary organic aerosol emissions. Atmos. Chem. Phys. 9, 4915–4927. doi: 10.5194/acp-9-4915-2009
Halsey, K. H., Carter, A. E., and Giovannoni, S. J. (2012). Synergistic metabolism of a broad range of C1 compounds in the marine methylotrophic bacterium HTCC2181. Environ. Microbiol. 14, 630–640. doi: 10.1111/j.1462-2920.2011.02605.x
Halsey, K. H., Giovannoni, S. J., Graus, M., Zhao, Y., Landry, Z., Thrash, J. C., et al. (2017). Biological cycling of volatile organic carbon by phytoplankton and bacterioplankton. Limnol. Oceanogr. 62, 2650–2661. doi: 10.1002/lno.10596
Heikes, B. G., Chang, W., Pilson, M. E. Q., Swift, E., Singh, H. B., Guenther, A., et al. (2002). Atmospheric methanol budget and ocean implication. Glob. Biogeochem. Cycles 16, 80–81. doi: 10.1029/2002GB001895
Hüve, K., Christ, M. M., Kleist, E., Uerlings, R., Niinemets, Ü, Walter, A., et al. (2007). Simultaneous growth and emission measurements demonstrate an interactive control of methanol release by leaf expansion and stomata. J. Exp. Bot. 58, 1783–1793. doi: 10.1093/jxb/erm038
Ionicon Analytik GmbH (2016). Hands-on PTR-MS 2016, WS 6: Advanced Calibration. Innsbruck: Ionicon Analytik GmbH.
Iyadomi, S., Ezoe, K., Ohira, S.-I., and Toda, K. (2016). Monitoring variations of dimethyl sulfide and dimethylsulfoniopropionate in seawater and the atmosphere based on sequential vapor generation and ion molecule reaction mass spectrometry. Process. Impacts 18, 464–472. doi: 10.1039/c6em00065g
Jost, C., Trentmann, J., Sprung, D., Andreae, M. O., and Dewey, K. (2003). Deposition of acetonitrile to the Atlantic Ocean off Namibia and Angola and its implications for the atmospheric budget of acetonitrile. Geophys. Res. Lett. 30, ACH 2 -1–ACH 2 - 8. doi: 10.1029/2003GL017347
Kieber, R. J., Zhou, X., and Mopper, K. (1990). Formation of carbonyl compounds from UV-induced photodegradation of humic substances in natural waters: fate of riverine carbon in the sea. Limnol. Oceanogr. 35, 1503–1515. doi: 10.4319/lo.1990.35.7.1503
Lawson, C. A., Possell, M., Seymour, J. R., Raina, J.-B., and Suggett, D. J. (2019). Coral endosymbionts (Symbiodiniaceae) emit species-specific volatilomes that shift when exposed to thermal stress. Sci. Rep. 9:17395. doi: 10.1038/s41598-019-53552-53550
Lawson, S. J., Law, C. S., Harvey, M. J., Bell, T. G., Walker, C. F., de Bruyn, W. J., et al. (2020). Methanethiol, dimethyl sulfide and acetone over biologically productive waters in the southwest Pacific Ocean. Atmos. Chem. Phys. 20, 3061–3078. doi: 10.5194/acp-20-3061-2020
Lidbury, I., Kröber, E., Zhang, Z., Zhu, Y., Murrell, J. C., Chen, Y., et al. (2016). A mechanism for bacterial transformation of dimethylsulfide to dimethylsulfoxide: a missing link in the marine organic sulfur cycle. Environ. Microbiol. 18, 2754–2766. doi: 10.1111/1462-2920.13354
Lindinger, W., and Jordan, A. (1998). Proton-transfer-reaction mass spectrometry (PTR-MS): on-line monitoring of volatile organic compounds at pptv levels. Chem. Soc. Rev. 27:347. doi: 10.1039/a827347z
Mcgenity, T. J., Crombie, A. T., and Murrell, J. C. (2018). Microbial cycling of isoprene, the most abundantly produced biological volatile organic compound on Earth background and isoprene production. ISME J. 12, 931–941. doi: 10.1038/s41396-018-0072-76
Millet, D. B., Jacob, D. J., Custer, T. G., de Gouw, J. A., Goldstein, A. H., Karl, T., et al. (2008). New constraints on terrestrial and oceanic sources of atmospheric methanol. Atmos. Chem. Phys. 8, 6887–6905. doi: 10.5194/acp-8-6887-2008
Milne, P. J., Riemer, D. D., Zika, R. G., and Brand, L. E. (1995). Measurement of vertical distribution of isoprene in surface seawater, its chemical fate, and its emission from several phytoplankton monocultures. Mar. Chem. 48, 237–244. doi: 10.1016/0304-4203(94)00059-m
Mincer, T. J., and Aicher, A. C. (2016). Methanol production by a broad phylogenetic array of marine phytoplankton. PLoS One 11:e0150820. doi: 10.1371/journal.pone.0150820
Moore, E. R., Davie-Martin, C. L., Giovannoni, S. J., and Halsey, K. H. (2020). Pelagibacter metabolism of diatom-derived volatile organic compounds imposes an energetic tax on photosynthetic carbon fixation. Environ. Microbiol. 22, 1720–1733. doi: 10.1111/1462-2920.14861
Moore, R. M., Oram, D. E., and Penkett, S. A. (1994). Production of isoprene by marine phytoplankton cultures. Geophys. Res. Lett. 21, 2507–2510. doi: 10.1029/94GL02363
Moore, R. M., and Wang, L. (2006). The influence of iron fertilization on the fluxes of methyl halides and isoprene from ocean to atmosphere in the SERIES experiment. Deep Sea Res. Part II Top. Stud. Oceanogr. 53, 2398–2409. doi: 10.1016/J.DSR2.2006.05.025
Mopper, K., Zhou, X., Kieber, R. J., Kieber, D. J., Sikorski, R. J., and Jones, R. D. (1991). Photochemical degradation of dissolved organic carbon and its impact on the oceanic carbon cycle. Nature 353, 60–62. doi: 10.1038/353060a0
National Aeronautics, and Space Administration [NASA] (2020). SeaWiFS Bio-Optical Archive and Storage System (SeaBASS). Available online at: https://seabass.gsfc.nasa.gov/experiment/NAAMES (accessed July 9, 2020).
Nemecek-Marshall, M., Wojciechowski, C., Kuzma, J., Silver, G. M., and Fall, R. (1995). Marine Vibrio species produce the volatile organic compound acetone. Appl. Environ. Microbiol. 61, 44–47. doi: 10.1128/aem.61.1.44-47.1995
Nemecek-Marshall, M., Wojciechowski, C., Wagner, W. P., and Fall, R. (1999). Acetone formation in the vibrio family: a new pathway for bacterial leucine catabolism. J. Bacteriol. 181, 7493–7499. doi: 10.1128/jb.181.24.7493-7499.1999
Omori, Y., Tanimoto, H., Inomata, S., Ikeda, K., Iwata, T., Kameyama, S., et al. (2017). Sea-to-air flux of dimethyl sulfide in the South and North Pacific Ocean as measured by proton transfer reaction-mass spectrometry coupled with the gradient flux technique. J. Geophys. Res. Atmos. 122, 7216–7231. doi: 10.1002/2017JD026527
Quinn, P. K., and Bates, T. S. (2011). The case against climate regulation via oceanic phytoplankton sulphur emissions. Nature 480, 51–56. doi: 10.1038/nature10580
Royer, S.-J., Galí, M., Mahajan, A. S., Ross, O. N., Pérez, G. L., Saltzman, E. S., et al. (2016). A high-resolution time-depth view of dimethylsulphide cycling in the surface sea OPEN. Nat. Publ. Gr. 6:32325. doi: 10.1038/srep32325
Sargeant, S., Murrell, J., Nightingale, P., and Dixon, J. (2016). Seasonal variability in microbial methanol utilisation in coastal waters of the western English channel. Mar. Ecol. Prog. Ser. 550, 53–64. doi: 10.3354/meps11705
Schäfer, H., Myronova, N., and Boden, R. (2010). Microbial degradation of dimethylsulphide and related C1-sulphur compounds: organisms and pathways controlling fluxes of sulphur in the biosphere. J. Exp. Bot. 61, 315–334. doi: 10.1093/jxb/erp355
Shaw, S. L., Chisholm, S. W., and Prinn, R. G. (2003). Isoprene production by Prochlorococcus, a marine Cyanobacterium, and other phytoplankton. Mar. Chem. 80, 227–245. doi: 10.1016/S0304-4203(02)00101-109
Singh, H. B., Salas, L., Herlth, D., Kolyer, R., Czech, E., Viezee, W., et al. (2003). In situ measurements of HCN and CH 3 CN over the Pacific ocean: sources, sinks, and budgets. J. Geophys. Res. 108:8795. doi: 10.1029/2002JD003006
Sinha, V., Williams, J., Meyerhöfer, M., Riebesell, U., Paulino, A. I., and Larsen, A. (2007). Air-sea fluxes of methanol, acetone, acetaldehyde, isoprene and DMS from a Norwegian fjord following a phytoplankton bloom in a mesocosm experiment. Atmos. Chem. Phys. 7, 739–755. doi: 10.5194/acp-7-739-2007
Stefels, J. (2000). Physiological aspects of the production and conversion of DMSP in marine algae and higher plants. J. Sea Res. 43, 183–197. doi: 10.1016/S1385-1101(00)00030-37
Sun, J., Steindler, L., Thrash, J. C., Halsey, K. H., Smith, D. P., Carter, A. E., et al. (2011). One carbon metabolism in SAR11 pelagic marine bacteria. PLoS One 6:e23973. doi: 10.1371/journal.pone.0023973
Sun, J., Todd, J. D., Thrash, J. C., Qian, Y., Qian, M. C., Temperton, B., et al. (2016). The abundant marine bacterium Pelagibacter simultaneously catabolizes dimethylsulfoniopropionate to the gases dimethyl sulfide and methanethiol. Nat. Microbiol. 1:16065. doi: 10.1038/nmicrobiol.2016.65
US EPA (2017). Estimation Programs Interface SuiteTM for Microsoft§Windows, v 4.11. Washington, DC: United States Environmental Protection Agency.
Werdell, P. J., and Bailey, S. W. (2002). “The SeaWiFS Bio-Optical Archive and Storage System (SeaBASS): Current Architecture and Implementation”, NASA Tech. Memo. eds G. S. Fargion and C. R. McClain (Greenbelt, MD: NASA Goddard Space Flight Center) 45.
Williams, J., Holzinger, R., Gros, V., Xu, X., Atlas, E., and Wallace, D. W. R. (2004). Measurements of organic species in air and seawater from the tropical Atlantic. Res. Lett. 31, 23–29. doi: 10.1029/2004GL020012
Wolfe, G. V., and Steinke, M. (1996). Grazing-activated production of dimethyl sulfide (DMS) by two clones of Emiliania huxleyi. Limnol. Oceanogr. 41, 1151–1160. doi: 10.4319/lo.1996.41.6.1151
Yoch, D. C. (2002). Dimethylsulfoniopropionate: its sources, role in the marine food web, and biological degradation to Dimethylsulfide. Appl. Environ. Microbiol. 68, 5804–5815. doi: 10.1128/AEM.68.12.5804-5815.2002
Keywords: volatile organic compounds, air/sea exchange, North Atlantic Ocean, phytoplankton bloom, acetonitrile, methanethiol, VOC cycling
Citation: Davie-Martin CL, Giovannoni SJ, Behrenfeld MJ, Penta WB and Halsey KH (2020) Seasonal and Spatial Variability in the Biogenic Production and Consumption of Volatile Organic Compounds (VOCs) by Marine Plankton in the North Atlantic Ocean. Front. Mar. Sci. 7:611870. doi: 10.3389/fmars.2020.611870
Received: 29 September 2020; Accepted: 02 December 2020;
Published: 21 December 2020.
Edited by:
Laura Anne Bristow, University of Southern Denmark, DenmarkReviewed by:
Frances Hopkins, Plymouth Marine Laboratory, United KingdomCopyright © 2020 Davie-Martin, Giovannoni, Behrenfeld, Penta and Halsey. This is an open-access article distributed under the terms of the Creative Commons Attribution License (CC BY). The use, distribution or reproduction in other forums is permitted, provided the original author(s) and the copyright owner(s) are credited and that the original publication in this journal is cited, in accordance with accepted academic practice. No use, distribution or reproduction is permitted which does not comply with these terms.
*Correspondence: Kimberly H. Halsey, aGFsc2V5a0BzY2llbmNlLm9yZWdvbnN0YXRlLmVkdQ==
†Present address: Cleo L. Davie-Martin, Terrestrial Ecology Section, Department of Biology, University of Copenhagen, Copenhagen, Denmark
Disclaimer: All claims expressed in this article are solely those of the authors and do not necessarily represent those of their affiliated organizations, or those of the publisher, the editors and the reviewers. Any product that may be evaluated in this article or claim that may be made by its manufacturer is not guaranteed or endorsed by the publisher.
Research integrity at Frontiers
Learn more about the work of our research integrity team to safeguard the quality of each article we publish.