 Kui Zhang
 Jun Zhang
 Dengfu Shi
 Zuozhi Chen
- 1South China Sea Fisheries Research Institute, Chinese Academy of Fishery Sciences, Guangzhou, China
- 2Key Laboratory of Open-Sea Fishery Development, Ministry of Agriculture and Rural Affairs, Guangzhou, China
- 3Southern Marine Science and Engineering Guangdong Laboratory, Guangzhou, China
- 4College of Marine Sciences, Shanghai Ocean University, Shanghai, China
The South China Sea (SCS) is one of the world’s main centers for coral reef diversity, with more than one-third of all reef fish species being found in this area. Some indications of overfishing have appeared in typical coral reefs of the SCS, as fish diversities have declined and the average body lengths of dominant fish species have decreased. However, only few assessments of coral reef fish stocks have been conducted, due to insufficient available data. In this study, we applied a newly developed length-based Bayesian biomass (LBB) estimation method to assess 10 dominant coral reef fish species from three main reefs (Yongshu Reef, Zhubi Reef, and Meiji Reef) of the Nansha Islands, SCS. Simulations indicated the estimated parameters were not sensitive to sample sizes (more than 100) using the LBB method. Our results showed that the relative biomass levels (B/BMSY) of Cephalopholis spiloparaea, Cephalopholis urodeta, Lutjanus gibbus, Gnathodentex aureolineatus, Pentapodus caninus, and Cheilinus fasciatus were between 0.16 and 0.45, suggesting an overfishing status; the relative biomass levels of Epinephelus merra, and Parupeneus crassilabris were 0.98 and 1.1, respectively, indicating that they were fully exploited; and the relative biomass levels of Lutjanus kasmira and Melichthys vidua were 1.3 and 2.5, respectively, indicating the populations were in good conditions. The estimates of Lc/Lc_opt were less than one for seven stocks, suggesting that the stocks were suffering from growth overfishing. Therefore, we emphasize the need to reduce fishing mortality and increase the mesh size of the coral reef fishery in the Nansha Islands, to achieve a sustainable yield and biomass.
Introduction
Coral reefs are distinguished by their tremendous diversity and the ecosystem services they provide to coastal tropical and subtropical nations (Hughes et al., 2003; Spalding and Brown, 2015). However, about 75% of reefs are threatened by human activities, with the consequence that these ecosystems are suffering serious degradation (Pandolfi et al., 2003; MacNeil et al., 2015; Spalding and Brown, 2015). Overfishing is one of the most pressing human activities on coral reefs, leading to differential declines in key ecosystem functions, and radical variations in coral reef dynamics (Dulvy et al., 2004; McClanahan et al., 2011; Bellwood et al., 2012). Coral reef fishes supply a major source of protein for about 85% of coastal inhabitants. However, more than 80% of the shallow reefs worldwide are severely exploited because of the increasing demand for quality protein (Manikandan et al., 2014).
The South China Sea (SCS) is located at the center of the Indo-West Pacific region, and is the third largest marginal sea in the world (Li et al., 2019). The marine biological diversity of the SCS is extremely rich, with more than 8,600 species of plants and animals (Ng and Tan, 2000). As one of the world’s main centers for coral reef diversity, there are at least 1,120 reef fish species found in the SCS, accounting for more than one-third of the total fish species (Randall and Lim, 2000; Arai, 2015; Zhang et al., 2016). Previous assessments showed that fishery resources in the northern continental shelf had been overfished (Zhang et al., 2017), although there was still potential for pelagic fishery resources in the deep SCS (Wang et al., 2016; Zhang et al., 2018). However, for the coral reef fishery, most studies have focused on biology and catchable body size (Li, 2010; Zhang J. et al., 2020), species composition and taxonomic diversity (Arai, 2015; Li et al., 2020), and risk assessment of contaminants in reef fishes (Pan et al., 2018; Nie et al., 2019). Because of insufficient data, only limited research has been undertaken assessing the stocks of coral reef fisheries in the SCS. Despite this lack of research, some indications of overfishing have appeared, such as declines in the fish diversity of typical reefs (Li et al., 2020), and decreases in the average body lengths of dominant fish species (Zhang J. et al., 2020). Up until the time of writing, fishing activities in the reefs have not been managed effectively, despite the fact that the sustainability of reef fishes is essential for the health of coral reef ecosystems. Therefore, it is necessary to carry out effective stock assessments and pay more attention to the sustainable use of coral reef fishes.
For data-poor fisheries, two types of methods are commonly applied for stock assessments (Liang et al., 2020): maximum sustainable yield (MSY) estimation approaches based on catch data (Froese et al., 2017), and fishery evaluation methods based on length-frequency (LF) data (Liang and Pauly, 2017; Froese et al., 2018). The catch-based methods cannot be used to assess coral reef fisheries in the SCS, because catch data are not available. In this study, we applied a newly developed length-based Bayesian biomass (LBB) estimation method to assess 10 dominant coral reef fish species from three main reefs (Yongshu Reef, Zhubi Reef, and Meiji Reef) of the Nansha Islands (Figure 1). The LBB method uses a Bayesian Monte Carlo Markov Chain (MCMC) method to estimate the current exploited biomass relative to the biomass producing the maximum sustainable yield (B/BMSY), and the current exploited biomass relative to the unexploited biomass (B/B0) (Froese et al., 2018; Froese et al., 2019a). The assessment results provide an overview of the current exploitation status of the coral reef fishery in the Nansha Islands, and the relative biomass levels of specific fish stocks.
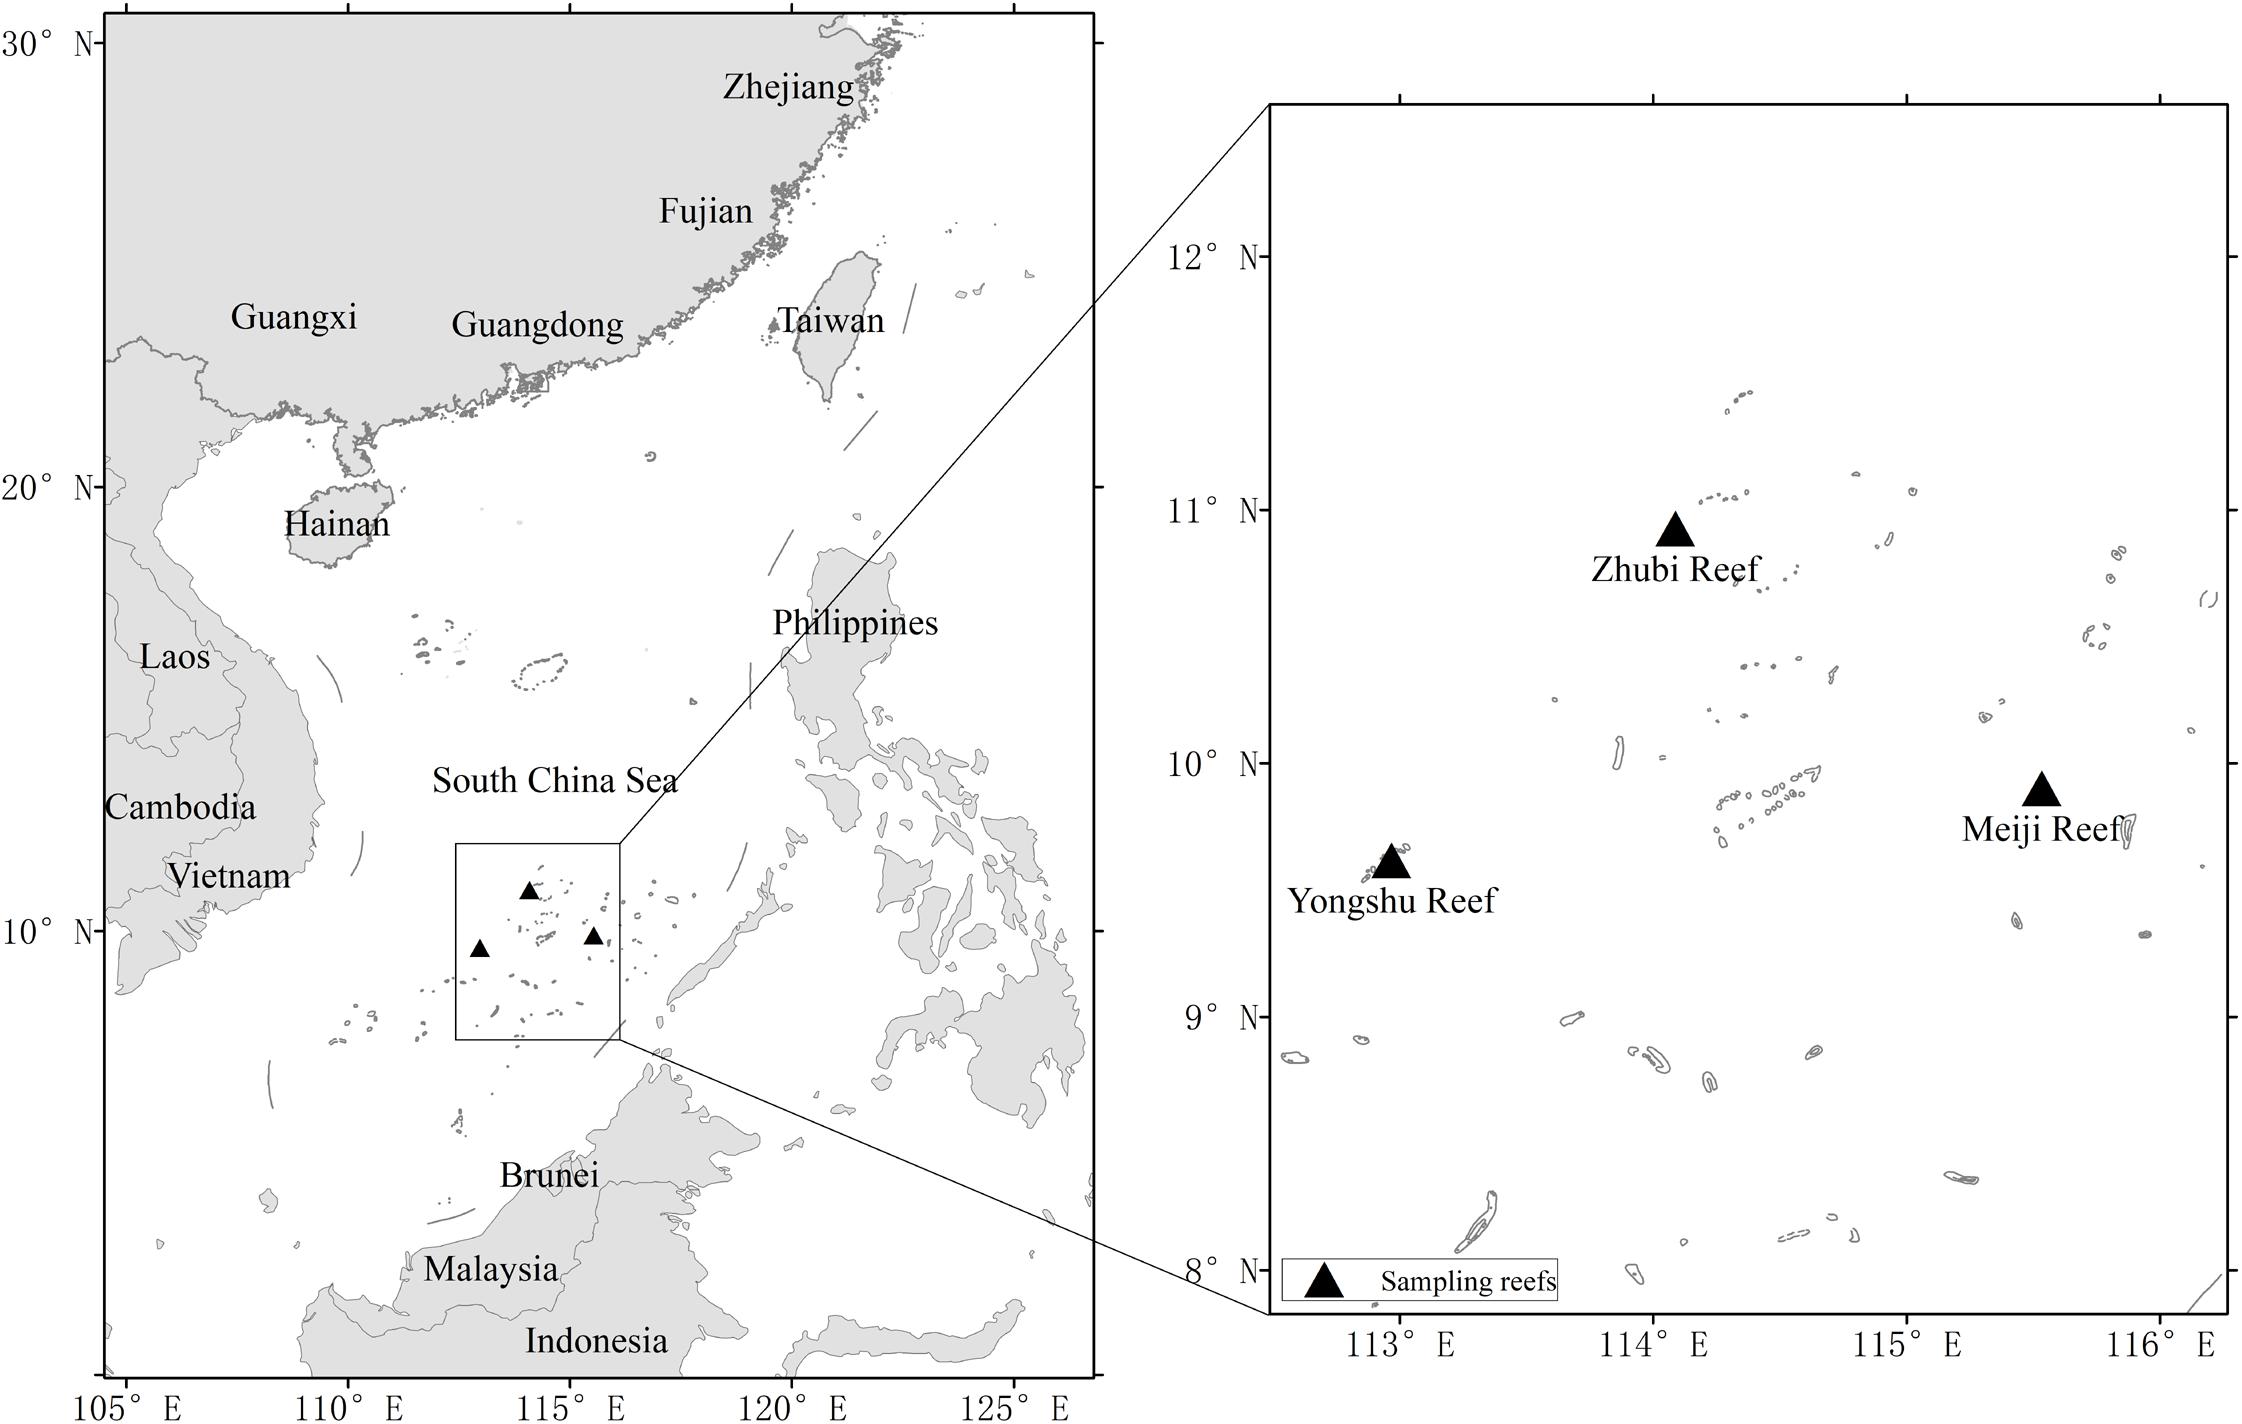
Figure 1. Sampling reefs in Nansha Islands, South China Sea.
Materials and Methods
Survey Sites
Yongshu Reef (9.52°–9.68°N, 112.88°–113.06°E; Figure 1) is an open spindle-shaped atoll with a length of about 25 km in the NEE–SWW direction and a width of 6 km in the NW–SE direction. It covers an area of 110 km2, with a water depth of 14.6–40 m. Its coral atolls are among the most widespread reefs in the Nansha Islands, and its lagoons make up 82% of the modern atoll systems in the broader Nansha area (Yan et al., 2011).
Zhubi Reef (10°54′ N, 114°03′ E) is located southwest of the Zhongye Islands in the Nansha Islands. This reef is a closed atoll, and is approximately pear-shaped with a long axis in the NE–SW direction. It is 5.75 km in length and 3.25 km in width, and covers an area of 16.1 km2. The middle lagoon is about 9.5 km2, and the majority of the area is ∼20 m deep with a maximum depth of 24 m (Zhang et al., 2016).
Meiji Reef (9°55′ N, 115°32′ E) is an oval-shaped reef located about 200 km east of Yongshu Reef. It is about 8.6 km × 6.5 km in size, and is characterized by a large lagoon with a maximum water depth of 30 m surrounded by a ring of reef flat (Yu et al., 2006).
Data Collection
Four surveys to evaluate the species composition and abundance of the coral reef fishery resources in the three main reefs (Yongshu Reef, Zhubi Reef, and Meiji Reef) of the Nansha Islands were undertaken on the R/V Nanfeng in December 2017, August and October 2018, and May 2019. Fish specimens were collected in the lagoons of the reefs by bottom gill net and hand-line, which were dispatched from motorboats with a compression-ignition internal combustion engine. The width and length of the boats were 1.50 and 7.85 m, respectively. The power and speed of the engines were 14.7 kW and 1,500 r/min, respectively. Four types of gill net and handline (Table 1) were used for the sampling, with the purpose of catching individual fish of different body sizes. Moreover, the water depths for the lagoons of the three reefs were about 10–25 m, and our handlines (with regulus lead fixing) and gill net could cover the different water layers.
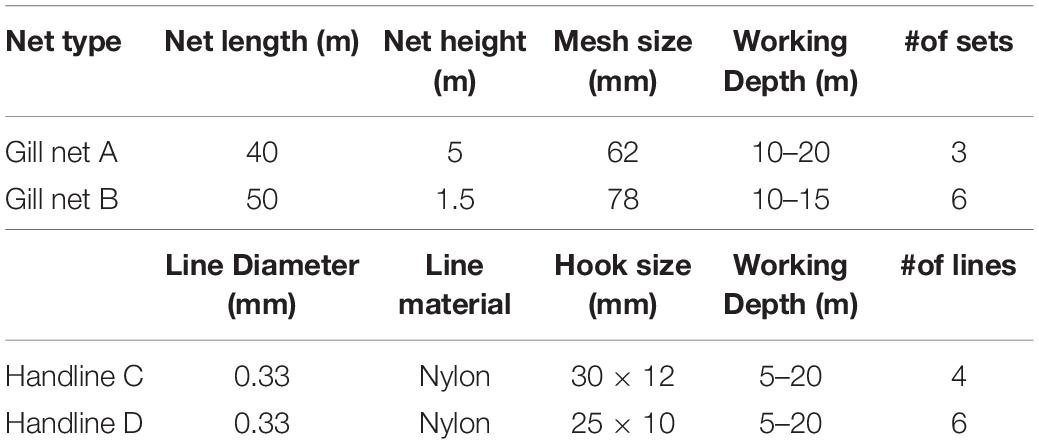
Table 1. Details of bottom gill net and hand-line used in fish collections.
The South China Sea Fisheries Research Institute conducted the surveys, and the sampling time, durations, researchers, and nets were consistent across all surveys. Eight stations were surveyed for each reef, and the surveys covered the area of respective lagoon, i.e., 10 km2 for Yongshu Reef, 9.5 km2 for Zhubi Reef, and 36 km2 for Meiji Reef. For each survey station, two types of gill nets (Table 1) were set one by one, and the soak times (the soak time is the total time the gillnet was in the water) were uniform at 1 h for all stations and reefs. Ten lines (one hook was fastened to each line) were used to sample synchronously in each station, and the fishing times were uniform at 3 h for all stations and reefs. There were total 6,335, 1,727, and 2,879 fish individuals caught in the lagoons of Yongshu Reef, Zhubi Reef, and Meiji Reef, respectively. There were no discards in the surveys, and all the fish individuals were measured in laboratory of survey vessel or cryopreserved for laboratory bioassays. Biological data of all fish species, including their length, weight, sexual maturity, and stomach fullness, were collected. For each individual fish, the standard length was measured to the nearest millimeter and the body weight to the nearest 0.1 g. In this study, we analyzed the LF data of the 10 most abundant fish species (from seven families; Table 2) in the Nansha Islands.
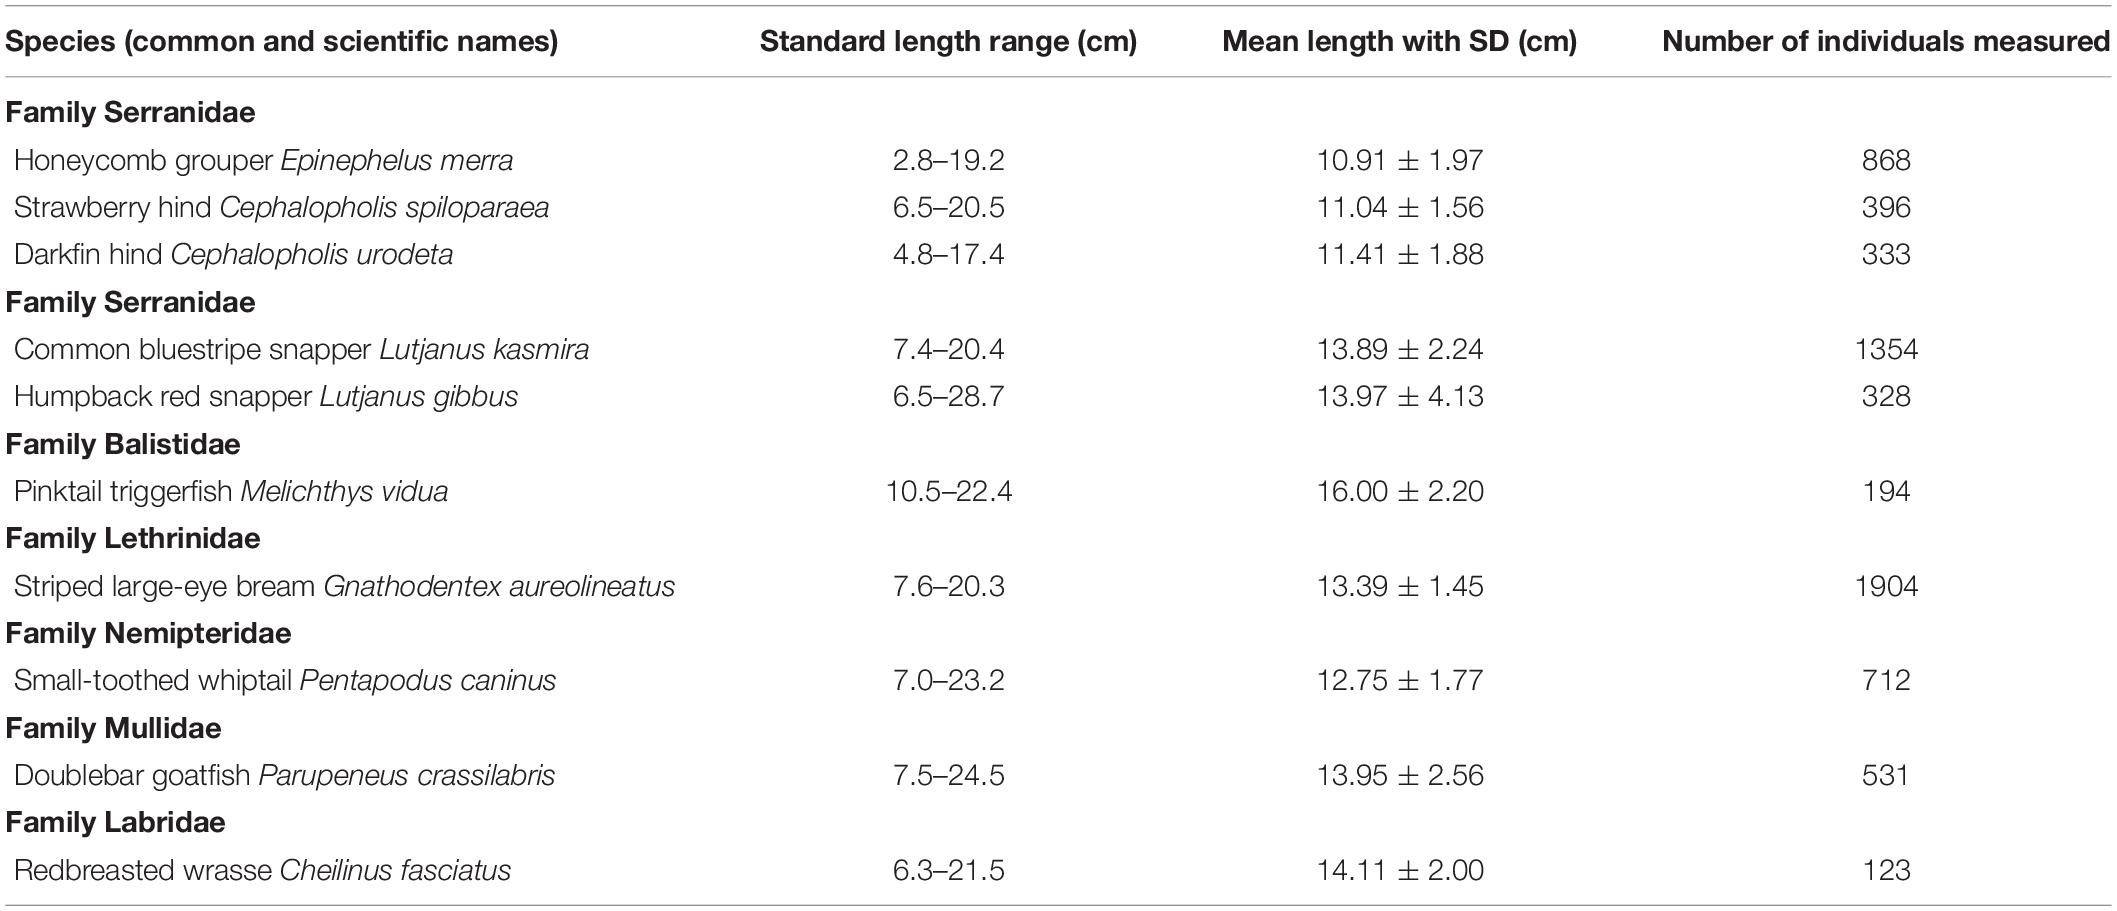
Table 2. Summary of the standard length range and the sampling number of individuals of the 10 coral reef fish species collected in 2017–2019 for stock assessment in Nansha Islands, South China Sea.
LBB Method
In the LBB method, growth in body length is assumed to follow the von Bertalanffy growth function (von Bertalanffy, 1938), which can be described as:
where Lt is the expected or mean length at age t, Linf is the asymptotic length, K is the growth coefficient, and t0 is the theoretical age at length zero.
In the case of full gear selection, the curvature of the catch in the numbers-at-length curve is the value of the total mortality Z relative to K (Z/K), and the curve is expressed by the equation (Quinn and Deriso, 1999):
where NL is the number of survivors to a specific length L, NLstart is the number at length Lstart, and Lstart is the minimum length with full gear selection (i.e., all individuals entering the gear are retained by the gear).
The selectivity of the fishing gear can be assumed as the function:
where SL is the fraction of individuals that are retained by the gear at length L, Lc is the length of 50% individuals captured by the gear, and α represents the steepness of the ogive (Quinn and Deriso, 1999).
The parameters Linf, Lc, α, M/K, and F/K, and the selection ogive, are estimated by fitting the following two equations (Froese et al., 2019a):
where NLi is the number of individuals in length class Li, the subindex i in Li represent the serial numbers of length classes, and NLi–1 is the number of individuals in the previous length class. CLi refers to the number of individuals vulnerable to the gear and proportionally represented in the catch for length class Li.
To minimize the required parameters, the LBB analysis is conducted based on the natural mortality rate (M) relative to the somatic growth rate (M/K), and the fishing mortality rate (F) relative to the somatic growth rate (F/K), instead of the absolute values, with the goal of estimating mean relative fishing mortality (F/M) and current biomass relative to unfished biomass (B/B0). In other words, the increase in length can be used as a proxy for elapsed time, and by using ratios instead of absolute values the units of time and biomass cancel out (Froese et al., 2018).
The LBB estimation was executed within the Bayesian Gibbs sampler software JAGS (Plummer, 2003). R statistical language (version 3.6.3) was used to fit the observed proportions at-length to their expected values:
where pLi is the observed proportions-at-length, is the expected values (mean values) for pLi, denotes a function of the estimable population dynamic parameters Linf, M/K, and F/K, and the selectivity parameters Lc and α.
The observed and predicted length distributions were then fitted by assuming Dirichlet-multinomial distribution (Thorson et al., 2017), which was proposed for fitting size and age composition in stock assessment models using a Bayesian framework. Proportions-at-length assume Dirichlet-multinomial distribution with an effective sample size of 1,000, which was chosen based on desirable performance across various simulation-testing trial scenarios (Froese et al., 2018). The observed length distributions π with a probability density function can be shown as:
where the marginal probability density function for data π is computed via integrating across the “unobservable” average proportion π∗ for that sample, Dirichlet(ω) is the probability density function for the Dirichlet distribution and ω is a vector of parameters that govern the mean and variance of this distribution. For each length composition sample, a random draw π∗∼Dirichlet(ω) were taken from a Dirichlet distribution, and then take a draw from a multinomial distribution π∼Multinomial (π∗, n) with mean proportion π∗ from the Dirichlet draw (Thorson et al., 2017).
To approximate the stock status from the estimated quantities Linf, Lc, M/K, and F/K, the following equations are used. First, the length Lopt representing the maximum biomass of the unexploited cohort is obtained from:
For a given fishing pressure (F/M), the length at first capture Lc_opt that maximizes the catch and biomass can be obtained from:
An index catch per unit of effort (CPUE′/R) is obtained by dividing the relative yield-per-recruit (Y′/R) by F/M, as presented by Froese et al. (2018):
The relative biomass in the exploited situation if no fishing occurs is given by:
where B0′ > Lc denotes the exploitable fraction (>Lc) of the unfished biomass (B0).
The ratio of fished to unfished biomass is described as
A proxy for the relative biomass that can produce Bmsy/B0 was obtained by re-running Eqs (10–13) with F/M = 1 and Lc = Lc_opt (Froese et al., 2018).
In this study, Linf priors were generated as the maximum length obtained from the present study if the maximum length is unknown or the recorded maximum length in Fishbase1 is smaller than that of the present study, and as the recorded maximum length in Fishbase for other situations (Liang et al., 2020). All the analysis was implemented using LBB_33a.R, an R-code algorithm presented by Froese et al. (2018). Stocks were classified to different exploitation statuses based on the values of B/BMSY; overexploited status was assigned where B/BMSY < 0.8, fully exploited status where 0.8 ≤ B/BMSY ≤ 1.2, and non-fully exploited status where B/BMSY > 1.2 (Amorim et al., 2019).
Simulation and Evaluation
A simulation was presented to understand if the estimations are sensitive to sample size using LBB method. The simulated length distribution was based on threadfin porgy Evynnis cardinalis in the Beibu Gulf, South China Sea (Zhang K. et al., 2020). We set seven groups with different sampling sizes (100, 300, 800, 1,500, 3,000, 5,000, and 10,000), and used Bootstrap (package “boot” in R) to simulate the length data.
Convergence diagnostic analysis is important for judging the reliability of model results (Gelman and Rubin, 1992). A scale reduction factor (SRF) SRF > 1.2 or SRF < 1.0 indicates that parameters may not have converged for that chain. The mean intra-chain (W) and inter-chain (B) variances, and the SRF were calculated as follows:
where J is the number of MCMC chains, j is the serial numbers of the chains, G is the length of a chain, g is the serial numbers of estimated values, θgj is the gth estimated value in the jth chain of parameter θ, is the mean value of θ in the entire j sequence.
Hordyk et al. (2019) mentioned that the LBB analysis did not correct for the pile-up effect, and may result in a negatively biased estimate of F, with increasing bias with decreasing M/K. Therefore, we applied other two modified LBB model (Froese et al., 2019b) on the length data of the 10 dominant coral reef fish species from Nansha Islands. The two models, LBB-1 (full correction for the pile-up effect), and LBB-2 (let the Bayesian model determine the degree of correction based on the best fit to the available data) were based on the original LBB equation, and corrected for the pile-up effect.
Results
Length data from 6,743 individual fish of the 10 dominant coral reef fish species from the Nansha Islands were analyzed. Most length-frequency distributions were unimodal (Figure 2). The mean body lengths of the species ranged from 10.91 to 16.00 cm. Pinktail triggerfish Melichthys vidua had the largest body size, whereas the honeycomb grouper Epinephelus merra was the smallest fish species sampled (Table 2).
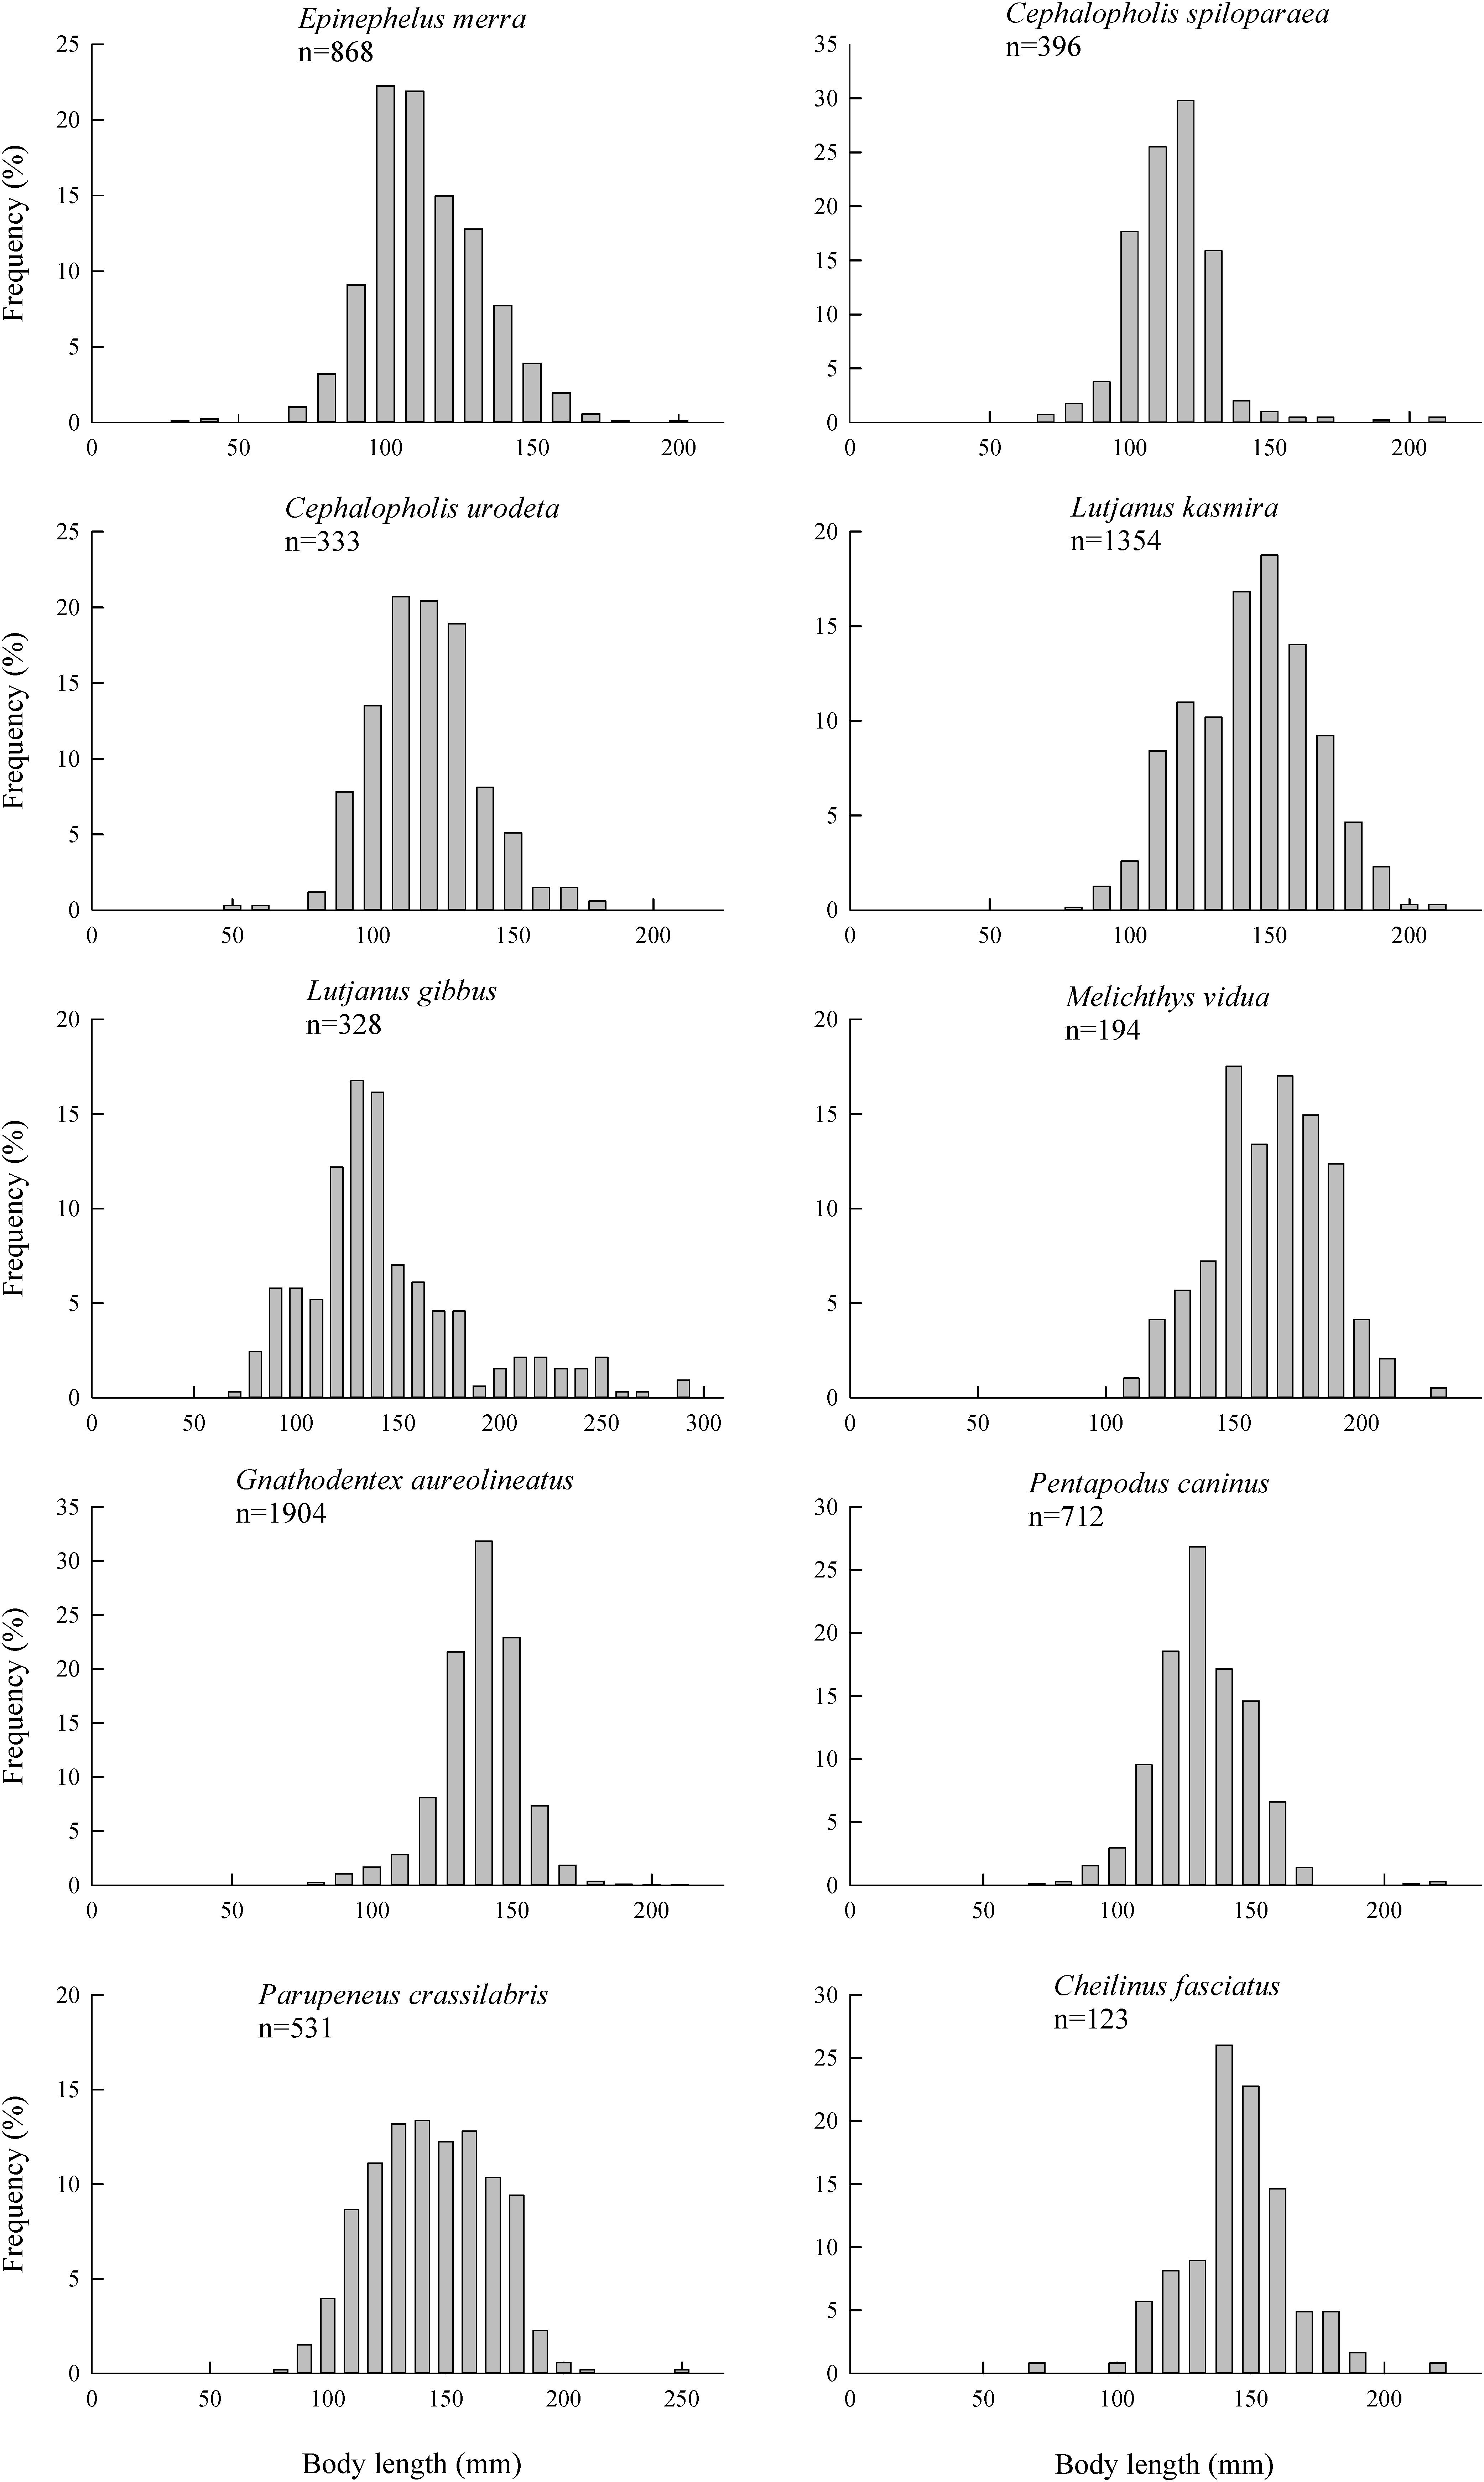
Figure 2. Length–frequency distributions for 10 coral reef fish species from Nansha Islands, South China Sea, 2017–2019.
For all species except the common bluestripe snapper Lutjanus kasmira and M. vidua, the dominant length groups were smaller than the length (Lopt) at which the maximum biomass of the unexploited stock would be obtained (Figure 3). For all species except the doublebar goatfish Parupeneus crassilabris, the estimated values of Linf were smaller than the maximum length (Lmax) in the fish sample. The estimates of Lc/Lc_opt ranged from 0.51 to 1.7, and the estimates of Z/K ranged from 2.2 to 12 (Table 3). The estimates of B/BMSY for the 10 coral reef fishes from the Nansha Islands were quite different, and ranged from 0.16 to 2.5 (Table 3). Six fish species including suffered from overfishing, the two species E. merra, and P. crassilabris were fully exploited, and the two species L. kasmira, and M. vidua were non-fully exploited.
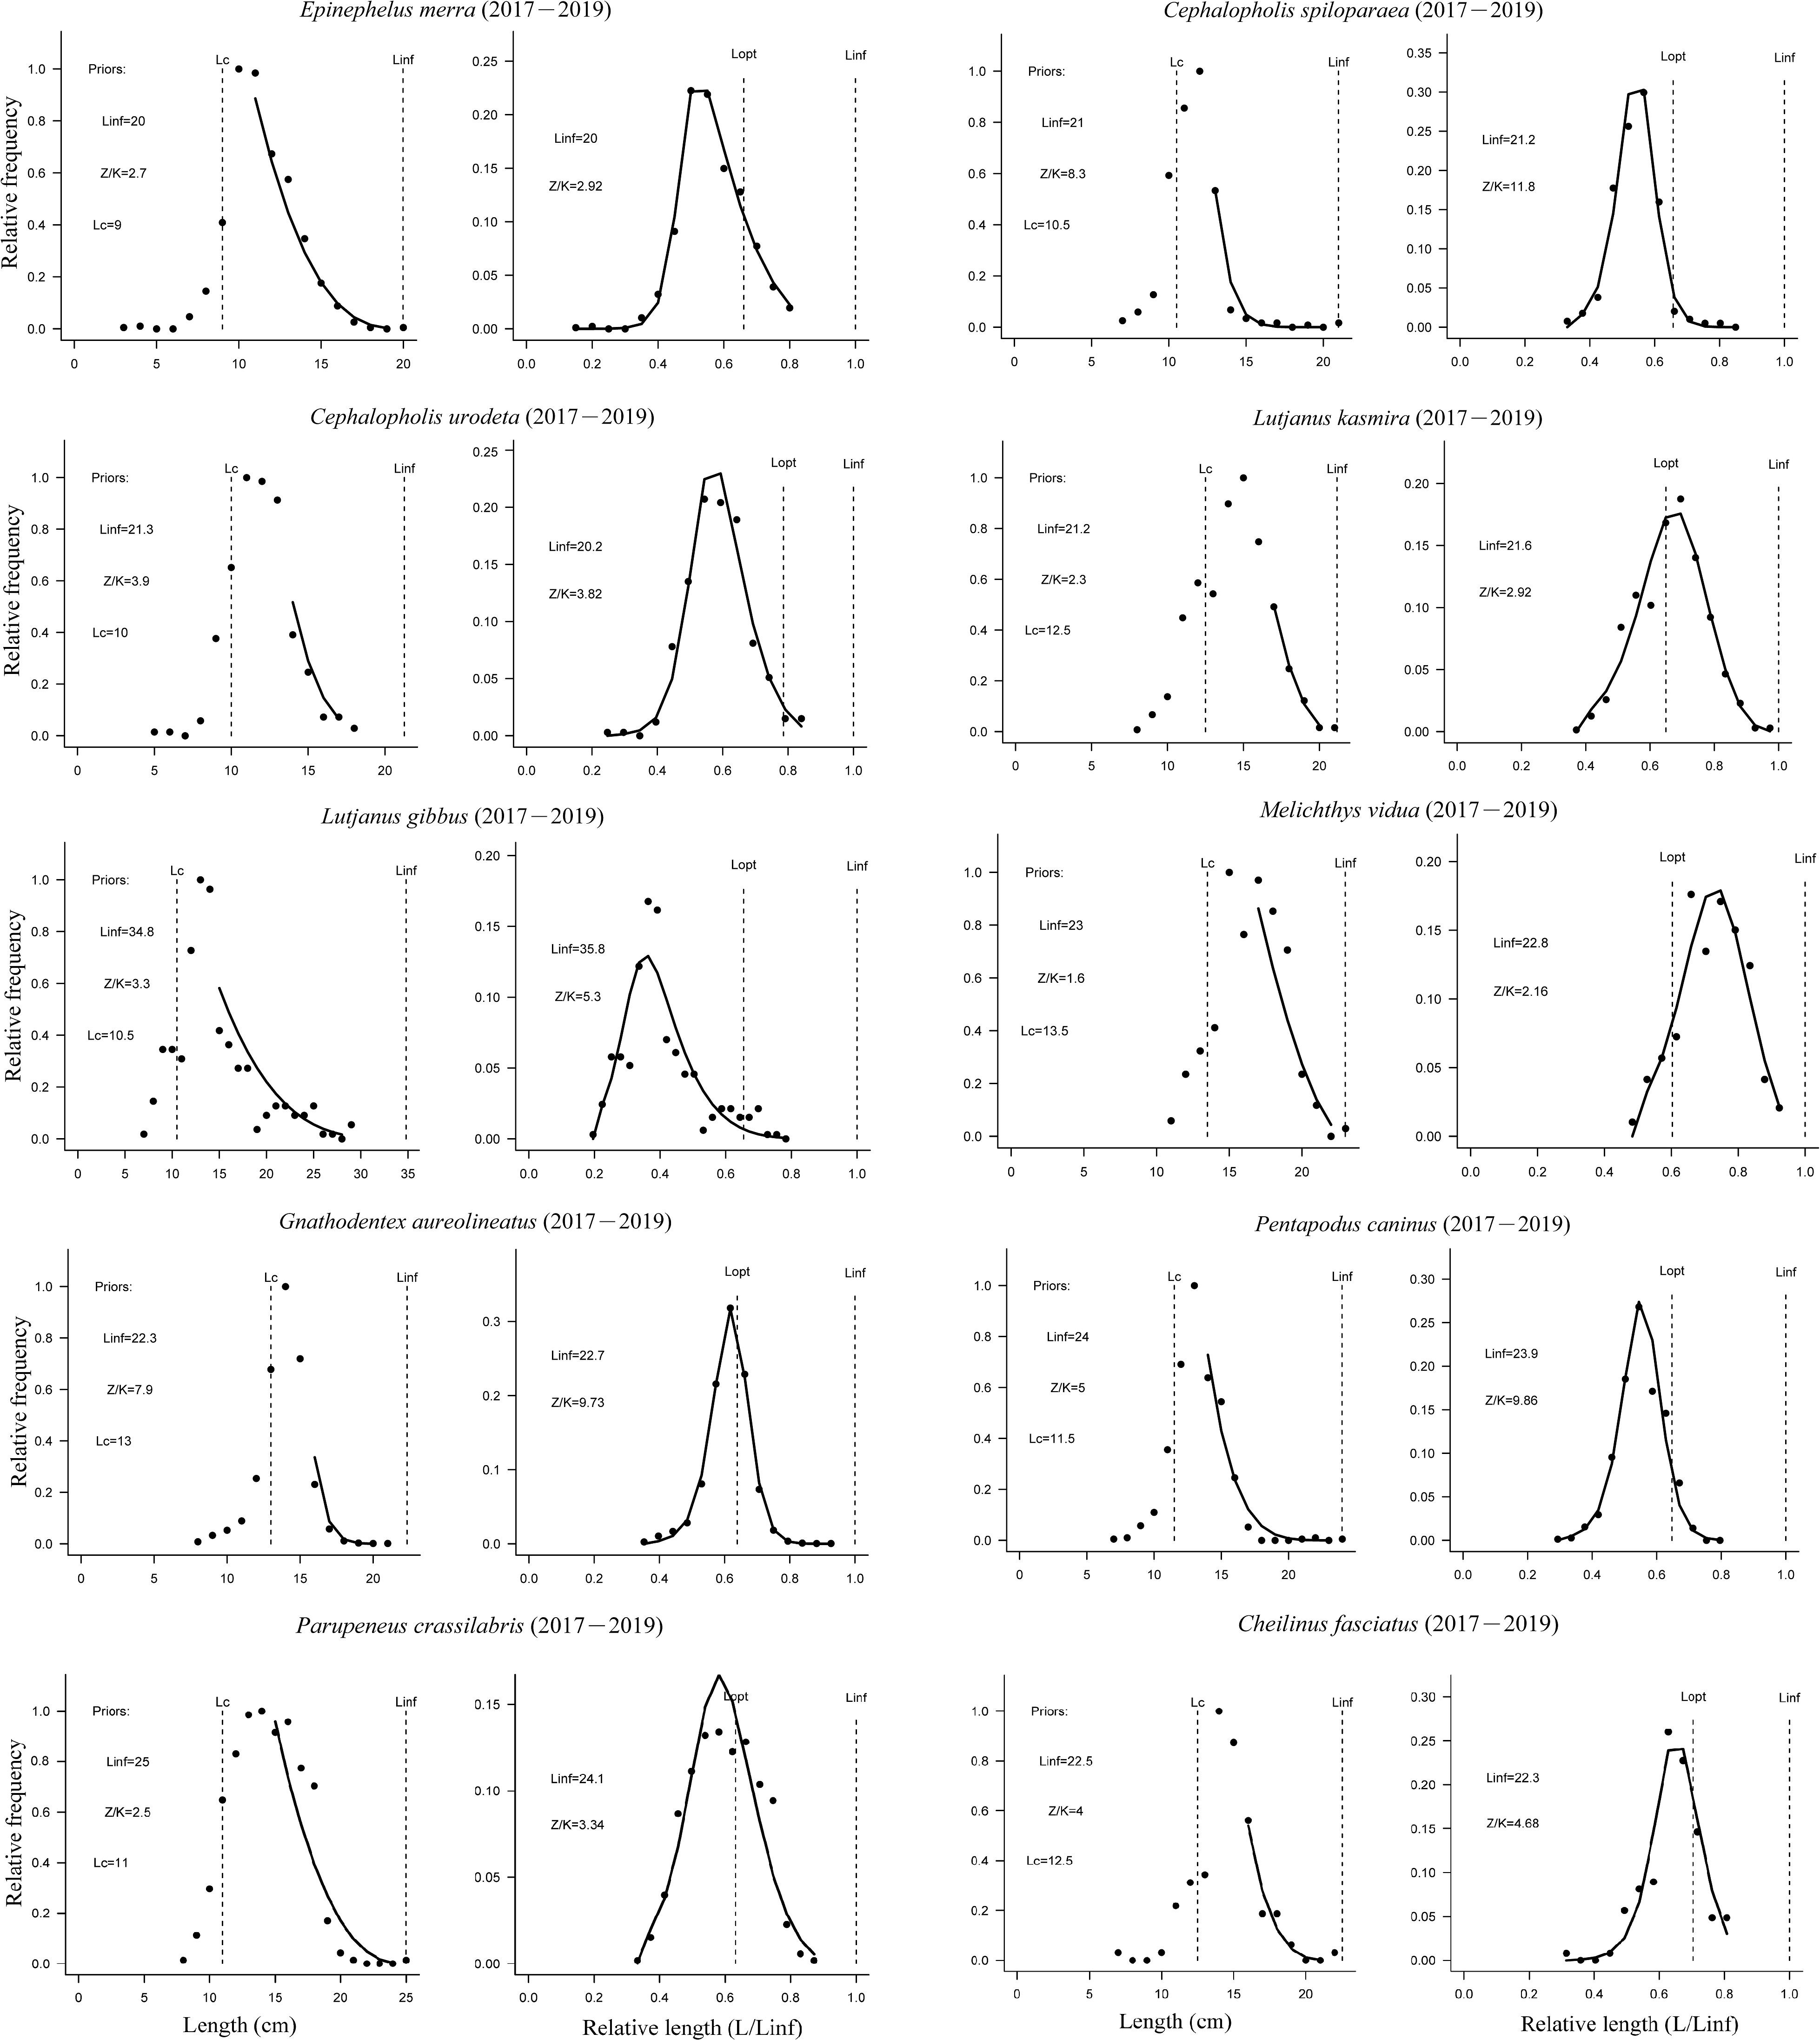
Figure 3. Length-based Bayesian biomass analyses of 10 coral reef fish species from Nansha Islands, South China Sea. The left curves show the fits of the model to the length data; the right curves are the predictions of the LBB analysis, Lc is the length of 50% individuals captured by the gear, Linf is the asymptotic length, and Lopt is the length where the maximum biomass of the unexploited stock is obtained.
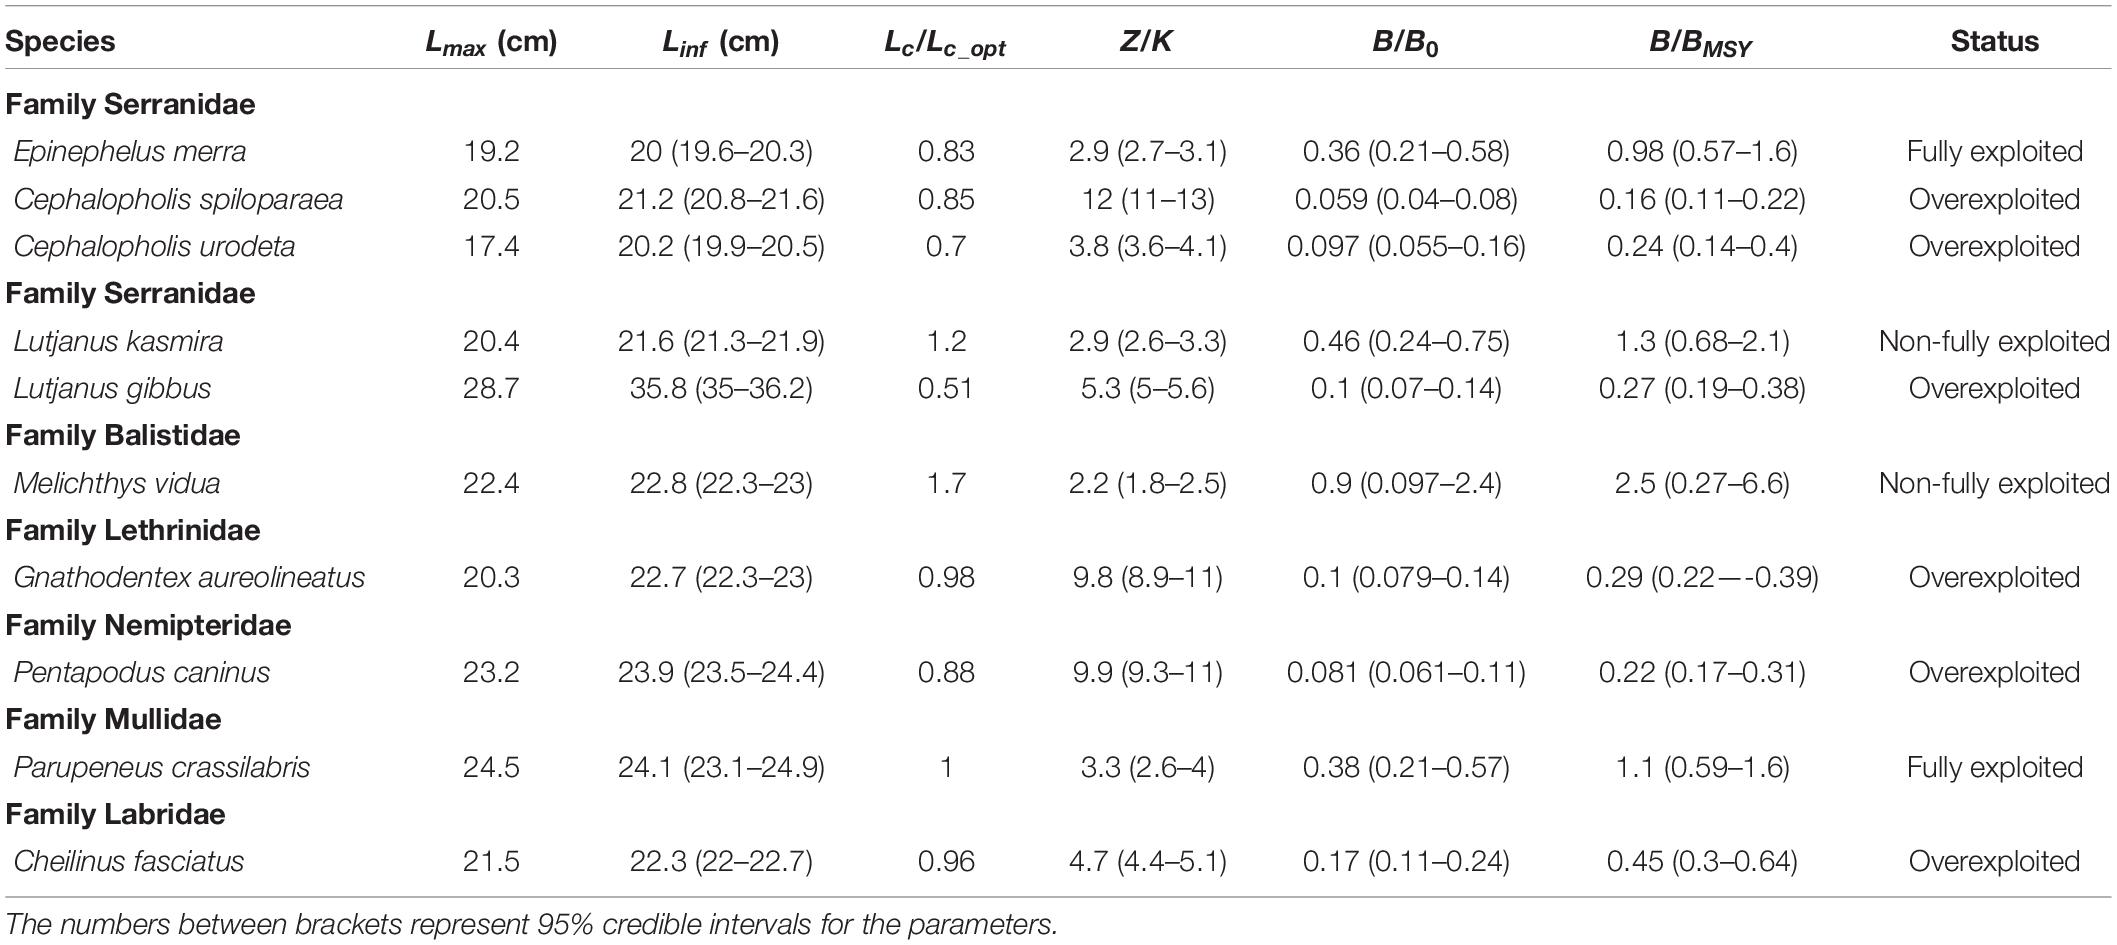
Table 3. Summary of LBB outputs and status for the 10 coral reef fish species in Nansha Islands, South China Sea.
Results of simulations showed the estimated parameters (Linf, Lc/Lc_opt, Z/K, B/B0, and B/BMSY) were not sensitive to sample sizes using LBB method (Table 4), except for the estimated Z/K (overestimating when sample size was low). The SRF values for convergence diagnostic analysis of the parameters in LBB model indicated convergence, ranging 1.05–1.09. The estimated Lc/Lc_opt, and B/BMSY by LBB-2 model were consistent with those by original LBB equation. The LBB-1 model produced similar results with other two models, except for the estimated B/BMSY for three species, E. merra, L. kasmira, and P. crassilabris. The underestimation of estimated B/BMSY for the three species made their exploitation status negatively (Table 5).
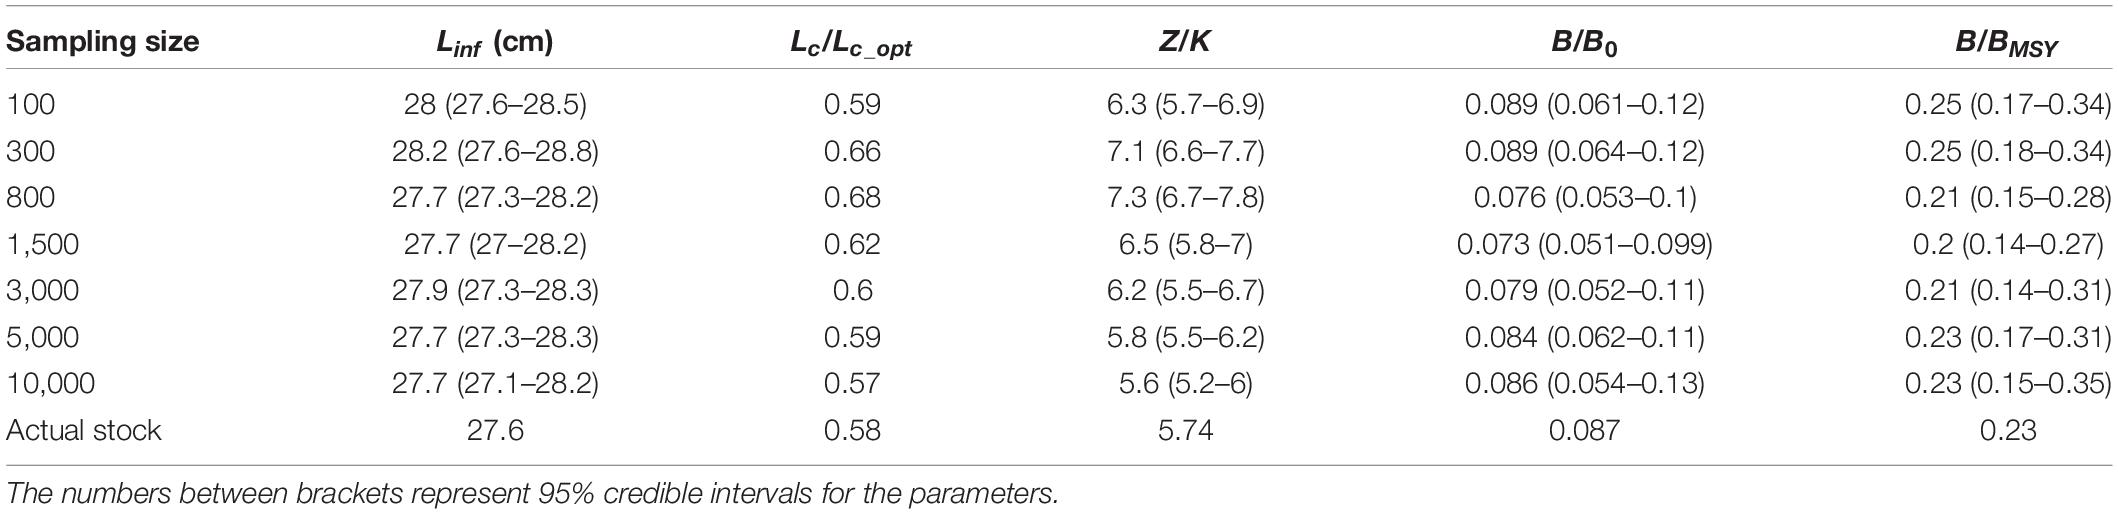
Table 4. Estimated parameters of the LBB for a range of sample sizes for a simulated data series from Zhang K. et al. (2020).
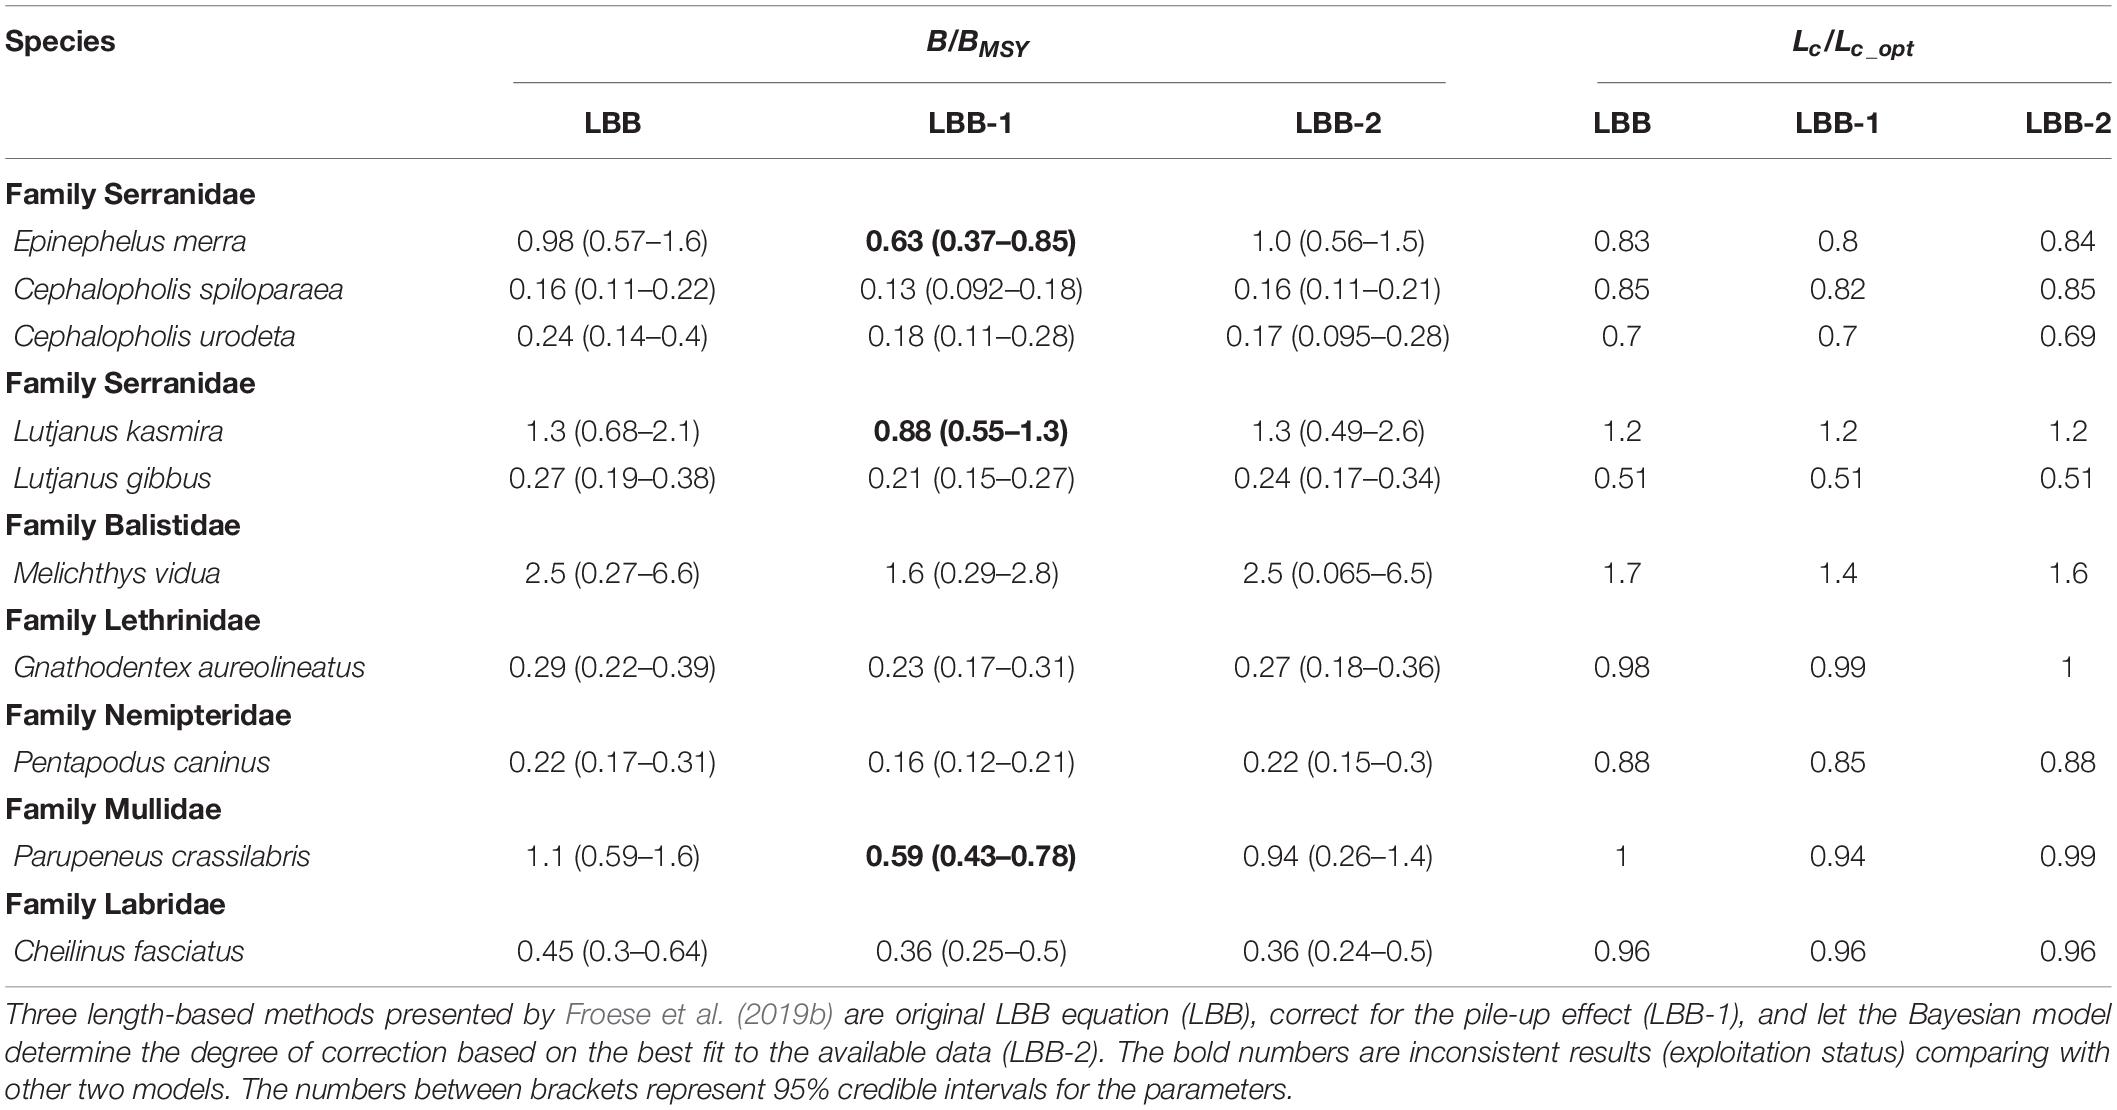
Table 5. Performance comparison of three length-based methods for the 10 coral reef fish species in Nansha Islands, South China Sea.
Discussion
This study is the first time that coral reef fish stocks from the Nansha Islands in the SCS have been assessed using the LBB method. The results suggest a pressing situation for the coral reef fishery, as 60% of the dominant fish species were overexploited and 20% were fully exploited. Growth overfishing occurs when fish are harvested before they reach their optimum size, thus reducing fishery yields (Nadon et al., 2015). The estimates of Lc/Lc_opt for seven stocks were less than one (Table 3), suggesting the stocks are suffering from growth overfishing (Liang et al., 2020). Therefore, the mesh size of gear used in the coral reef fishery should be increased. Froese et al. (2018) emphasized that the length-frequency data used in the LBB method should represent the composition of the target stock. In this study, the length-frequency data collections were covered four seasons. Moreover, both bottom gill nets and hand-lines (two sizes for each gear, Table 1) were used in the sampling, to insure fish species with different sizes and living in different water layers were sampled.
Overfishing has been recognized as a leading anthropogenic problem in marine ecosystems, and has reduced biodiversity and impaired ecosystem functions (Worm et al., 2009). The Food and Agricultural Organization of the United Nations (FAO) suggests that 31.4% of studied fish stocks worldwide are overexploited, and 58.1% are fully exploited (FAO, 2016). However, these statistics are based on assessments of a small fraction of the world’s fish stocks. Only 20% of the global catch comes from assessed species, and less than 1% of species have been subject to stock assessments (Costello et al., 2012; Ricard et al., 2012). Most of the world’s fish stocks, especially the species living in particular habitats such as sharks (Ju et al., 2020) and coral reef fishes (Nadon et al., 2015), lack sufficient statistical and survey data to assess their abundance and current exploitation status using traditional stock assessment methods.
length-based Bayesian biomass is a new assessment method for data-poor stock lacking statistical catch data. All parameters in the LBB are estimated with a Bayesian Monte Carlo Markov Chain (MCMC) approach (Froese et al., 2018). Bayesian statistics have advanced fisheries analysis considerably. A main advantage is that the posterior inference is quite straightforward using MCMC outputs, which can provide direct samples of parameters of interest (Cowles and Carlin, 1996; O’Hara and Sillanpää, 2009). With the Bayesian framework, it is more straightforward to calculate simultaneous credible intervals for multiple parameters and to construct intervals around model predictions (Haddon, 2010). In this study, 95% credible intervals of key parameters (e.g., Z/K, B/BMSY, and Lc/Lc_opt) were calculated, and these results can provide alternative information sources which can support decision-making. There were also some queries in LBB method, e.g., Hordyk et al. (2019) indicated that the LBB analysis did not correct for the pile-up effect. To address this issue, we applied two modified LBB models with corrections for the pile-up effect (Froese et al., 2019b). The results (Table 5) showed estimations of the original LBB method have been little affected by the pile-up effect for assessing the subject species in this study.
Among the assessed species, five species including E. merra, Strawberry hind Cephalopholis spiloparaea, Darkfin hind Cephalopholis urodeta, Striped large-eye bream Gnathodentex aureolineatus, and Red-breasted wrasse Cheilinus fasciatus are of high economic value and are classified in a very high price category in Fishbase. These species are among the main target species in the Nansha Islands (Li, 2010). The relative biomass level of E. merra was 0.98, and the other four species ranged from 0.16 to 0.45, indicating more serious conditions for the highly-valued fish stocks. Most coral reef fish catches in the Nansha Islands are caught by fishermen from Hainan, Guangdong, and Guangxi Provinces, and by multiple types of fishing gear, including gillnet, handline, spearfishing, trammel nets, and traps. A considerable percentage of the catches are also caught by fishing boats that target pelagic fishery resources and rest in the coral reefs because of bad weather. The three main reefs in the Nansha Islands are more than 1,000 km away from the nearest city. Therefore, effective fisheries management measures have not been implemented in the Nansha Islands.
In general, the LBB method provides a convenient way to assess the relative biomass levels of fish stocks in a special ecosystem for which catch data is difficult to obtain. Based on our assessment results, we suggest that fishing mortality should be reduced and the mesh size should be increased for coral reef fisheries in the Nansha Islands.
Data Availability Statement
The raw data supporting the conclusions of this article will be made available by the authors, without undue reservation.
Ethics Statement
The animal study was reviewed and approved by South China Sea Fisheries Research Institute Animal welfare committee.
Author Contributions
KZ wrote the first draft. JZ provided the original length data. KZ, JZ, and DS performed the data analyses. ZC modified the manuscript. All authors contributed to the article and approved the submitted version.
Funding
This work was supported by the National Key Research and Development Program of China (2018YFC1406502), the National Natural Science Foundation of China (31902374), and the Central Public-Interest Scientific Institution Basal Research Fund (2020TD05 and 2021SD01).
Conflict of Interest
The authors declare that the research was conducted in the absence of any commercial or financial relationships that could be construed as a potential conflict of interest.
Acknowledgments
The authors are grateful to Yancong Cai, Yan’e Jiang, Yuyan Gong, Yutao Yang, and crew of R/V Nanfeng for sample collection and measurement. We appreciate the valuable comments made by reviewers, which significantly improved our manuscript. We thank Karl Embleton, The University of Manchester for editing a draft of this manuscript.
Footnotes
References
Amorim, P., Sousa, P., Jardim, E., and Menezes, G. M. (2019). Sustainability status of data-limited fisheries: global challenges for snapper and grouper. Front. Mar. Sci. 6:654. doi: 10.3389/fmars.2019.00654
Arai, T. (2015). Diversity and conservation of coral reef fishes in the Malaysian South China Sea. Rev. Fish Biol. Fisher. 25, 85–101. doi: 10.1007/s11160-014-9371-9
Bellwood, D. R., Hoey, A. S., and Hughes, T. P. (2012). Human activity selectively impacts the ecosystem roles of parrotfishes on coral reefs. Proc. R. Soc. B Biol. Sci. 279, 1621–1629. doi: 10.1098/rspb.2011.1906
Costello, C., Ovando, D., Hilborn, R., Gaines, S. D., Deschenes, O., and Lester, S. E. (2012). Status and solutions for the world’s unassessed fisheries. Science 338, 517–520. doi: 10.1126/science.1223389
Cowles, M. K., and Carlin, B. P. (1996). Markov chain Monte Carlo convergence diagnostics: a comparative review. J. Am. Stat. Assoc. 91, 883–904. doi: 10.1080/01621459.1996.10476956
Dulvy, N. K., Freckleton, R. P., and Polunin, N. V. C. (2004). Coral reef cascades and the indirect effects of predator removal by exploitation. Ecol. Lett. 7, 410–416. doi: 10.1111/j.1461-0248.2004.00593.x
Froese, R., Demirel, N., Coro, G., Kleisner, K. M., and Winker, H. (2017). Estimating fisheries reference points from catch and resilience. Fish Fish. 18, 506–526. doi: 10.1111/faf.12190
Froese, R., Winker, H., Coro, G., Demirel, N., Tsikliras, A. C., Dimarchopoulou, D., et al. (2018). A new approach for estimating stock status from length frequency data. ICES J. Mar. Sci. 75, 2004–2015. doi: 10.1093/icesjms/fsy078
Froese, R., Winker, H., Coro, G., Demirel, N., Tsikliras, A. C., Dimarchopoulou, D., et al. (2019a). Corrigendum: a new approach for estimating stock status from length frequency data. ICES J. Mar. Sci. 76, 350–351. doi: 10.1093/icesjms/fsy139
Froese, R., Winker, H., Coro, G., Demirel, N., Tsikliras, A. C., Dimarchopoulou, D., et al. (2019b). On the pile-up effect and priors for Linf and M/K: response to a comment by Hordyk et al. on “A new approach for estimating stock status from length frequency data”. ICES J. Mar. Sci. 76, 461–465. doi: 10.1093/icesjms/fsy199
Gelman, A., and Rubin, D. B. (1992). Inference from iterative simulation using multiple sequences. Stat. Sci. 21, 457–472. doi: 10.1214/ss/1177011136
Haddon, M. (2010). Modelling and Quantitative Methods in Fisheries, Second Edition. New York, NY: Chapman and Hall.
Hordyk, A. R., Prince, J. D., Carruthers, T. R., and Walters, C. J. (2019). Comment on “A new approach for estimating stock status from length frequency data” by Froese et al. (2018). ICES J. Mar. Sci. 76, 457–460. doi: 10.1093/icesjms/fsy168
Hughes, T. P., Baird, A. H., Bellwood, D. R., Card, M., Connolly, S. R., Folke, C., et al. (2003). Climate change, human impacts, and the resilience of coral reefs. Science 301, 929–933. doi: 10.1126/science.1085046
Ju, P., Chen, M., Tian, Y., Zhao, Y., Yang, S., and Xiao, J. (2020). Stock Status Estimating of 5 shark species in the waters around Taiwan using a length-based Bayesian biomass estimation (LBB) method. Front. Mar. Sci. 7:632. doi: 10.3389/fmars.2020.00632
Li, Y. (2010). Species Diversity and Biology of Fish in Coral Reef Waters of Xisha, Zhongsha, and Nansha Islands, South China Sea. Ph. D. Thesis, Ocean University of China, Qingdao.
Li, Y., Chen, Z., Zhang, J., Jiang, Y., Gong, Y., Cai, Y., et al. (2020). Species and taxonomic diversity of Qilianyu island reef fish in the Xisha Islands. J. Fish. Sci. China 27, 815–823.
Li, Y., Wang, C., Zou, X., Feng, Z., Yao, Y., Wang, T., et al. (2019). Occurrence of polycyclic aromatic hydrocarbons (PAHs) in coral reef fish from the South China Sea. Mar. Pollut. Bull. 139, 339–345. doi: 10.1016/j.marpolbul.2019.01.001
Liang, C., and Pauly, D. (2017). Growth and mortality of exploited fishes in China’s coastal seas and their uses for yield-per-recruit analyses. J. Appl. Ichthyol. 33, 746–756. doi: 10.1111/jai.13379
Liang, C., Xian, W., Liu, S., and Pauly, D. (2020). Assessments of 14 exploited fish and Invertebrate stocks in Chinese waters using the LBB method. Front. Mar. Sci. 7:314. doi: 10.3389/fmars.2020.00314
MacNeil, M. A., Graham, N. A. J., Cinner, J. E., Wilson, S. K., Williams, I. D., Maina, J., et al. (2015). Recovery potential of the world’s coral reef fishes. Natrue 520, 341–344.
Manikandan, B., Ravindran, J., Shrinivaasu, S., Marimuthu, N., and Paramasivam, K. (2014). Community structure and coral status across reef fishing intensity gradients in Palk Bay reef, southeast coast of India. Environ. Monit. Assess. 186, 5989–6002. doi: 10.1007/s10661-014-3835-1
McClanahan, T. R., Graham, N. A. J., MacNeil, M. A., Muthiga, N. A., Cinner, J. E., Bruggemann, J. H., et al. (2011). Critical thresholds and tangible targets for ecosystem-based management of coral reefs. Proc. Natl. Acad. Sci. U.S.A. 108, 17230–17233. doi: 10.1073/pnas.1106861108
Nadon, M. O., Ault, J. S., Williams, I. D., Smith, S. G., and DiNardo, G. T. (2015). Length-based assessment of coral reef fish populations in the main and northwestern Hawaiian Islands. PLoS One 10:e0133960. doi: 10.1371/journal.pone.0133960
Ng, P. K. L., and Tan, K. S. (2000). The state of marine biodiversity in the South China Sea. Bull. Zool. 8, 3–7.
Nie, H., Wang, J., Xu, K., Huang, Y., and Yan, M. (2019). Microplastic pollution in water and fish samples around Nanxun Reef in Nansha Islands, South China Sea. Sci. Total Environ. 696:134022. doi: 10.1016/j.scitotenv.2019.134022
O’Hara, R. B., and Sillanpää, M. J. (2009). A review of Bayesian variable selection methods: what, how and which. Bayesian Anal. 4, 85–117. doi: 10.1214/09-ba403
Pan, C., Yu, K., Wang, Y., Zhang, R., Huang, X., Wei, C., et al. (2018). Species-specific profiles and risk assessment of perfluoroalkyl substances in coral reef fishes from the South China Sea. Chemosphere 191, 450–457. doi: 10.1016/j.chemosphere.2017.10.071
Pandolfi, J. M., Bradbury, R. H., Sala, E., Hughes, T. P., Bjorndal, K. A., Cooke, R. G., et al. (2003). Global trajectories of the long-term decline of coral reef ecosystems. Science 301, 955–958. doi: 10.1126/science.1085706
Plummer, M. (2003). “JAGS: a program for analysis of Bayesian graphical models using Gibbs sampling,” in Proceedings of the 3rd International Workshop on Distributed Statistical Computing, Vienna. 124, 1–9.
Quinn, T. J., and Deriso, R. B. (1999). Quantitative Fish Dynamics. New York, NY: Oxford University Press.
Randall, J. E., and Lim, K. K. P. (2000). A checklist of the fishes of the South China Sea. Raff. Bull. Zool. 8, 569–667.
Ricard, D., Minto, C., Jensen, O. P., and Baum, J. K. (2012). Examining the knowledge base and status of commercially exploited marine species with the RAM legacy stock assessment database. Fish Fish. 13, 380–398. doi: 10.1111/j.1467-2979.2011.00435.x
Spalding, M. D., and Brown, B. E. (2015). Warm-water coral reefs and climate change. Science 350, 769–771. doi: 10.1126/science.aad0349
Thorson, J. T., Johnson, K. F., Methot, R. D., and Taylor, I. G. (2017). Model-based estimates of effective sample size in stock assessment models using the Dirichlet-multinomial distribution. Fish. Res. 192, 84–93. doi: 10.1016/j.fishres.2016.06.005
von Bertalanffy, L. (1938). A quantitative theory of organic growth (inquiries on growth laws. II.). Hum. Biol. 10, 181–213.
Wang, X., Qiu, Y., Zhang, P., and Du, F. (2016). Natural mortality estimation and rational exploitation of purpleback flying squid Sthenoteuthis oualaniensis in the southern South China Sea. Chin. J. Oceanol. Limn. 35, 902–911. doi: 10.1007/s00343-017-6115-4
Worm, B., Hilborn, R., Baum, J. K., Branch, T. A., Collie, J. S., Costello, C., et al. (2009). Rebuilding global fisheries. Science 325, 578–585.
Yan, H., Yu, K., Shi, Q., Tan, Y., Zhang, H., Zhao, M., et al. (2011). Coral reef ecosystems in the South China Sea as a source of atmospheric CO2 in summer. Chin. Sci. Bull. 56, 676–684. doi: 10.1007/s11434-011-4372-8
Yu, K., Zhao, J., Shi, Q., Chen, T., Wang, P., Collerson, K. D., et al. (2006). U-series dating of dead Porites corals in the South China Sea: Evidence for episodic coral mortality over the past two centuries. Quat. Geochronol. 2, 129–141. doi: 10.1016/j.quageo.2006.06.005
Zhang, J., Chen, G., Chen, Z., Qiu, Y., and Xiong, D. (2016). Application of hydroacoustics to investigate the distribution, diel movement, and abundance of fish on Zhubi Reef, Nansha Islands, South China Sea. Chin. J. Oceanol. Limn. 34, 964–976. doi: 10.1007/s00343-016-5019-z
Zhang, J., Chen, Z., Dong, J., Zhang, K., Lin, Z., and Sun, D. (2020). Variation in the population characteristics of blue-striped snapper Lutjanus Kasmira in the South China Sea in recent 20 years. Oceanol. Et Limnol. Sin. 51, 114–124.
Zhang, J., Qiu, Y., Chen, Z., Zhang, P., Zhang, K., Fan, J., et al. (2018). Advances in pelagic fishery resources survey and assessment in open South China Sea. South China Fish. Sci. 14, 118–127.
Zhang, K., Cai, Y., Liao, B., Jiang, Y., Sun, M., Su, L., et al. (2020). Population dynamics of threadfin porgy Evynnis cardinalis, an endangered species on IUCN red list in the Beibu Gulf, South China Sea. J. Fish Biol. 97, 479–489. doi: 10.1111/jfb.14398
Keywords: stock assessment, Nansha Islands, coral reef fishes, overfishing, length-based Bayesian estimation
Citation: Zhang K, Zhang J, Shi D and Chen Z (2021) Assessment of Coral Reef Fish Stocks From the Nansha Islands, South China Sea, Using Length-Based Bayesian Biomass Estimation. Front. Mar. Sci. 7:610707. doi: 10.3389/fmars.2020.610707
Received: 27 September 2020; Accepted: 30 November 2020;
Published: 13 January 2021.
Edited by:
Morten Omholt Alver, Norwegian University of Science and Technology, NorwayReviewed by:
Pamela Massiel Chiroque Solano, Federal University of Rio de Janeiro, BrazilDaniela Ceccarelli, Southern Cross University, Australia
Copyright © 2021 Zhang, Zhang, Shi and Chen. This is an open-access article distributed under the terms of the Creative Commons Attribution License (CC BY). The use, distribution or reproduction in other forums is permitted, provided the original author(s) and the copyright owner(s) are credited and that the original publication in this journal is cited, in accordance with accepted academic practice. No use, distribution or reproduction is permitted which does not comply with these terms.
*Correspondence: Kui Zhang, emhhbmdrdWlAc2NzZnJpLmFjLmNu; Zuozhi Chen, Y2hlbnp1b3poaUBzY3NmcmkuYWMuY24=