 Marysia Szymkowiak
 Melissa Rhodes-Reese
- 1Alaska Fisheries Science Center, National Marine Fisheries Service, Juneau, AK, United States
- 2Pacific States Marine Fisheries Commission, Alaska Fisheries Science Center, NOAA, National Marine Fisheries Service, Juneau, AK, United States
Over recent years there have been rapid changes occurring across marine ecosystems worldwide, with high latitude systems seeing ecosystem shifts emerging at unprecedented rates. The Gulf of Alaska and Bering Sea marine ecosystems have experienced substantial fluctuation in fish stocks, with some species experiencing considerable decreases while others thrive. Following the marine heatwave of 2014, sablefish (Anoplopoma fimbria) had a historically unparalleled juvenile recruitment class that is now dominating the stock composition. While this recruitment class bodes well for future fisheries, it is currently undermining the value of the fishery with limited incentives to retain the smaller and less valuable fish, compounding adverse effects on earnings in the fishery due to whale depredation that has been occurring for years. This study examines the well-being implications of fishermen’s adaptive strategies to these ecosystem conditions within the Alaska sablefish fishery using a socio-ecological system framework, operationalized as a qualitative network model (QNMs) and quantitative indicators. We examine the extent to which adaptation strategies, derived from a literature review and stakeholder interviews, are being utilized in the fishery with quantitative indicators. These strategies are then examined with QNMs that explore their impacts across the spectrum of well-being. By coupling quantitative indicators and QNMs, we were able to demonstrate how adaptive strategies can be examined to capture the multi-faceted well-being effects of fisheries participants’ adaptations to changing conditions. This study directly addresses several of the key guiding principles of the U.S. EBFM Road Map, including advancing our understanding of ecosystem processes, exploring trade-offs within an ecosystem, and maintaining resilient ecosystems, inclusive of community well-being. Thus this paper demonstrates how coupled socio-ecological models can elevate the inclusion of human adaptive behaviors, providing a framework for the development of policymaking that can mitigate adverse effects on both the participants and the resource by facilitating the mixture of adaptive strategies that maximizes desired well-being outcomes.
Introduction
High latitude marine ecosystems are experiencing unparalleled climatic change (Serreze and Francis, 2006) and in 2013, a record breaking marine heatwave began in the Northeast Pacific and continued through 2015 with substantial system-wide changes throughout the Gulf of Alaska (GOA) (Bond et al., 2015). This extended anomalous warming episode was immediately followed by a particularly intense El Nino event and the subsequent atmospheric mechanisms drew the warm water into the Bering Sea and prolonged the heatwave (Walsh et al., 2018). While the impacts are still being fully assessed, many commercial fisheries along the US West Coast from California to the Bering Sea were severely adversely affected (Barbeaux et al., 2019; Laurel and Rogers, 2020). In contrast, sablefish (Anoplopoma fimbria) had a historically unprecedented recruitment class during 2014 and 2016 (Hanselman et al., 2019). Under climate change, it is anticipated that the Gulf of Alaska and Bering Sea will continue to undergo extreme heating events like the 2013 heatwave (Walsh et al., 2018) and subsequent above average sablefish recruitment events will likely persist (Hanselman et al., 2019).
The 2014 sablefish recruitment class that followed the marine heatwave is currently dominating the stock composition, creating uncertainty for both stock assessors and harvesters alike (Hanselman et al., 2019). Prior to 2014, the last large recruitment event occurred in 2000 and pales in comparison with what occured in 2014 and 2016 (Figure 1) (Hanselman et al., 2019). From age-0 to two, juvenile sablefish reside in nearshore habitat before moving to the deeper waters on the upper continental slope (Rutecki and Varosi, 1997) where they are in reach to both the longline and trawl fleets. During those first 2 years, juvenile sablefish can grow upwards of 1.2 mm a day (Sigler et al., 2001), before their growth rate asymptotes with adults reaching an average maximum length of 80 cm (Echave et al., 2012). Though these large recruitment classes are expected to enter the fishery, there is still a high level of uncertainty in the timing and their condition. Managers consider the high recruitment estimates and future stock trajectories to be associated with considerable uncertainty, as early recruitment estimates of unusually strong year classes have frequently been overestimated in past assessments (Hanselman et al., 2019). For example, the estimated size of the 2014 years class declined by over 40% between the initial estimates and the 2019 assessment (Hanselman et al., 2019). Further compounding the uncertainty is the decline of the spawning biomass during the last 30 years (Figure 1) and overall ecosystem variability. The magnitude and frequency of events like the 2013 marine heatwave are still being assessed for sablefish (Hanselman et al., 2019), creating additional challenges in predicting if and when recruitment events of this nature will occur in the future.
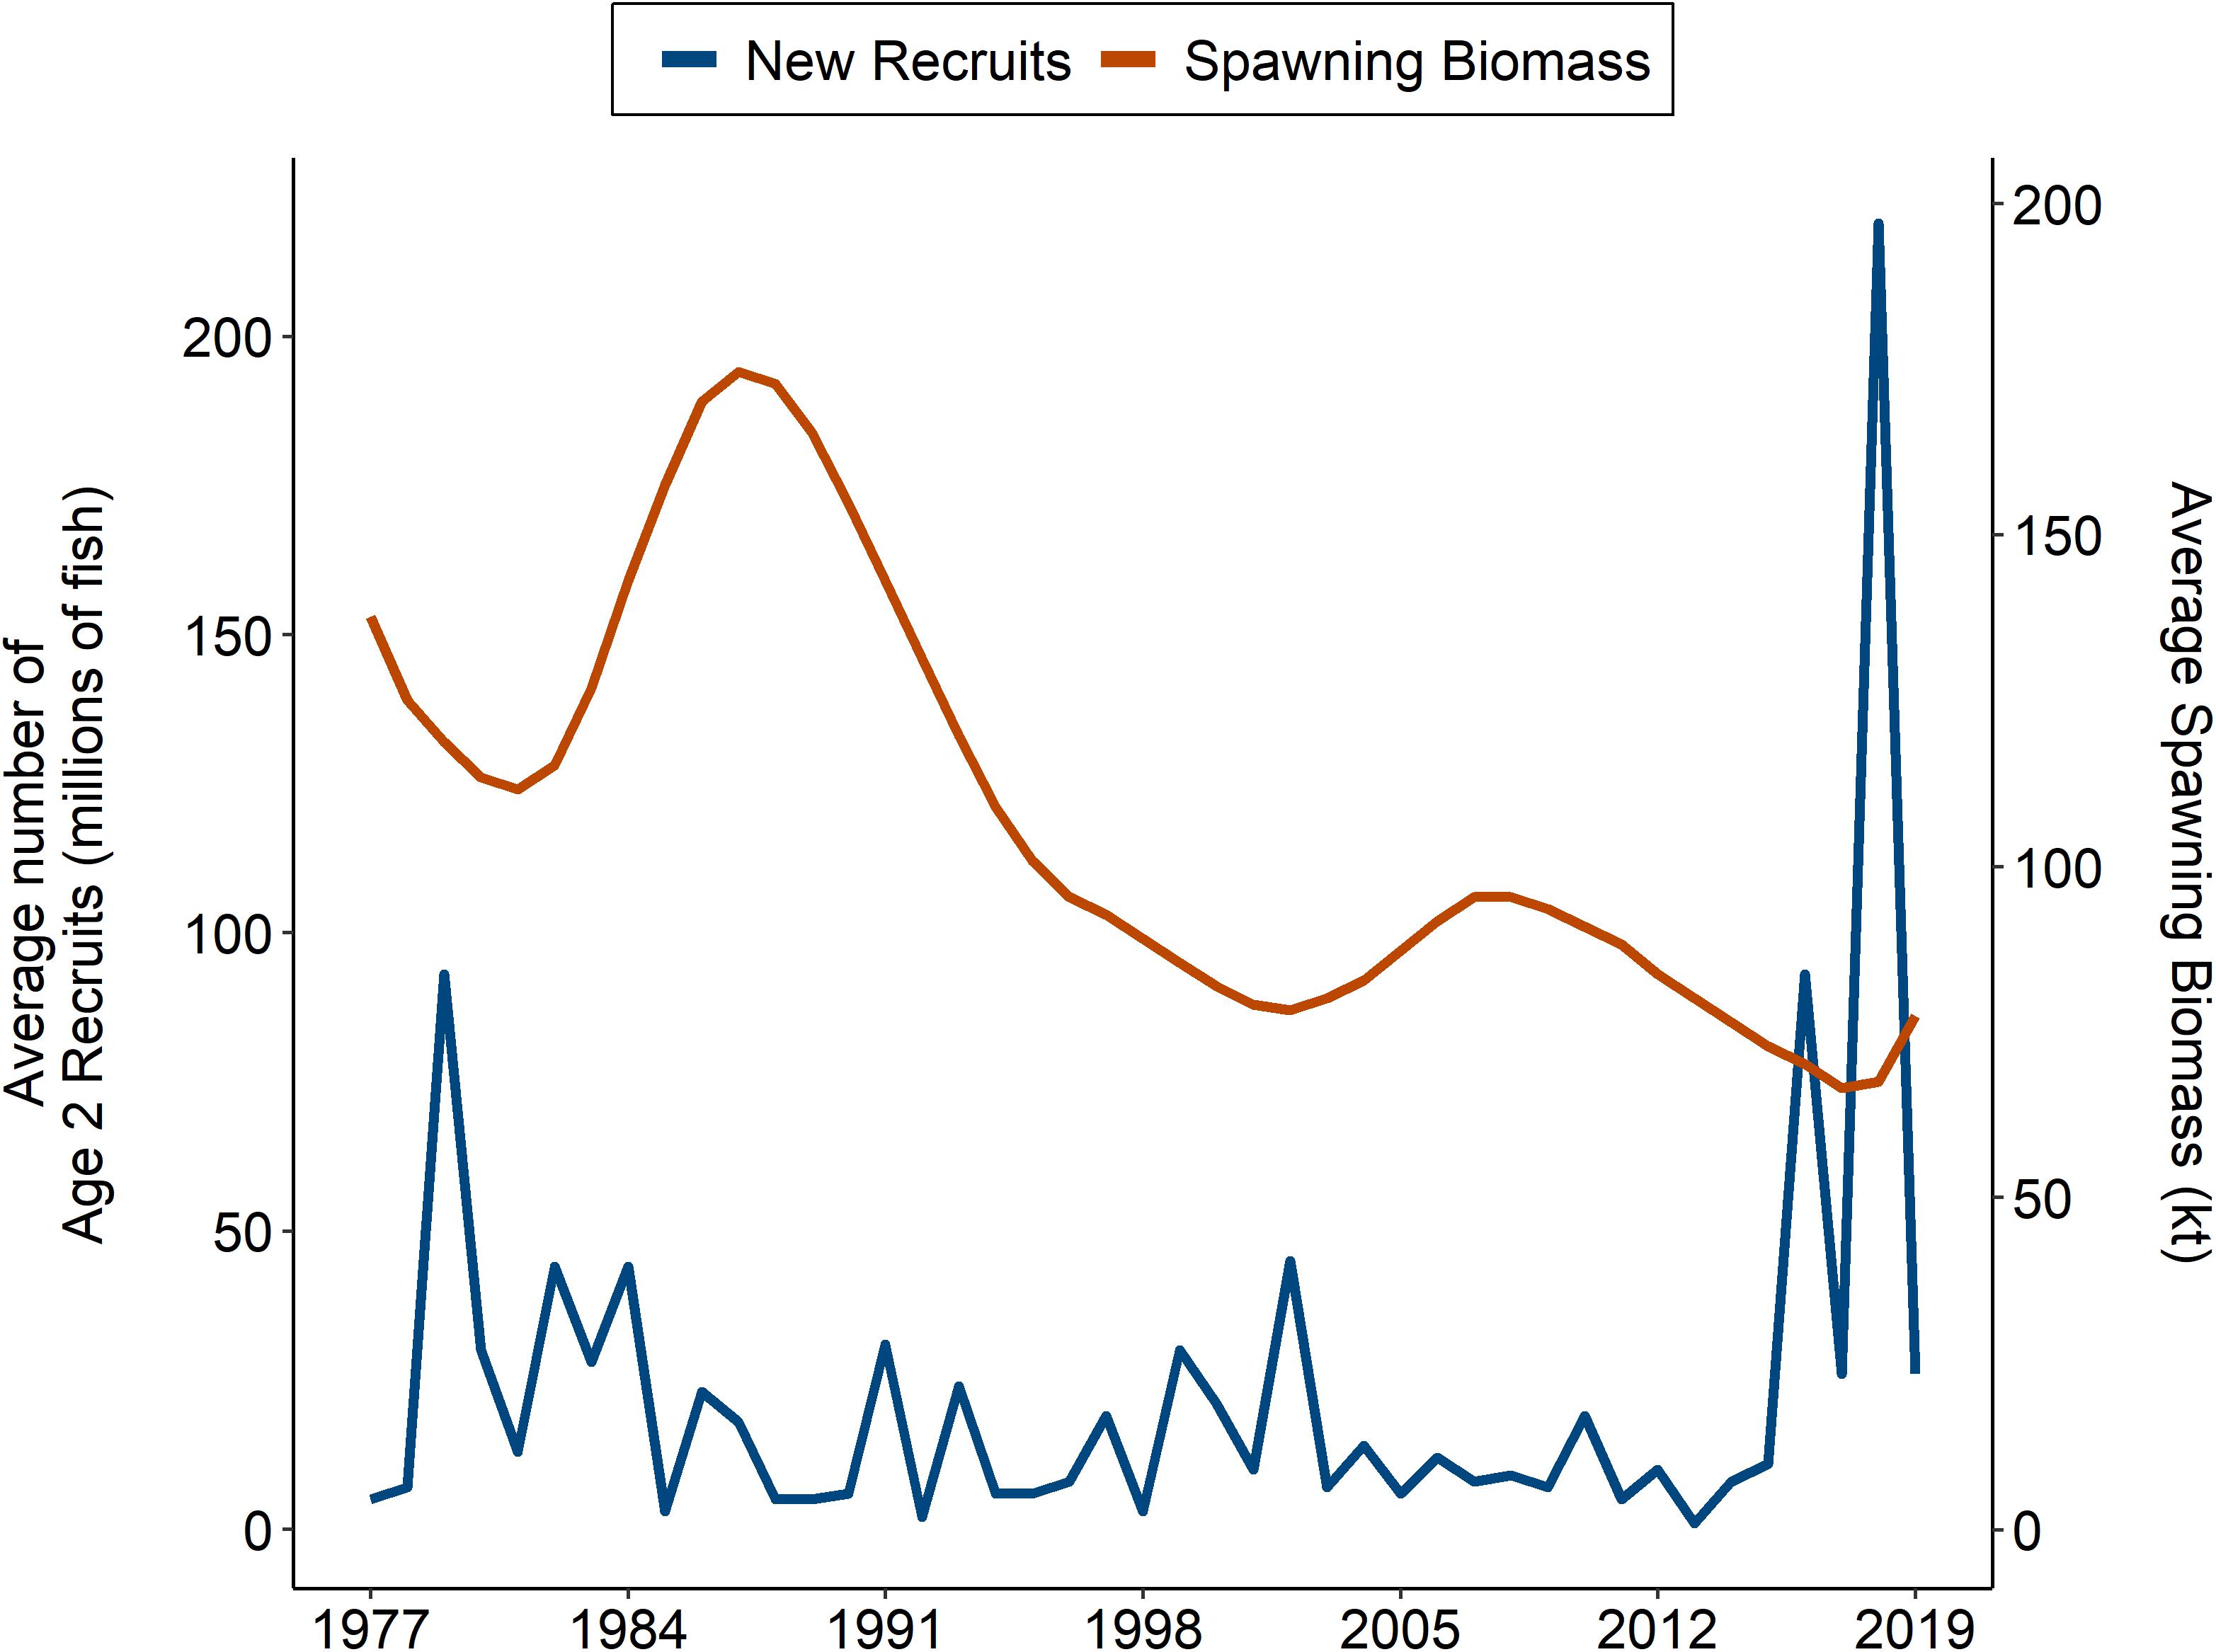
Figure 1. Age-2 sablefish recruits and spawning biomass of sablefish in Alaska from 1977 to 2019. The blue line and primary y-axis indicate the average number of age 2-recruits; the orange line and secondary y-axis indicate the average spawning biomass.
The influx of small fish and the overall decline of older fish is having substantial adverse effects on the fishery, as it is difficult for fishermen to avoid the vast numbers of small fish (Rosellon-Druker et al., 2020). Large sablefish receive a substantial price premium and the high numbers of smaller fish are currently causing average dockside prices to plummet across all size categories (Fissel et al., 2019). Fishermen have also been encountering large numbers of fish that are too small to be marketable (NPFMC, 2018). In addition, the price differential between small and large fish has grown over the last 2 years as the increased supply of smaller fish is putting downward pressure on the price of small fish, further increasing the price margin between the size classes (Fissel et al., 2019; NPFMC, 2019a). The net effect is that although total allowable catch (TAC) for this fishery has increased, revenues have concurrently dropped with estimates of average vessel revenues for 2019 at 68% of the previous 5-year average, based on harvest data used in this analysis as described below. In addition, revenue declines are coupled with increased operating costs from gear damage and loss of fish caused by persistent whale depredation on longline gear from both sperm whales (Physeter macrocephalus) and killer whales (Orcinus orca), as well as rising expenses in terms of bait, fuel, and crew due to the additional time it takes to harvest quotas under conditions of both whale depredation and small sablefish abundance (Peterson et al., 2014).
Understanding the ways in which fishermen are being affected by and responding to these changes is critical to ensuring the resilience of the fishing fleet and fishing dependent communities as well as to the biological sustainability of the fishery in the long run (Lord, 2011; van Putten et al., 2013; Ono et al., 2017). The increased ecological uncertainty has required fishermen to adapt in a variety of ways, all of which have diverse implications in terms of well-being outcomes. Additionally, the continual capture of the less than desirable size class and the potential for illegal discarding has the capability to reduce the spawning potential of the large recruitment classes. This study examines these types of impacts from adaptive behaviors in the sablefish IFQ fishery in response to both small sablefish abundance and whale depredation using quantitative indicators and qualitative network models (QNMs).
Qualitative network models are operationalized conceptual models, which employ a qualitative understanding of variables and the direction of their linkages to build a system of interest (Dambacher et al., 2009). Their qualitative assessment is useful in discerning how a community responds to a sustained (press) or short (pulse) perturbation (Raymond et al., 2011; Melbourne-Thomas et al., 2012) and is favored in data limited systems where a quantitative assessment of variable interactions is not feasible (Dambacher et al., 2009; Reum et al., 2015). Within QNMs, link directions of positive and negative are assigned to community variable interactions and assembled into a sign directed graph, known as a digraph. The digraph corresponds to a community matrix and can be analyzed using graph theory and matrix algebra (Reum et al., 2015). Random variable interaction strengths are assigned to the community matrix to simulate a system, which is then perturbed to probabilistically predict how a community responds to a perturbation (Melbourne-Thomas et al., 2012).
Qualitative network models are being increasingly employed to examine ecosystems more holistically and their qualitative responses to system perturbations (Reum et al., 2015; Harvey et al., 2016). Despite this increased use, the incorporation of human dimensions into these models is often overly simplistic, with limited if any consideration of human adaptability and variability in terms of well-being (Kelble et al., 2013; Okamoto et al., 2020). Well-being, as described in more detail below, is conceptualized as a state of being when needs are met and individuals and communities can pursue their goals and enjoy a good quality of life (Breslow et al., 2016). In this study, we present a novel application of QNMs, moving beyond static assumptions to incorporate adaptive behaviors and better reflect the reality of how coupled socio-ecological systems function. We first examine the extent to which various adaptive strategies are being used with fishery derived quantitative indicators; then, we apply QNMs to demonstrate the diversity of well-being outcomes associated with these adaptations. This coupling of quantitative indicators with QNMs provides insights into which adaptive strategies are being employed and in turn how adaptive choices may affect well-being, informing managers about the potential trade-offs associated with policy decisions that may facilitate one type of adaptation over another.
The remainder of this paper is organized as follows. The following section provides a discussion of how the fixed-gear fishery is conducted and managed in Alaska. This is followed by a description of the data and methodology. The results of the study are presented in terms of both insights into the choice of adaptations and their well-being outcomes, followed by the conclusions including potential policy implications.
Management of the Alaska Sablefish Fishery
The vast majority (over 90%) of Alaska sablefish is harvested in the federal fixed-gear fisheries (longline pot and hook-and-line). The fixed-gear sablefish fishery is the third most valuable groundfish fishery in Alaska, with average landings of 9,640 total metric tons over the last 5 years averaging $87.9 million in ex-vessel values (nominal US dollars) (Fissel et al., 2020). The fishery is prosecuted by a large number of relatively small vessels, averaging 279 total vessels with the majority of vessels around 50–60 feet in length (Fissel et al., 2020).
The management of the Alaska sablefish fishery provides important context for how fishermen make decisions about adapting to changing conditions. The North Pacific Fishery Management Council (NPFMC) develops and amends fishery management plans for the sablefish fishery that are implemented by the National Marine Fisheries Service Alaska Regional Office (NMFS AKRO). The federal fixed-gear sablefish fishery is managed under the Pacific halibut and sablefish individual fishing quota (IFQ) Program (hereinafter IFQ Program) wherein participants have quota shares that are translated into annual IFQs on the basis of the TAC. There are both catcher vessels and catcher processors that participate in the sablefish IFQ fishery; the former of which land their IFQs at shoreside processors while the latter process their catch onboard. This study focuses on the catcher vessel fleet, which accounts for about 80% of sablefish IFQ landings. Catcher processors are subject to different regulations that could affect the adaptive strategies that they employ and differentiate them from catcher vessels (NPFMC/NMFS, 2016).
When the IFQ Program was implemented in 1995 it included a number of diverse provisions intended to address a variety of social objectives for the fisheries that in turn have implications for how fishermen can respond to changing ecological conditions. Quota shares (QS) are both area and vessel class specific, with trading of QS between areas and vessel classes prohibited. In order to ensure that the benefits of the sablefish IFQ fishery flowed to active participants, IFQ leasing (the harvest of IFQ by someone other than the QS holder for which the QS holder is compensated) was prohibited for catcher vessel quota shareholders except under emergency medical and survivorship conditions. However, initial recipients of QS may use hired masters (anyone designated by the QS holder) to land their IFQ, and for many participants doing so effectively amounts to leasing (Szymkowiak and Himes-Cornell, 2015). There are emergency leasing provisions under which quota shareholders with medical conditions or who are beneficiaries of quota may outright lease their IFQs for harvest. The program also includes limits on consolidation including individual QS accumulation limits and vessel use caps; the former limits the amount of QS that can be held by an individual while the latter constrains the amount of IFQ that can be landed on a vessel. Participants in the sablefish IFQ fishery are also mandated to retain all sablefish that they land, irrespective of size. In an effort to limit gear conflicts between hook-and-line and longline pot gear users, the program also originally included a prohibition on using pots to harvest sablefish in the Gulf of Alaska, which are generally allowed in the rest of the Alaskan sablefish fishery. In 2017, in response to increasing concerns about whale depredation on sablefish caught on hook-and-line gear this prohibition was lifted allowing the use of longline pot gear in the Gulf of Alaska sablefish IFQ fishery.
Data and Methods
This study couples quantitative indicators with QNMs to understand the potential well-being effects of adaptive strategies on participants. The strategies that fishermen are employing to mitigate economic losses from changing ecological conditions were determined through literature review and stakeholder interviews. Indicators were developed to examine the utilization of these strategies. The indicators were compiled from Alaska harvest data that is the principal source of information for fisheries analyses in the region. Conceptual models describing the linkages between adaptive strategies and components of well-being were developed from links described during stakeholder interviews and within the literature. The models were operationalized as QNMs and perturbed to reflect current ecological conditions, including abundant juvenile sablefish and whale depredation.
Identifying the Sablefish IFQ Fleet’s Adaptive Strategies
In order to determine fishermen’s adaptive strategies to minimize whale depredation and harvest of small sablefish as well as the well-being outcomes of those strategies, we conducted stakeholder interviews and a literature review. Semi-structured interviews were conducted over the telephone with key informants using an open-ended question format on the topics of whale depredation, small sablefish abundance, and adaptive strategies in the fleet. Key informants were chosen on the basis of their expertise in the sablefish fishery and representation of stakeholder groups in key geographic areas – Seattle, Sitka, Homer, and Kodiak- that fish throughout all of the sablefish fisheries management areas off Alaska. The literature review consisted of analyses conducted for the NPFMC regarding whale depredation and small sablefish abundance issues (NPFMC, 2013, 2015, 2018, 2019a,b; NPFMC/NMFS, 2016). Furthermore we used search databases including Google Scholar and Scopus with variations of a combination of the search terms “Alaska,” “sablefish,” “whale depredation,” “juvenile sablefish,” which resulted in a series of peer reviewed publications largely pertinent to whale depredation, given the relative recency of issues with small sablefish in the region (Peterson and Carothers, 2013; Peterson et al., 2014; Peterson and Hanselman, 2017; Hanselman et al., 2018).
Through this process we identified several key strategies, which fishermen are employing in Alaska to try to mitigate the adverse impacts of changing ecological conditions on their earnings. These strategies include highgrading (or discarding of small or damaged fish), avoidance behaviors, leasing IFQ, and stacking IFQ on pot boats, Table 1, which are described in detail below. (The associated indicators are described in Section “Quantitative indicators of adaptive behavior”). In general these adaptations are not mutually exclusive but may be invoked by fishermen over differing time horizons. An adaptive strategy was utilized if there was a minimum of one publication supporting the strategies identified by stakeholders. Some of the strategies are specific to avoiding small sablefish while others are intended to limit whale depredation.
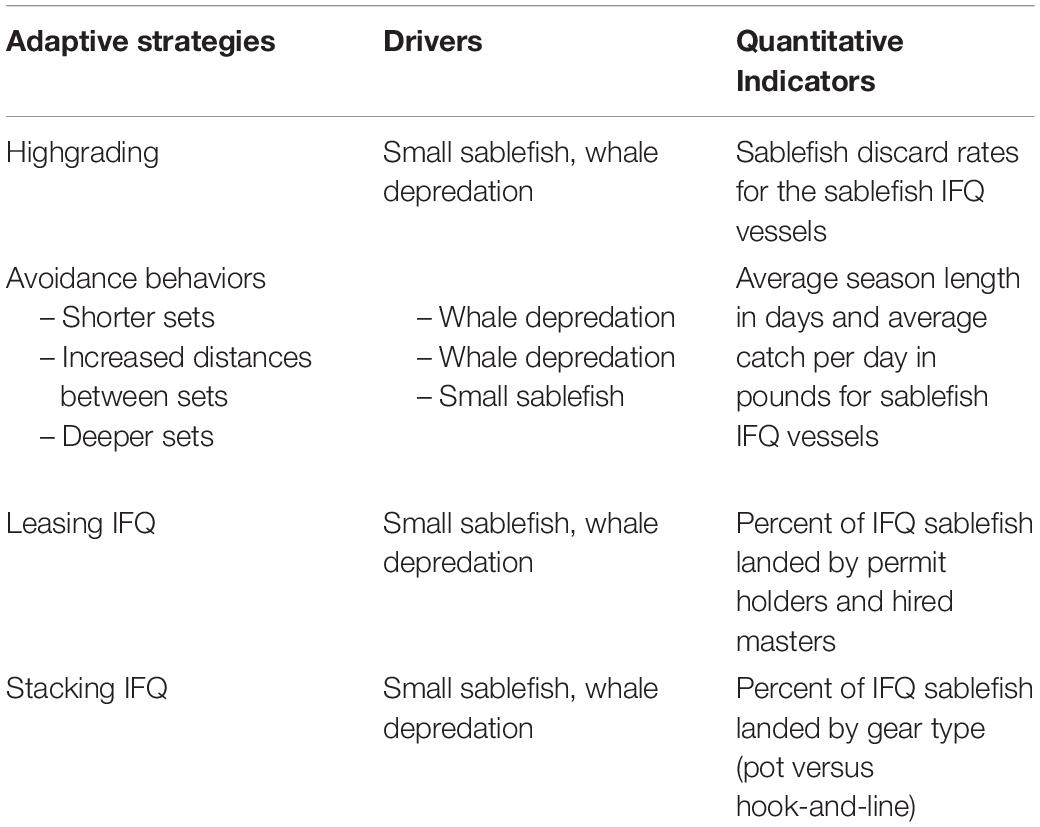
Table 1. Adaptive strategies in response to small sablefish and whale depredation.
In the short run, fishermen noted that they may respond to small sablefish abundance by highgrading their catch – the practice of discarding smaller size fish or those damaged by whale depredation. Currently, regulations mandate retention of all sablefish for IFQ participants, irrespective of size; however, fishermen indicated that highgrading likely occurs in the fishery anyway. The sablefish IFQ fleet is only subject to partial observer coverage, with 7% of the sablefish IFQ harvests actually observed in 2018 (Hanselman et al., 2019), a limitation that can facilitate highgrading. Fishermen noted that they may also employ a variety of avoidance behaviors on fishing trips to try to limit both whale depredation and small sablefish. In order to avoid whales, fishermen may use shorter sets to minimize the amount of time that whales have to depredate the gear. Fishermen also described increasing distances between sets in order to prevent whales from learning to follow the boat. In an effort to avoid small sablefish, fishermen target deeper waters where smaller fish are less likely to aggregate. Deeper sets are likely to be coupled with shorter sets because fishing deeper affords whales a longer amount of time to try to pick fish off the gear. In essence, this implies a squeeze between avoiding whales and small fish using this strategy, which similarly to the other strategies likely results in variability in its application depending on which condition, small fish or whales, is problematic at any given time in any given area.
Because, according to fishermen, avoidance and highgrading have not been wholly effective at mitigating adverse effects on earnings within the sablefish IFQ fishery, fishermen have also begun to employ more strategic planning behavior in the medium term. Fishermen noted attempting to minimize operating costs by leasing IFQ, essentially aggregating IFQ from multiple quota shareholders in order to make economically efficient trips. This was a strategy relevant in terms of increasing costs associated with both avoiding whales and small fish. In order to specifically address whale depredation issues, fishermen discussed stacking IFQ on boats employing pot gear, which whales cannot depredate. Therefore, whereas leasing is explored herein in terms of both leasing to hook-and-line and pot boats, stacking IFQ is understood to be a strategy specific to moving quota onto pot boats only.
Quantitative Indicators of Adaptive Behavior
The extent to which each of the adaptive strategies delineated above is being employed in the sablefish fishery is examined using quantitative indicators that align with each of the strategies, see Table 1. An indicator of at sea discarding was used to assess whether fishermen are highgrading their catch to minimize the retention of small fish. Despite the prohibition on discarding in the sablefish IFQ fishery, the practice does take place and data is recorded by onboard monitoring efforts in the fleet (see NMFS, 2019). According to fishermen, avoidance behaviors have compounded the season prolongation that has resulted from the increased time needed to harvest quotas with whale depredation and small fish. Because direct indicators of the various avoidance behaviors were not available, proxy indicators were developed that examine season duration in terms of average annual days-at-sea and daily harvest. These indicators are examined with respect to linear time trends and using locally weighted scatterplot smoothing (LOWESS) regression to determine whether trends change relative to the more recent data. A bandwidth of 0.4 is applied, indicating that the LOWESS smoother has a span equal to 40% of the data. Leasing is examined as the percent of sablefish IFQ landed by permit holders and hired masters, as described above the relationship between permit holders and hired masters is often akin to leasing. Stacking IFQ is examined with respect to the distribution of sablefish IFQ landed by pot and hook-and-line gear.
Specific well-being outcomes of adaptive strategies identified by the QNM simulations, or more simply variables within our models, were also assessed using quantitative indicators. Non-target bycatch is considered a product of fishermen harvesting in deeper waters to target larger sized adults and avoid the large number of juvenile sablefish. Specifically, stakeholders indicated increased interactions with rockfish due to the transition to deeper waters, which is examined with an indicator of rockfish bycatch for the sablefish IFQ fleet, for the top six rockfish species landed by volume. As fishermen try to reduce operational costs, they aggregate quota on fewer vessels either by leasing or stacking IFQ on pot boats. That consolidation implies fewer opportunities for crew to participate in this fishery resulting potentially from both fewer participating vessels and from quota shareholders cooperating in the harvest of their quota; the latter of which implies that shareholders in turn act as crew on someone else’s vessel (NPFMC/NMFS, 2016). This well-being effect is captured with an indicator that examines the number of unique vessels and average crew size per fishing trip in the sablefish IFQ fleet.
The vast majority of the indicators in this study are based on harvest data that is collected by the Alaska Department of Fish and Game (ADFG) and utilized by NMFS AKRO to track sablefish harvests relative to IFQ accounts. The harvest data, commonly referred to as “fish tickets,” contains information on species landed, weight, gear used, prices, product types, and harvest dates, as well as permit, vessel, and processor identifiers. Permit holder data was coupled with harvest data to identify whether the person making the landing was the IFQ permit holder or a hired master.
In order to align our analysis of the indicators with the QNMs developed from the literature and stakeholder interviews we limited the data to catcher vessels making shoreside landings of sablefish IFQ. The only indicator that was not derived directly from fish ticket data is for sablefish discards by the IFQ fleet. This indicator was developed from an analysis presented by the NMFS AKRO to the NPFMC and based on data from the NMFS Catch Accounting System and Restricted Access Management Program databases, inclusive of a variety of required industry reports of harvest and at-sea discards and data collected through the fishery observer program (Cahalan et al., 2014; NMFS, 2019).
Trends that became evident in 2017 were generally considered consistent with a response to small sablefish abundance, which is aligned with the timing of when fishermen reported encountering large numbers of small fish (NPFMC, 2018). A response to whale depredation is less easily discernible because that depredation has been occurring for decades. However, quota stacking on pot boats is examined as a response to whale depredation following the amendment to the IFQ Program that allowed pot gear usage in the Gulf of Alaska in 2017. The timing of the implementation of this amendment may be confounding trends examined with respect to adaptive strategies. Given the recency of small sablefish abundance and the short length of time series that we can examine, the intent of this study is really to demonstrate the potential utility of coupling quantitative indicators with QNMs rather than ascertaining actual trends based on the indicators themselves. The use of indicators to denote potential ecosystem changes that may affect stocks and fisheries is becoming increasingly important in the face of rapid marine ecological shifts and increasingly applied in North Pacific fisheries (Shotwell, 2018), and indicators focused on human adaptation can be readily incorporated within that mix.
Development of the Baseline and Adaptive QNMs
Five QNMs were constructed to explore the well-being effects of each of the adaptive strategies of the sablefish IFQ fleet. As noted above, similar to identifying adaptive strategies, linkages were determined from the well-being effects that were identified from stakeholder interviews and evidenced in the literature. Well-being is framed in terms of its multiple components, linking the individual, environmental, and social domains that provide for a good quality of life beyond when basic needs are met (Breslow et al., 2016). These domains consist of a broad array of elements that have previously been associated with fisheries participation in Alaska (Figure 2) (Szymkowiak and Kasperski, 2020).
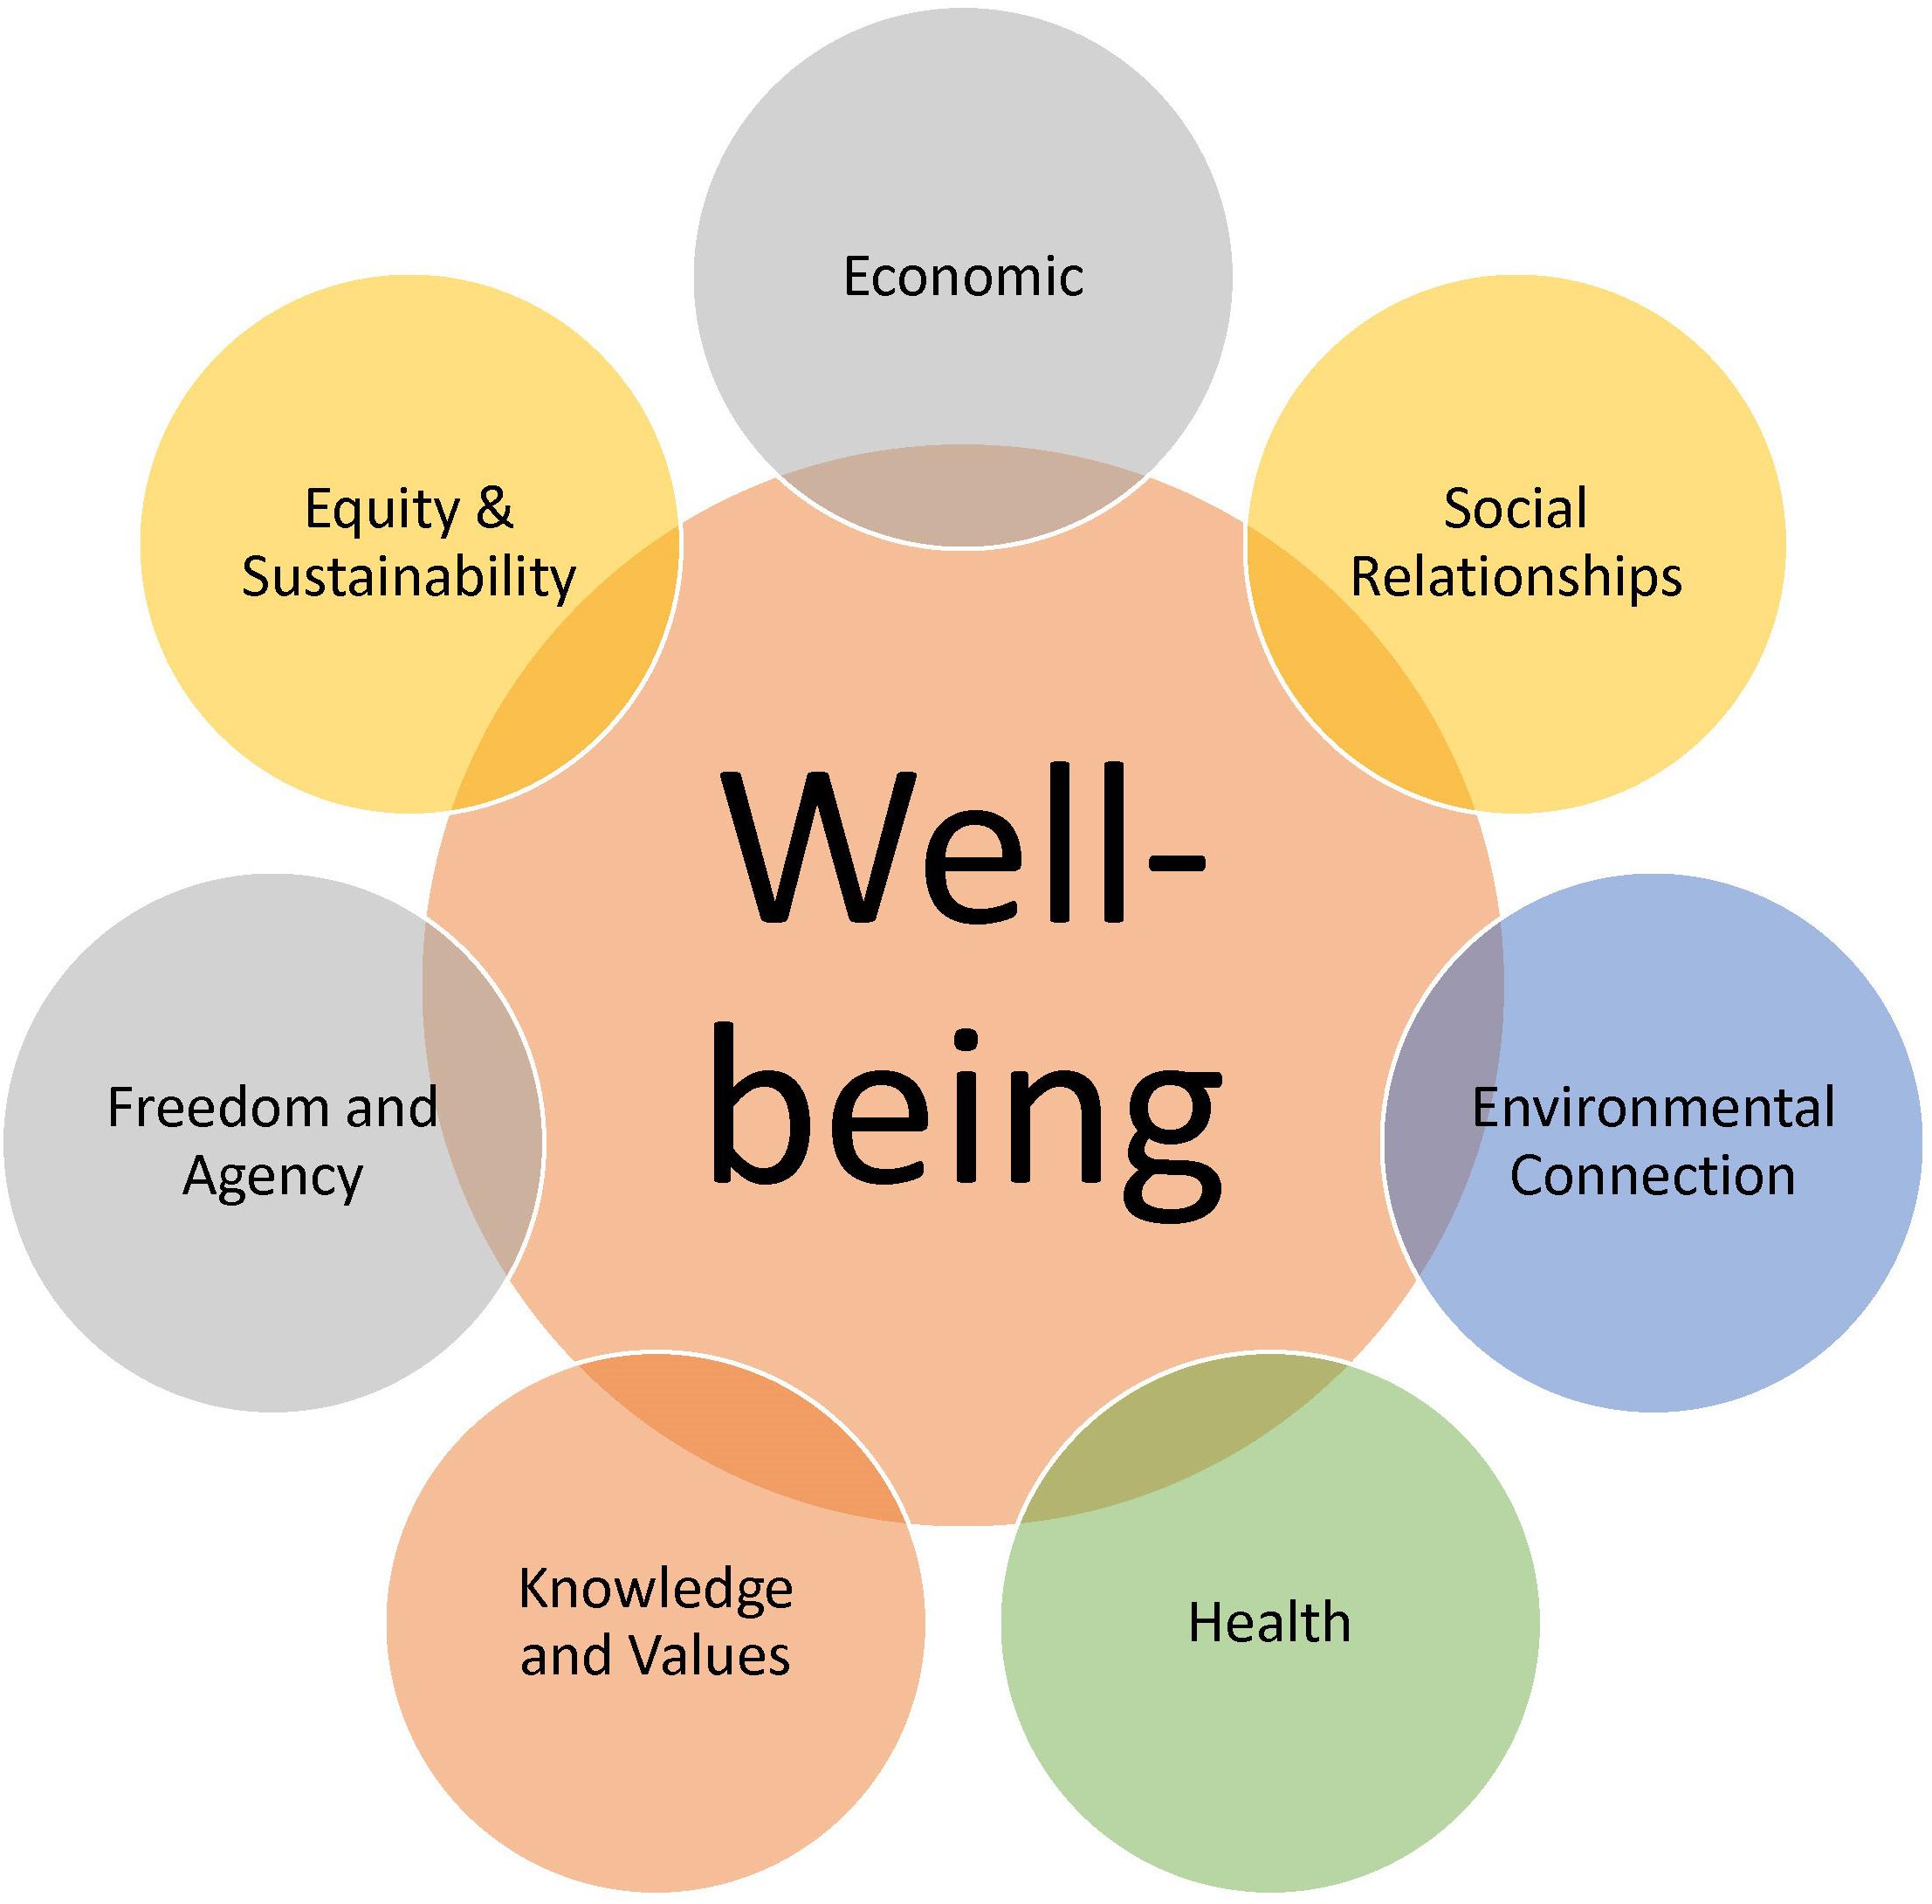
Figure 2. Elements of well-being that are explored in the QNMs of adaptive behaviors to small sablefish abundance and whale depredation.
The QNMs developed explore the impacts of each of the adaptive strategies described by stakeholders with respect to the elements shown in Figure 2 – social relationships, environmental connection, health, knowledge and values, freedom and agency, and equity and sustainability. Whereas the literature points to positive relationships between the well-being components denoted in Figure 2 and fisheries participation in Alaska (Szymkowiak and Kasperski, 2020), stakeholders described how small sablefish abundance and whale depredation undermine these well-being relationships, with expressed stress regarding these changes and their perceptions of their capacity to understand their marine environment. Similarly, the various adaptive strategies have had differing, often negative impacts across the well-being components, according to stakeholder interviews and as described in the literature (NPFMC, 2013, 2015, 2019a; Peterson and Carothers, 2013; Peterson et al., 2014; NPFMC/NMFS, 2016). Table 2 provides examples of quotes and the linkages that were derived from them to build the QNMs.
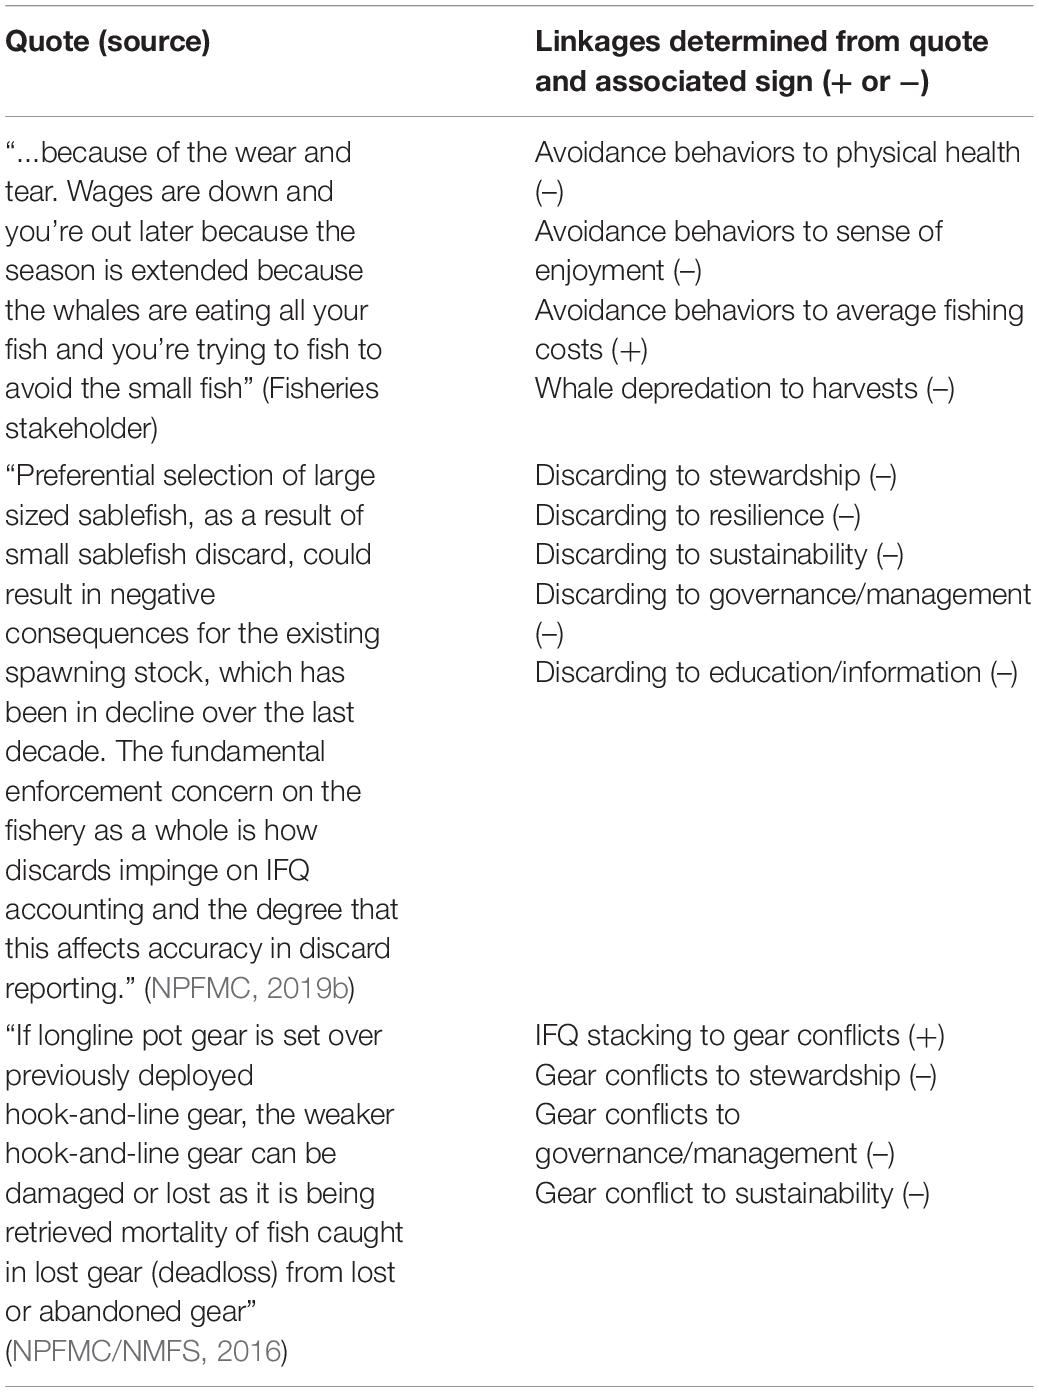
Table 2. Example quotes and the linkages derived from them to build QNMs.
In order to build the models we had to make simplistic assumptions about link directionality that masked the realities of heterogeneous linkages across diverse user groups. For example, leasing IFQs may have adverse implications for physical safety for lessees who have to harvest the quotas often under stressed conditions; but for the quota shareholder this can have positive effects on safety because they no longer have to go out to sea. This implies differing relationships between model variables and well-being components for these two user groups. However, the simplistic assumptions of QNMs preclude heterogeneity in link directionality so that divergent linkages cannot be included. Because the intent of this study is to examine the implications of adaptations on the spectrum of well-being and we did not specifically engage in discussions about the divergent application of adaptive strategies across different user groups. Only linkages specific to those who are actively participating in the fishery harvest were examined within our QNMs, omitting quota shareholders who are not directly participating.
In the instance where link directionality diverged between stakeholders and the literature, the link was excluded from the QNM. This was the case for the implications between pot gear usage and the size of fish harvested. Multiple stakeholders voiced concern that the use of pot gear actually results in the harvest of smaller fish than hook-and-line gear. However, scientists examining this potential relationship in the sablefish stock assessment did not find conclusive results in the relationship between pots and fish size (Hanselman et al., 2019). Therefore this relationship is not included in the QNMs.
The core of the QNMs is a simplistic relationship between the major components of fisheries participation. That participation or fishing effort results in harvests, which when coupled with prices determine gross revenues. Gross revenues are positively associated with livelihood and income security (the two economic components of well-being) while fishing costs, as determined by effort, have negative implications for the same variables. All five models were perturbed by increasing both small sablefish abundance and whale depredation simultaneously, which then triggers the adaptive strategies to examine how well-being components are affected. Because each model includes distinct adaptive strategies, the perturbation of small sablefish and whale depredation allows for examining how each of these adaptations will impact well-being.
The first model is the baseline model, which explores the effects of increased small sablefish abundance and whale depredation when fishermen are assumed to have no adaptive responses. Small sablefish abundance and whale depredation pull harvests in opposite directions because of how they affect the TAC, with the former providing for TAC increases due to positive stock implications and the latter driving it down as another source of mortality. Both of these ecological stressors also result in increased fishing costs due to damaged fish and the greater amount of time necessary to harvest quotas.
The following four models explore the effects of the diverse adaptive strategies on the components of well-being. In the short term, fishermen are expected to address the harvest of small fish by highgrading their catch. This is eventually coupled with avoidance behaviors (e.g., fishing deeper waters, setting shorter sets, increasing distances between sets) that, as discussed above, are differentially intended to avoid small sablefish and/or whales. In addition to direct well-being effects, these avoidance behaviors are also assumed to lead to increased non-target bycatch due to fishing in deeper waters; in turn, this bycatch has its own well-being implications. Similarly, in addition to their direct well-being effects, leasing IFQ and stacking IFQ on pot boats are associated with secondary impacts on gear conflicts, consolidation, lease fees and QS prices, which in turn have their own well-being implications. Leasing and stacking on pot boats are employed in addition to avoidance and highgrading, because none of the adaptive strategies are completely effective at mitigating harvests of small fish or whale depredation.
Figure 3 is the matrix representation of the linkages that are incorporated within the baseline, highgrading and avoidance behaviors QNMs, built from the stakeholder interviews and literature as described above. Supplementary Table 1 provides a breakdown of this matrix, describing the variables utilized, link direction, and the references; the Supplementary Material also depict the relationships in the baseline model using a flowchart (Supplementary Figure 1). The highgrading model builds on the baseline model and the avoidance behaviors model builds on the highrading model. In other words, the highgrading model includes all of the linkages within the baseline model as well as linkages specific to highgrading; the avoidance behaviors model includes all of the linkages within the highgrading and baseline models as well as linkages specific to the avoidance behaviors model. Each of the linkages within a model is demarcated with a square, which includes a positive or negative symbol that indicates the link direction. The colors of the squares denote which model(s) include the linkage. In general, well-being components are the terminal nodes in the models, comprising the majority of the variables on the x-axis; the exception to that is livelihood which appears on both axes because of its role in incentivizing fishing effort in the adaptive models. The leasing IFQ and stacking IFQ models include all of the linkages represented in Figure 3; the additional linkages included in each of these two models are provided in Figure 4, and also described in the Supplementary Table 1. As described above, leasing and stacking trigger other variables – gear conflicts, consolidation, lease fees, and QS prices – that in turn have their own impacts across well-being components.
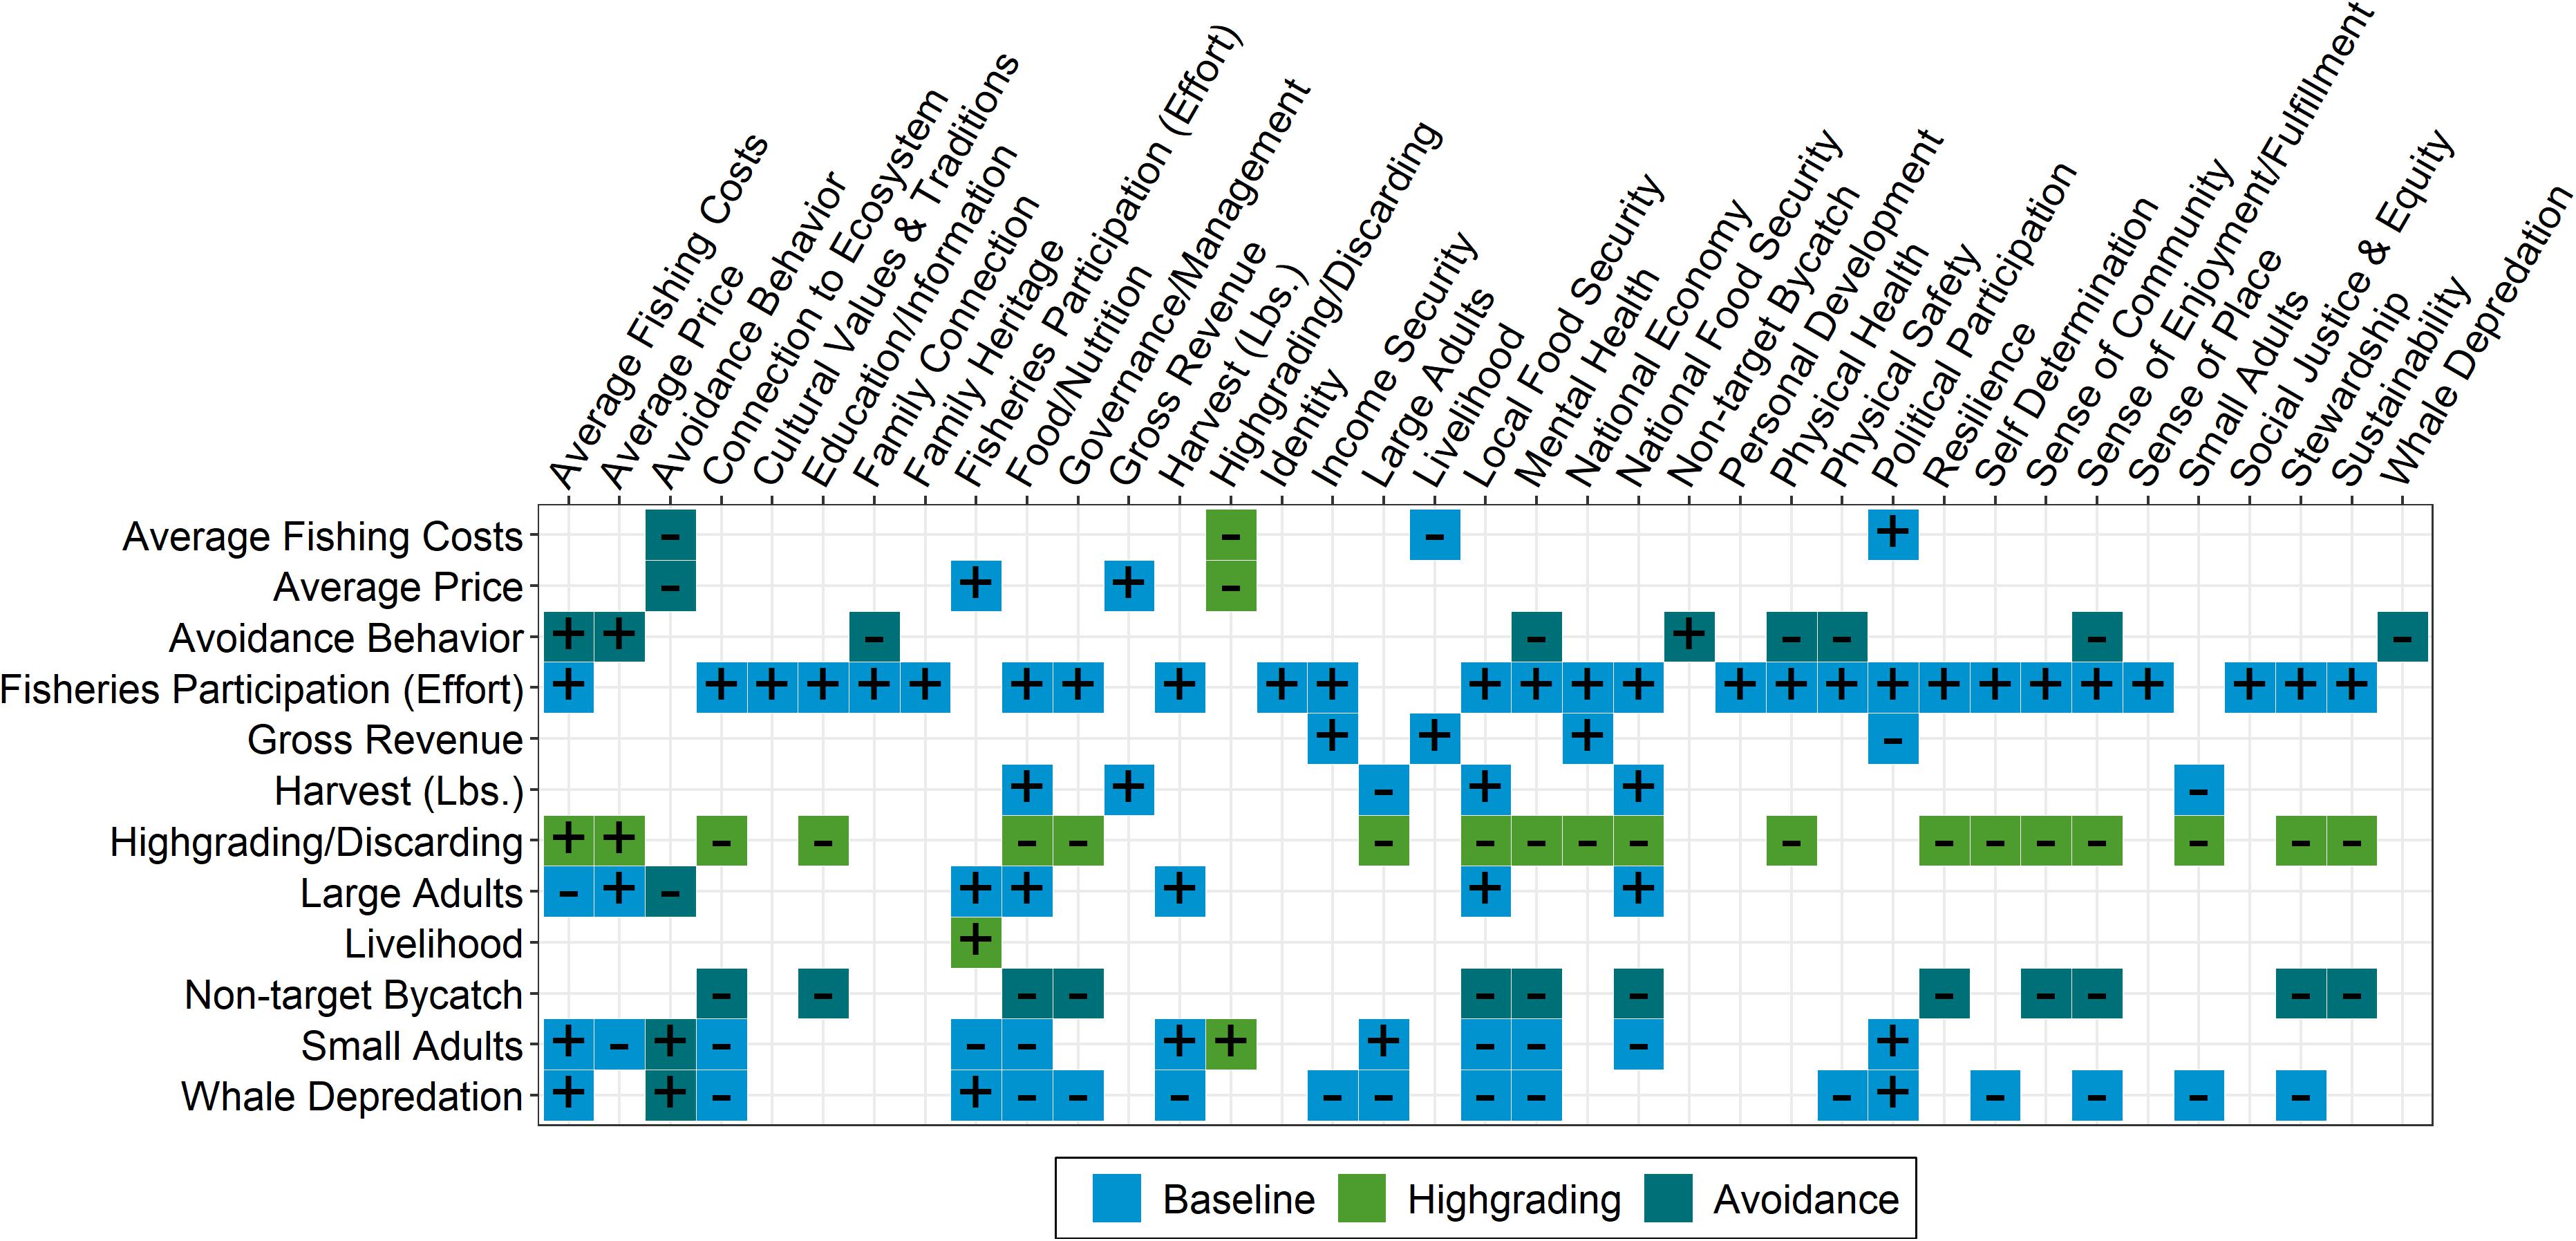
Figure 3. A matrix representation of the variable interactions obtained from the signed digraphs for the baseline, highgrading and avoidance QNMs, derived from stakeholder interviews and literature review. All variables have negative self-interaction (not shown). Symbols within squares indicate the link direction (+, –). Blue boxes indicate links specific to the baseline model, green boxes are specific to the highgrading models and teal boxes apply to the avoidance. Figure created with R package “ggplot2” (Wickham, 2016; R Core Team, 2019). The highgrading model includes all of the links in the baseline model; the avoidance model includes all of the links in the highgrading and baseline models.
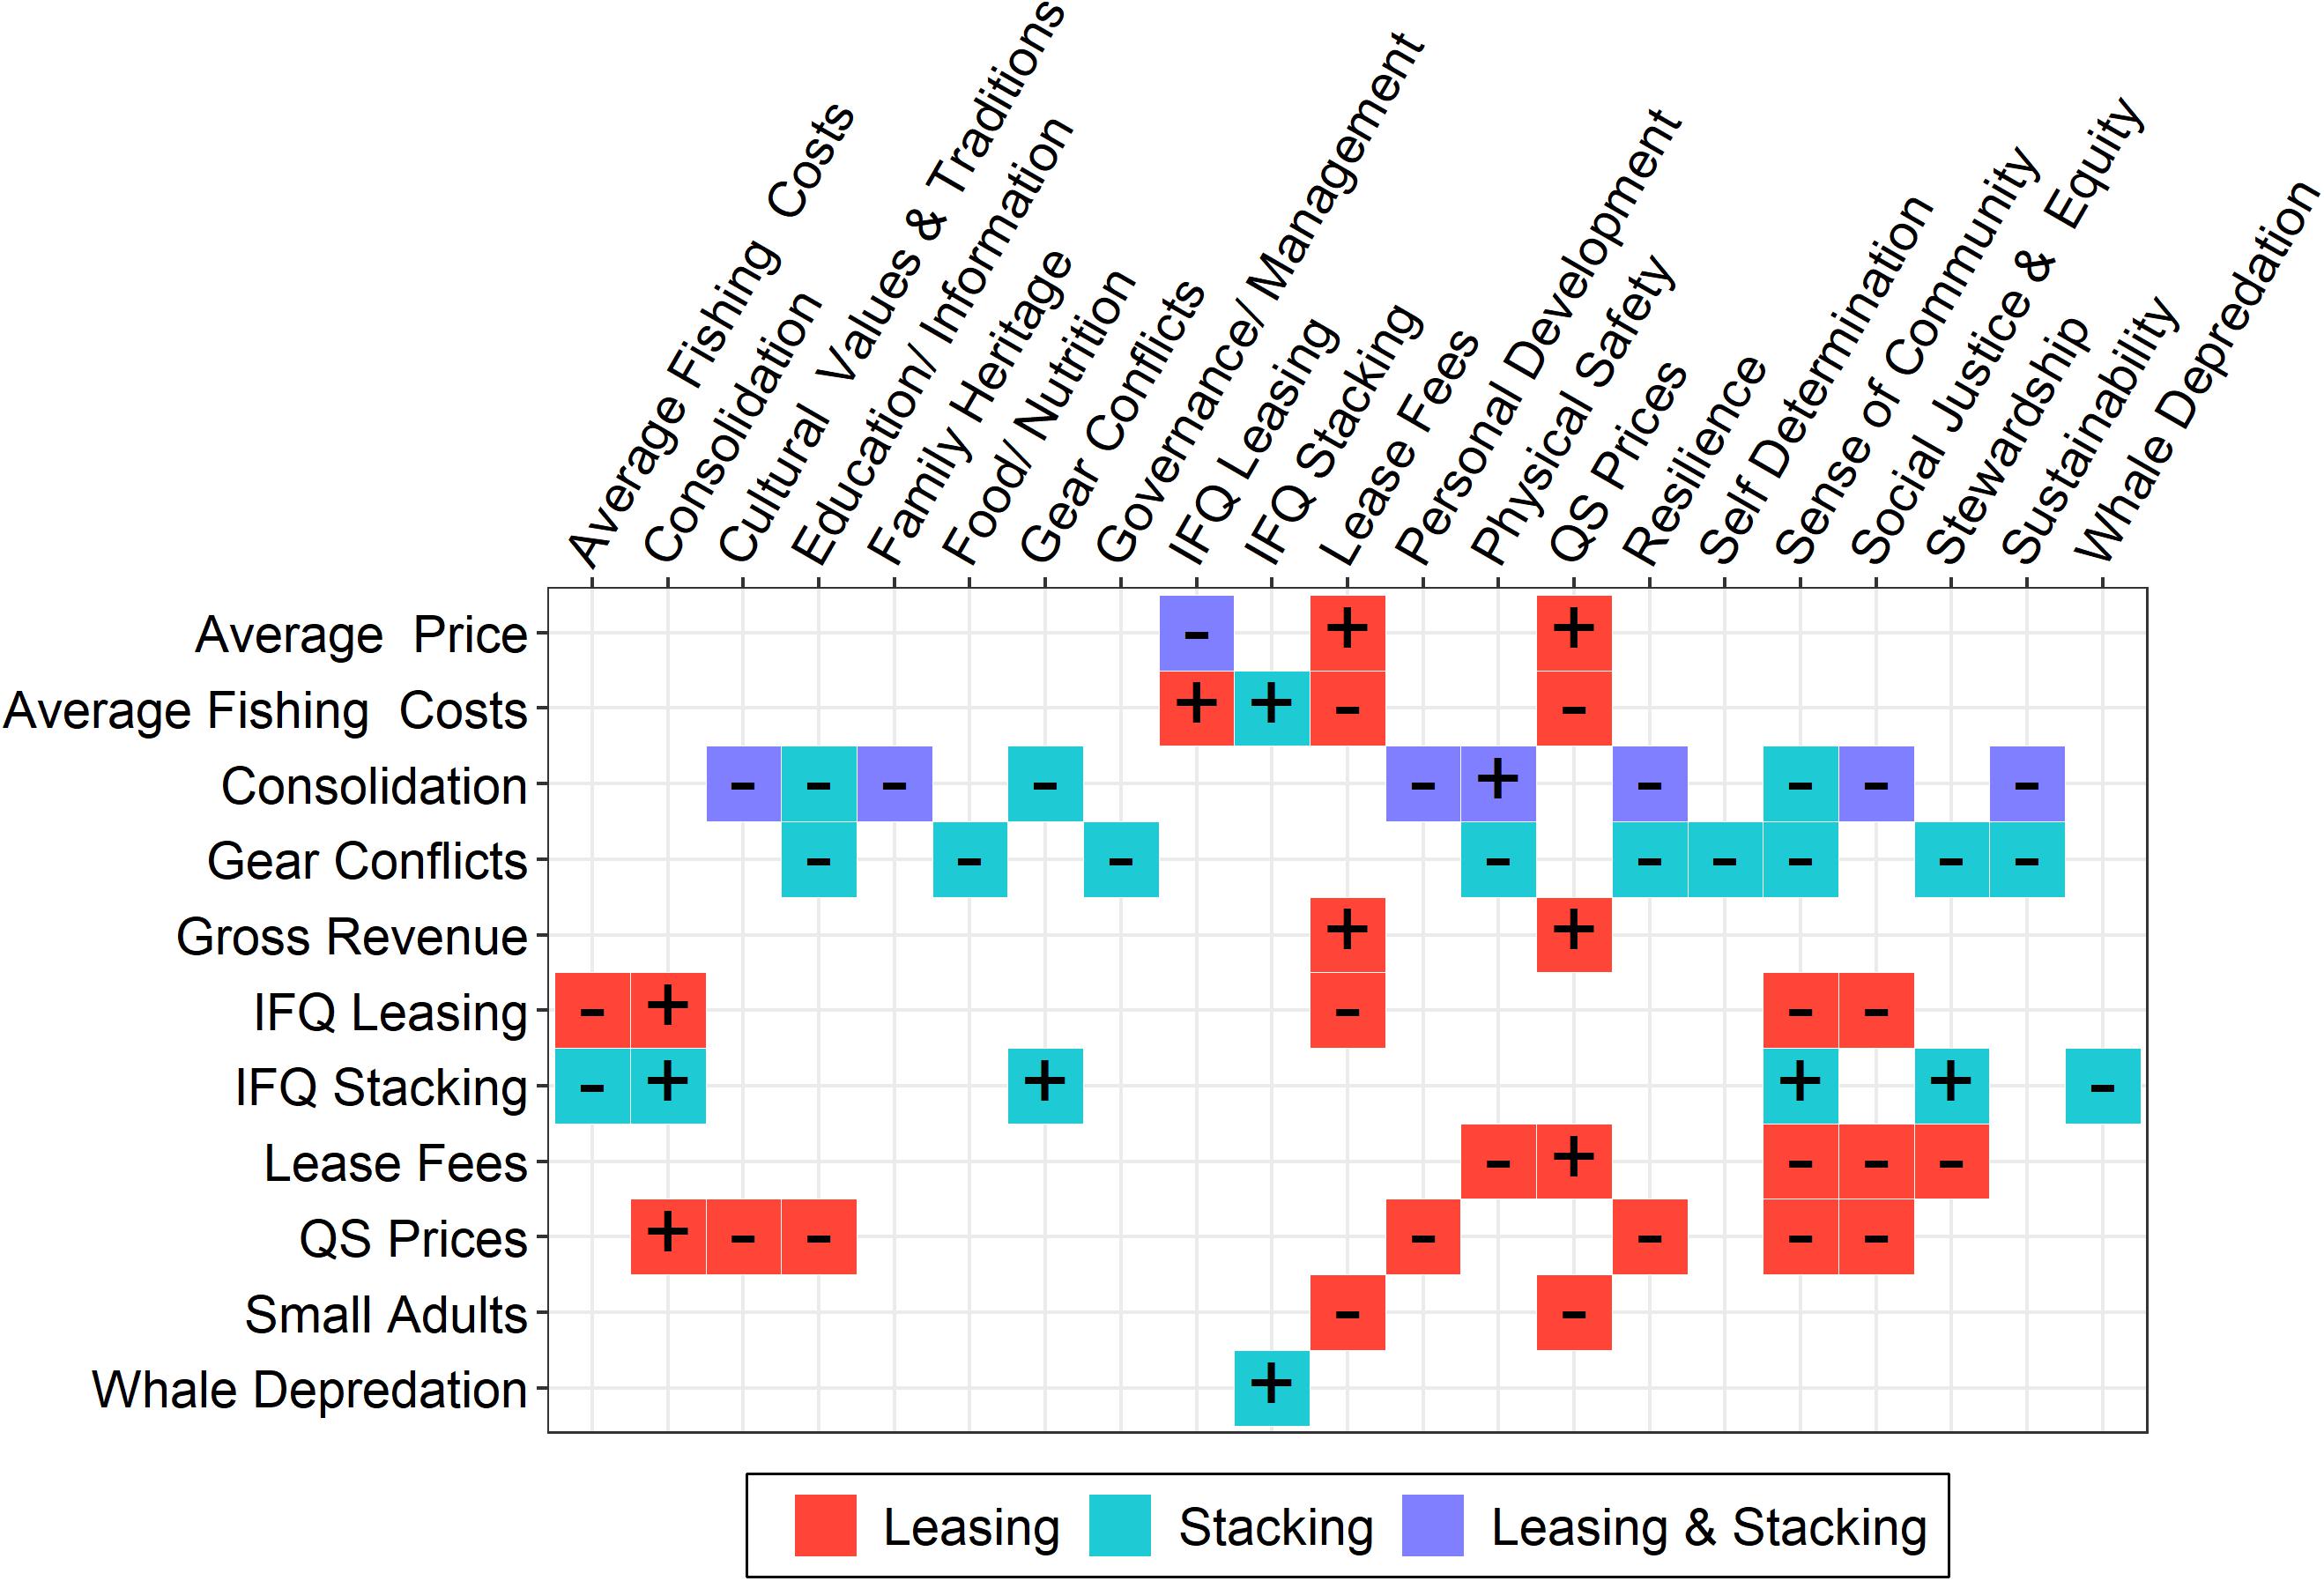
Figure 4. A matrix representation of the additional variable interactions obtained from the signed digraphs specific to the leasing and stacking IFQ QNMs, derived from stakeholder interviews and literature review. All variables have a negative self-interaction (not shown). Symbols within squares indicate the link direction (+, –). Red boxes indicate links specific to the leasing IFQ model, light blue boxes are specific to stacking IFQ model, and purple boxes indicate links that are shared by both models. Figure created with R package “ggplot2” (Wickham, 2016; R Core Team, 2019). The leasing and stacking IFQ models also include all of the linkages represented in the avoidance model.
The variable representing fisheries participation in these models does not respond directly to adaptive behaviors. Instead these behaviors are included as distinct variables in the model, with their own linkages and well-being effects. This is because QNMs preclude the inclusion of divergent relationships (positive and negative) for the same link. The variable representing fisheries participation has positive effects on well-being as described above, but under changed conditions and adaptive behaviors that participation is altered and undermines well-being outcomes. Therefore, there is a necessity for the inclusion of new variables to model the well-being impacts of each of the adaptive strategies within the QNMs. These adaptive strategies are incorporated as responses to changes in average fish prices or average fishing costs or both, as fishermen are essentially trying to attenuate profit declines from small and depredated fish.
Operationalizing the QNMs
In order to operationalize the QNMs, we began by building a sign directed graph in the diagram creation program Dia (ver. 0.97.2)1. The digraph is interpreted as a community matrix in the R package QPress (Melbourne-Thomas et al., 2012; R Core Team, 2019) with the community matrix elements corresponding to a variable interaction direction (→ = 1, • = −1, and no link = 0). Consistent with previous applications of QNMs, a negative self-interaction was applied to each variable to account for the assumed negative self-effects not included in the model as well as to enhance overall model stability (Raymond et al., 2011; Melbourne-Thomas et al., 2012).
The known link direction (positive and negative sign) is retained to create a simulated community matrix and the stability is tested against known stability criteria (see Melbourne-Thomas et al., 2012). The predicted response of the community to the perturbation is determined from the inverse of the stable matrices retained. This process is repeated for 10,000 simulations and the results are summarized and expressed as the probability of occurrence with the impact from the perturbation readily assessed for each variable across the stable matrices. A predicted response was assumed to have high sign consistency and therefore high sign determinacy when ≥ 70% of the responses were positive or negative, with those falling between 30 and 70% having an indeterminate sign response and considered equivocal (Melbourne-Thomas et al., 2012; Reum et al., 2015).
Results and Discussion
The extent to which adaptation strategies are being employed in the sablefish fishery is explored within section “Examining adaptive strategies with quantitative indicators.” In turn, understanding the utilization of strategies provides information on the relevance of the well-being effects for each of the adaptive QNMs that are described in section “Understanding the well-being effects of adaptations.” Finally the well-being effects delineated through the QNMs are explored with quantitative indicators in section “Examining QNM results with indicators.”
Examining Adaptive Strategies With Quantitative Indicators
In this section quantitative indicators are employed to examine the application of various adaptive strategies. Figure 5 represents the annual sablefish discard rate in terms of the percent of the number of fish that are discarded relative to total harvests in the sablefish IFQ fleet. The figure demonstrates an increase in discarding in 2019 aligned with stakeholder interviews indicating that “a fair amount of highgrading is happening on the grounds, despite sablefish being mandatory retention.” This lagged response may reflect declining prices across all size categories and the substantial increase in the price differential between small and large fish that occurred in 2018 (NPFMC, 2018). The lack of a visible increase beginning in 2017 when the small fish began to substantially contribute to the harvestable biomass may be due to smaller price differentials at that time and higher prices overall (Fissel et al., 2019). The increase in discards is further attributed to the rise of pot gear vessels in the fishery – a response to whale depredation that is explored below - because these boats account for the majority of discards.
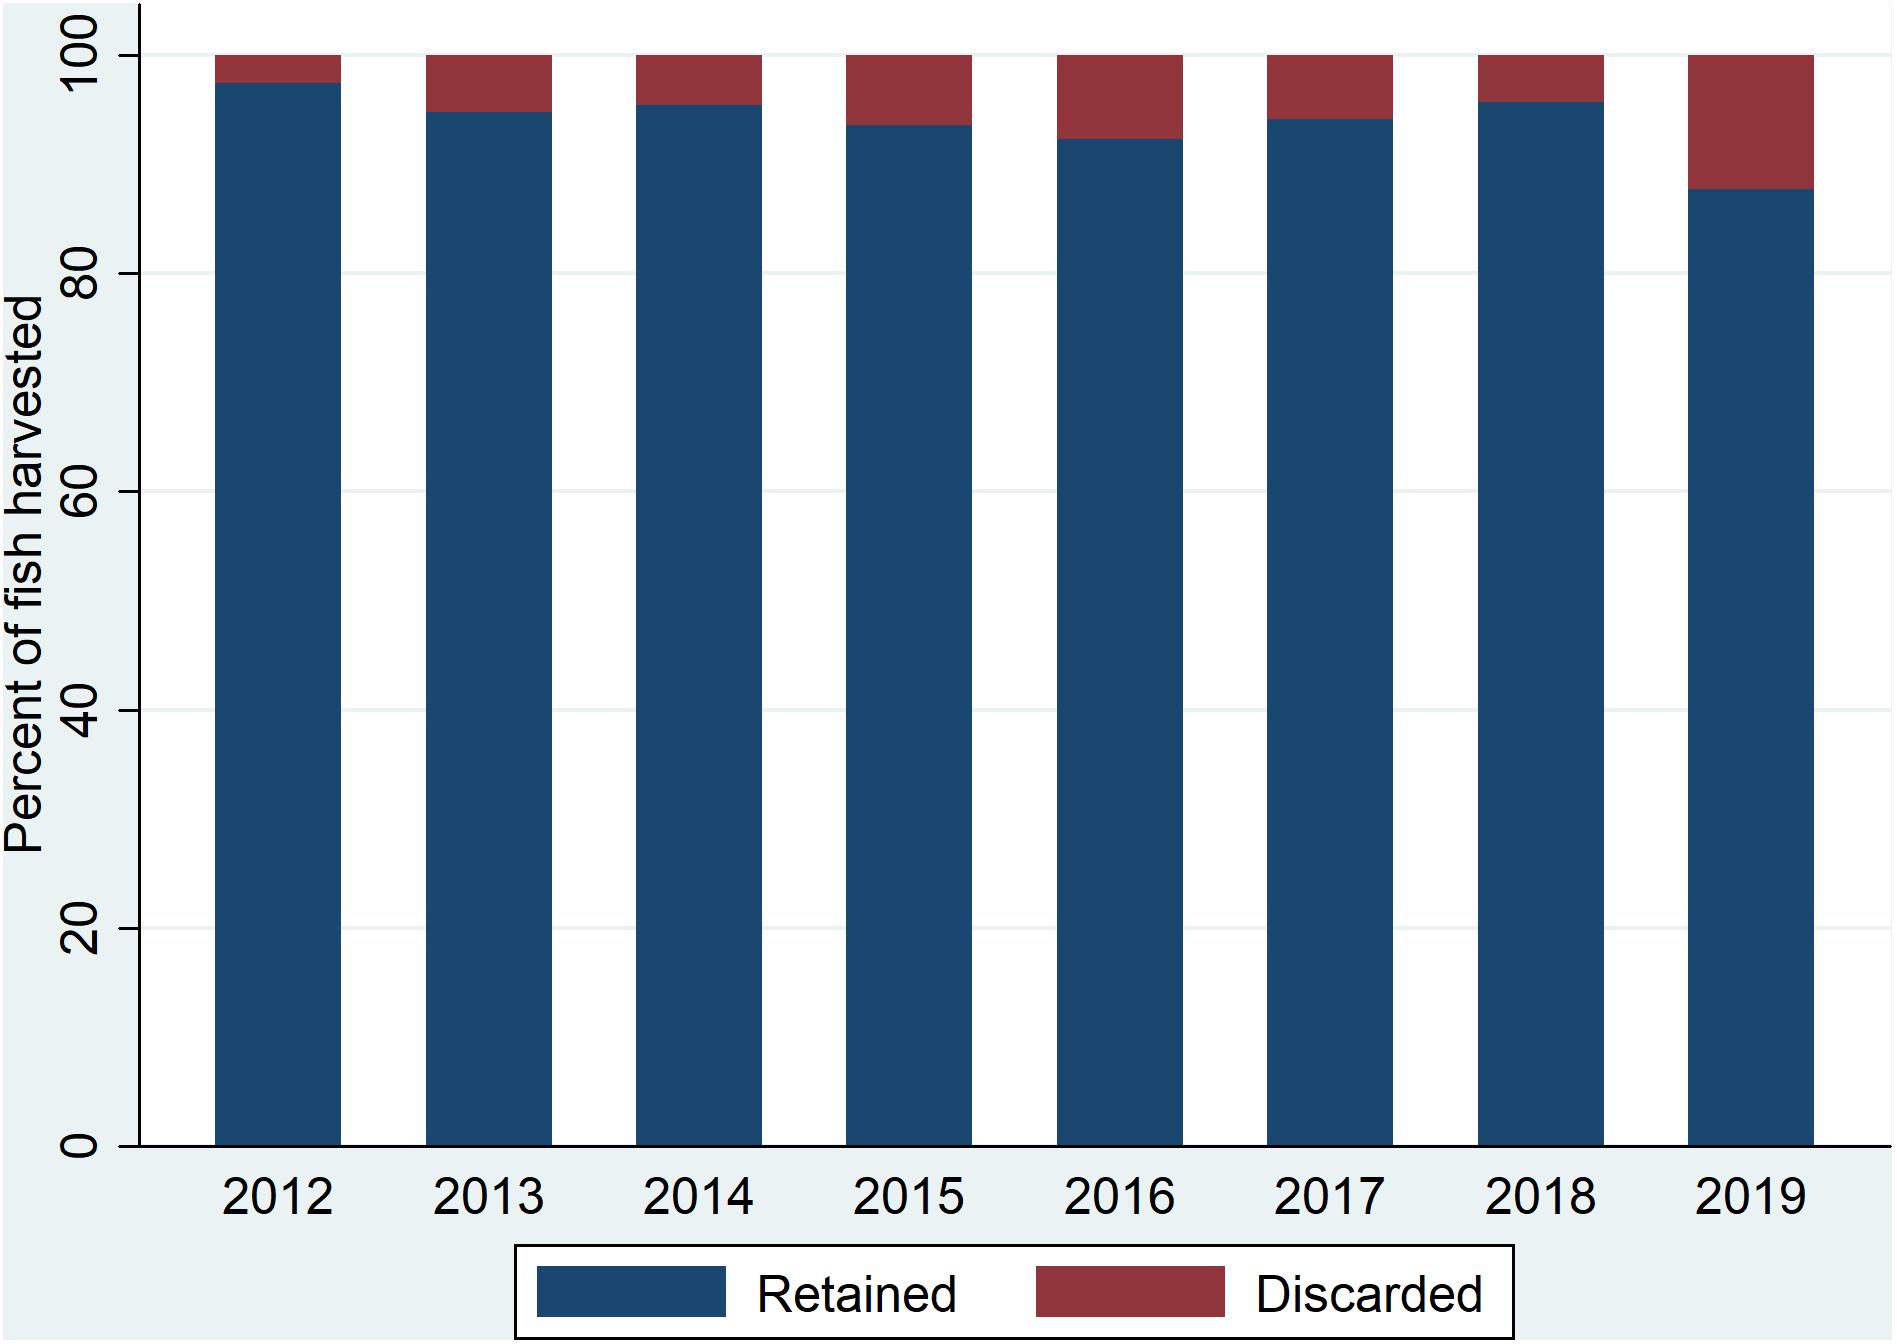
Figure 5. Sablefish discard rates for the sablefish IFQ fleet in terms of the percent of the number of fish that are discarded, based on observer and electronic monitoring data.
The annual average season length for vessels in the sablefish IFQ fleet demonstrates a statistically significant (at the 0.0% level) increasing trend of 1.2 days per year from 2006 to 2019, as well as a marked increase in the average season length beginning in 2017 evident in the LOWESS curve (Figure 6A). Thus average season length is aligned with expectations of the effects of current ecological conditions and changing behaviors leading to more time on the water. Concurrently, average daily harvests (Figure 6B) have been decreasing significantly (at the 0.0% level) at a rate of 58 pounds a year, aligned with CPUE trends for the sablefish IFQ fishery noted in the stock assessment (Hanselman et al., 2019). In fact, the correlation coefficient for the average season length and daily harvest (0.81) indicates a strong relationship between these two variables demonstrating that the fleet has been experiencing reduced efficiencies contributing to prolonged fishing seasons over the time series.
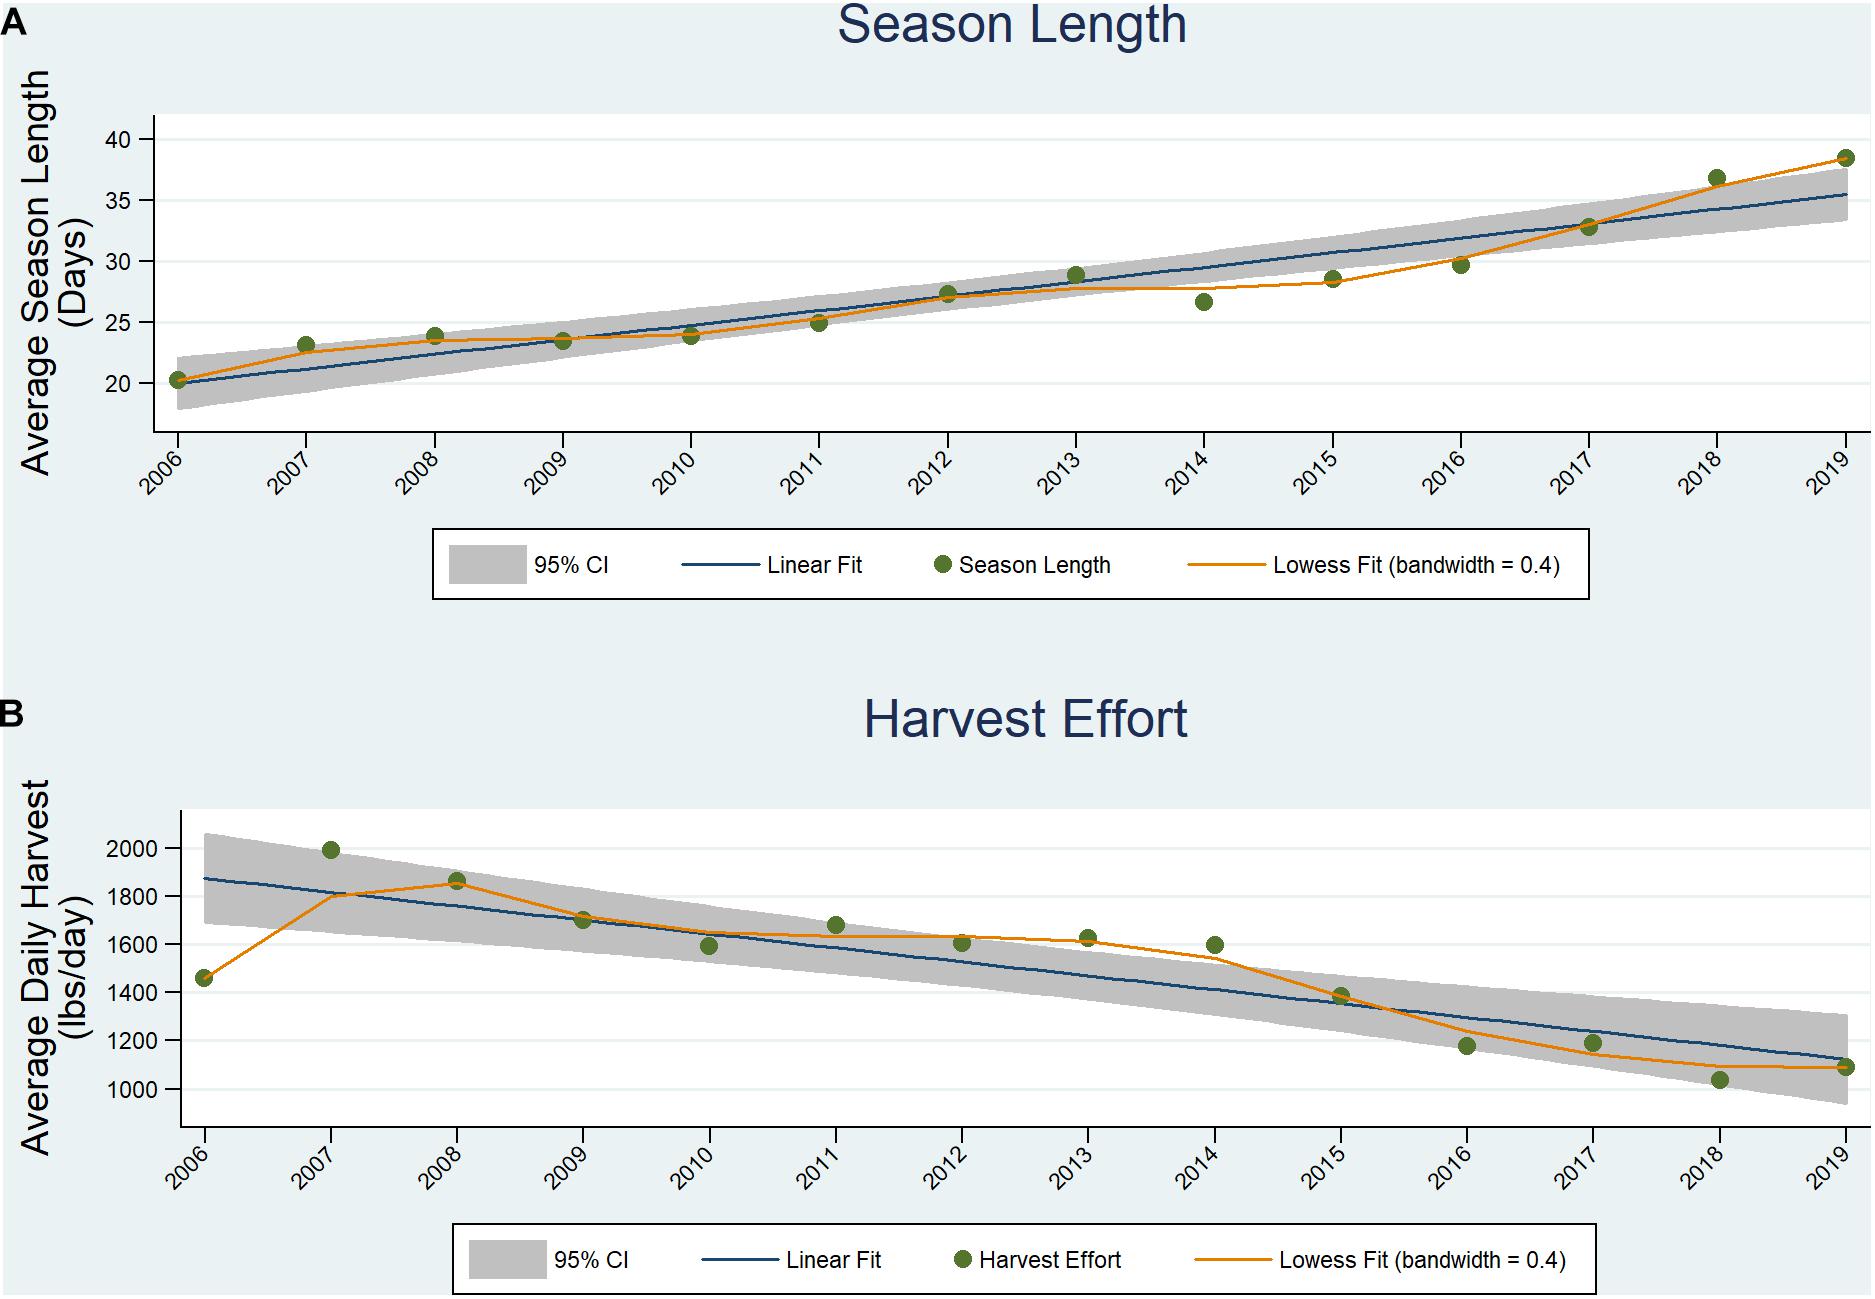
Figure 6. Average season length in days (A) and average catch per day in pounds (B) for sablefish IFQ vessels. Figure includes the linear fit line and the 95% confidence interval around that line and the LOWESS fit curve calculated using a 0.4 bandwidth.
The influx of juveniles is exacerbated by the rapid decline of older fish over the last several years, resulting in fewer big fish to target among the inundation of small fish (Hanselman et al., 2019). Yet the LOWESS curve demonstrates that the rate of the decline of daily harvests has actually decreased over the last several years, with slight increases in harvest rates in 2017 relative to 2016 and 2019 relative to 2018. Thus despite overall evidence of declining harvest rates for the fleet, the last several years of data do not point to adverse effects of avoidance strategies on these rates. However in part this may be attributed to fishermen “dropping out” and leaving their quota un-fished as evidenced in 2018 and 2019 when approximately 82% of the quota was harvested, compared to 90% for all the previous years of the IFQ Program (NMFS, 2020). The differential shifts in the two trendlines in Figure 6 since 2017 point to the potential that other drivers in addition to reduced daily harvests are contributing to increasing seasons in the fishery over the last several years, although a longer time series and a more robust analysis would be needed to fully examine the reasons for these changes.
Figure 7A does not indicate increased leasing in response to small sablefish and whale depredation (Figure 7A). Instead leasing has been declining since 2014 likely in response to regulatory measures that were implemented at the time to limit the use of hired masters in the fishery (Szymkowiak and Himes-Cornell, 2017). It should be noted that although emergency leasing has historically not accounted for a large portion of landed pounds in the sablefish IFQ fishery (NPFMC/NMFS, 2016), changing ecological conditions may be driving the increasing use of this lease provision, which is not captured in our data. In contrast to hired master use, quota stacking on pot boats has generally been increasing over the last several years (Figure 7B), aligned with expectations that it serves as a strategy to avoid whale depredation. The increase is demonstrable starting in 2017, when the amendment allowing the use of longline pot gear in the Gulf of Alaska sablefish IFQ fishery was implemented.
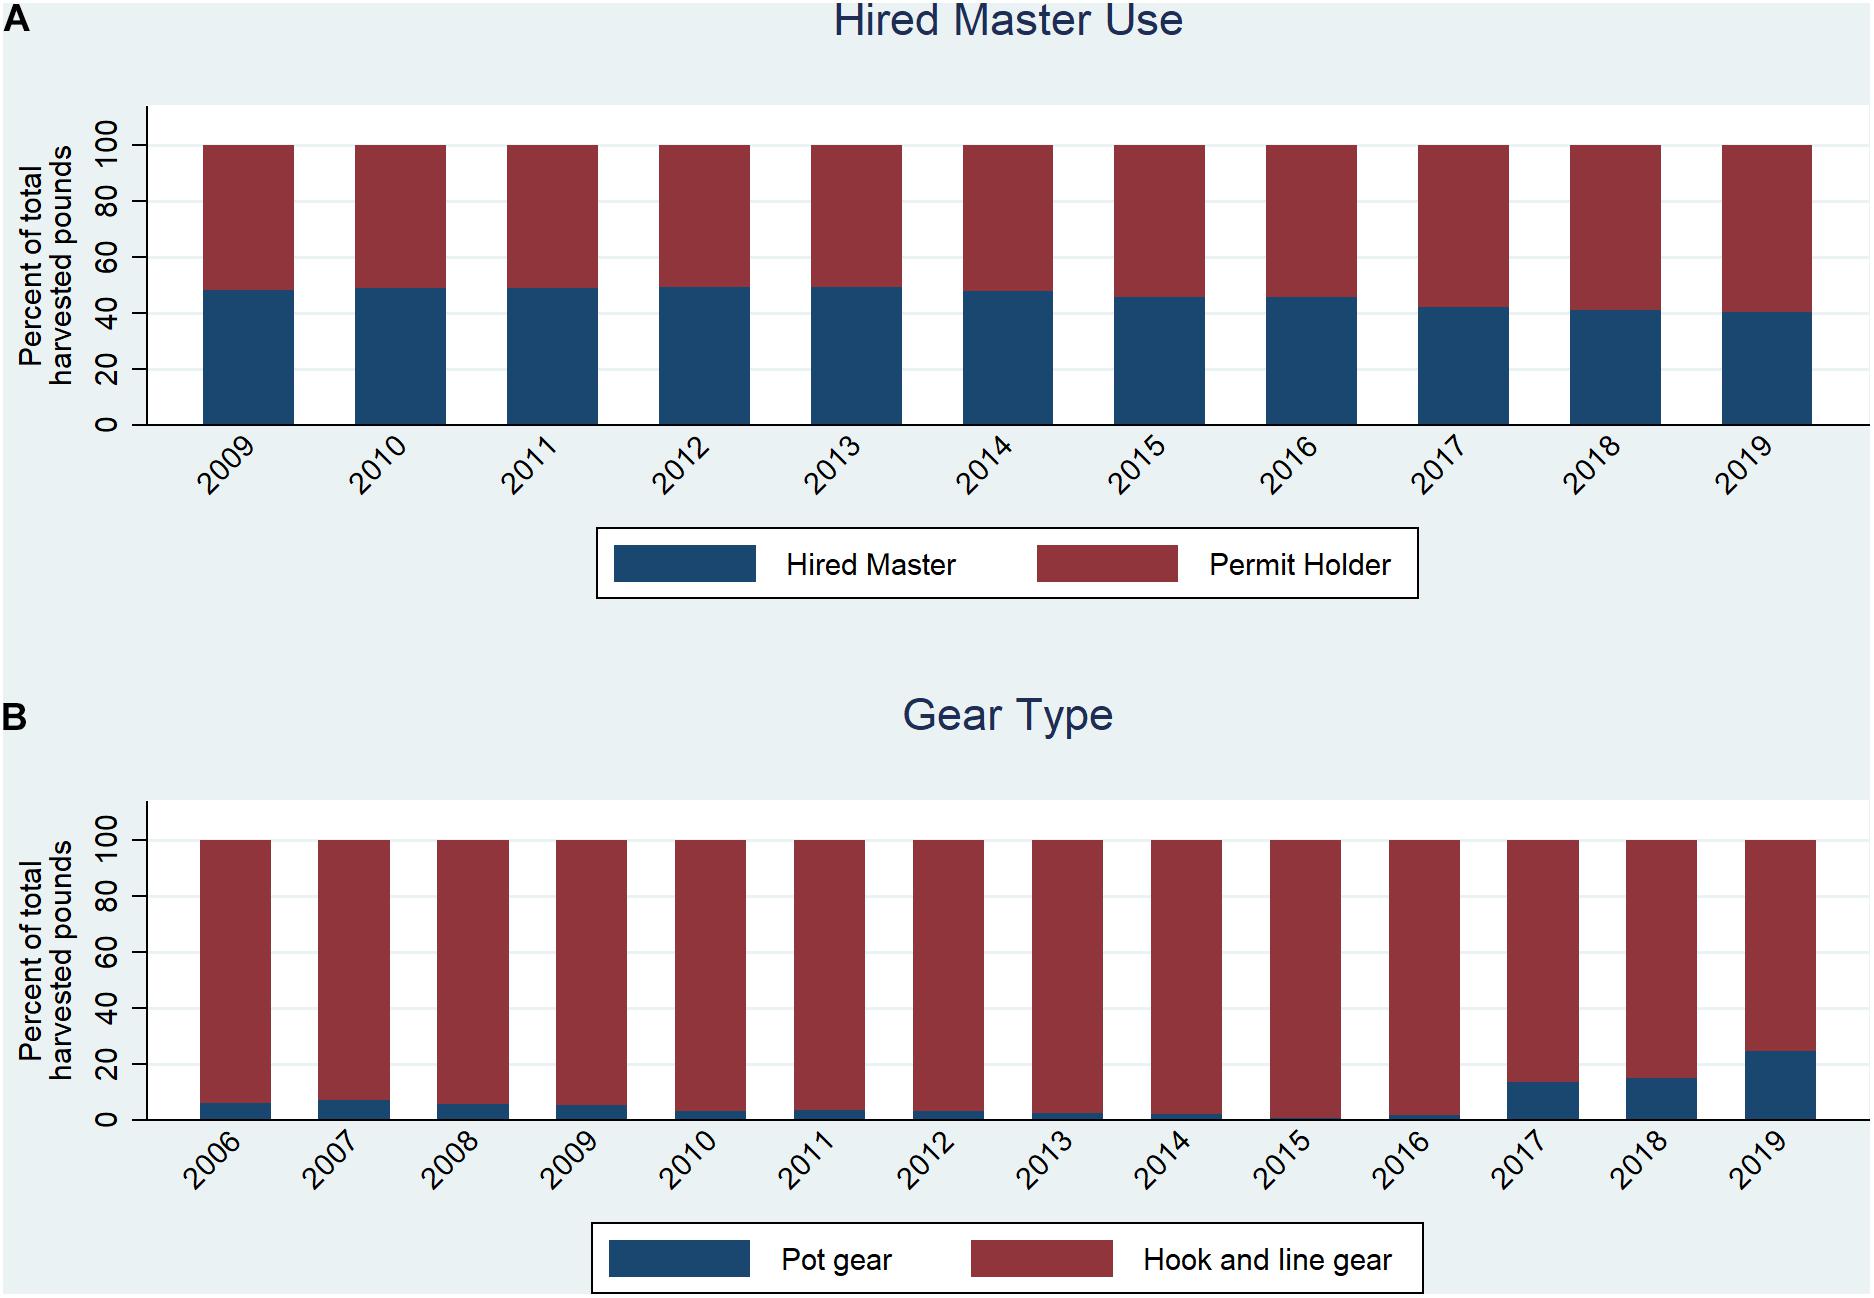
Figure 7. Percent of IFQ sablefish landed by permit holders and hired masters (A) and percent of IFQ sablefish landed by gear type (B).
Understanding the Well-Being Effects of Adaptations
The multi-faceted components of well-being are explored using the adaptive strategies that were evidenced by the quantitative indicators above. With the exception of leasing, the indicators in Section “Examining adaptive strategies with quantitative indicators” point to some increase in the adaptive strategies that were enumerated by stakeholders, most prominently highgrading and stacking IFQ. Although the response is not apparent for leasing and may not be readily distinguishable from other drivers with the season duration and daily harvest indicators, the QNM results of all four adaptive strategies are explored within this section. The well-being outcomes of strategies that are not being employed are also important to consider, as policymakers can promote strategies given their intended suite of outcomes.
In the baseline model, small adult sablefish and whale depredation are both positively perturbed and fishermen do not undertake any adaptive behaviors (Figure 8). Increasing numbers of small fish and whale depredation lead to decreasing dockside fish prices. Concurrently they increase the costs of fishing because fishermen have to spend more time harvesting in order to catch their full quota leading to greater expenditures on things like bait, fuel, and crew expenses. The coupling of lower prices and increased fishing costs diminish incentives for fishing leading to reduced harvests. This effect is manifest in declining percentages of the TAC being harvested in the fishery over the last several years (NMFS, 2020). Gross revenues decline as both prices and harvests fall leading to negative responses in livelihood and income security.
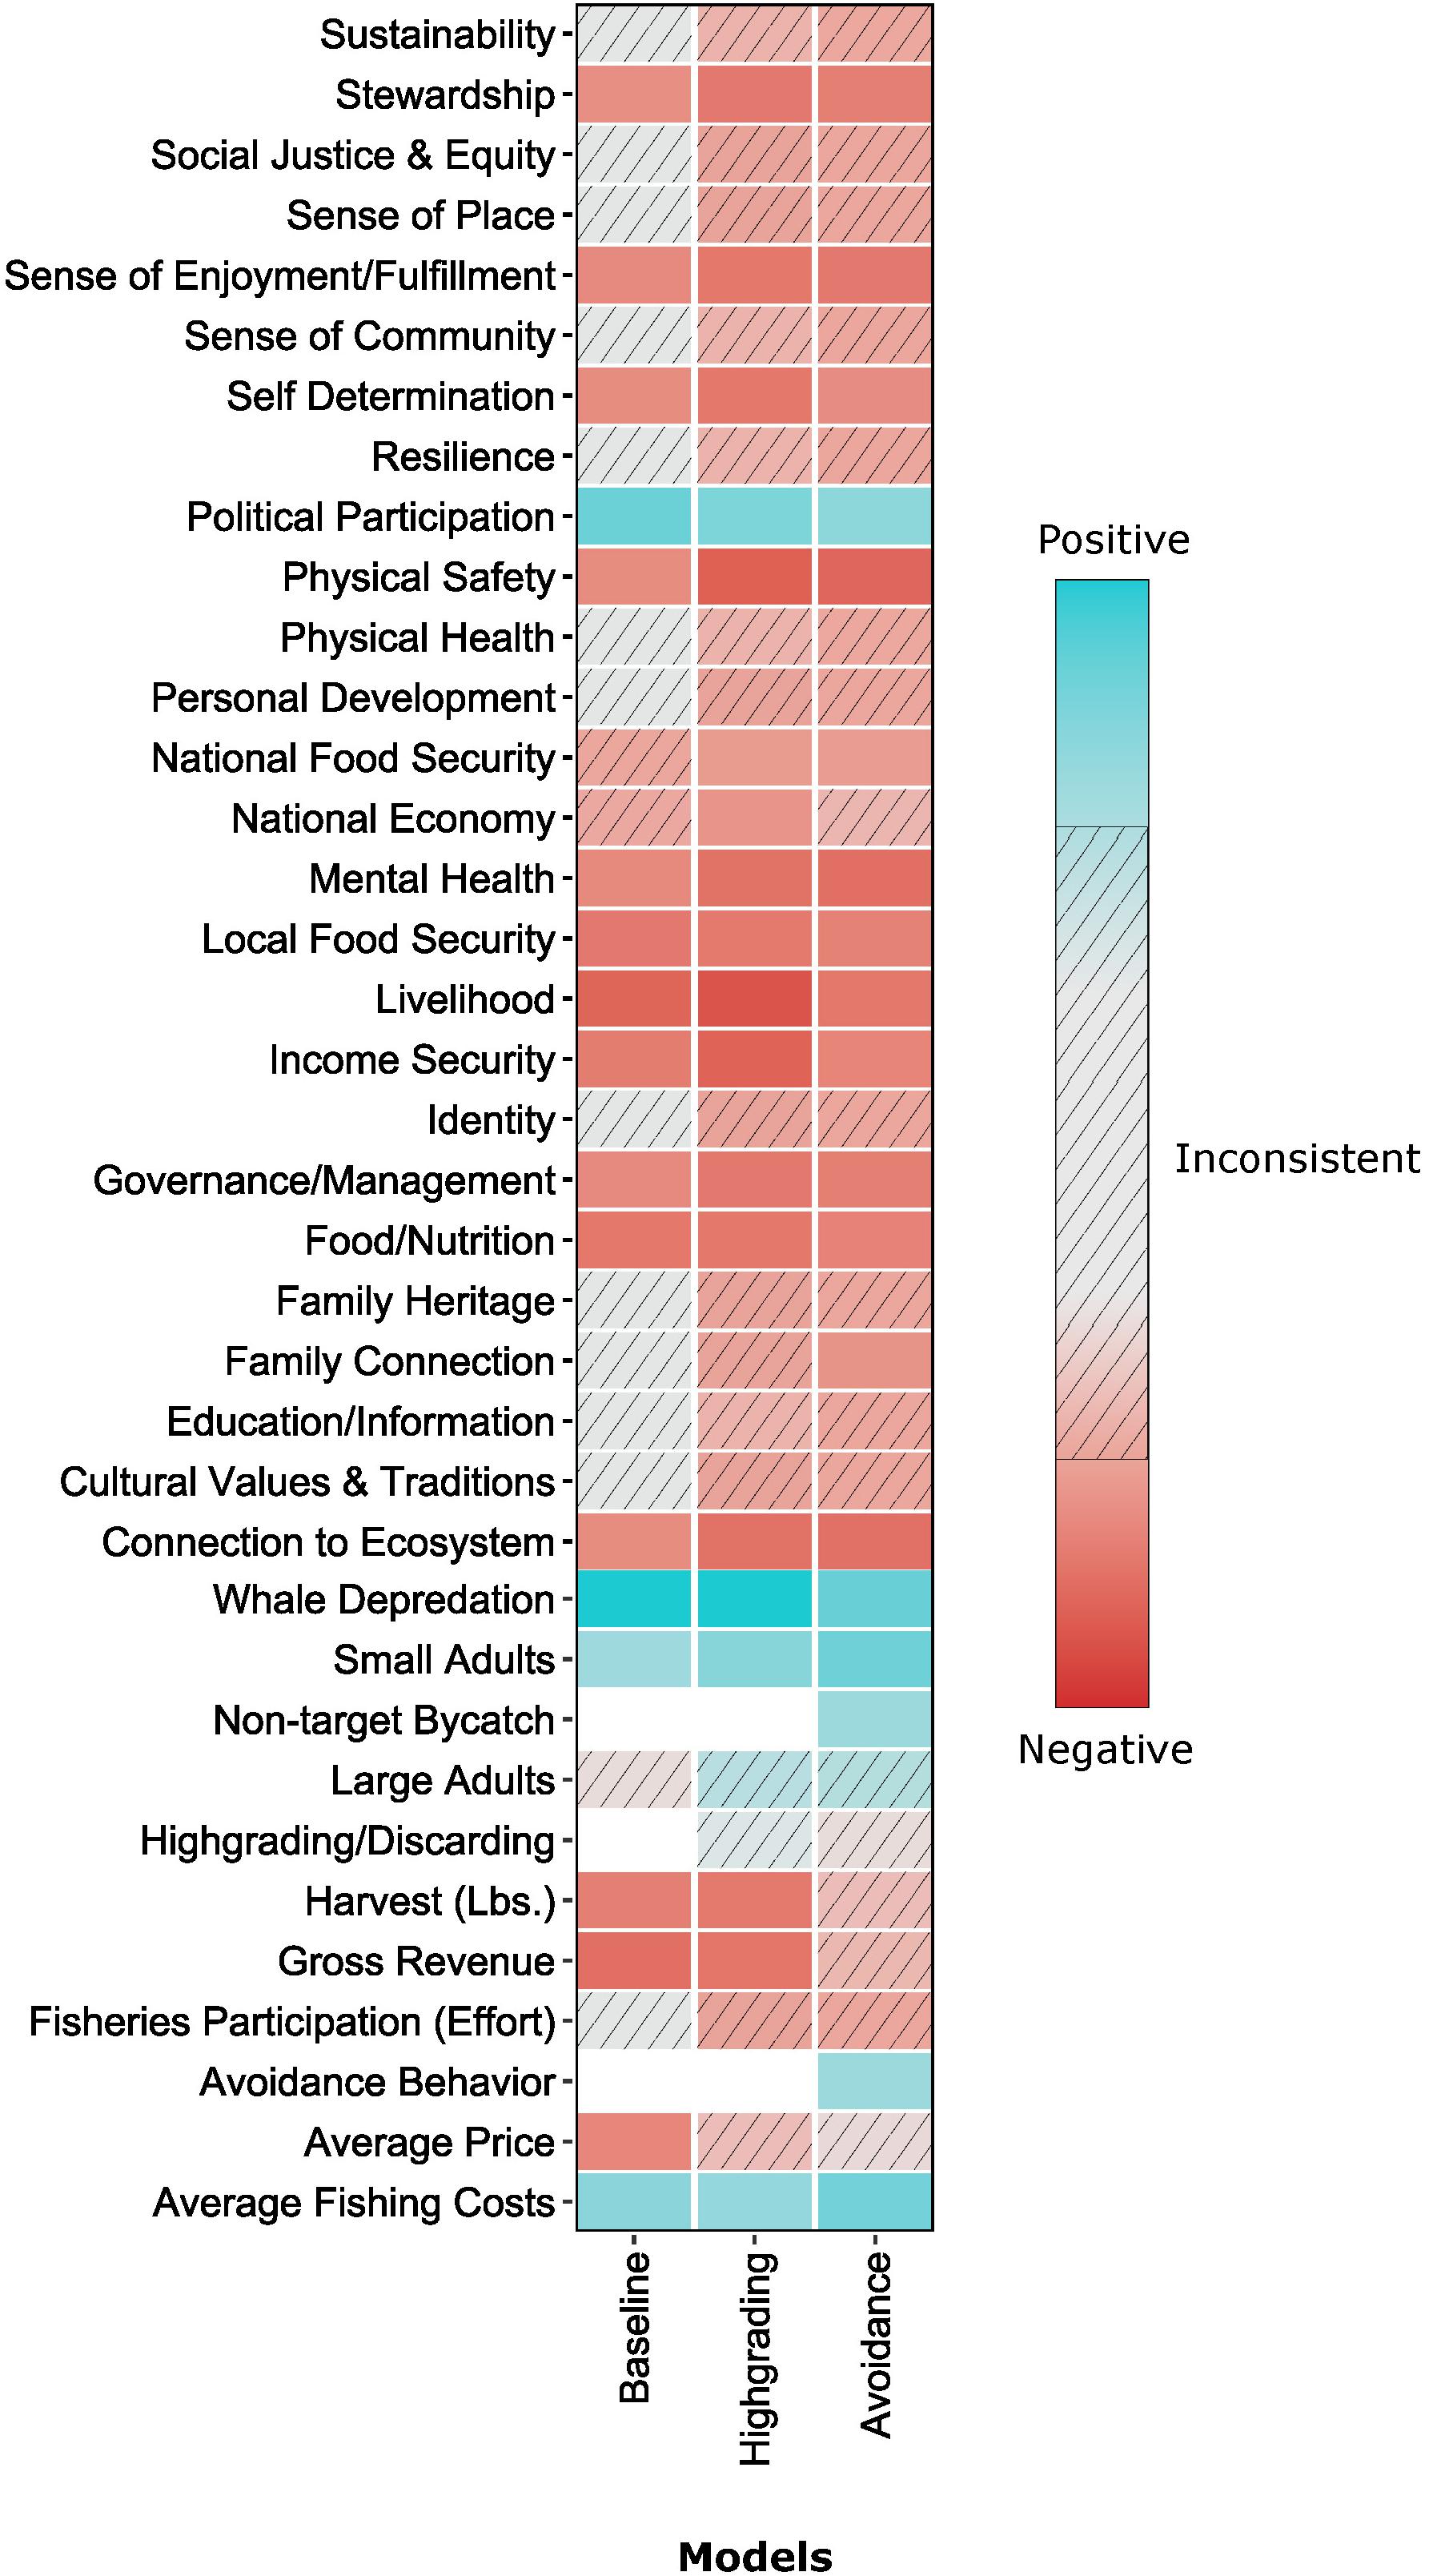
Figure 8. Results from 10,000 simulations to a positive perturbation in small adults and whale depredation for the baseline highgrading, and avoidance behaviors models. The squares indicate the probability of a positive (blue) or negative (red) response of the variables (y-axis) within each model (x-axis). Shading increase corresponds with an increase in sign consistency and the textured squares represent inconsistent results that are less than the 70% cutoff. Figure created with R package “ggplot2” (Wickham, 2016; R Core Team, 2019).
In addition to adverse economic effects in the baseline model, increasing numbers of small adults and whale depredation lead to negative impacts across a number of other well-being components. As fishermen observe a changing ecosystem, they experience declines in their connection to the ecosystem and mental health, self determination, stewardship, and sense of enjoyment and fulfillment. The availability of food declines with the preponderance of small fish and whale depredation, which also adversely affect short term food security. The unprecedented ecological conditions that led to the large sablefish recruitment class along with continued whale depredation imply increasing uncertainties in the stock assessment, reflected in a negative result for governance. Seasonal prolongation has negative implications for family connection and physical safety due to fatigue. Physical safety is also adversely affected by depredating whales, which can be hazardous. The totality of these effects also implies increasing political participation as fishermen advocate for increased flexibilities in response to revenue declines. This has been demonstrable in the North Pacific fisheries management process with fishermen seeking flexibilities for the use of pot gear to target sablefish as well as the elimination of the prohibition on discarding of small fish (NPFMC, 2013, 2018).
Figure 8 demonstrates the results when fishermen respond to whale depredation and small fish abundance in the highgrading model (8) and in the avoidance behaviors model (8). Because the intent of highgrading is to retain larger sized fish to receive a higher dockside price, there is no longer a consistently negative effect on average prices. However, highgrading is unlikely to actually ameliorate harvests of small fish due to continued overabundance of them, as denoted by an inconsistent result for average prices. Positive effects on average fishing costs continue as discarding implies the use of extra bait, fuel, and labor to harvest quotas. Coupled with continued negative effects on harvests, gross revenues have consistently negative effects, with resultant negative implications for livelihood and income security.
In addition to the negative effects on various well-being components from small sablefish abundance and whale depredation, highgrading undermines the well-being that fishermen derive from fisheries participation. The prolongation of the fishing season under the baseline scenario is compounded by fishermen having to spend more time on the water due to highgrading, with continued negative implications for family connection as well as physical safety. Further negative impacts on a variety of well-being components result from fishermen experiencing a dissolution from their sense of self and way of life due to highgrading, with adverse implications for identity, personal development, and family heritage. The notion that fishermen are highgrading their catch can also lead to an erosion of other community members’ perceptions of the role of fishermen in their community with negative effects on cultural values and traditions and sense of community. Highgrading also negatively impacts the national economy and national food security as it results in fish mortality that does not enter the food system. Since it is unobserved, highgrading also has adverse implications for stewardship and the information necessary to effectively manage the resource.
In the avoidance behaviors model, the coupling of highgrading with avoidance leads to inconsistent results for fish prices and harvests and gross revenues as well (Figure 8). Some of the negative effects on well-being components become less consistent as avoiding small fish and whales is a strategy to mitigate not only revenue declines but discarding as well. Although examination of the season length and daily harvest indicators above did not indicate that avoidance behaviors are necessarily prolonging fishing seasons, stakeholder accounts did indicate more time on the water due to this strategy, which is reflected in negative results for family connection, sense of enjoyment/fulfillment, and physical safety. Adverse effects on physical safety are also associated with fishing in new waters and moving around more on the water. Some fishermen also noted that the strategy of fishing in deeper waters results in bycatch of non-target species, an effect that is captured in the positive results in “non-target bycatch” in Figure 8.
Stakeholders indicated that because highgrading and avoidance behaviors do not completely mitigate adverse effects on gross revenues, fishermen also employ leasing and stacking IFQ strategies, the well-being effects of which are explored in Figure 9. In the leasing IFQ model, new variables are added to account for relationships that do not exist in the highgrading and avoidance behaviors models, Figure 9. Low earnings expectations associated with small fish and whale depredation have, according to fishermen, resulted in decreased lease fees and QS prices - a relationship that is aligned with economic theory (Anderson and Seijo, 2010; Szymkowiak and Felthoven, 2016). Lease fees are the amount paid by the fisherman to the QS holder for the harvest of their IFQ, usually calculated in terms of the percent of the total ex-vessel revenues (NPFMC/NMFS, 2016). In turn, the declining lease fees and QS prices can lead to positive well-being outcomes, by essentially mitigating the adverse effects that have been associated with high lease fees and QS prices. In particular, rising QS prices were associated in the 20-year review of the IFQ Program with adverse effects on entry, the distribution of benefits to small/rural communities, and fisheries diversification, which in turn have negative implications for social justice and equity, personal development, education and information, sense of community, and resilience (NPFMC/NMFS, 2016). Lease fees have been negatively associated in this fishery with physical safety and stewardship due to the demands on the lessee to harvest the IFQs even in poor weather conditions and without much investment in the long-term health of the resource (NPFMC/NMFS, 2016; Ringer et al., 2018). In addition, the disparities created by rising lease fees have undermined participants’ sense of community and the distributional inequities in the benefits derived from the implementation of the IFQ Program have eroded perceived social justice and equity (Ringer et al., 2018). Figure 9 demonstrates how those effects are actually ameliorated when lease fees and QS prices drop, with positive results across some of these well-being components and less consistently negative results across others.
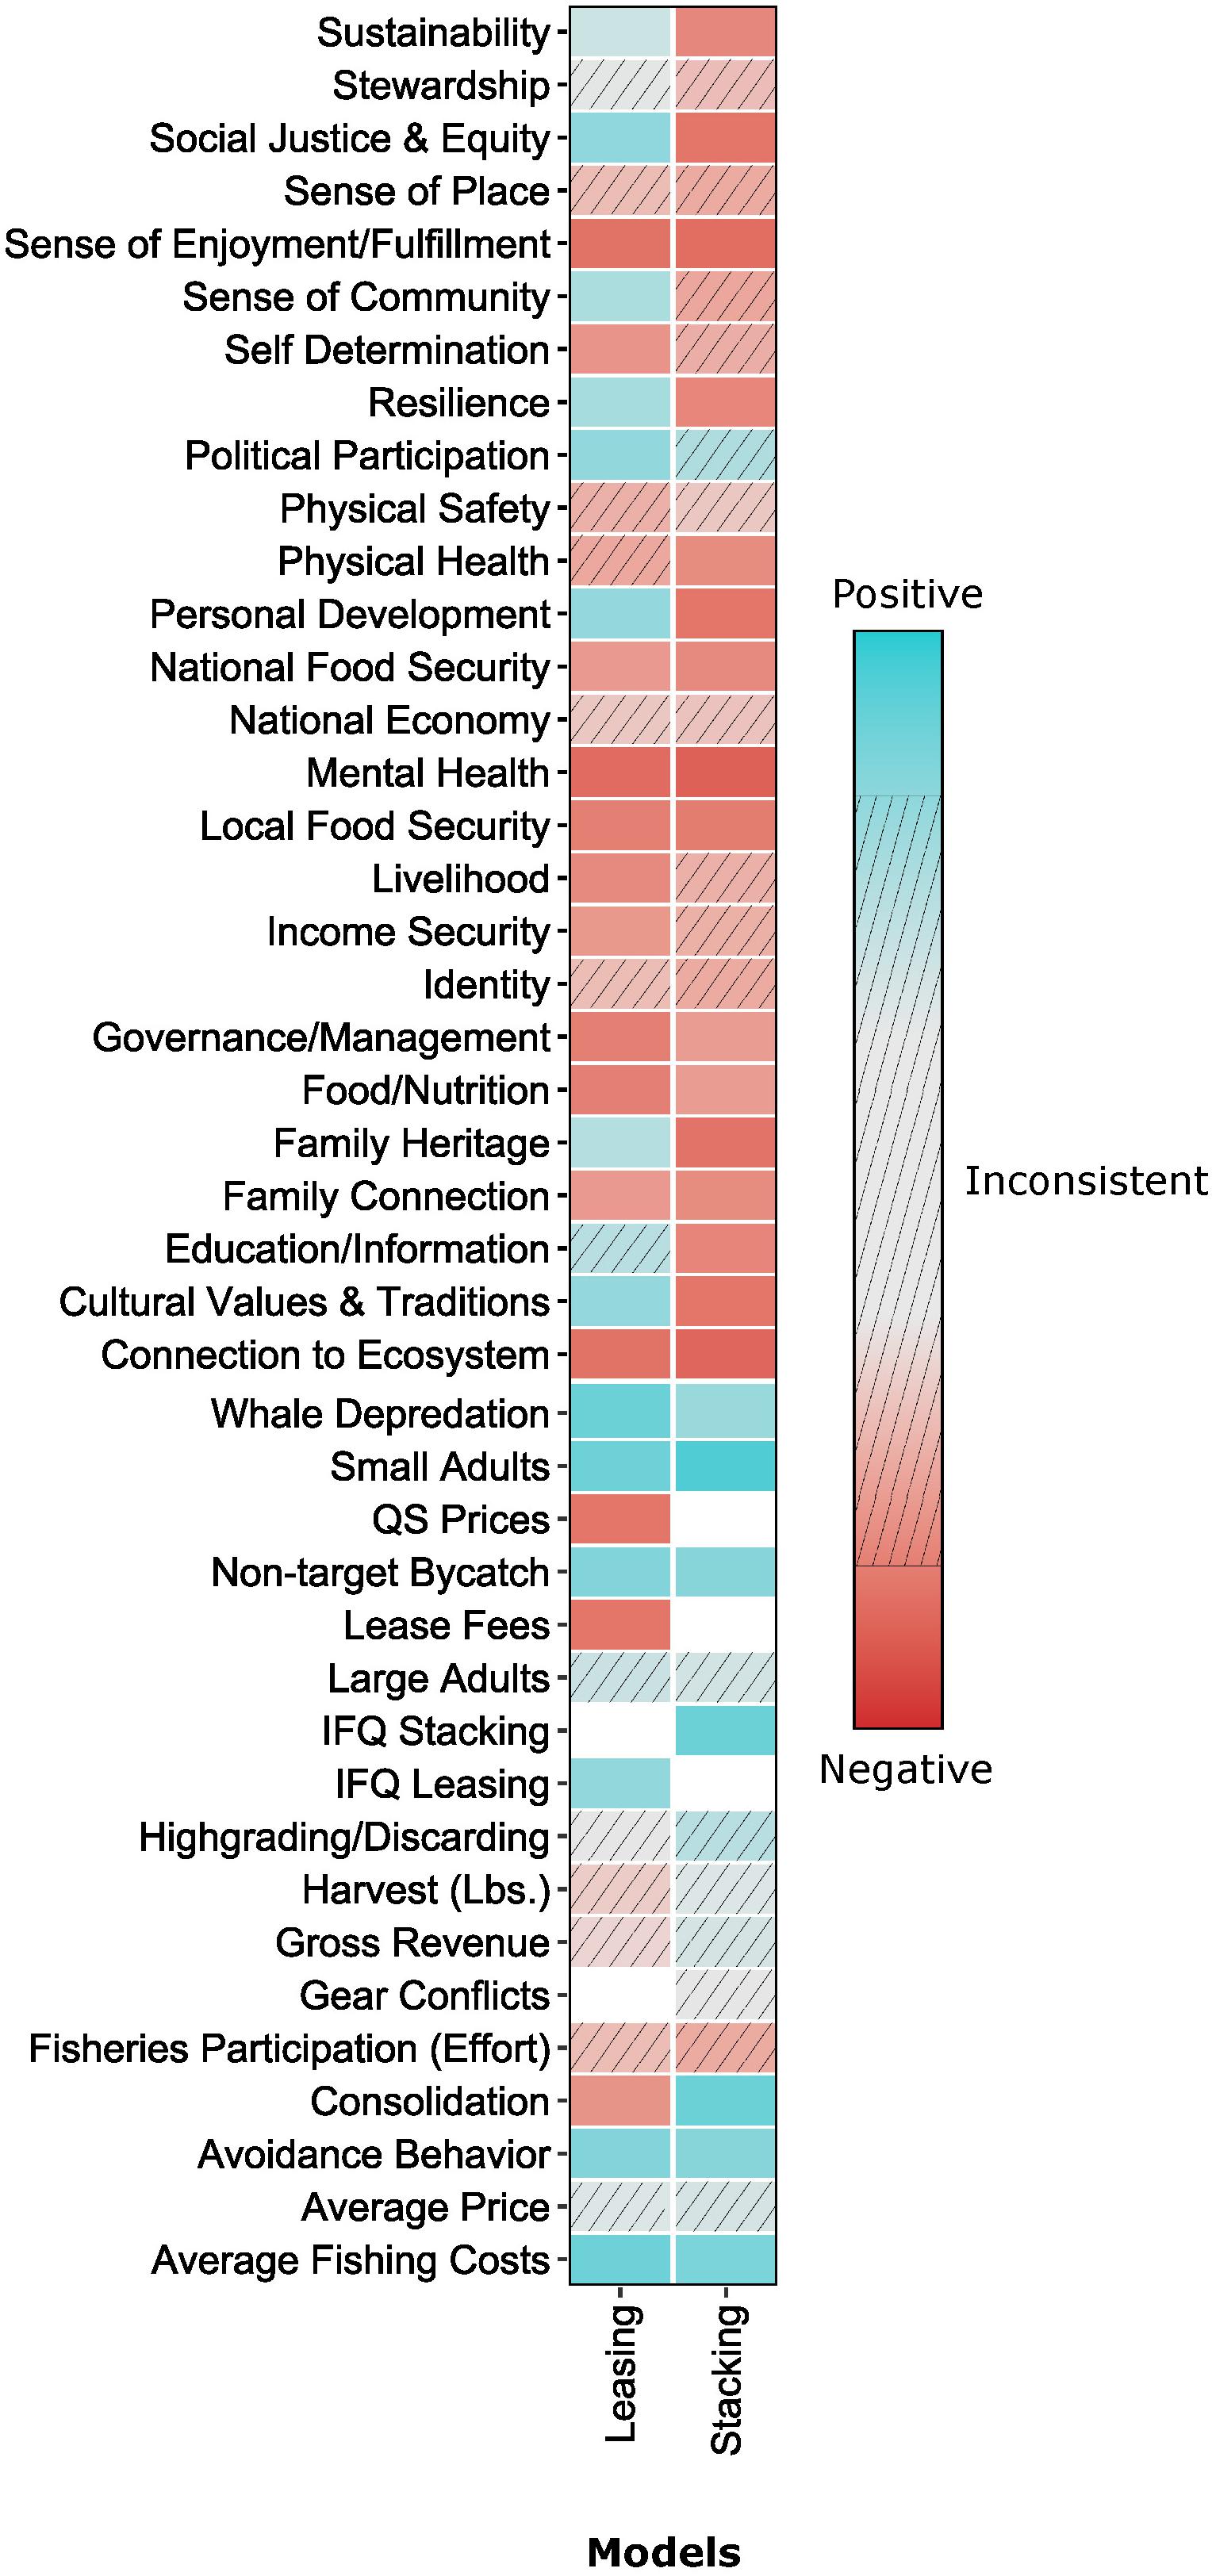
Figure 9. Results from 10,000 simulations to a positive perturbation in small adults and whale depredation for the leasing IFQ and stacking IFQ models. The squares indicate the probability of a positive (blue) or negative (red) response of the variables (y-axis) within each model (x-axis). Shading increase corresponds with an increase in sign consistency and the textured squares represent inconsistent results that are less than the 70% cutoff Figure created with R package “ggplot2” (Wickham, 2016; R Core Team, 2019).
In essence, declining lease fees and QS prices attenuate the negative impacts of leasing and in a scenario where leasing becomes the primary adaptive strategy, it may provide for entry opportunities for new participants as well as other associated benefits. The positive impacts on new entry due to lowered QS prices in the leasing IFQ model also buffer the potential effects of increasing consolidation resulting from leasing. The aggregation of quota with leasing leads to fewer vessels directly participating in the fishery; in turn, this limits crew and entry opportunities. However, that negative effect is cushioned by the positive impacts of lower QS prices on those opportunities.
Whereas stacking quota on pot boats can be akin to leasing, the practice also includes quota shareholders participating in the harvest of their quota on pot boats, Figure 9. The stacking IFQ model results in the incorporation of two new variables - gear conflicts and consolidation, which result in their own well-being effects. There has been historic gear conflict between longline pot and hook-and-line vessels in the sablefish fishery, which employ different gear on the same fishing grounds and at the same depth (NPFMC/NMFS, 2016). The groundline on longline pot gear is heavier and stronger than the one used for hook-and-line gear so that when the two gear types are set in the same place it can result in entanglement and gear loss. Furthermore, pot gear can sit in the water for longer periods of time because the fish caught in it are not subject to sand fleas like those caught with hook-and-line gear, so that pot gear can preempt fishing grounds. Therefore, stacking quota on pot boats as an adaptive strategy is assumed to lead to increased gear conflicts. In turn, gear conflicts have a number of well-being implications. Gear loss can result in ghost fishing, which has negative effects on governance and education and information due untracked fishing mortality (NPFMC/NMFS, 2016). The coupling of the ecological implications of ghost fishing and the social implications of gear conflicts on maintaining intra-community relationships undermines sense of community, resilience, and sustainability as well. Although these impacts could imply negative effects on stewardship as well, there is indication that the use of pots can have more direct positive impacts on reducing other ecological interactions including marine mammal and seabird interactions (NPFMC, 2015); therefore, the ultimate impact on stewardship is equivocal.
The outcomes of consolidation are different within the stacking IFQ model than the leasing IFQ model because in the latter declining QS prices and lease fees provide entry opportunities buffering the negative effects of consolidation. Within the stacking IFQ model, with fewer participating vessels, there is a reduction in the availability of crew jobs and opportunities for new individuals to enter the fishery with negative effects on personal development and education and information. This represents an inequitable distribution of fishery benefits across generations resulting in a decline in social justice and equity. The loss of intergenerational access and learning opportunities is also manifest in negative impacts on resilience and sustainability due to decreased opportunities to share traditions across generations.
Examining QNM Results With Indicators
Specific well-being outcomes of adaptive strategies, or variables in our QNMs, are explored using time-series indicators. In an effort to understand how prevalent the issue of non-target rockfish bycatch is, an outcome of avoidance behaviors, Figure 10 examines landings of the top six rockfish species by volume harvested by the sablefish IFQ fleet. These harvests represent rockfish that were incidentally caught on sablefish IFQ target trips. As in section “Examining adaptive strategies with quantitative indicators,” well-being outcomes are considered to be associated with adaptations if they became evident in 2017 or later. The figure demonstrates a substantial increase in rockfish bycatch but not until 2019, which may imply that similarly to the timeline discussed for the highgrading indicator above the incentives for avoiding small sablefish became particularly acute in 2019.
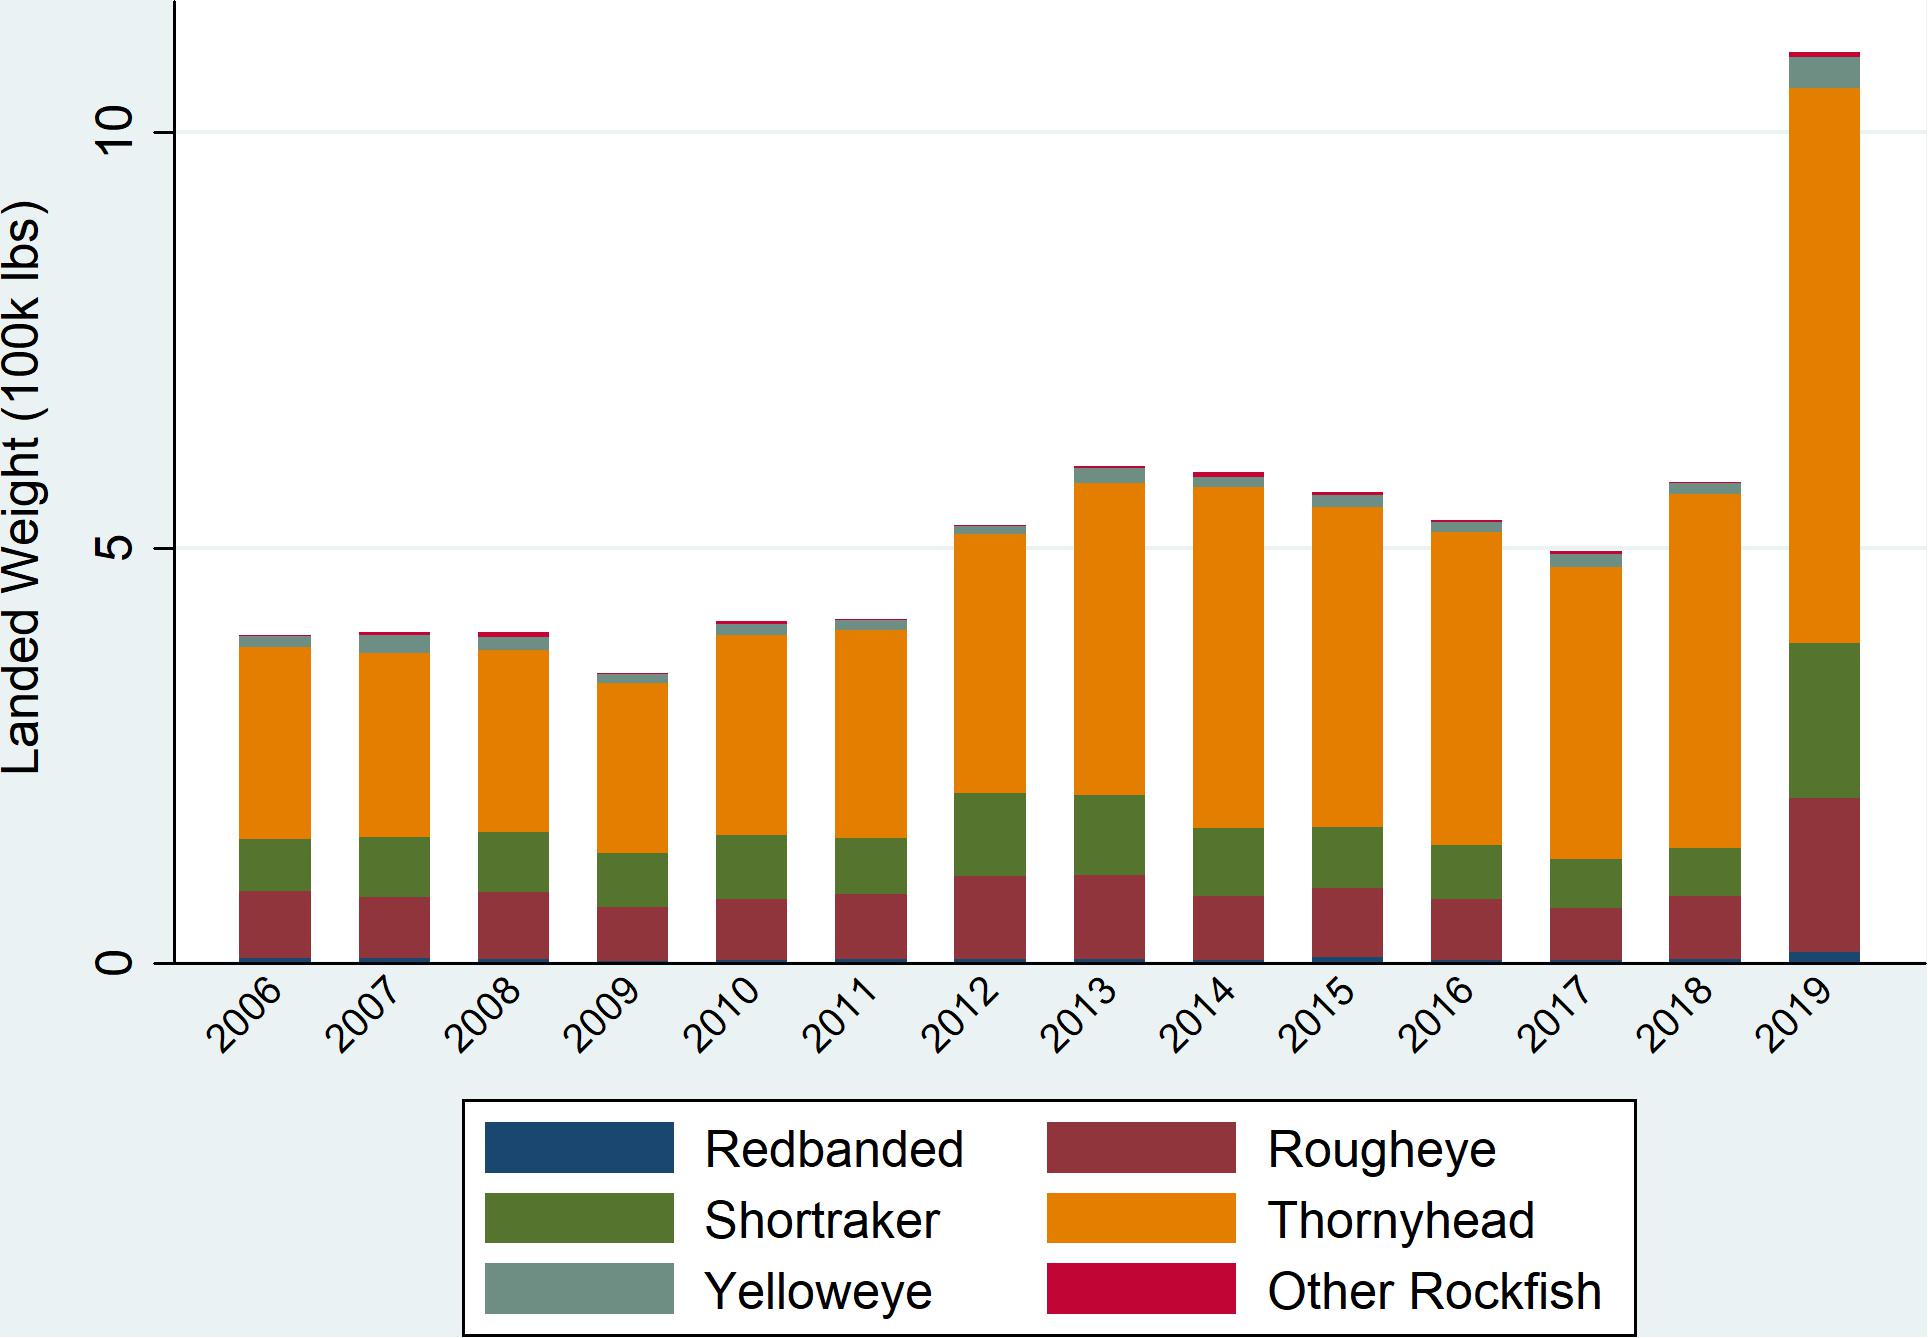
Figure 10. Rockfish bycatch for the sablefish IFQ fleet, for the top six rockfish species landed by volume.
Increasing rockfish bycatch is especially relevant in the Central and Eastern Gulf of Alaska, as these deeper waters are ecological hotspots for various rockfish species, some of which are considered vulnerable. In addition to the increase in the volume of rockfish bycatch for the sablefish IFQ fleet, Figure 10 also indicates an increase in landings of yelloweye rockfish which is a species of particular concern in Southeast Alaska (ADFG, 2019). In response, beginning in 2020, the sablefish IFQ fleet is subject to mandatory rockfish retention due to concerns about both increasing and unobserved bycatch (NPFMC, 2019c). Overall the trends in rockfish bycatch substantiate concerns that changing behavior in the sablefish IFQ fleet may have adverse consequences for non-target species bycatch, especially if price differentials between small and large fish continue.
The impacts of IFQ stacking on consolidation and lost opportunities for crew employment are explored in Figure 11 in terms of both the number of active vessels in the fishery (Figure 11A) and average crew size on sablefish fishing trips (Figure 11B). Consolidation in terms of active vessels has been occurring at a statistically significant rate (at the 0.05% level) of just over 6 vessels per year over the time series. Although the LOWESS trendline does not indicate that the rate of vessel consolidation has changed substantially since 2017, there is a visible dip in 2019. In contrast, the linear trendline for average crew size is not statistically significant although the LOWESS trendline for average crew size on sablefish IFQ fishing trips indicates a marked decrease in 2019. Decreasing vessel numbers over the time series indicate a substantial decrease in crew opportunities in the fishery. The marked decrease in vessel numbers and average crew size in 2019 point to the potential that changing ecological conditions and adaptive responses to those may be adversely affecting participation opportunities. Although a longer time series will be needed to determine significant trends and parse out other factors, altered crew opportunities and changes to crewmembers’ capacity to gain requisite experience to become vested in this fishery have been documented since IFQ implementation (Carothers, 2010, 2015; NPFMC/NMFS, 2016; Ringer et al., 2018).
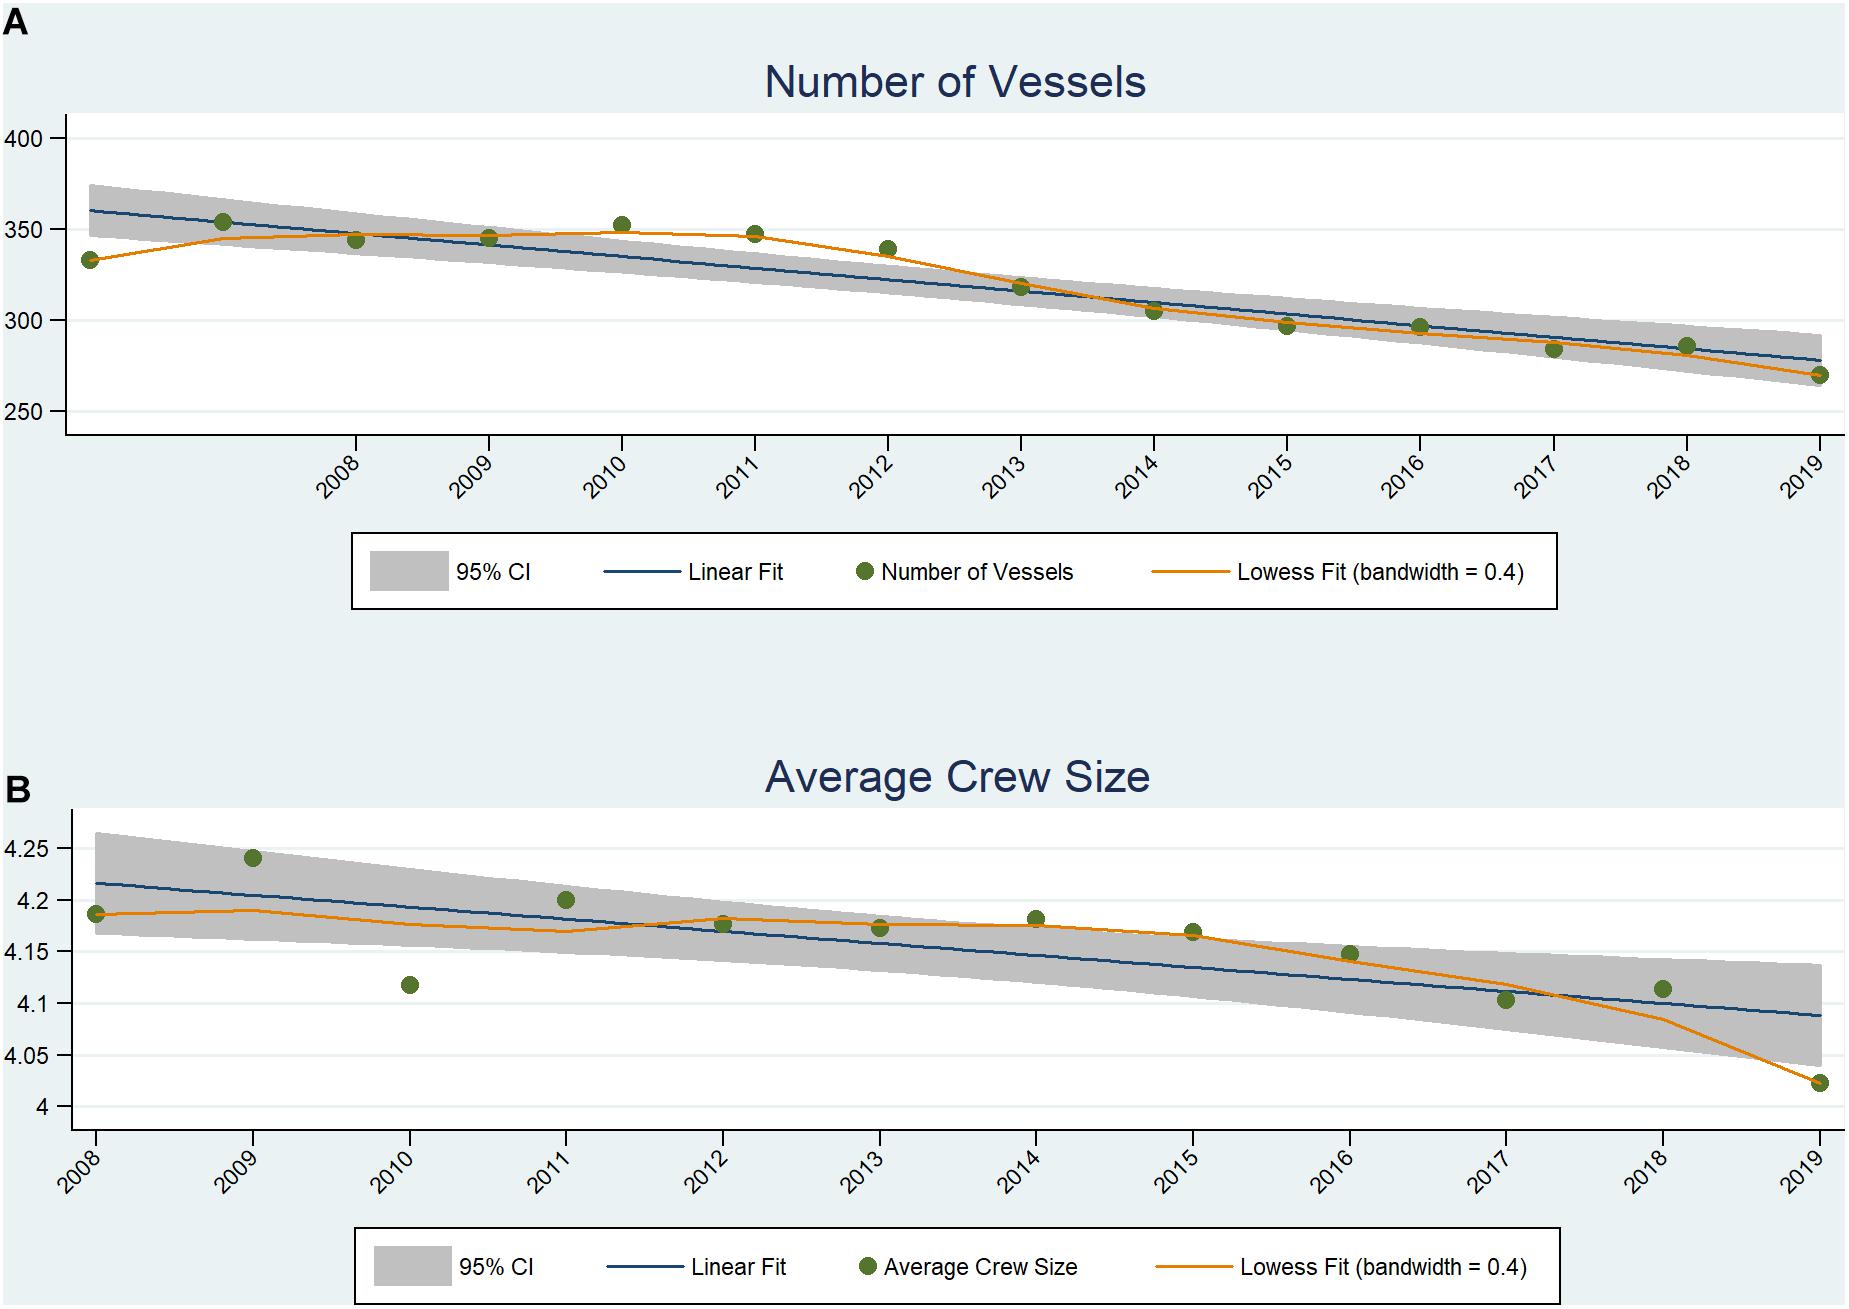
Figure 11. Number of unique vessels (A) and average crew size per fishing trip (B) in the sablefish IFQ fleet. Figure includes the linear fit line and the 95% confidence interval around that line and the LOWESS fit curve calculated using a 0.4 bandwidth.
Policy Implications
This study demonstrates how indicators coupled with QNMs can be used to understand adaptive behaviors and their well-being implications and tradeoffs. The ways in which adaptation strategies are shaping behavior in a fishery can be examined with quantitative indicators from harvest data that is readily available in many fisheries. Such indicators provide valuable insights about how fishermen are adapting to changing conditions that when coupled with QNMs can be used to inform well-being outcomes as well as other ecological effects. For example, the adaptations that are taking shape in response to large sablefish recruitment events in Alaska can be readily translated to the US West Coast where the 2016 sablefish cohort was also the largest in decades (Haltuch et al., 2019).
The exploration of adaptive strategies using QNMs provides a means of conceptualizing outcomes across the spectrum of well-being. To date most policymaking has focused on economic outcomes because these are more readily quantified than other well-being effects. The application of QNMs in this study demonstrates how other well-being impacts can be examined in parallel to economic effects and essentially places them on a level playing field. Using stakeholder interviews and literature review, well-being outcomes can be linked to variables that are associated with adaptations and fisheries participation more broadly to build QNMs. Such tools can then extend the scope of what is considered in shaping policies, allowing decision makers to consider the spectrum of well-being components.
The application of quantitative indicators and QNMs in the context of adaptation strategies to changing ecological conditions in this study addresses several existing limitations to the incorporation of human dimensions within EBFM. Firstly, it moves from static assumptions about human behavior to incorporate the realities of how adaptation characterizes fisheries participation. Furthermore, it incorporates the spectrum of well-being, moving beyond the singular focus on economic welfare that dominates the conventional discourse on outcomes in fisheries. Thirdly, it facilitates an understanding about the implicit tradeoffs of adaptive strategies across the components of well-being. For example, policymakers could consider the implications on crew and new entry opportunities associated with the leasing and stacking IFQ strategies, especially given the manifest decline in participating vessels in Figure 11. Whereas QNM results for the leasing IFQ model indicate that under current conditions of low QS prices and lease fees there is a positive outcome in inter-generational equity issues, the stacking IFQ model has the opposite effect. This would imply that holding all else equal policies that promote leasing could ameliorate equity issues relative to more stacking. In examining all of these issues, this study addresses a number of the key principles of the U.S. EBFM Road Map as well as other guiding documents for ecosystem based science, including advancing our understanding of ecosystem processes, exploring trade-offs within an ecosystem, and maintaining resilient ecosystems, inclusive of community well-being.
As with all models, QNMs are simplistic representations of systems that have inherent limitations, which should be considered by policy makers when utilizing them. Issues with model stability arise when too many variables are examined in QNMs; therefore, variables are often grouped or intermediary variables are removed. The necessity of this reductionist approach may hinder the capacity of these models to fully represent fisheries systems. Therefore, in developing QNMs there needs to be consideration of which variables policy makers may be able to isolate for regulation in order to ensure that these are not aggregated. QNMs are also constrained to uniform relationships, in that a linkage can only be either positive, negative, or neutral. But the nature of those linkages can vary between and even within user groups. For example, in the case of sablefish adaptive strategies we noted the omission of inactive quota shareholders from our models in order to be able to develop QNMs of leasing behavior. However, in reality even within the group of active harvesters in this fishery, the well-being effects of adaptive strategies could vary based on a multitude of individual variables, including risk tolerance, access to capital, experience and so on. Policy makers should therefore consider how representative the linkages in the QNMs are of the various user groups in their fisheries. Finally, the binary nature of QNMs also does not allow for weighting the variable strengths, therefore all variables are assumed to have equal impact upon one another. Other modeling frameworks like fuzzy cognitive mapping allow for the inclusion of the strength of interactions, but policymakers then have to judge the representativeness of the strengths included in those models. In essence QNMs provide an easily adaptable mechanism of examining how adaptive behavior may reverberate throughout a fishery, but there is a tradeoff in that facility with impediments in accounting for the inherent complexity of these systems.
Conclusion
In the Alaskan sablefish fishery, the influx of small sablefish and continued whale depredation has caused earnings to plummet and fishermen to invoke a variety of strategies to try to adapt and mitigate that decline. The persistence and likely acceleration of change in the sablefish fishery will necessitate further adaptive evolution. Fishermen may have to convert their existing hook-and-line boats to pot boats or invest in new boats to accommodate pot gear, a capital intensive proposition that may be facilitated by partnering with others or technological advancement. Others may develop or extend existing networks to facilitate information sharing about small sablefish or whale hotspots and leasing or quota stacking arrangements. Each of these and any other strategies that may emerge will have its own variegated impacts across the spectrum of well-being that can be explored with indicators and network models. To expand the utility of these tools there should be greater consideration of regional differences in ecological and market perturbations and thus spatial variation in the application of adaptation strategies, as well as the potential for distinct local well-being priorities. This can facilitate policymaking that maximizes desired outcomes contextualized in locally relevant adaptive capacities and value systems.
Adaptation is a key component of the resilience that characterizes fishermen and makes fisheries successful. Understanding how adaptive behavior unfolds in fisheries and its well-being outcomes is critical for conceptualizing adaptations and their impacts in the face of diverse forms of perturbations, from ecological impacts associated with climate change to market effects of global shifts. The rate at which marine ecosystems across the globe are changing is anticipated to increase in the coming years (Walsh et al., 2018), the necessity for integrating adaptations into policy frameworks and the assessment of the techniques that are employed is also going to become more relevant. The mechanisms of evaluating adaptational impacts demonstrated in this study have the potential to advance those frameworks by incorporating the diversity in human adaptation and well-being, providing a means to more accurately represent humans within EBFM policy.
Data Availability Statement
The data analyzed in this study is subject to the following licenses/restrictions: the datasets generated for this study will not be made publicly available to ensure the confidentiality of respondents. The harvest data is confidential because it includes earnings information. Requests to access these datasets should be directed to Alaska Commercial Fisheries Entry Commission (ZGZnLmNmZWMucXVlc3Rpb25zQGFsYXNrYS5nb3Zvcg== https://www.cfec.state.ak.us/).
Ethics Statement
Ethical review and approval was not required for the study on human participants in accordance with the local legislation and institutional requirements. Written informed consent for participation was not required for this study in accordance with the national legislation and the institutional requirements.
Author Contributions
MS devised the project and its main conceptual ideas, conducted the stakeholder interviews, analyzed the quantitative and qualitative data, conducted the literature review, coded the themes in the literature, and developed the manuscript. MR-R created the figures, assisted in analyzing the quantitative and qualitative data, and assisted in developing the manuscript. Both authors contributed to manuscript revision, and read and approved the submitted version.
Funding
This work was supported by NOAA’s Office of Science and Technology. The views and opinions expressed in this manuscript are the authors’ own, and do not necessarily reflect those of the National Oceanic and Atmospheric Administration or the U.S. Department of Commerce.
Conflict of Interest
The authors declare that the research was conducted in the absence of any commercial or financial relationships that could be construed as a potential conflict of interest.
Acknowledgments
The authors would like to thank Jean Lee for providing data and Stephen Kasperski and the reviewers of this journal for their thoughtful comments on this work. The views and opinions expressed in this manuscript are the authors’ own, and do not necessarily reflect those of the National Oceanic and Atmospheric Administration or the U.S. Department of Commerce.
Supplementary Material
The Supplementary Material for this article can be found online at: https://www.frontiersin.org/articles/10.3389/fmars.2020.602281/full#supplementary-material
Footnotes
References
ADFG (2019). 2020 Demersal Shelf Rockfish And Yelloweye Rockfish Fisheries Announcement. Available from: http://www.adfg.alaska.gov/static/applications/dcfnewsrelease/1130983389.pdf (accessed July 1, 2020) Google Scholar
Anderson, L. G., and Seijo, J. C. (2010). Bioeconomics of Fisheries Management. Hoboken, NJ: John Wiley & Sons.
Barbeaux, S., Aydin, K., Fissel, B., Holsman, K. K., Laurel, B., Palsson, W., et al. (2019). Assessment of the Pacific cod stock in the Gulf of Alaska. Anchorage, AK: North Pacific Fishery Management Council.
Bond, N. A., Cronin, M. F., Freeland, H., and Mantua, N. (2015). Causes and impacts of the 2014 warm anomaly in the NE Pacific. Geophys. Res. Lett. 42, 3414–3420. doi: 10.1002/2015GL063306
Breslow, S. J., Sojka, B., Barnea, R., Basurto, X., Carothers, C., Charnley, S., et al. (2016). Conceptualizing and operationalizing human wellbeing for ecosystem assessment and management. Environ. Sci. Policy 66, 250–259. doi: 10.1016/j.envsci.2016.06.023
Cahalan, J., Gasper, J., and Mondragon, J. (2014). Catch Sampling and Estimation in The Federal Groundfish Fisheries off Alaska, 2015 Edition. U.S. Dep. Commer., NOAA Tech. Memo. NMFS-AFSC-286. Washington, DC: NOAA.
Carothers, C. (2010). Tragedy of commodification: displacements in alutiiq fishing communities in the Gulf of Alaska. MAST 9, 95–120.
Carothers, C. (2015). Fisheries privatization, social transitions, and well-being in Kodiak, Alaska. Mar. Policy 61, 313–322. doi: 10.1016/j.marpol.2014.11.019
Dambacher, J. M., Gaughan, D. J., Rochet, M.-J., Rossignol, P. A., and Trenkel, V. M. (2009). Qualitative modelling and indicators of exploited ecosystems. Fish Fish. 10, 305–322. doi: 10.1111/j.1467-2979.2008.00323.x
Echave, K. B., Hanselman, D., Adkison, M. D., and Sigler, M. F. (2012). Inter-decadal changes in sablefish, Anoplopoma fimbria, growth in the northeast Pacific Ocean. Fish. Bull. 210, 361–374.
Fissel, B., Dalton, M., Garber-Yonts, B., Haynie, A., Kasperski, S., Lee, L., et al. (2019). “Economic status of the groundfish fisheries off Alaska,” in Stock Assessment and fishery evaluation report for the groundfish fisheries of the Gulf of Alaska and Bering Sea/Aleutian Island Area, eds B. E. Fissel, M. Dalton, and R. G. Felthoven (Seattle, WA: Alaska Fisheries Science Center/National Marine Fisheries Service).
Fissel, B., Dalton, M., Garber-Yonts, B., Haynie, A., Kasperski, S., Lee, L., et al. (2020). “Economic status of the groundfish fisheries off Alaska,” in Stock Assessment and Fishery Evaluation Report for the Groundfish Fisheries of the Gulf of Alaska and Bering Sea/Aleutian Island Area. September 2020 Plan Team Draft, (Seattle, WA: Alaska Fisheries Science Center/National Marine Fisheries Service).
Haltuch, M. A., Johnson, K. F., Tolimieri, N., Kapur, M. S., and Castillo-Jordán, C. A. (2019). Status of the Sablefish Stock in U.S. Waters in 2019. Portland, OR: Pacific Fisheries Management Council.
Hanselman, D., Pyper, B. J., and Peterson, M. (2018). Sperm whale depredation on longline surveys and implications for the assessment of Alaska sablefish. Fish. Res. 200, 75–83. doi: 10.1016/j.fishres.2017.12.017
Hanselman, D., Rodgveller, C., Fenske, K. H., Shotwell, K., Echave, K. B., Malecha, P. W., et al. (2019). “Assessment of the Sablefish Stock of Alaska,” in Stock Assessment and Fishery Evaluation Report for the Groundfish Fisheries of the Gulf of Alaska and Bering Sea/Aleutian Islands Area, eds B. E. Fissel, M. Dalton, and R. G. Felthoven (Anchorage, AK: North Pacific Fishery Management Council).
Harvey, C. J., Reum, J. C., Poe, M. R., Williams, G. D., and Kim, S. J. (2016). Using conceptual models and qualitative network models to advance integrative assessments of marine ecosystems. Coast. Manag. 44, 486–503. doi: 10.1080/08920753.2016.1208881
Kelble, C. R., Loomis, D. K., Lovelace, S., Nuttle, W. K., Ortner, P. B., Fletcher, P., et al. (2013). The EBM-DPSER conceptual model: integrating ecosystem services into the DPSIR framework. PLoS One 8:e70766. doi: 10.1371/journal.pone.0070766
Laurel, B., and Rogers, L. (2020). Loss of spawning habitat and prerecruits of Pacific cod during a Gulf of Alaska heatwave. Can. J. Fish. Aquat. Sci. 77, 644–650. doi: 10.1139/cjfas-2019-0238
Lord, F. (2011). Understanding social impacts by using new variables and a causal model diagram in New England fisheries. Impact Assess. Project Appraisal 29, 59–68. doi: 10.3152/146155111X12913679730476
Melbourne-Thomas, J., Wotherspoon, S., Raymond, B., and Constable, A. (2012). Comprehensive evaluation of model uncertainty in qualitative network analyses. Ecol. Monogr. 82, 505–519. doi: 10.1890/12-0207.1
NMFS (2019). Alaska Inseason Management Annual Reports to the North Pacific Fishery Management Council. Available online at: https://www.fisheries.noaa.gov/resource/document/alaska-inseason-management-annual-reports-north-pacific-fishery-management (accessed July 1, 2020).
NMFS (2020). IFQ Halibut/Sablefish Allocations and Landings [Online]. Available online at: https://www.fisheries.noaa.gov/alaska/commercial-fishing/fisheries-catch-and-landings-reports-alaska#ifq-halibut/sablefish (accessed July 1, 2020).
NPFMC (2013). Discussion Paper Allow The Use Of Pot Gear For Sablefish IFQs In The Gulf Of Alaska. Anchorage, AK: North Pacific Fisheries Management Council.
NPFMC (2015). Proposed Amendment to the Fishery Management Plan for Groundfish of the Gulf of Alaska and Federal regulations implementing the sablefish and Pacific halibut fisheries off Alaska: Allow the Use of Pot Longline Gear in the Gulf of Alaska Sablefish Individual Fishing Quota Fishery. Anchorage, AK: North Pacific Fisheries Management Council.
NPFMC (2018). Discussion Paper: Sablefish Discard Allowance. D2 Sablefish Discard Allowance OCTOBER 2018. Available online at: http://meetings.npfmc.org/CommentReview/DownloadFile?p=b6b509dd-a14c-442b-867b-3f88fa9f8d98.pdf&fileName=D2%20Sablefish%20Discard%20Allowance.pdf (accessed September 28, 2020).
NPFMC (2019a). Discussion Paper: Sablefish Discard Allowance. D2 Small Sablefish Discarding. December 2019. Available online at: https://meetings.npfmc.org/CommentReview/DownloadFile?p=af8355e5-8e81-4165-b20e-2ce11cade94d.pdf&fileName=D2%20Small%20Sablefish%20Discarding%20Discussion%20Paper.pdf (accessed September 28, 2020).
NPFMC (2019b). Discussion Paper: Sablefish Discard Allowance March 22, 2019. D8 Small Sablefish Discards APRIL 2019. Available online at: https://meetings.npfmc.org/CommentReview/DownloadFile?p=547e97ee-897a-4d4d-8811-71fba0d56de3.pdf&fileName=D8%20Sablefish%20Discard%20Allowance%20DiscPaper.pdf (accessed September 28, 2020).
NPFMC (2019c). Regulatory Impact Review for Proposed Amendment to the Fishery Management Plan for Bering Sea/Aleutian Islands and Gulf of Alaska Management Areas Full Retention of Rockfish for Fixed Gear Catcher Vessels. Anchorage, AK: North Pacific Fisheries Management Council. Available online at: https://meetings.npfmc.org/CommentReview/DownloadFile?p=f5da952c-cd82-4dd8-ad13-b4505fca6b09.pdf&fileName=C2%20Rockfish%20Full%20Retention%20Final%20Action%20April%202019.pdf (accessed July 1, 2020).
NPFMC/NMFS (2016). Twenty-year review of the Pacific halibut and sablefish Individual Fishing Quota Management Program. Anchorage, AK: North Pacific Fisheries Management Council/National Marine Fisheries Service.
Okamoto, D. K., Poe, M. R., Francis, T. B., Punt, A. E., Levin, P. S., Shelton, A. O., et al. (2020). Attending to spatial social–ecological sensitivities to improve trade-off analysis in natural resource management. Fish Fish. 21, 1–12. doi: 10.1111/faf.12409
Ono, K., Haynie, A. C., Hollowed, A. B., Ianelli, J. N., McGilliard, C. R., and Punt, A. E. (2017). Management strategy analysis for multispecies fisheries, including technical interactions and human behavior in modelling management decisions and fishing. Can. J. Fish. Aquat. Sci. 75, 1185–1202. doi: 10.1139/cjfas-2017-0135
Peterson, M., and Carothers, C. (2013). Whale interactions with Alaskan sablefish and Pacific halibut fisheries: surveying fishermen perception, changing fishing practices and mitigation. Mar. Policy 42, 315–324. doi: 10.1016/j.marpol.2013.04.001
Peterson, M., and Hanselman, D. (2017). Sablefish mortality associated with whale depredation in Alaska. ICES J. Mar. Sci. 74, 1382–1394. doi: 10.1093/icesjms/fsw239
Peterson, M., Mueter, F., Criddle, K., and Haynie, A. C. (2014). Killer whale depredation and associated costs to Alaskan sablefish, Pacific halibut and Greenland turbot longliners. PLoS One 9:e88906. doi: 10.1371/journal.pone.0088906
R Core Team (2019). R: A Language and Environment for Statistical Computing. Vienna: R Foundation for Statistical Computing.
Raymond, B., McInnes, J., Dambacher, J. M., Way, S., and Bergstrom, D. M. (2011). Qualitative modelling of invasive species eradication on subantarctic Macquarie Island. J. Appl. Ecol. 48, 181–191. doi: 10.1111/j.1365-2664.2010.01916.x
Reum, J. C., McDonald, P. S., Ferriss, B. E., Farrell, D. M., Harvey, C. J., and Levin, P. S. (2015). Qualitative network models in support of ecosystem approaches to bivalve aquaculture. ICES J. Mar. Sci. 72, 2278–2288. doi: 10.1093/icesjms/fsv119
Ringer, D., Carothers, C., Donkersloot, R., Coleman, J., and Cullenberg, P. (2018). For generations to come? The privatization paradigm and shifting social baselines in Kodiak, Alaska’s commercial fisheries. Mar. Policy 98, 97–103. doi: 10.1016/j.marpol.2018.09.009
Rosellon-Druker, J., Szymkowiak, M., Aydin, K. Y., Cunningham, C., Fergusson, E., Kasperski, S., et al. (2020). Participatory place-based IEA in Sitka, Alaska: constructing and operationalizing a socio-ecological conceptual model for sablefish (Anoplopoma fimbria). Deep Sea Res. II. doi: 10.1016/j.dsr2.2020.104912
Rutecki, T. L., and Varosi, E. R. (1997). “Distribution, age, and growth of juvenile sablefish, Anoplopoma fimbria, in Southeast Alaska,” in Proceedings of the International Symposium on the Biology and Management of Sablefish, eds M. Saunders and M. Wilkins (Seattle: NOAA), 44–54.
Serreze, M. C., and Francis, J. A. (2006). The arctic amplification debate. Clim. Change 76, 241–264. doi: 10.1007/s10584-005-9017-y
Shotwell, K. (2018). Update on the Ecosystem and Socio-economic Profile (ESP). Seattle: Groundfish Plan Team.
Sigler, M. F., Rutecki, T. L., Courtney, D. L., Karinen, J. F., and Yang, M. S. (2001). Young-of-the-year sablefish abundance, growth, and diet. Alaska Fish. Res. Bull. 8, 57–70.
Szymkowiak, M., and Felthoven, R. (2016). Understanding the determinants of hired skipper use in the Alaska halibut individual fishing quota fishery. J. N. Am. Fish. Manag. 36, 1136–1148.
Szymkowiak, M., and Himes-Cornell, A. H. (2015). Towards individual-owned and owner-operated fleets in the Alaska halibut and sablefish IFQ program. Mar. Stud. 14;19.
Szymkowiak, M., and Himes-Cornell, A. H. (2017). Do active participation measures help fishermen retain fishing privileges? Coast. Manag. 45, 56–72. doi: 10.1080/08920753.2017.1237243
Szymkowiak, M., and Kasperski, S. (2020). Sustaining an alaska coastal community: integrating place based well-being indicators and fisheries participation. Coast. Manag. doi: 10.1080/08920753.2021.1846165
van Putten, I. E., Gorton, R. J., Fulton, E. A., and Thebaud, O. (2013). The role of behavioural flexibility in a whole of ecosystem model. ICES J. Mar. Sci. 70, 150–163. doi: 10.1093/icesjms/fss175
Walsh, J. E., Thoman, R. L., Bhatt, U. S., Bieniek, P. A., Brettschneider, B., Brubaker, M., et al. (2018). The high latitude marine heat wave of 2016 and its impacts on Alaska. Bull. Am. Meteorol. Soc. 99, S39–S43.
Keywords: adaptive strategies, QNM, ecosystem change, quantitative indicators, EBFM, well-being, sablefish
Citation: Szymkowiak M and Rhodes-Reese M (2020) Adaptive Behaviors to Marine Ecosystem Shifts: Examining Fishermen’s Strategies in Response to Abundant Juvenile Sablefish (Anoplopoma fimbria) in Alaska. Front. Mar. Sci. 7:602281. doi: 10.3389/fmars.2020.602281
Received: 02 September 2020; Accepted: 24 November 2020;
Published: 16 December 2020.
Edited by:
Johanna Jacomina Heymans, European Marine Board (EMB), BelgiumReviewed by:
Alida Bundy, Bedford Institute of Oceanography (BIO), CanadaJohn Field, Southwest Fisheries Science Center (NOAA), United States
Copyright © 2020 Szymkowiak and Rhodes-Reese. This is an open-access article distributed under the terms of the Creative Commons Attribution License (CC BY). The use, distribution or reproduction in other forums is permitted, provided the original author(s) and the copyright owner(s) are credited and that the original publication in this journal is cited, in accordance with accepted academic practice. No use, distribution or reproduction is permitted which does not comply with these terms.
*Correspondence: Marysia Szymkowiak, bWFyeXNpYS5zenlta293aWFrQG5vYWEuZ292