
94% of researchers rate our articles as excellent or good
Learn more about the work of our research integrity team to safeguard the quality of each article we publish.
Find out more
METHODS article
Front. Mar. Sci., 25 January 2021
Sec. Marine Megafauna
Volume 7 - 2020 | https://doi.org/10.3389/fmars.2020.595853
 Erin L. LaCasella1*
 Michael P. Jensen2,3
 Christine A. Madden Hof3
 Ian P. Bell4
 Amy Frey1
 Peter H. Dutton1
Hawksbill turtles (Eretmochelys imbricata) are exploited for their beautiful shell known as tortoiseshell or bekko, making them extremely vulnerable in the illegal global trade of tortoiseshell products. In this study, we developed an effective, standardized method using a commercially available kit to extract DNA and obtain informative mitochondrial DNA (mtDNA) control region sequences (~800 bp) from hawksbill turtle products in order to trace the sample back to a likely stock origin. We also sequenced additional skin samples from nesting beaches of Milman Island, Australia and Arnavon Island, Solomon Islands to add to the baseline data for hawksbill turtles in the Indo-Pacific. Our results indicate that nine of the 13 tortoiseshell products obtained from Papua New Guinea and Solomon Islands were from turtles with haplotypes found primarily at the Solomon Islands rookery and did not match those from nesting populations in Australia or SE Asia, with the exception of one haplotype also found in 3% of turtles at Milman Island. We also found that 23% of the market samples have haplotypes only documented in foraging populations, which illustrates the urgent need for more extensive sampling of rookeries to fill gaps in the reference baseline database. Nevertheless, our study results demonstrate an effective methodology for obtaining DNA of sufficient quantity and quality from hawksbill turtle products.
The illegal trade in endangered wildlife is having devastating impacts on many of the world's species and is broadly considered a global threat to biodiversity (Veríssimo and Wan, 2019). Among the best known cases are elephant ivory (Gao and Clark, 2014), rhino horn (Milliken and Shaw, 2012), tiger skin and bones (Nowell and Ling, 2007), shark fins (Fields et al., 2020), and bear gall bladder (Jabin et al., 2019) to name a few. Rapid globalization, increased connectivity, complex trade networks, and a continued cultural and social demand for wildlife products will continue to drive populations toward extinction (Miller et al., 2019; Hitchens and Blakeslee, 2020). The illegal wildlife trade is highly profitable and estimated to have an annual value of 20 billion US dollars (Nahill et al., 2020).
For decades, genetic approaches have provided a useful tool in wildlife forensic investigations. The use of DNA sampling provides a time-efficient and cost-effective way to determine the species and in some cases geographical origin of wildlife products. Molecular techniques have been successfully applied to illegal poaching of elephants, tigers, rhinoceros, birds, sharks, etc. (Nishant et al., 2018; Fields et al., 2020). For example, DNA extracted from ivory has been used to identify the location of the poaching hotspots for African elephants by matching the genetic signature of confiscated ivory to geographic or population specific genetic signatures (Wasser et al., 2015). Other iconic African species that are under heavy impact from poaching are the white and black rhino (Korenblik et al., 2016). To combat the poaching, researchers, wildlife managers and law enforcement are working together to effectively prosecute traffickers and poachers. For example, the RhODIS® (Rhinoceros DNA Index System) program has developed a DNA-based individual identification protocol using short tandem repeats (STRs) to match genotypes from confiscated rhino horn to specific populations and in some cases to specific crime scene carcasses, thereby providing strong support for effective criminal investigations (Harper et al., 2018). Similarly, the mtDNA control-region has been used to assess the population origin of shark fin trimmings. In a pilot survey, Fields et al. (2020) showed that scalloped hammerhead (Sphyrna lewini) fins at fish markets in Hong Kong were sourced from six populations globally, but that the majority of fins originated from the Eastern Pacific (61.4%, of all trimmings) where the species is listed as “Endangered” under the United States Endangered Species Act (Miller et al., 2014).
Hawksbill turtles (Eretmochelys imbricata) are particularly targeted for their beautiful shell known as tortoiseshell or bekko (Limpus and Miller, 1990; Miller et al., 2019). For centuries hawksbills have been exploited to make jewelry such as earrings, necklaces, bracelets, combs and other adornments used for traditional, medicinal or decorative purposes and tourist souvenirs (Nahill et al., 2020). In a recent study, it was estimated that as many as 9 million hawksbill turtles were harvested over the past 150 years (Miller et al., 2019). Nearly 500,000 hawksbills were estimated to have been exported from the Asia-Pacific region between 1950 and 1992 (Mortimer and Donnelly, 2008) and in just 3 years, from 2015 to 2018, large quantities of turtle products were confiscated in Indonesia, Malaysia and Vietnam including nearly one thousand crafted products and ~1 ton of raw shell (CITES Secretariat, 2019). These threats have resulted in population sizes that are 80% lower than historical levels (Mortimer and Donnelly, 2008). CITES (the Convention on International Trade in Endangered Species) is an international agreement between governments to implement stronger mandates to curb international trade so it does not threaten the survival of species including hawksbill turtles. Even with this safeguard, the trade in illegal wildlife products continues to thrive (CITES Secretariat, 2019), and is having detrimental effects on hawksbill turtle populations in the Asia-Pacific region (IOSEA, 2014) and beyond. The trade of hawksbill products still occurs in nearly 50 countries through in-person markets and online resources, regardless of international protection (Nahill et al., 2020). In the Solomon Islands, turtles are culturally and socially important and subsistence harvest is still legal. Although the trade of all turtle products is banned, products from harvested turtles are likely sold to local carvers and buyers, some of which will make it to the Asian markets (Vuto et al., 2019). With the widespread movement of such products, there is an urgent need to apply new technologies to track the source population of turtles poached to determine the populations most affected and at risk by this trade.
The complex spatial ecology of marine turtles makes it challenging to fully assess the impacts of poaching. Turtles are poached from both nesting and foraging areas and products may be seized at the poaching location, en-route to or at the destination of the illegal trade, hence it can be challenging to know which breeding populations the items came from. Genetic analysis has been used extensively in marine turtles to assess phylogeography (Vargas et al., 2016; Jensen et al., 2019a; FitzSimmons et al., 2020) and stock structure (Dutton et al., 2013; Matsuzawa et al., 2016). Once the stock structure for a species has been determined, that information has been used to estimate the stock origin of turtles sampled at foraging areas (Maffucci et al., 2006; Gaos et al., 2018a; Dutton et al., 2019), caught as bycatch in fisheries (LaCasella et al., 2013; Clusa et al., 2016; Stewart et al., 2016) and stranded turtles (Rankin-Baransky et al., 2001). In a similar fashion, genetic tools can be used to trace back the stock origin of tortoiseshell products. To assess which stocks are being impacted, a mixed stock analysis (MSA) can be applied. The MSA uses genetic markers that differentiate populations to build a comprehensive genetic database of all [or most] stocks/rookeries. By sourcing samples from an unknown mixture of individuals, the relative proportion of each stock in the mixture can be estimated.
Previously, Foran and Ray (2016) identified the Indo-Pacific region as a hotspot for illegal tortoiseshell products entering the United States, using DNA extracted from confiscated tortoiseshell products. However, they were not able to pinpoint the geographical origin of the samples, in part due to the limitations of the genetic marker, and partly due to an incomplete baseline to which samples could be compared. This highlights the need for a concerted effort to further develop and apply powerful genetic techniques to help identify poaching hotspots for this critically endangered species particularly across Asia-Pacific, and beyond.
Here, we build on Foran and Ray (2016) previous efforts by developing a reliable method and protocol for extracting and sequencing mitochondrial DNA (mtDNA) from hawksbill turtle carapace. Specifically, we aim to (1) Extract genomic DNA and sequence the mtDNA control region from both skin and carapace samples from the same individual to serve as a positive control for accurately assigning mtDNA haplotypes from shell samples, (2) Use tortoiseshell product to refine the DNA extraction and sequencing method from processed shell products and (3) Sequence additional skin samples from nesting beaches of Milman Island, Australia and Arnavon Islands, Solomon Islands to add to the baseline data for hawksbill turtles in the Indo-Pacific.
All applicable national, and/or institutional guidelines and permitting requirements were followed to ensure best practices, legal, and ethical standards were applied for nesting and foraging sample collections and care of animals. Nesting samples from the Solomon Islands were collected by The Nature Conservancy and the samples from Milman Islands (nesting) and the Howick Group (foraging) were collected by the Department of Environment and Science, Queensland Government and under Great Barrier Reef Marine Park Permit G19/38535.1. Market samples from Papua New Guinea and Solomon Islands were legally donated to WWF-Australia. All samples were legally imported to the Southwest Fisheries Science Center in La Jolla, USA under CITES scientific exchange permits AU062 and US057.
For this study, we used three tissue types (skin, carapace, and tortoiseshell product). Skin samples were collected from nesting turtles at Milman Island Queensland, Australia (n = 23) and from Arnavons Islands in the Solomon Islands (n = 28) during the 2017 nesting season (Figure 1). Skin and carapace samples were individually collected from eight foraging turtles at the Howick Group of Islands in Queensland, Australia (n = 16 total samples). Tortoiseshell products such as earrings, bracelets, and hair adornments were collected from local markets in Papua New Guinea (PNG; n = 6; markets: Kokopo, Nusa Island, and 4 Mile Island) and the Solomon Islands (n = 7; markets: Mendana, Central, and Ladies) (Figure 2).
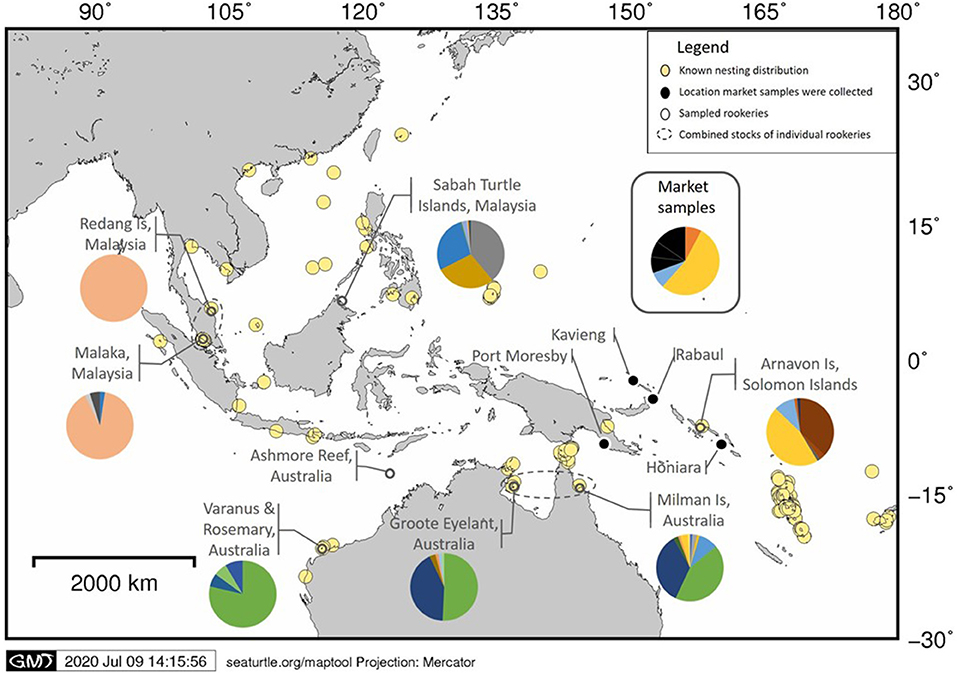
Figure 1. Map of the hawksbill nesting in the Asia-Pacific. The pie-charts indicate the haplotype frequencies identified within the seven individual rookeries and the combined frequencies of all market samples used in this study. Also shown is the location of Ashmore Reef, Australia. Data on known nesting distribution obtained from https://www.seaturtlestatus.org/online-map-data (SWOT, 2020).
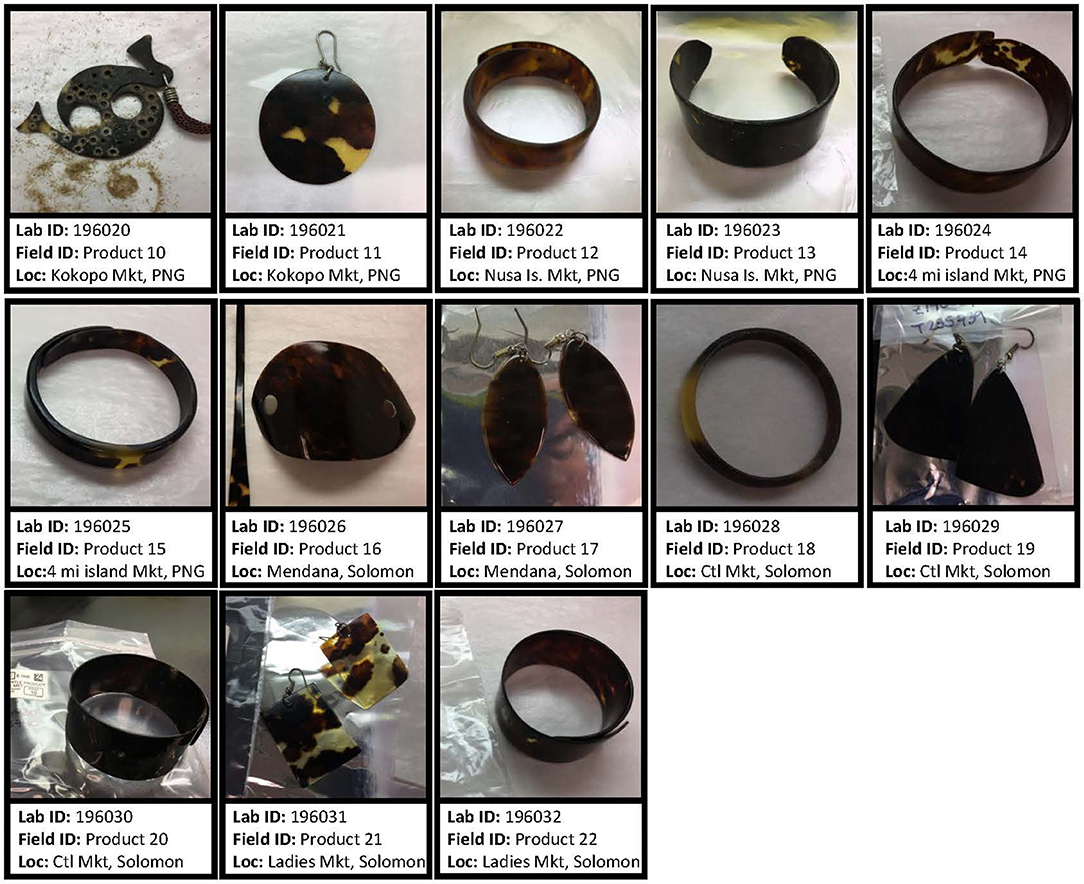
Figure 2. Hawksbill tortoiseshell products from markets in Papua New Guinea (PNG) and Solomon Islands that were used for DNA extraction. Sample identification and location of each market are identified.
All laboratory work was performed by the Marine Turtle Genetics Program at the Southwest Fisheries Science Center (SWFSC) in La Jolla, USA. Skin samples (using ~2 mm2 in size) were extracted following a NucleoMag® 96 Tissue Kit extraction protocol (Macherey-Nagel, cat. No. 744300.4) in a Pre-PCR genetics laboratory. All carapace and market samples were extracted and processed in a clean room laboratory that is only used for extraction and pre-PCR procedures of historical and ancient samples to minimize the risk of contamination (Morin et al., 2006). Although our ancient DNA (aDNA) laboratory is very specialized, this protocol can be followed in other sterile laboratories (Pre-PCR) if proper care and sterilization techniques are implemented to avoid contamination. For DNA extraction of the carapace and market samples, we utilized a commercial purchased DNeasy® Blood & Tissue kit, commonly used in genetic labs worldwide. This kit is an easy to follow, spin-column procedure designed for purification of total DNA from a variety of sample sources.
In the aDNA laboratory, we wore nitrile gloves, lab coat, safety googles, closed-toe shoes, and worked in a hood. All equipment (drill bits, forceps, racks) was sterilized by soaking in concentrated bleach followed by a distilled water rinse and working surfaces (drill, hood) were sterilized by wiping down with 10% bleach followed by 70% ethanol (EtOH) between each sample and gloves were changed before handling each new sample. A maximum of seven samples and one negative control were processed at one time to avoid contamination. The hood is used to prevent air-flow and cross-contamination of sample batches with UV light however another sterile surface could be used.
For the carapace and market sample extractions, we used a DNeasy® Blood & Tissue kit (cat. No. 69504, Qiagen) which contains buffers: ATL, AL, AW1, AW2, AE, proteinase K, filtered spin-columns, and collection tubes. We also used Dithiothreitol (DTT, 100 mg/mL molecular grade), 100% ethanol (EtOH), 70% EtOH, 10% bleach, distilled water, 1.7 ml microcentrifuge tubes, 1,000 μl single-channel pipette, 1,000 μl filtered pipette tips, 100 μl single-channel pipette, 100 μl filtered pipette tips, gloves (sterile, nitrile, or latex), weighing paper (standard lab grade, 10 cm2), aluminum foil (~30 cm2), analytical balance (high precision), forceps (stainless steel), rotary tool, or equivalent instrument (Black & Decker® RTX Rotary Tool), drill bits (multi-purpose conical tip, ¼ inch High Speed Cutter), centrifuge (Eppendorf 5417C), vortex mixer (Vortex-Genie 2 mixer, 120V), microcentrifuge tube rack, bucket for bleach rinse, paper towels and an UV hood. Be sure to prepare the kit reagents according to the directions prior to starting the extraction.
For the extraction, we followed a modified protocol (Shamblin et al., 2011) using the DNeasy® Blood & Tissue kit by completing the following steps.
Day one- Step (1) Clean each sample with 70% ethanol to remove any potential contaminants and let air dry. Step (2) Place a piece of aluminum foil (~30 cm2) on the work surface in the hood. Take a piece of weighing paper and fold into quarters. Then using the analytical balance, obtain the tare weight of the paper and place on top of the foil to catch drilled powder. Step (3) Use forceps to grip the sample if necessary. Make a series of small indentations in the sample utilizing a rotary tool (or equivalent instrument) with a multi-purpose conical tip until ~(0.6–1.0) grams of powder has been obtained. Drill speeds should be kept low and/or pause between indentations to avoid heating of the sample while drilling. Step (4) Carefully transfer the carapace powder from the folded weighing paper into a 1.7 ml microcentrifuge tube. Step (5) Discard the foil and weighing paper and sterilize all equipment and working surfaces as described above. Change gloves before processing the next sample. Proceed with handling each sample prior to moving onto the next step. Step (6) Using extreme caution, open one sample at a time and add 700 μl Buffer ATL, 40 μl proteinase K and 30 μl DTT to the powder using the appropriate pipettes and filtered pipette tips. Pulse vortex (5–10 s) and quickly spin down the samples in a centrifuge (10–15 s) until all material is removed from the lid. Step (7) Incubate overnight at 56°C in a dry heat block until completely lysed (~24 h).
Day two- Step (8) With the 1,000 μl pipette and filtered pipette tips, add 200 μl Buffer AL and pulse-vortex the samples (5–10 s) before incubating at 56°C for 10 min. Step (9) Spin samples in the centrifuge at 13,000 rpm for 1 min and then transfer the lysate (liquid) to a new 1.7 ml microcentrifuge tube leaving the solids behind. Step (10) Add 500 μl of 100% EtOH and mix by pulse vortexing. Do a quick-spin in the centrifuge (10–15 s) to make sure all liquid is removed from the lid. Step (11) This yields a large volume, so transfer half of the mixture into a DNeasy Mini spin column placed in a 2 ml collection tube (Qiagen kit). Step (12) Centrifuge at 8,000 rpm for 1 min and discard the flow-through liquid and collection tube. Then place the spin column on a new collection tube. Step (13) Repeat step 11 and 12 with the other half of the mixture. Step (14) Place the spin column in a new 2 ml collection tube and wash with 500 μl Buffer AW1. Step (15) Centrifuge at 8,000 rpm for 1 min and discard the flow-through liquid and collection tube. Step (16) Place the spin column in a new 2 ml collection tube and wash with 500 μl Buffer AW2. Step (17) Spin at 14,000 rpm for 3 min and discard the flow-through liquid and collection tube. Step (18) Transfer the spin column to a new, labeled 1.7 ml microcentrifuge tube. Step (19) Elute DNA by adding 100 μl Buffer AE and allow it to sit on the filter for 1 min, followed by a final centrifuge spin at 8,000 rpm for 1 min. Evenly space the tubes in the centrifuge and beware of 1.7 ml tube lids breaking off. If that should occur, simply transfer the DNA to a new 1.7 ml microcentrifuge tube. Step (20) Repeat step 19 with the same 100 μl Buffer AE for increased DNA yield. Step (21) Discard filter, close the lids and store the ready to use DNA in −20°C freezer for further processing. To assess the concentration of genomic DNA, we quantified the DNA using a QuBit® Flurometer and a high sensitivity double-stranded DNA (dsDNA) quantification kit which accurately measures dsDNA concentrations between 0.2 and 100 ng/μl.
We amplified the control region of the mitochondrial genome using polymerase chain reaction (PCR) methodologies with primers LCM-15382 (5′ GCT TAA CCC TAA AGC ATT GG 3′) and H950g (5′ GTC TCG GAT TTA GGG GTT TG 3′) (Abreu-Grobois et al., 2006) to obtain ~800 base pairs (bp) for all samples. All PCR reactions were carried out on Applied Biosystems® 2720 thermocyclers. PCR reactions consisted of 1× NH4 Reaction Buffer, 0.8 mM MgCl2, 0.6 mM each dNTPs, 0.3 μM primer LCM15382, 0.3 μM primer H950g, 0.8 mg/ml BSA, 10U Biolase DNAPol Taq and 1–20 ng (5 μl of 1:5 dilution) of template DNA. The carapace and market samples were amplified in a 50 μl reaction and remained in the Ancient DNA lab until amplification was completed. The skin samples were amplified in a 25 μl reaction. The PCR cycling parameters were as follows: initial 3 min DNA denaturation at 94°C, followed by 50 cycles (carapace and market DNA) or 30 cycles (skin DNA) of (1) 50 s denaturation at 94°C, (2) 50 s annealing at 56°C, and (3) 1 min extension at 72°C, with a final 5 min extension at 72°C. Negative controls were used in each PCR to detect any contamination. The PCR products were confirmed visually on 2% agarose gels stained with ethidium bromide (Maniatis et al., 1982). Purification of PCR products was done by combining 5 μl of PCR product with 2 μl of an Exonuclease I and Shrimp Alkaline Phosphatase solution (USB). The forward and reverse strands were cycle sequenced with an ABI® Big Dye™ Terminator v3.1 Cycle Sequencing Kit and analyzed with Applied Bio-systems® (model 3730) automated genetic analyzer.
We aligned, edited, and cropped the forward and reverse sequences at a standard cropping site of 766 bp (Frey et al., 2009) with the program Geneious R8.1.9 (Kearse et al., 2012). Each sequence was compared with published hawksbill sequences published on GenBank (http://blast.ncbi.nlm.nih.gov/Blast.cgi), as well as against a local database of yet unpublished reference sequences to identify the haplotype of each sample. For quality control purposes, all sequences were reviewed and haplotypes confirmed by two independent researchers. Haplotype assignments followed standardized nomenclature for hawksbill turtles in the Indo-Pacific using the prefix EiIP followed by the next sequential number. New haplotypes were submitted to the NCBI/Genbank database via BankIt (https://www.ncbi.nlm.nih.gov/WebSub/).
To test for temporal variability within, and genetic differentiation between the two nesting beach locations, we compared our data with previously published data from both Milman Island and Arnavon Island that used samples collected years prior (Vargas et al., 2016). We used two methods to measure population differentiation using Arlequin (v.3.5): a conventional FST test based on haplotype frequencies (Slatkin, 1995), and the Exact Test for population differentiation (Raymond and Rousset, 1995).
To determine the stock origin, we compared haplotypes obtained from the samples of interest to haplotypes identified from possible source populations. Within this study, we directly compared the carapace and market samples to previously published genetic stocks to indicate the most likely nesting origin. For a more rigorous assessment of stock origin, a Bayesian statistical approach, called mixed stock analysis (MSA), should be utilized to analyze haplotype data. However, a larger sample size of market samples and a more comprehensive reference of source populations are needed (see discussion).
Three haplotypes were detected in the Milman Island samples (n = 22). EiIP08 was the most common haplotype identified in 50% of the samples, followed by EiIP09 (40.9%) and EiIP07 (9.1%). Four haplotypes were identified in the Solomon Island samples (n = 28) with EiIP33 being the most common (53.6%) followed by EiIP03 (28.6%), EiIP34 (14.3%). EiIP138 is a new haplotype found in only one individual (Genbank ID: MT451986) (Supplementary Table 1). This study and previously reported studies indicate no significant differences in haplotype frequencies from samples collected at Milman Island in 2017 and those presented in Vargas et al. (2016) with samples collected between 1990 and 2010 (FST p = 0.6816 and Exact test p = 0.9819), nor samples collected at the Arnavon Island in 2017 and those presented in Vargas et al. (2016) with samples collected between 1990 and 2010 (FST p = 0.2842 and Exact test p = 0.4087). This suggests temporal stability in haplotype frequencies over time. Therefore, we combined samples from the two studies to increase the sample size of each rookery. After combining the data across years, the two rookeries remained significantly differentiated.
Because the carapace was presumed to yield low quality DNA we compared skin and carapace samples from the same individual for eight foraging turtles collected at the Howick Group foraging aggregation. DNA concentrations ranged from 0.68–2.86 ng/μl (skin) to 3.29–17.5 ng/μl (carapace) and given the difference in tissue size used for extraction, the DNA quantity is not directly comparable. The haplotype assignment from each tissue type were identical (Table 1) and there was no difference in the overall sequence quality. To define a sequence quality parameter, we looked at the Q30 score which infers a base call accuracy of 1 in 1,000 or 99.9%. When reviewing the trimmed chromatograms of the carapace samples, we calculated an average Q30 of 96.7% for the forward sequences and 96.3% for the reverse sequences. Four haplotypes were identified (EiIP03, EiIP24, EiIP33, EiIP64). Haplotype EiIP64 has not been identified in any nesting rookery to date and is therefore considered an “orphan” haplotype, meaning that it has yet to be identified in a nesting population and so the stock origin remains unknown at this point (Supplementary Table 1).
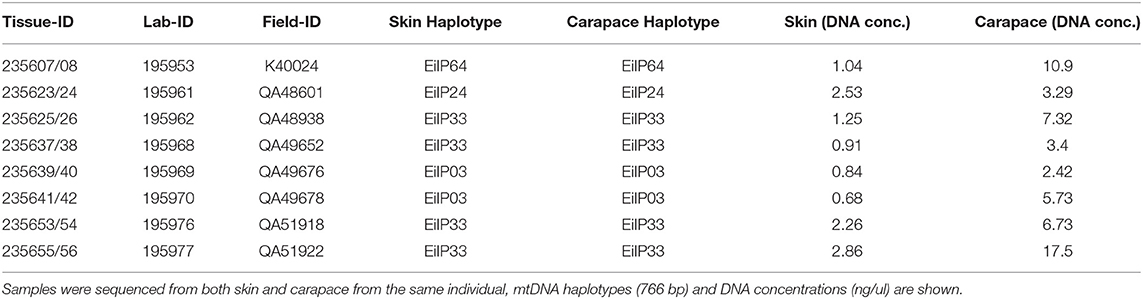
Table 1. In-water samples: Sample identification for 8 individual foraging turtles (Eretmochelys imbricata) collected at the Howick Group of Islands (HGI) on the Great Barrier Reef, Australia.
All 13 market samples processed had 100% successful amplification and sequencing of the mtDNA control region fragment (~800 bp; Table 2). The DNA concentrations ranged from undetected (<0.2 ng/ul) to 0.91 ng/ul. The QuBit quantification kit does not accurately measure dsDNA concentrations below 0.2 ng/μl, this DNA fell below that range (see discussion). All but one sample had good sequence quality overall and when assessing the trimmed chromatograms of the market samples, we calculated an average Q30 of 94.5% for the forward sequences and 94.1% for the reverse sequences. Six haplotypes (EiIP03, EiIP33, EiIP34, EiIP39, EiIP55, EiIP59) were identified within the market samples. EiIP33 was found in over half of the samples (53.8%), EiIP39 was found in two samples and all other haplotypes were observed in one sample each. EiIP55 has been found in nesting turtles from Ashmore Reef, located northwest of mainland Australia (FitzSimmons pers comm), however the data is currently unpublished and not included in the baseline dataset. EiIP39 and EiIP59 are considered to be orphan haplotypes and have only previously been found in the Howick Group foraging grounds (Bell and Jensen, 2018). The limited sample size and incomplete baseline prevents a rigorous statistical test to be completed at this point (e.g., mixed stock analysis). However, the 13 tortoiseshell products analyzed include nine samples with haplotypes identical to those found primarily at the Solomon Islands rookery and did not match those from nesting populations in Australia or SE Asia, with the exception of EiIP33 also found in 3% of turtles at Milman Island (Figure 1).
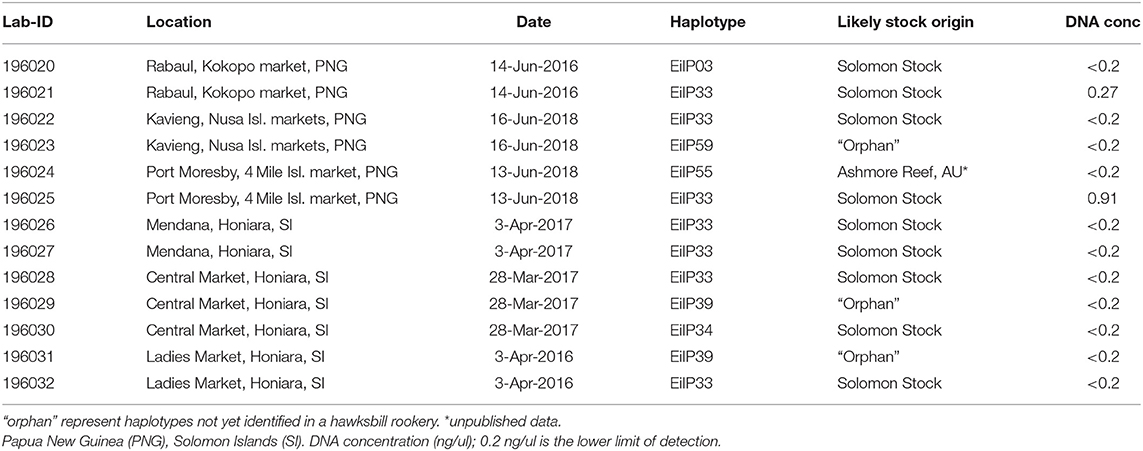
Table 2. Tortoiseshell products: SWFSC collection identification, location and date the products were acquired, mtDNA d-loop haplotype (766 bp) and likely stock origin for 13 hawksbill tortoiseshell products are shown.
The results of our study demonstrate an effective methodology for obtaining informative mtDNA control region sequences (~800 base pairs) from hawksbill turtle products. Our study provides a standardized protocol that can be scaled up for forensic conservation work. Obtaining the same size fragment and following common procedures provides a direct comparison of mtDNA sequences from tortoiseshell products with baseline data currently used to characterize nesting populations. Additionally, the use of a commercially available extraction kit ensures consistent methods that can be applied widely and easily. Using only a small sample of tortoiseshell products, we were able to trace the sample back to a likely stock origin. Of the 21 carapace samples (13 from products and 8 from live turtles) all but one produced good quality sequences and most products pointed to the Solomon Islands stock as a likely origin while excluding stocks in Australia and SE Asia (Figure 1). Although these market product samples showed low DNA concentrations (<0.2 ng/ul), they all successfully amplified for the 766 bp fragment, which is not uncommon with mtDNA. It is important to note that we measured DNA concentrations using a QuBit quantification kit which measures the intensity of fluorescent dye binding to double-stranded DNA (ds-DNA). It is possible that the market samples were chemically treated, heat treated or had slightly degraded DNA, which may have been inhibiting the quantification dye from attaching to the dsDNA (Nakayama et al., 2016). In cases where DNA is heavily degraded (e.g., very old samples or treated with intense heat) it might be necessary to use primer pairs that amplify shorter and less informative fragments of the d-loop. Several primers have been developed to amplify marine turtle control region fragments ranging from 384 to <900 bp (Abreu-Grobois et al., 2006).
While initial results give us high confidence in the feasibility of determining the nesting stock origin of tortoiseshell products, several challenges remain to be addressed before a meaningful analysis can be completed. Bayesian mixed stock analysis has routinely been used in marine turtle studies to determine the relative proportions of genetic stocks in a mixed sample from turtles collected at a foraging area or turtles caught as fisheries bycatch and can be applied to samples of tortoiseshell products. However, such probabilistic approaches have two important requirements. First, it is necessary to develop large genetic databases to provide representative haplotype frequencies for all [most] of the potential source populations, and secondly, the genetic markers used need to have sufficient discriminatory power to provide quantitative probabilities of assignment for a sample to each of those populations.
Sequencing of the mitochondrial control region has revealed significant global stock structure for hawksbill turtles (LeRoux et al., 2012; Gaos et al., 2016; Nishizawa et al., 2016; Vargas et al., 2016). However, sampling has been sparse for the Asia-Pacific region; only five genetic stocks have been identified and many information gaps remain (Figure 1). Given the broad distribution and breeding ecology of hawksbill turtles, notably throughout the Pacific, many of the numerous and isolated archipelagos that might provide suitable nesting or foraging habitat to hawksbill turtles are rarely visited by researchers. The existing baseline data provide only partial coverage of the stock origin and distribution of hawksbill rookeries.
For instance, a recent mtDNA study by Bell and Jensen (2018) suggested that hawksbill turtles foraging at the Howick group of islands in the northern Great Barrier Reef originated primarily from the Solomon Island stock. However, rookery baseline data for the Solomon Islands stock only consists of one nesting site (Arnavon Islands), and additional flipper-tag data clearly showed that the Howicks foragers actually nested at rookeries throughout the broader Bismarck-Solomon sea region (Bell and Jensen, 2018), indicating that the boundaries of the Solomon Islands nesting stock extend beyond the Arnavon Islands. As hawksbill nesting beaches (as a priority) and foraging grounds are more widely identified and sampled, our understanding of the geographical boundaries of each nesting stock will improve, providing the ability to more accurately trace turtles back to their nesting population of origin.
While all the tortoiseshell samples in this study matched known haplotypes, 23% of market samples have haplotypes only documented in foraging populations. Such haplotypes are considered orphan haplotypes and are of unknown stock origin at this point. The high percentage of orphan haplotypes illustrates the urgent need for more extensive sampling of rookeries in order to build a comprehensive reference database to allow our approach to be applied more effectively. Also, previous work describing the phylogeography of hawksbill turtles across the Indian and Pacific Oceans identified one common and widespread haplotype (EiIP33) that has been identified in stocks in Iran and across the Pacific Ocean (Gaos et al., 2016; Vargas et al., 2016) and could provide a challenge when trying to delineate stock contribution. Interestingly, EiIP33 is found in only a few rookeries across Asia-Pacific where it is common at the Solomon Islands (46%), rare at Milman Island (3%) and absent from all other sites published to date. As future studies extend our current knowledge of stock structure we will learn of the distribution of shared haplotypes (including EiIP33) and the extent of stock boundaries.
Nonetheless, the development of this protocol provides the first important step to trace back the stock origin of hawksbill products sold throughout Asia-Pacific and globally. In our study the items were donated from small local markets where turtles were likely sourced from local populations (foraging or nesting). In the Solomon Islands, the Arnavon Islands rookery is the largest in the oceanic South Pacific (Hamilton et al., 2015). Nearly devastated by the tortoiseshell trade, the government created a marine protected area and a trade ban on turtle products to protect this rookery, which has since shown signs of recovery. However, with high levels of legal turtle consumption and a lack of enforcement (Vuto et al., 2019), it is not surprising that turtle products continue to be illicitly sold and traded throughout the region.
Applying these methods more broadly to products at bigger trade hubs or those confiscated along trade routes will most certainly reveal a much broader pattern of use. Analyzing large stockpiles of illegal products from key trade hubs will shine light on the relative impact on regional stocks to both contemporary and historical trade (CITES Secretariat, 2019; Gomez and Krishnasamy, 2019).
Despite the current limitations of the baseline dataset described above, this technique now provides a means to use DNA to trace back the stock origin of tortoiseshell products. Currently, only five stocks representing seven individual rookeries make up the genetic reference for Asia-Pacific. Nevertheless, these five stocks are highly identifiable and show patterns of strong differentiation needed for an analysis of stock origin. Identifying and sampling remaining gaps is a key priority for further improving the application of the approach we describe here to conservation. Finally, work is underway to characterize hawksbill nesting population structure with nDNA, including microsatellite markers (Gaos et al., 2018b), and Single Nucleotide Polymorphism (SNP) markers (Komoroske et al., 2019). The emerging next-generation and whole-genome sequencing technologies will eventually allow the design of customized assays that can be applied for rapid, cost-effective, high throughput analysis that optimizes the use of the DNA obtained from tortoiseshell products with the methods tested here.
The datasets presented in this study can be found in online repositories. The names of the repository/repositories and accession number(s) can be found in the article/Supplementary Material. Raw sequence data that supports the findings of this study are available on Figshare: https://doi.org/10.6084/m9.figshare.13382948. Further inquiries can be directed to the corresponding author/s.
The animal study was reviewed and approved by DAF Animal Ethics Committees (AECs).
MJ, CM, and PD contributed to conception and design of the study. IB and CM contributed the samples. EL and AF performed the lab work. EL, MJ, and PD wrote the first draft of the manuscript. All authors contributed to manuscript revision, read, and approved it for publication.
This project was a partnership and funded by WWF-AU, NOAA, and RCL Cruise Liners Ltd.
The authors declare that this study received funding from RCL Cruise Liners Ltd. The funder was not involved in the study design, collection, analysis, interpretation of data, the writing of this article, or the decision to submit it for publication.
This work was established under WWF's Marine Turtle Use and Trade Initiative Shell Bank project, coordinated and hosted by WWF-Australia (WWF-AU). All laboratory work was performed by the Marine Turtle Genetics Program at the Southwest Fisheries Science Center (SWFSC) in La Jolla, USA. We wish to acknowledge J. Kinch (National Fisheries Authority, PNG), V. Rei (Conservation and Environment Protection Authority, PNG), K. Yaro (WWF-Papua New Guinea), S. Seeto (WWF-Solomon Islands), R. Hamilton and S. Vuto (The Nature Conservancy), and the Arnavon Community Marine Conservation Area rangers for assisting and facilitating sample collection, storage and delivery. We thank G. Serra-Valente for sample curation, V. Pease and A. Lanci for laboratory management and assistance, and K. Robertson for providing input on the manuscript (SWFSC-USA).
The Supplementary Material for this article can be found online at: https://www.frontiersin.org/articles/10.3389/fmars.2020.595853/full#supplementary-material
Abreu-Grobois, F. A., Horrocks, J. A., Formia, A., Dutton, P. H., LeRoux, R. A., Velez-Zuazo, X., et al. (2006). “New mtDNA d-loop primers which work for a variety of marine turtle species may increase the resolution of mixed stock analysis,” in In Book of abstracts: Twenty-Sixth Annual Symposium on Sea Turtle Biology and Conservation, eds M. Frick, A. Panagopoulou, A. F. Rees, and K. Williams (Crete: ISTS), 179.
Bell, I. P., and Jensen, M. P. (2018). Multinational genetic connectivity identified in western Pacific hawksbill turtles, Eretmochelys imbricata. Wildl. Res. 45, 307–315. doi: 10.1071/W.R.17089
CITES Secretariat (2019). “Status, scope and trends of the legal and illegal international trade in marine turtles, its conservation impacts, management options and mitigation priorities,” in Eighteenth (18th) Meeting of the CITES Conference of the Parties (Geneva), 18.
Clusa, M., Carreras, C., Pascual, M., Gaughran, S. J., Piovano, S., Avolio, D., et al. (2016). Potential bycatch impact on distinct sea turtle populations is dependent on fishing ground rather than gear type in the Mediterranean Sea. Mar. Biol. 163:122. doi: 10.1007/s00227-016-2875-1
Dutton, P. H., LeRoux, R. A., LaCasella, E. L., Seminoff, J. A., Eguchi, T., and Dutton, D. L. (2019). Genetic analysis and satellite tracking reveal origin of the green turtles in San Diego Bay. Mar. Biol. 166, 1–13. doi: 10.1007/s00227-018-3446-4
Dutton, P. H., Roden, S. E., Stewart, K. R., LaCasella, E. L., Tiwari, M., Formia, A., et al. (2013). Population stock structure of leatherback turtles (Dermochelys coriacea) in the Atlantic revealed using mtDNA and microsatellite markers. Conserv. Genet. 14, 625–636. doi: 10.1007/s10592-013-0456-0
Fields, A. T., Fischer, G. A., Shea, S. K. H., Zhang, H., Feldheim, K. A., and Chapman, D. D. (2020). DNA Zip-coding: identifying the source populations supplying the international trade of a critically endangered coastal shark. Anim. Conserv. 23, 670–678. doi: 10.1111/acv.12585
FitzSimmons, N. N., Pittard, S. D., Mcintyre, N., Jensen, M. P., Hamann, M., Kennett, R., et al. (2020). Phylogeography, genetic stocks, and conservation implications for an Australian endemic marine turtle. Aquat. Conserv. Mar. Freshw. Ecosyst. 30, 440–460. doi: 10.1002/aqc.3270
Foran, D. R., and Ray, R. L. (2016). Mitochondrial DNA profiling of illegal tortoiseshell products derived from hawksbill sea turtles. J. Forensic Sci. 61, 1062–1066. doi: 10.1111/1556-4029.13062
Frey, A., Dutton, P., LaCasella, E., LeRoux, R., and Abreu-Grobois, A. (2009). “Standardizing the mtDNA control region fragment for sea turtles: how long do sequences need to be,” in Proceedings of the Twenty-ninth Annual Symposium on Sea Turtle Biology and Conservation, eds L. Belskis, M. Frick, A. Panagopoulou, A. F. Rees, and K. Williams (Brisbane, QLD: NOAA Tech Memorandum NMFS-SEFSC), 79.
Gao, Y., and Clark, S. G. (2014). Elephant ivory trade in China: trends and drivers. Biol. Conserv. 180, 23–30. doi: 10.1016/j.biocon.2014.09.020
Gaos, A. R., Lewison, R. L., Jensen, M. P., Liles, M. J., Henriquez, A., Chavarria, S., et al. (2018a). Rookery contributions, movements and conservation needs of hawksbill turtles at foraging grounds in the eastern Pacific Ocean. Mar. Ecol. Prog. Ser. 586, 203–216. doi: 10.3354/meps12391
Gaos, A. R., Lewison, R. L., Liles, M. J., Gadea, V., Altamirano, E., Henríquez, A. V., et al. (2016). Hawksbill turtle terra incognita: conservation genetics of eastern Pacific rookeries. Ecol. Evol. 6, 1251–1264. doi: 10.1002/ece3.1897
Gaos, A. R., Lewison, R. L., Liles, M. J., Henriquez, A., Chavarría, S., Yañez, I. L., et al. (2018b). Prevalence of polygyny in a critically endangered marine turtle population. J. Exp. Mar. Biol. Ecol. 506, 91–99. doi: 10.1016/j.jembe.2018.06.004
Gomez, L., and Krishnasamy, K. (2019). A Rapid Assessment on the Trade in Marine Turtles in Indonesia, Malaysia and Viet Nam. Petaling Jaya: TRAFFIC.
Hamilton, R. J., Bird, T., Gereniu, C., Pita, J., Ramohia, P. C., Walter, R., et al. (2015). Solomon Islands largest hawksbill turtle rookery shows signs of recovery after 150 years of excessive exploitation. PLoS ONE 10:e0121435. doi: 10.1371/journal.pone.0121435
Harper, C., Ludwig, A., Clarke, A., Makgopela, K., Yurchenko, A., Guthrie, A., et al. (2018). Robust forensic matching of confiscated horns to individual poached African rhinoceros. Curr. Biol. 28, R13–R14. doi: 10.1016/j.cub.2017.11.005
Hitchens, R. T., and Blakeslee, A.M.H. (2020). Trends in illegal wildlife trade: Analyzing personal baggage seizure data in the Pacific Northwest. PLoS ONE 15:e0234197. doi: 10.1371/journal.pone.0234197
IOSEA (2014). “Illegal take and trade of marine turtles in the IOSEA region,” in Seventh Meeting of the Signatory States (Bonn: IOSEA), 57
Jabin, G., Singh, S. K., Ghosh, A., Basu, S., Chandra, K., and Thakur, M. (2019). Illegal trade of obscured bear parts: a case study of identifying the suspected bear gall bladders. Forensic Sci. Int. 1:100001. doi: 10.1016/j.fsir.2019.100001
Jensen, M. P., FitzSimmons, N. N., Bourjea, J., Hamabata, T., Reece, J., and Dutton, P. H. (2019a). The evolutionary history and global phylogeography of the green turtle (Chelonia mydas). J. Biogeogr. 46, 860–870. doi: 10.1111/jbi.13483
Jensen, M. P., LaCasella, E. L., Dutton, P. H., and Madden Hof, C. A. (2019b). Cracking The Code: Developing a Tortoiseshell DNA Extraction and Source Detection Method. Sydney, NSW: WWF.
Kearse, M., Moir, R., Wilson, A., Stones-Havas, S., Cheung, M., Sturrock, S., et al. (2012). Geneious basic: an integrated and extendable desktop software platform for the organization and analysis of sequence data. Bioinformatics 28, 1647–1649. doi: 10.1093/bioinformatics/bts199
Komoroske, L. M., Miller, M. R., O'Rourke, S. M., Stewart, K. R., Jensen, M. P., and Dutton, P. H. (2019). A versatile Rapture (RAD-capture) platform for genotyping marine turtles. Mol. Ecol. Resour. 19, 497–511. doi: 10.1111/1755-0998.12980
Korenblik, A., Leggett, T., and Shadbold, T. (2016). World Wildlife Crime Report 2016: Trafficking in Protected Species. Vienna: United Nations Office on Drugs and Crime. Available online at: https://goo.~gl/R6wLwm
LaCasella, E. L., Epperly, S. P., Jensen, M. P., Stokes, L., and Dutton, P. H. (2013). Genetic stock composition of loggerhead turtles Caretta caretta bycaught in the pelagic waters of the North Atlantic. Endanger. Species Res. 22, 73–84. doi: 10.3354/esr00535
LeRoux, R. A., Dutton, P. H., Abreu-Grobois, F. A., Lagueux, C. J., Campbell, C. L., Delcroix, E., et al. (2012). Re-examination of population structure and phylogeography of hawksbill turtles in the wider caribbean using longer mtDNA sequences. J. Hered. 103, 806–820. doi: 10.1093/jhered/ess055
Limpus, C. J., and Miller, J. D. (1990). The use of measured scutes of hawksbill turtles, Eretmochelys imbricata, in the management of the tortoiseshell (bekko) trade. Aust. Wildl. Res. 17:6, 633–639. doi: 10.1071/WR9900633
Maffucci, F., Kooistra, W. H. C. F., and Bentivegna, F. (2006). Natal origin of loggerhead turtles, Caretta caretta, in the neritic habitat off the Italian coasts, central Mediterranean. Biol. Conserv. 127:2, 183–189. doi: 10.1016/j.biocon.2005.08.009
Maniatis, T., Fritsch, E., and Sambrook, J. (1982). In Molecular Cloning: A Laboratory Manual. Laurel Hollow, NY: Cold Spring Harbor Laboratory Press.
Matsuzawa, Y., Kamezaki, N., Ishihara, T., Omuta, K., Takeshita, H., Goto, K., et al. (2016). Fine scale genetic population structure of loggerhead turtles in the Northwest Pacific. Endanger. Species Res. 30, 83–93. doi: 10.3354/esr00724
Miller, E. A., McClenachan, L., Uni, Y., Phocas, G., Hagemann, M. E., and Van Houtan, K. S. (2019). The historical development of complex global trafficking networks for marine wildlife. Sci. Adv. 5:eaav5948. doi: 10.1126/sciadv.aav5948
Miller, M. H., Carlson, J., Cooper, P., Kobayashi, D., Nammack, M., and Wilson, J. (2014). Status Review Report: Scalloped Hammerhead Shark (Sphyrna lewini). Silver Spring, MD: National Marine Fisheries Service; Office of Protected Resources, 133.
Milliken, T., and Shaw, J. (2012). The South Africa – Viet Nam Rhino Horn Trade Nexus: A Deadly Combination of Institutional Lapses, Corrupt Wildlife Industry Professionals and Asian Crime Syndicates. Johannesburg: TRAFFIC.
Morin, P. A., LeDuc, R. G., Robertson, K. M., Hedrick, N. M., Perrin, W. F., Etnier, M., et al. (2006). Genetic analysis of killer whale (Orcinus orca) historical bone and tooth samples to identify western U.S. ecotypes. Mar. Mamm. Sci. 22, 897–909. doi: 10.1111/j.1748-7692.2006.00070.x
Mortimer, J. A., and Donnelly, M. (2008). “Eretmochelys imbricata,” in The IUCN Red List of Threatened Species 2008. Cambridge: IUCN SSC Marine Turtle Specialist Group.
Nahill, B., von Weller, P., and Barrios-Garrido, H. (2020). The Global Tortoiseshell Trade. SEETURTLES.ORG/Too Rare To Wear. Global Tortoiseshell Report. Available online at: https://www.tooraretowear.org/
Nakayama, Y., Yamaguchi, H., Einaga, N., and Esumi, M. (2016). Pitfalls of DNA quantification using DNA-binding fluorescent dyes and suggested solutions. PLoS ONE 11:e0150528. doi: 10.1371/journal.pone.0150528
Nishant, K., Vrijesh, K., and Ajay, K. (2018). Wildlife Forensic: Current techniques and their limitations. J.Forensic Sci. Criminol. 5:4. doi: 10.15744/2348-9804.5.402
Nishizawa, H., Joseph, J., and Chong, Y. K. (2016). Spatio-temporal patterns of mitochondrial DNA variation in hawksbill turtles (Eretmochelys imbricata) in Southeast Asia. J. Exp. Mar. Biol. Ecol. 474, 164–170. doi: 10.1016/j.jembe.2015.10.015
Nowell, K., and Ling, X. (2007). Taming the Tiger Trade: China's Markets for Wild and Captive Tiger Products Since the 1993 Domestic Trade Ban. Hong Kong: TRAFFIC East Asia.
Rankin-Baransky, K., Williams, C. J., Bass, A. L., Bowen, B. W., and Spotila, J. R. (2001). Origin of loggerhead turtles stranded in the northeastern United States as determined by mitochondrial DNA analysis. J. Herpetol. 35:638. doi: 10.2307/1565903
Raymond, M., and Rousset, F. (1995). An exact test for population differentiation. Evolution 49, 1280–1283. doi: 10.1111/j.1558-5646.1995.tb04456.x
Shamblin, B. M., Dodd, M. G., Williams, K. L., Frick, M. G., Bell, R., and Nairn, C. J. (2011). Loggerhead turtle eggshells as a source of maternal nuclear genomic DNA for population genetic studies. Mol. Ecol. Resour. 11, 110–115. doi: 10.1111/j.1755-0998.2010.02910.x
Slatkin, M. (1995). A Measure of population subdivision based on microsatellite allele frequencies. Genetics 139, 457–462.
Stewart, K. R., LaCasella, E. L., Roden, S. E., Jensen, M. P., Stokes, L. W., Epperly, S. P., et al. (2016). Nesting population origins of leatherback turtles caught as bycatch in the U.S. pelagic longline fishery. Ecosphere 7:e01272. doi: 10.1002/ecs2.1272
SWOT (2020). The State of the World's Sea Turtles. On-line Map and Database. Availabkle online at: https://www.seaturtlestatus.org/online-map-data
Vargas, S. M., Jensen, M. P., Ho, S. Y. W., Mobaraki, A., Broderick, D., Mortimer, J. A., et al. (2016). Phylogeography, genetic diversity, and management units of hawksbill turtles in the Indo-Pacific. J. Hered. 107, 199–213. doi: 10.1093/jhered/esv091
Veríssimo, D., and Wan, A. K. Y. (2019). Characterizing efforts to reduce consumer demand for wildlife products. Conserv.Biol. 33, 623–633. doi: 10.1111/cobi.13227
Vuto, S., Hamilton, R., Brown, C., Waldie, P., Pita, J., Peterson, N., et al. (2019). A Report on Turtle Harvest and Trade in Solomon Islands. Honiara: The Nature Conservancy, 34.
Keywords: mtDNA, DNA extraction, wildlife trade, Eretmochelys imbricata, Asia Pacific, tortoiseshell
Citation: LaCasella EL, Jensen MP, Madden Hof CA, Bell IP, Frey A and Dutton PH (2021) Mitochondrial DNA Profiling to Combat the Illegal Trade in Tortoiseshell Products. Front. Mar. Sci. 7:595853. doi: 10.3389/fmars.2020.595853
Received: 17 August 2020; Accepted: 21 December 2020;
Published: 25 January 2021.
Edited by:
Sandie M. Degnan, The University of Queensland, AustraliaReviewed by:
Federico Alberto Abreu-Grobois, National Autonomous University of Mexico, MexicoCopyright © 2021 LaCasella, Jensen, Madden Hof, Bell, Frey and Dutton. This is an open-access article distributed under the terms of the Creative Commons Attribution License (CC BY). The use, distribution or reproduction in other forums is permitted, provided the original author(s) and the copyright owner(s) are credited and that the original publication in this journal is cited, in accordance with accepted academic practice. No use, distribution or reproduction is permitted which does not comply with these terms.
*Correspondence: Erin L. LaCasella, RXJpbi5MYUNhc2VsbGFAbm9hYS5nb3Y=
Disclaimer: All claims expressed in this article are solely those of the authors and do not necessarily represent those of their affiliated organizations, or those of the publisher, the editors and the reviewers. Any product that may be evaluated in this article or claim that may be made by its manufacturer is not guaranteed or endorsed by the publisher.
Research integrity at Frontiers
Learn more about the work of our research integrity team to safeguard the quality of each article we publish.