
95% of researchers rate our articles as excellent or good
Learn more about the work of our research integrity team to safeguard the quality of each article we publish.
Find out more
ORIGINAL RESEARCH article
Front. Mar. Sci. , 03 December 2020
Sec. Ocean Observation
Volume 7 - 2020 | https://doi.org/10.3389/fmars.2020.593512
This article is part of the Research Topic Solving Complex Ocean Challenges Through Interdisciplinary Research: Advances from Early Career Marine Scientists View all 42 articles
 Robert M. Levine1*
 Kristen E. Fogaren2†
 Johna E. Rudzin3
 Christopher J. Russoniello4*
 Dax C. Soule5
 Justine M. Whitaker6
Ocean observing systems are well-recognized as platforms for long-term monitoring of near-shore and remote locations in the global ocean. High-quality observatory data is freely available and accessible to all members of the global oceanographic community—a democratization of data that is particularly useful for early career scientists (ECS), enabling ECS to conduct research independent of traditional funding models or access to laboratory and field equipment. The concurrent collection of distinct data types with relevance for oceanographic disciplines including physics, chemistry, biology, and geology yields a unique incubator for cutting-edge, timely, interdisciplinary research. These data are both an opportunity and an incentive for ECS to develop the computational skills and collaborative relationships necessary to interpret large data sets. Here, we use observatory data to demonstrate the potential for these interdisciplinary approaches by presenting a case study on the water-column response to anomalous atmospheric events (i.e., major storms) on the shelf of the Mid-Atlantic Bight southwest of Cape Cod, United States. Using data from the Ocean Observatories Initiative (OOI) Pioneer Array, we applied a simple data mining method to identify anomalous atmospheric events over a four-year period. Two closely occurring storm events in late 2018 were then selected to explore the dynamics of water-column response using mooring data from across the array. The comprehensive ECS knowledge base and computational skill sets allowed identification of data issues in the OOI data streams and technologically sound characterization of data from multiple sensor packages to broadly characterize ocean-atmosphere interactions. An ECS-driven approach that emphasizes collaborative and interdisciplinary working practices adds significant value to existing datasets and programs such as OOI and has the potential to produce meaningful scientific advances. Future success in utilizing ocean observatory data requires continued investment in ECS education, collaboration, and research; in turn, the ECS community provides feedback, develops knowledge, and builds new tools to enhance the value of ocean observing systems. These findings present an argument for building a community of practice to augment ECS ocean scientist skills and foster collaborations to extend the context, reach, and societal utility of ocean science.
Ocean observatory data can enhance our capacity for addressing critical issues such as climate change, ecosystem variability, and ocean acidification. Exploring the coupling between the ocean and atmosphere, and biochemical cycles has historically depended on ship-based point measurements (e.g., Smith et al., 2019), which are limited in the timing and duration over which they are collected (e.g., Ganse et al., 2019; Venkatesan et al., 2019). Further, ship-based operations are limited by the number of contemporaneous observations, which depend on instrument availability and competition for time and space on research cruises. The move toward sensor-based, multi-annual ocean observing is essential for the collection of the collocated physical, biological, geological, and chemical measurements needed to holistically characterize these dynamic systems (Benway et al., 2019) and to validate and improve coupled physical-biogeochemical models (Fennel et al., 2006). Continued innovations in the miniaturization and automation of sensors, and introduction and improvement of observation platforms like tethered observatories and autonomous vehicles, have allowed remote collection of an increasingly diverse range of continuous datasets across large spatiotemporal scales and a wider range of conditions. Ocean observatory data are a solution to the scientific pitfalls of historical, ship-based data collection because they: (1) provide long-term sampling of a designated area, even during inaccessible time periods; (2) can be outfitted with sensors for interdisciplinary science (e.g., Davidson et al., 2019; Venkatesan et al., 2019); and (3) are built with the capacity to span research themes (e.g., National Science Foundation’s Research Areas1) that have traditionally been funded through separate sources.
Ocean observing systems, such as the National Science Foundation’s Ocean Observatories Initiative (OOI) arrays, measure key variables for describing drivers and exchanges from the air-sea interface to the seafloor. The high-quality data collected by the variety of sensors on the arrays is freely available, distributed in near real-time, and accessible to all members of the global oceanographic community. These arrays give scientists unprecedented access to explore the seafloor, water column, and air-sea interface over multi-year periods. Sea-state, weather, and vessel capability all limit data collection from ships to periods of relatively calm weather conditions resulting in data gaps during extreme weather events (e.g., Ondoa et al., 2019) that have a disproportionate influence on ocean systems (e.g., Ward et al., 2020), coastal infrastructure (e.g., Gough et al., 2019; Mendez-Tejeda et al., 2020), and coastal ecology (Adame et al., 2019; Yang et al., 2020). Ocean observing arrays are beginning to fill these gaps by continuously measuring parameters during these local or global events when observations would traditionally be limited. By improving coverage and consistency of data through remote observation, the ocean science community can better provide valuable information such as tsunami warnings, and potential impacts on human health and economically important fisheries (Ruhl et al., 2011).
The advantages of observatory data extend beyond traditional scientific merit by increasing the equitability of data access. For researchers and educators with resource limitations, observatory systems provide continuous access to state-of-the-art instrumentation and openly available data, which expands the opportunities for engagement with the larger research community. These observatory systems provide additional opportunities to include ocean data into undergraduate education and research (Greengrove et al., 2020) in a way that previously was only available to those who could collect data directly. For many scientists and educators at resource-limited institutions, lack of access to funding and instrumentation is common. Additionally, many with physical limitations traditionally cannot participate in fieldwork, even if the opportunity is provided (Nature Geoscience, 2015). During the current COVID-19 pandemic, this lack of access is being experienced even by those who typically have resources to permit and participate in expensive fieldwork (Geib, 2020; Nature Geoscience, 2020). While field work has been limited, ocean observatories have continued to provide direct observations for scientists, stakeholders, and students alike.
This democratization of ocean data offers distinct advantages to early career scientists (ECS) interested in addressing interdisciplinary problems. ECS are often on short-term contracts (i.e., the “postdoc treadmill,” Radetsky, 1994) and need a high rate of research output for any hope of career advancement (e.g., Radetsky, 1994; Lawrence, 2003; Bodmer et al., 2019). Traditional costs associated with software, consumables, travel, cruise operations, and sample processing create obstacles which intensify the pressure to produce scientific results. Freely available observatory data provides an opportunity for ECS to explore important scientific questions without incurring many of the costs and challenges that are widely seen as barriers to career advancement and disproportionately impact the least privileged within the science community (Ginther et al., 2011).
Some of our most pressing oceanographic questions require interdisciplinary approaches that are well-suited for the application of ocean observatory data (Trowbridge et al., 2019). Though the quantity and breadth of sensor data currently available often require a range of expertise that few individual scientists possess, collaboration can be leveraged effectively to create useful interdisciplinary results. The ability to access, process, analyze, and interpret open-source observatories data can yield rich and interdisciplinary interpretation of results. Of great value to ECS, and the greater ocean science community, is the establishment of a clear pathway for developing interdisciplinary projects (e.g., networking, mentorship, training hubs) with workable, open-source analyses and effective communication pipelines.
Freely available data creates an incentive to harness a larger set of collective intellects and an opportunity to implement diverse approaches and experiences. Open-source community tools and resources permit science that depends more on innovation and ideas than on funding and past research success. In the age of ‘big data,’ data science skills are key to extracting important patterns; analytical techniques such as clustering, classification, anomaly detection, and frequent pattern mining make it feasible to extract useful information from oceanographic datasets that are often noisy or incomplete (Leung et al., 2014; Liu et al., 2017; Harris et al., 2019; Jiang et al., 2019). These techniques allow for efficient long-term time-series analyses over a range of frequencies to identify anomalous data and systematically identify co-variant patterns that require further investigation. These anomalous data also serve as a starting point for identifying previously unrecognized patterns and allow a systems-approach exploration of the unknown (Leung et al., 2014). Despite the volume and presence of collocated sensors on OOI platforms, modern data science workflows are still new to the oceanographic community, and thus efforts to address broad questions by mining OOI datasets for observations of interest have been limited. By leveraging the diverse skills and backgrounds of interdisciplinary research teams, we can better explore and interpret the results of these data-driven methods.
The OOI-ECS2 is a community of ECS students, researchers, and faculty who bring backgrounds in geology, biology, chemistry, and physics, and a range of data analysis tools and experience. We lean on the collective background of OOI-ECS members to demonstrate the potential for ECS to perform open-source and interdisciplinary science, which takes advantage of the large data volumes collected by the OOI arrays. Here, we demonstrate the potential for these interdisciplinary approaches using OOI data by presenting a case study on the water-column impacts of anomalous atmospheric events (i.e., major storms) on the shelf of the Mid-Atlantic Bight southwest of Cape Cod, United States. Using data from the OOI Pioneer Array, we applied a simple data mining method to examine Gulf Stream dynamics in which we: (1) identify anomalous atmospheric events over a multi-year time range; (2) investigate the variability in ocean responses to those events; and (3) identify the dynamics of those responses over large spatial scales. This study aims to demonstrate the opportunity for ECS to make meaningful scientific contributions through the development and application of cutting-edge data-exploration techniques within a resource-limited environment.
The Pioneer Array3 (39° 40′N, 70° 40′W) footprint spans the outer continental shelf, shelfbreak, and upper slope of the Mid-Atlantic Bight southwest of Cape Cod, United States (Trowbridge et al., 2019). The array consists of seven sites, four cross-shelf sites on the downstream (west) transect and three upstream along a parallel cross-shelf transect, with an ocean depth range of 92–452 m (Figure 1; Table 1). Each site contains sub-surface profiler moorings, and three of these sites also contain buoys equipped with surface, near-surface, and seafloor instrumentation. All instruments are typically replaced during maintenance cruises each spring and fall.
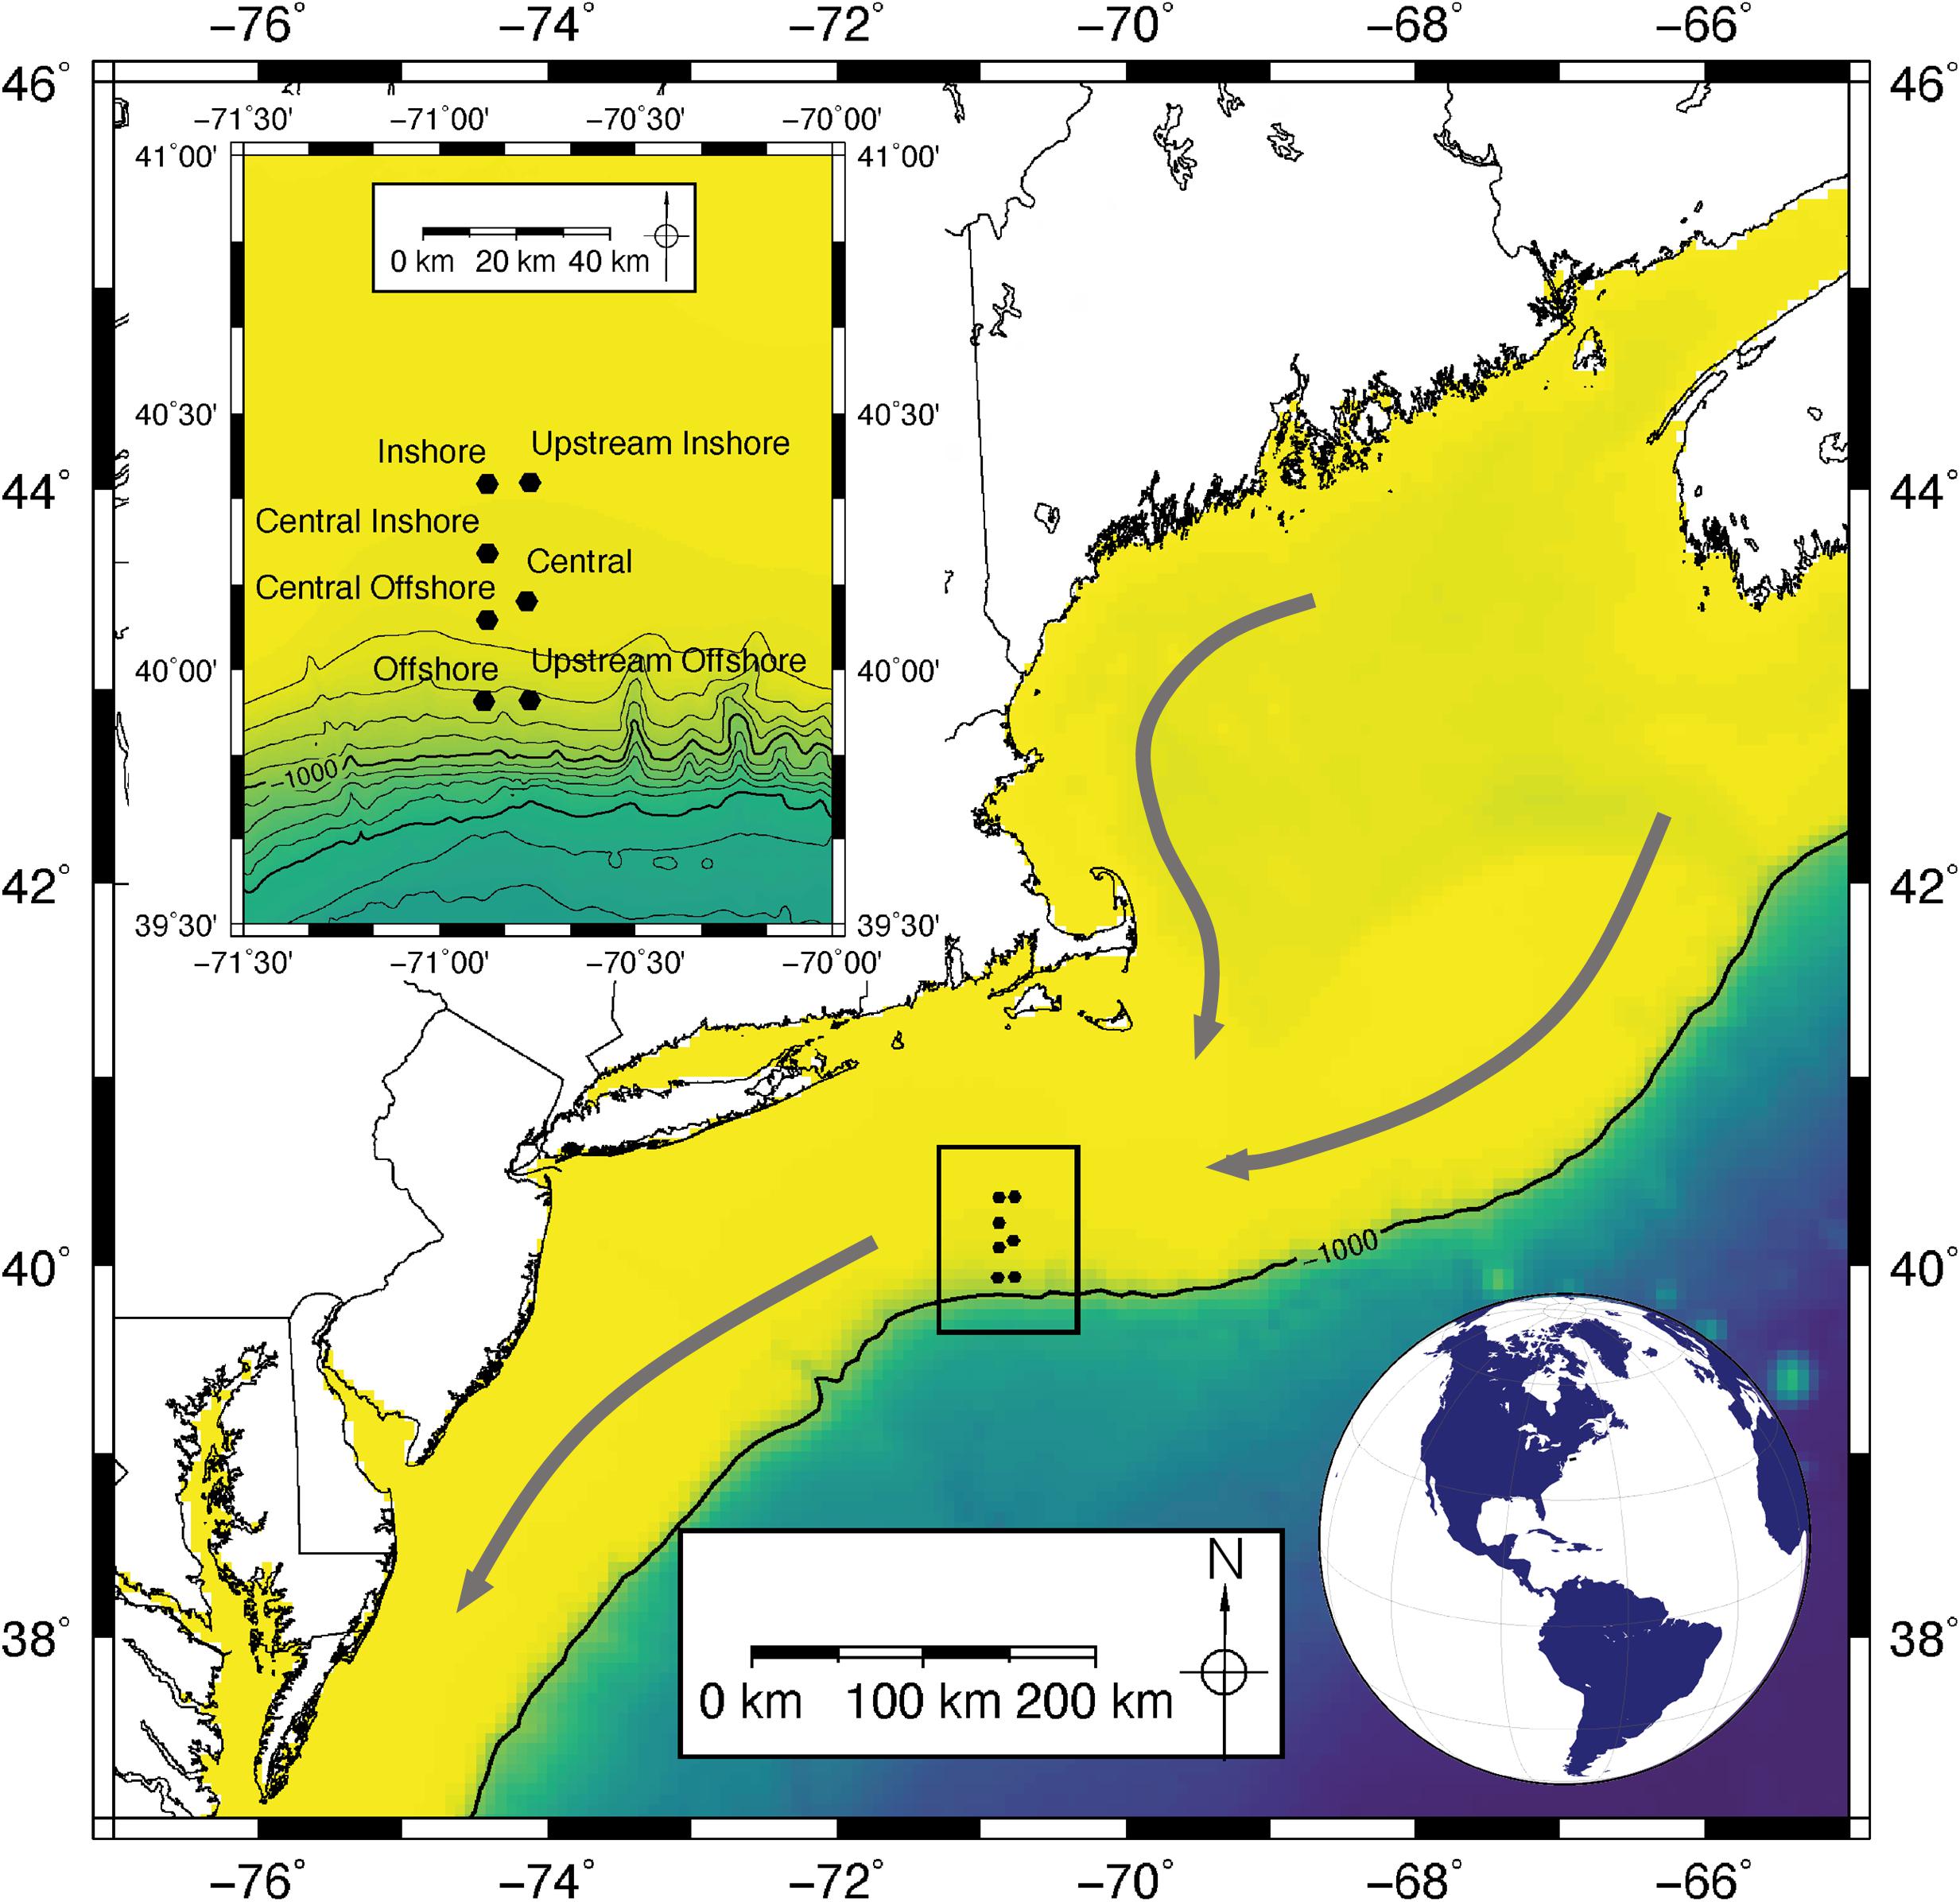
Figure 1. Map of the northeast US continental shelf and slope with the location of the OOI Pioneer Array (black circles). The black box indicates the region of the inset map (upper left) showing the location and names of the moorings relative to the shelf slope. Gray lines indicate the approximate path and direction of the coastal current. Figure modified from Gawarkiewicz and Plueddemann (2020).

Table 1. Site summary of Pioneer Array moorings.
The scientific motivation for the establishment of the Pioneer Array was to investigate how shelf/slope exchange processes structure the physics, chemistry, and biology of continental shelves (ORION Executive Steering Committee, 2007). This region of the northwest Atlantic is highly dynamic, with shelfbreak exchange driven by interactions with warm-core rings emanating from the Gulf Stream (Joyce, 1984), instabilities along the shelfbreak front (e.g., Lozier et al., 2002; Fratantoni and Pickart, 2003), and regional wind forcing (Lentz, 2008; Dzwonkowski et al., 2009). This exchange results in high levels of biological productivity driven by increased nutrient input (Hoarfrost et al., 2019). In addition to monitoring the impact of changing climate on the long-term variability of shelfbreak dynamics (Pershing et al., 2015; Gawarkiewicz et al., 2018; Harden et al., 2020), the Pioneer Array provides an opportunity to investigate short-term events with significant societal implications such as hurricanes and winter storms (Gawarkiewicz and Plueddemann, 2020). Fundamental questions exist about how severe storms and other episodic mixing processes affect the water column (ORION Executive Steering Committee, 2005) and how these storms are evolving in response to anthropogenic climate change (Collins et al., 2019).
To investigate the influence of low atmospheric pressure systems on surface and subsurface water-column responses on the shelf, we used measurements of sea surface temperature (SST), near-surface atmospheric humidity and temperature, wind speed and direction, barometric pressure, and latent and sensible heat fluxes recorded at surface moorings. Data obtained from the meteorological package, located 3 m above sea level on the surface moorings, at both the inshore and central mooring sites, were downsampled to a temporal resolution of 1-h and 3-h, respectively. Subsurface measurements of seawater temperature, salinity, dissolved oxygen (DO), and colored dissolved organic matter (CDOM) were recorded on wire-following profiler moorings across the array. Wire-following profilers moved through the water column from 3 m above the seafloor to 15 m below the sea surface at three-hour intervals for a total of 8 profiles a day. Instruments turned on at their parked depth for 2 min before moving upward through the water column. Once at 15 m below the sea surface, the profiler parked and sampled for 2 min before powering off for 5 min. Instruments were then turned back on for 2 min before the profiler moved downward through the water column. At its parked depth, the instruments continued to sample for 2 min before shutting down. While moving along the mooring riser, an instrument sampling at 1-Hz results in depth profiles with a vertical resolution of 0.25 m.
Low-pressure atmospheric anomalies were defined as all measurements below 3 times the standard deviation (e.g., Sagoolmuang and Sinapiromsaran, 2017) of the mean barometric pressure of the ∼4-year time series and identified at the inshore site (Figure 2). During this period from May 2015 thru August 2019, a total of 28 anomalous events were detected using all available instrument-recovered data (data not shown). The subset of data analyzed for this study were the eight anomalous atmospheric events detected in 2018, which was the last calendar year of instrument-recorded data available. These anomalous events included a bomb extratropical cyclone (Sanders and Gyakum, 1980), an extratropical storm, and several nor’easters, blizzards, and intense winter storms (Figure 2).
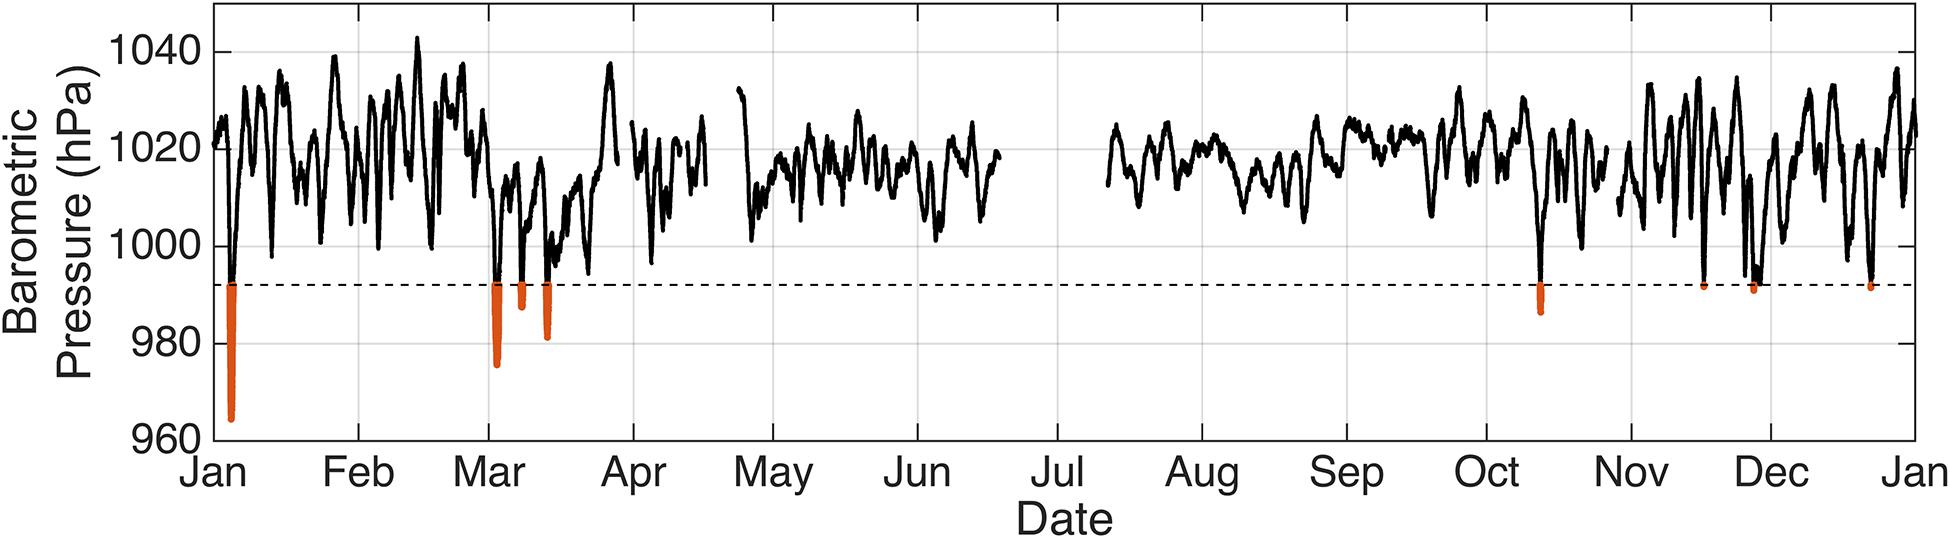
Figure 2. Hourly barometric pressure measurements (hPa) from the surface buoy at the inshore site for 2018. Orange data points below the dashed line indicate anomalous events (see text for definition).
The specific events selected for this study were chosen based on coinciding data stream availability. Only data that passed the internal OOI quality assurance was used. To further investigate the integrity of the data, we compared overlapping data from the three scheduled maintenance cruises in November 2017, April 2018, and November 2018 (deployments 9 thru 11). Data quality issues were identified starting at the end of July 2018 that affected the 3-wavelength fluorometer on the wire-following profiler at the central offshore site. These issues continued until the recovery and replacement of the instrument in early November 2018. The improved performance of the new sensors deployed during this maintenance cruise (deployment 11) led to greater confidence in the data being acceptable for robust scientific analysis. Hence, the anomalous events of November 2018 (herein referred to as Event 1 and Event 2) were chosen for this study.
For each event, we compared the impact on subsurface conditions using water-column data from wire-following profilers for before, during, and after the event. A mean water-column profile from the up- and downcast closest to local noon (1600 UTC) on the day of the peak of the anomalous event was used for each event. Profiles were also taken both 48 h before and after each peak (also at local noon) to investigate ocean response. Data from wire-following profiles were also used to create two-dimensional time series of water-column profiles using a linear interpolation of water-column data at a 1.5-m depth interval and a 3-h time interval grid.
Two auxiliary datasets were used to compare and verify oceanic data from the OOI array. First, climatological temperature, salinity, and DO for the month of November were obtained from the World Ocean Atlas 2018 (WOA18; Garcia et al., 2019; Locarnini et al., 2019; Zweng et al., 2019). WOA18 is a gridded climatological ocean analysis of subsurface ocean variables at standard depths that contains data from 1955 to 2017. The gridded resolution for the temperature, salinity, and DO data retrieved from WOA18 for this study were 0.25°, 0.25°, and 1°, respectively. Temporal averaging for temperature and salinity occurs over 2005–2017 whereas temporal averaging for DO is over the entire WOA18 time range (1955–2017). Second, daily satellite SSTs were obtained from the Jet Propulsion Laboratory’s PODAAC Group for High Resolution SSTs (GHRSST) Level 4 MUR (JPL Mur MEaSUREs Project, 2015) to provide a broader spatial context to the variability observed across the Pioneer Array moorings. This product provides daily 1-km blended level 4 global SST analyses and was chosen for its high resolution and ability to resolve oceanic fronts and SST variability in cloudy environments (such as during storm events) through incorporation of microwave sensor data (Schowengerdt, 2007).
We detected two anomalous events of similar magnitude during November 2018 with barometric lows of 991.8 hPa and 991.0 hPa, respectively (Figures 2, 3A). Event 1 occurred on 16 November 2018 and corresponded with the movement of a winter storm over the northwest Atlantic. Event 2 occurred on 27 November 2018. Analyses conducted for Event 1 span from 14 Nov 2018 to 18 Nov 2018; analyses conducted for Event 2 span from 26 Nov 2018 to 30 Nov 2018. “Pre-event” for Event 1 and Event 2 is 14 Nov and 26 Nov, respectively. “Post-event” for Event 1 and Event 2 is 17 Nov and 28 Nov, respectively.
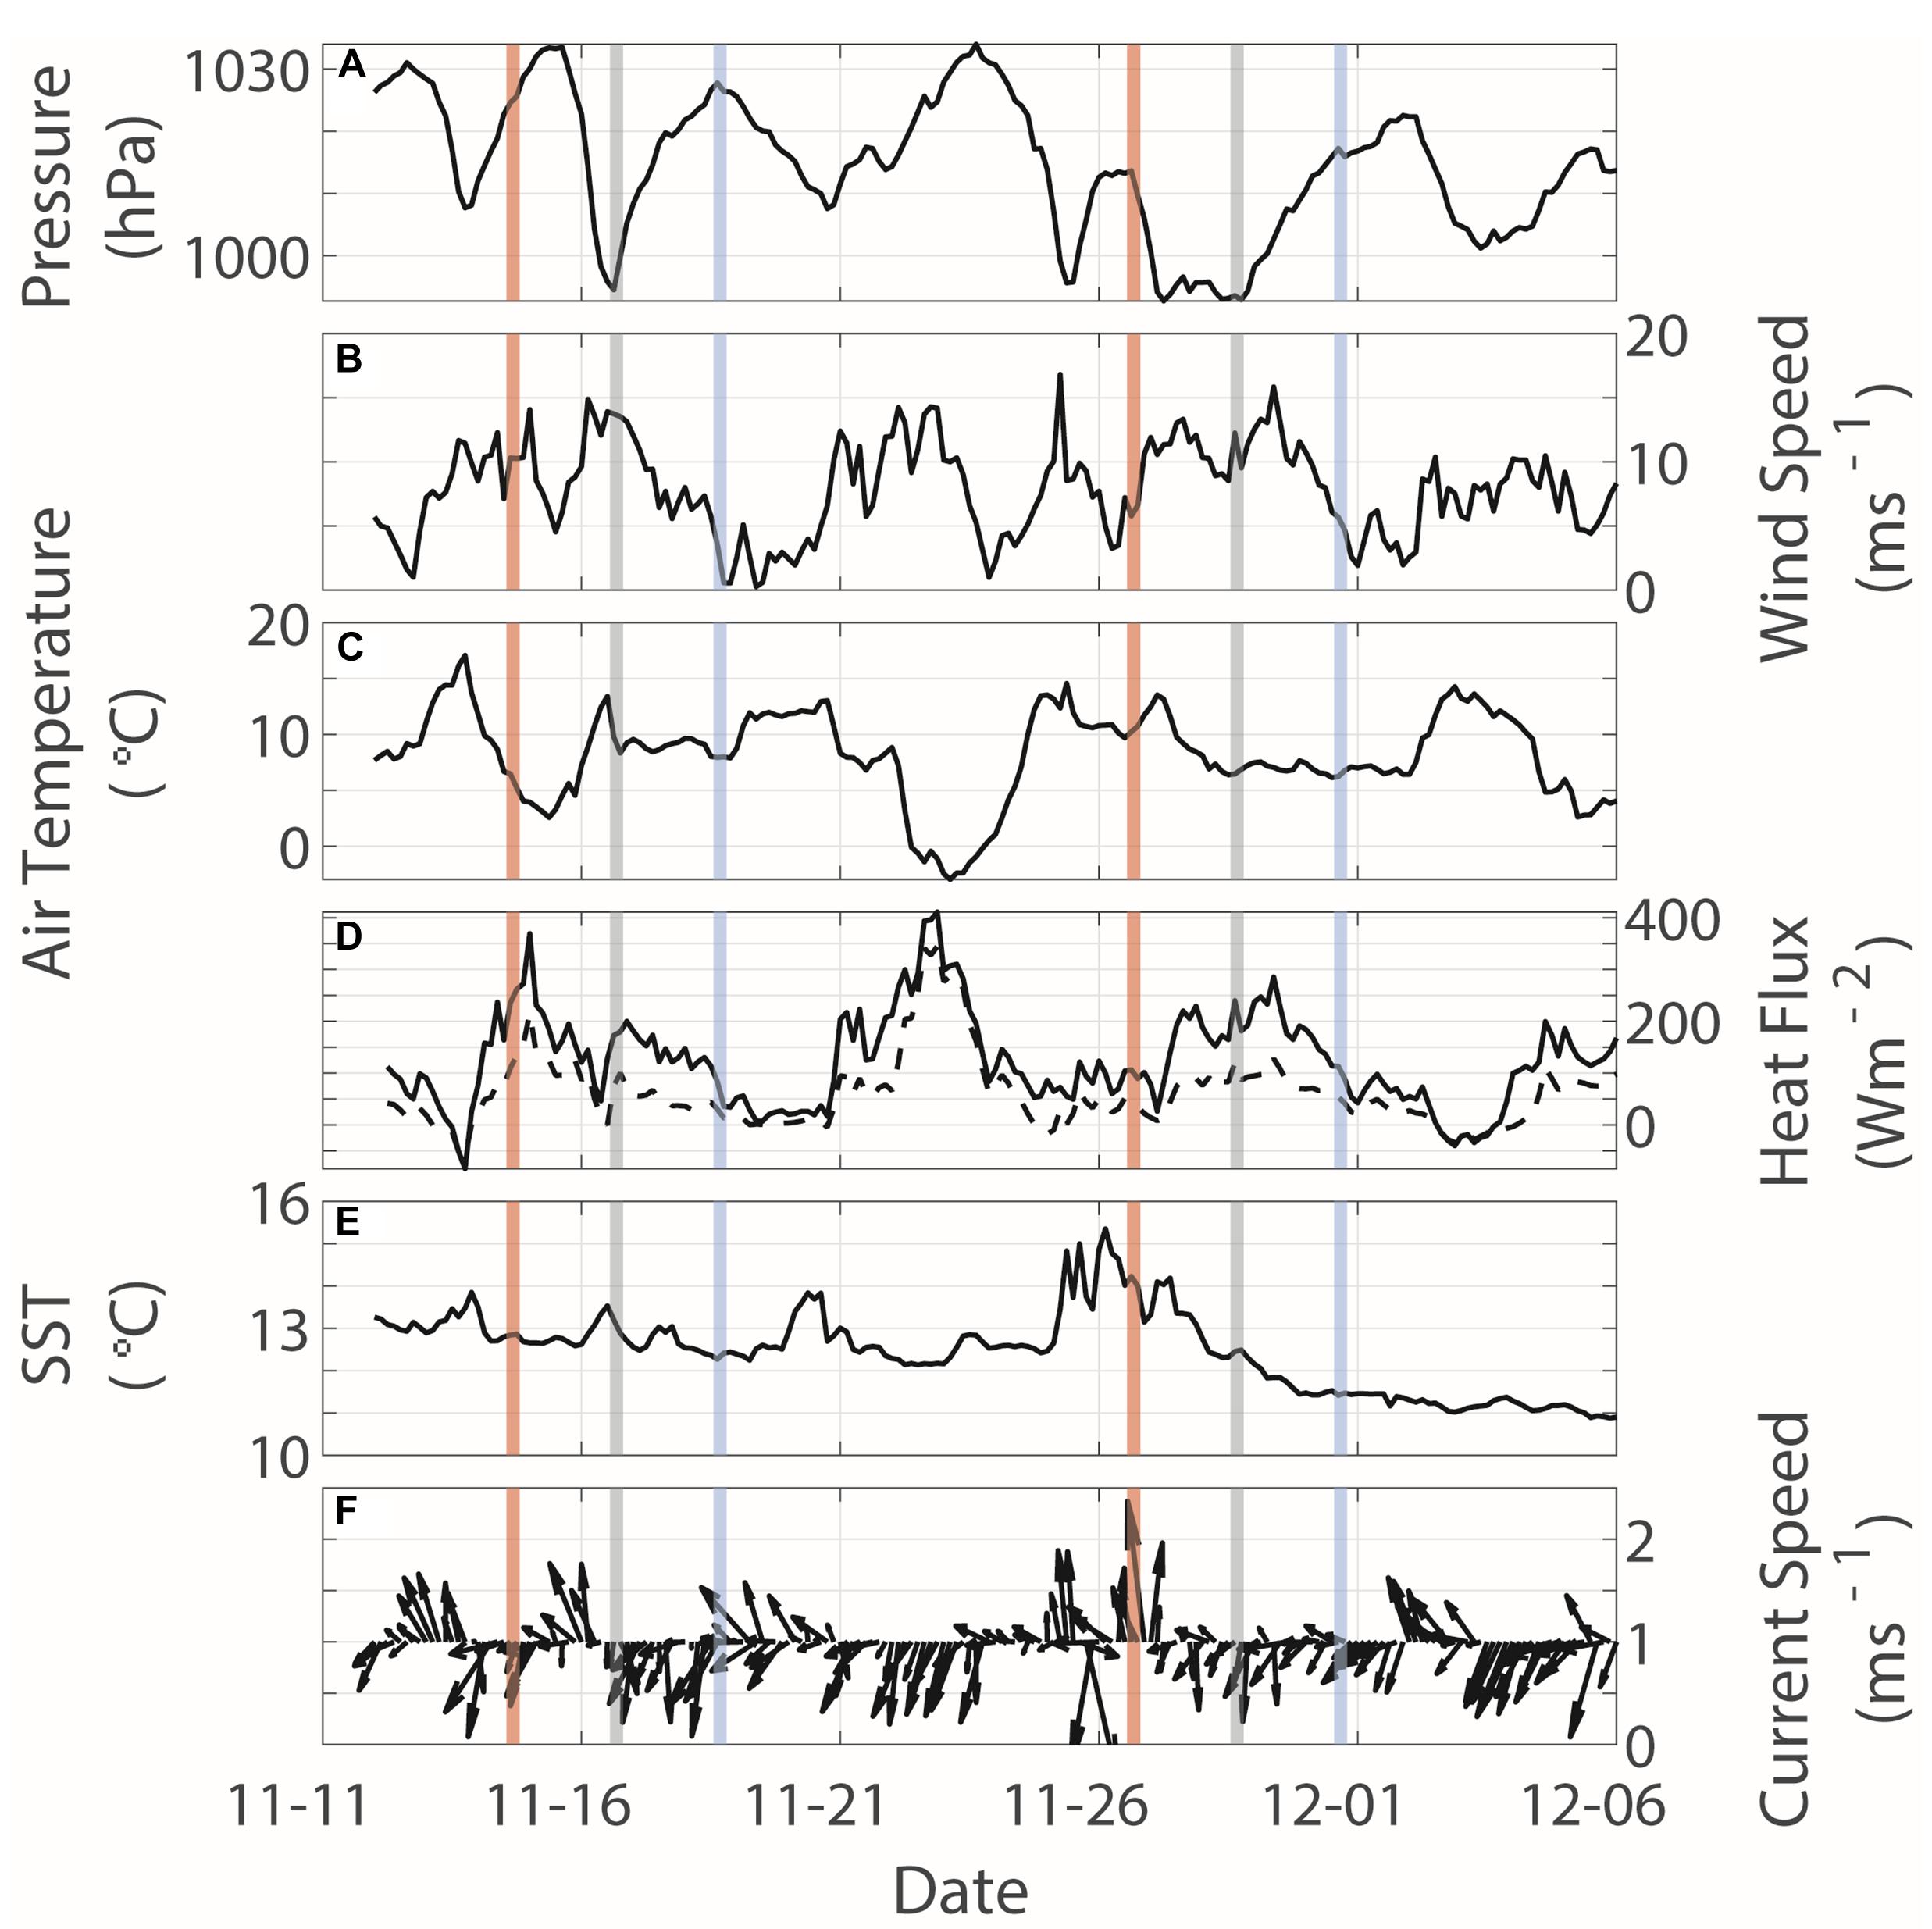
Figure 3. Time series of (A) atmospheric barometric pressure (hPa), (B) wind speed (ms−1), (C) air temperature (°C), (D) fluxes of latent (solid line) and sensible (dashed line) heat (Wm−2), (E) sea surface temperature (SST, °C), and (F) surface current speed (ms−1) and direction from central surface mooring site. Vertical lines indicate the time 48 h before (red), during (gray), and 48 h after (blue) each event.
At the central surface mooring site, wind speed peaked (14.9 m s–1) 12 h prior to the atmospheric pressure anomaly, indicating the onset of Event 1 (Figures 3A,B). Air temperature substantially decreased from 17.1°C (13 Nov 18Z) to 2.6°C (15 Nov 9Z) prior to Event 1. Increased winds and reduced air temperatures are associated with an increase in latent and sensible heat flux out of the ocean prior to Event 1 passage (peak values 369.1 W m–2 and 215.8 W m–2, respectively, on 15 Nov 0Z). The synchrony between these two fluctuations and the peak in wind speed indicated a loss of ocean heat to the atmosphere (Figures 3C,D), which is supported by a small drop in pre-event SST observed at the array at the time of peak heat flux (12.8°C on 14 Nov 15Z to 12.7°C on 15 Nov 0Z, Figure 3E). Satellite SST (Figure 4A) confirmed this cooling was widespread, constrained not only to the mooring array but across the shelf and Gulf of Maine. By the time of Event 1, both air temperature and SST had warmed to similar values of 13.4°C and 13.5°C, respectively, causing a reduction in latent and sensible heat fluxes at the central surface mooring site to approximately 128.4 W m–2 and 0.0 Wm–2, respectively. Satellite SST shows the presence of a warm mesoscale feature just south of the mooring site during and after Event 1, which possibly led to anomalously warm SST observed during that time. Warming of SST during Event 1 from pre-Event 1 temperatures could possibly be tied to pre-event northwesterly surface currents (Figure 3F) advecting these warmer waters across the shelfbreak (further examined in section “Spatial Variations in Event Impacts”).
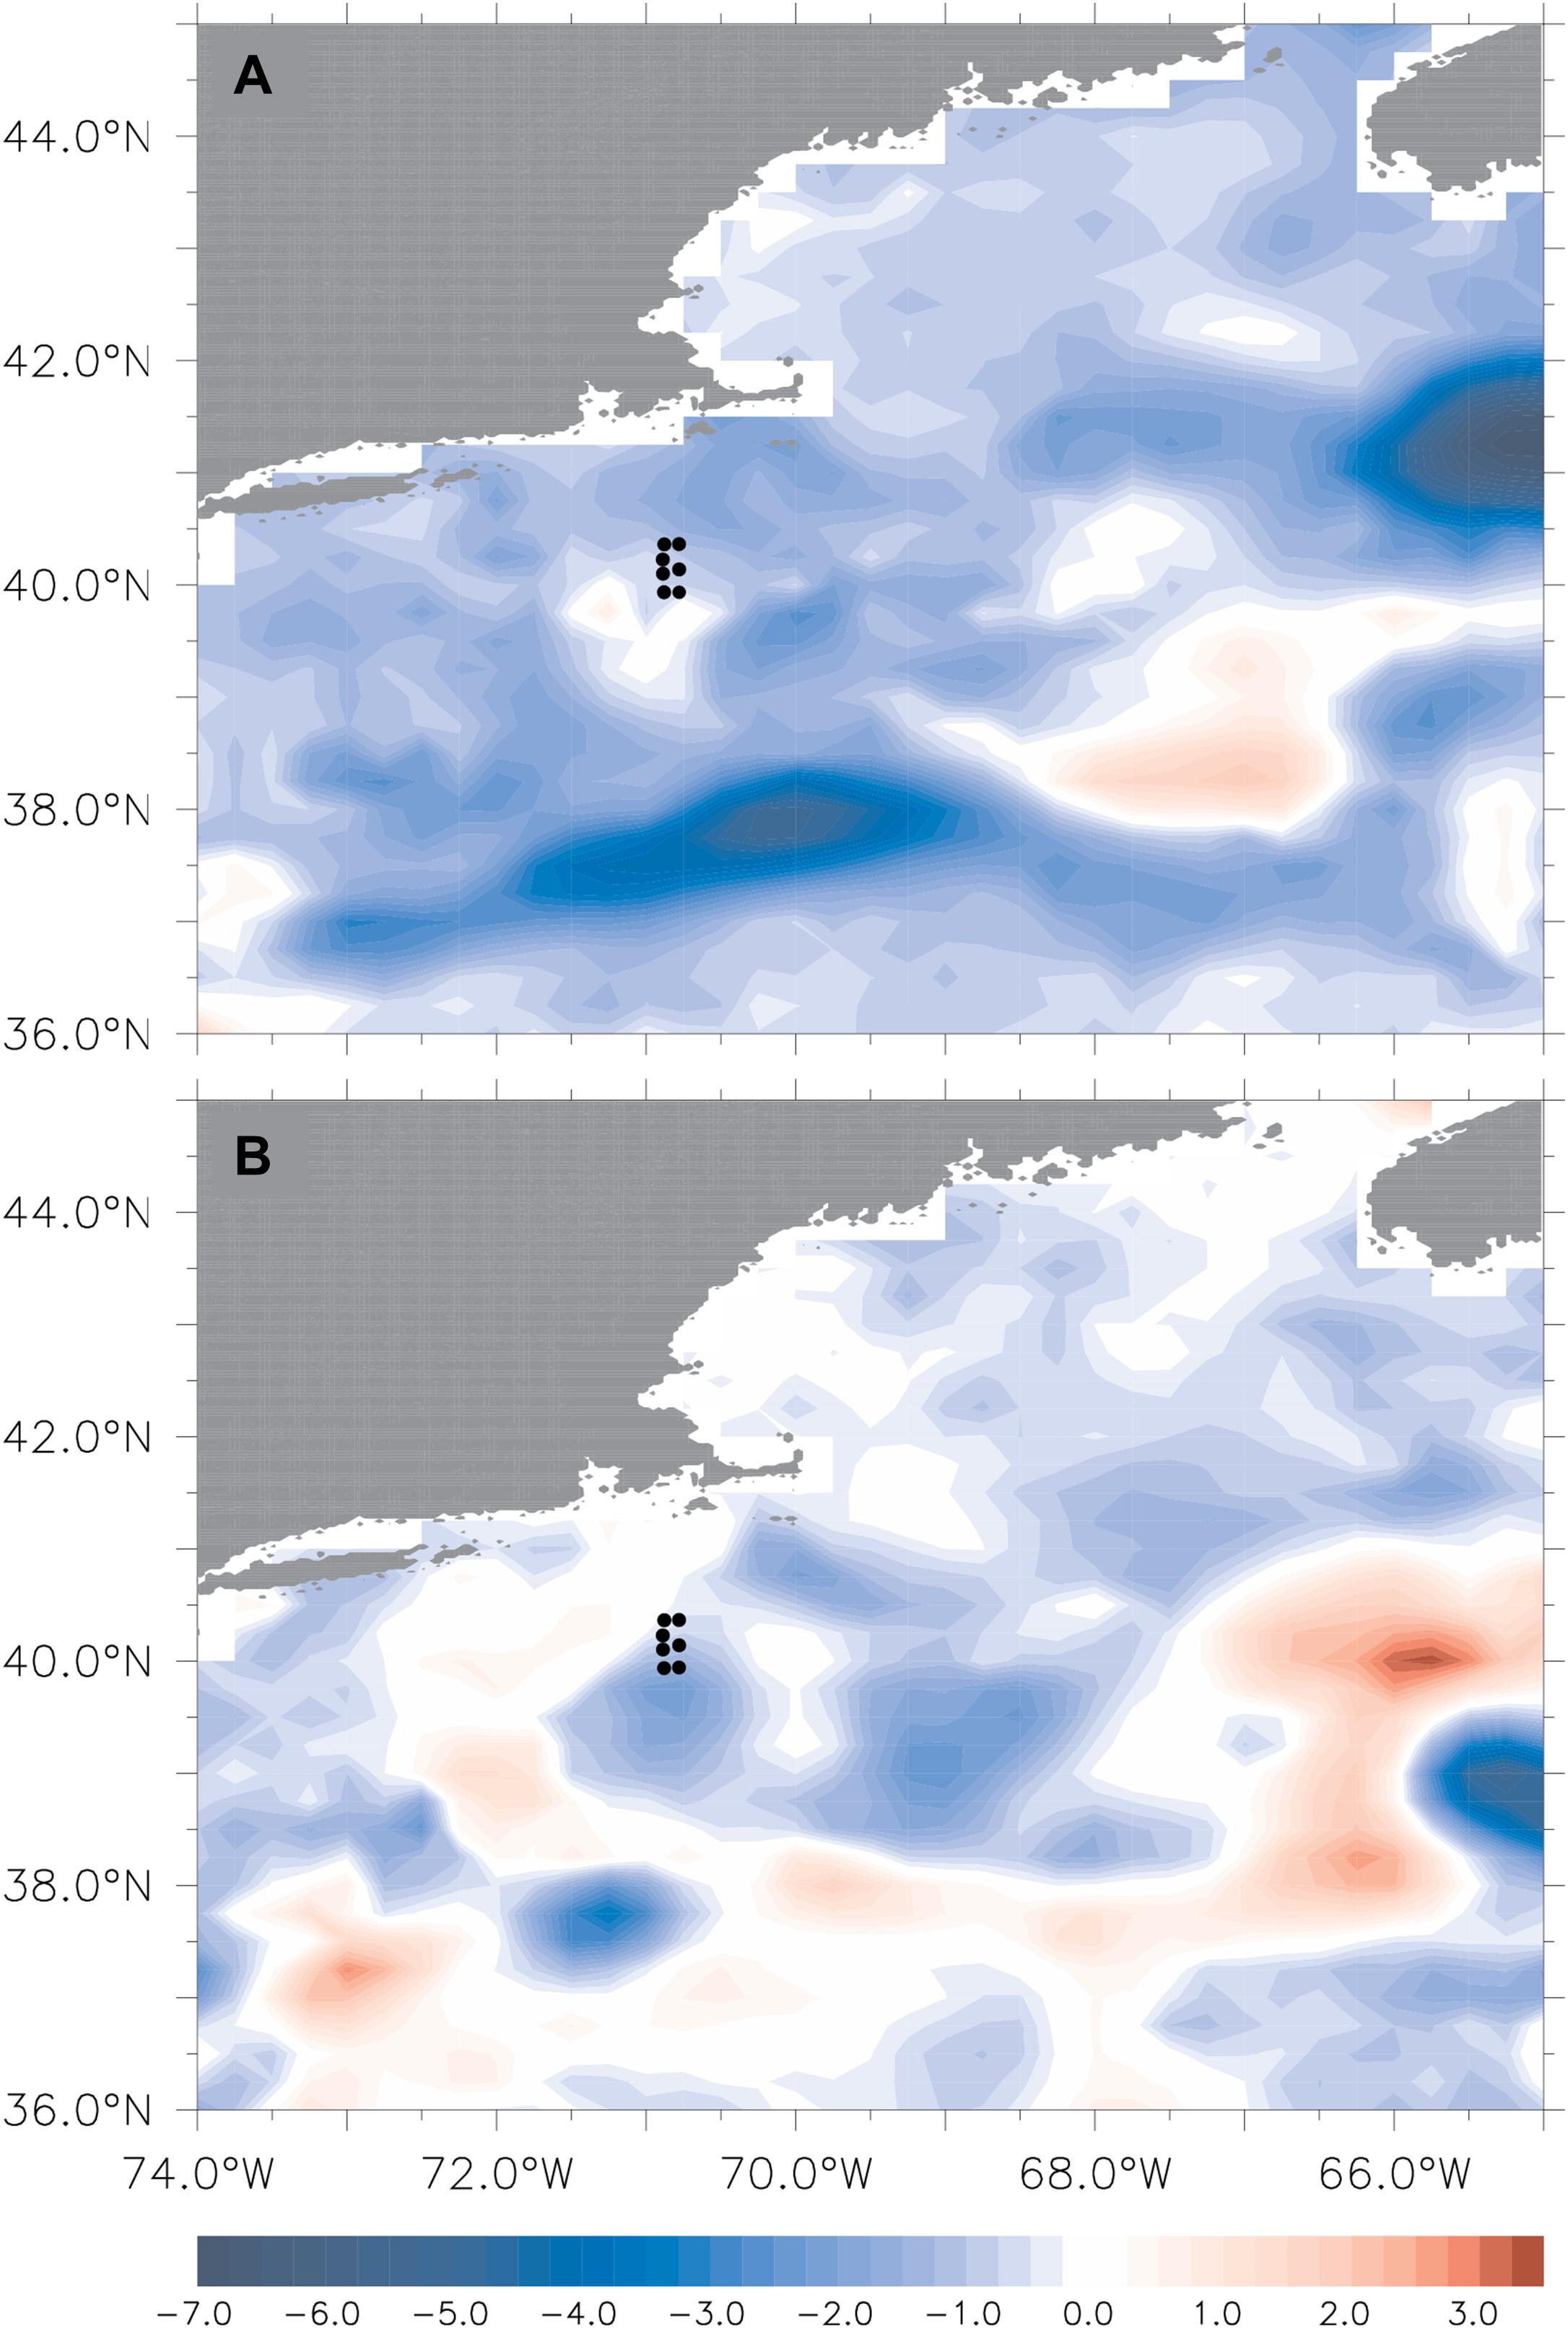
Figure 4. Satellite sea surface temperature (SST) differences (°C) for (A) Event 1 and (B) Event 2. Differences for Event 1 and Event 2 are defined as (1) SSTNov18-SST-Nov14 and (2) SSTNov30-SSTNov26, respectively, such that positive differences indicate post-event SST warming and negative differences indicate post-event SST cooling. Black dots indicate locations of Pioneer Array Moorings.
Event 2 had a slightly lower wind speed (12.2 m s–1) than Event 1, but a similar atmospheric pressure anomaly (991.0 hPa; Figures 3A,B). The substantial drop in atmospheric temperature observed prior to Event 1 was not observed prior to Event 2 (Figure 3C, 10.2). Air temperature during Event 2 was similar (13.2°C) to Event 1 but latent and sensible fluxes were slightly lower (239.8 W m–2 and 119.9 W m–2, respectively). Peak latent and sensible fluxes (285.6 W m–2 and 127.9 W m–2, respectively) occurred in the post-event stage (29 Nov 9Z) during a peak in wind speed (15.8 m s–1) at that time rather than in the pre-event stage like Event 1. SST cooled rapidly by 2.8°C from pre-event to post event (Figure 3E), even though wind speed, air temperature, and latent and sensible heat fluxes were not indicative of such air-sea exchange as in Event 1. Satellite SST revealed a tongue of cold inner-shelf waters extending from the Gulf of Maine toward the mooring array (Figure 4B). Southwesterly surface currents during Event 2 (Figure 3F) indicated that observed SST cooling was likely dominated by water mass advection rather than air-sea exchange.
A strong, persistent thermal inversion at 40–60 m (∼18°C) accompanied by saline (∼ 35.5) waters was evident at the central offshore site up to a week prior to Event 1 (Figures 5B,C, 6A,B, 7D). This inversion dissipated with the onset of Event 1 (11/15 12Z - 11/16 0Z) and was replaced by relatively cooler (∼13°C) and fresher (∼34°C) waters that were mixed down to 110 m (Figures 5B,C, 6A,B, 7D). Concurrently, DO increased and CDOM decreased down to depths of 110 m (Figures 5D,E, 6C,D). The strong thermal inversion re-established approximately 5 days prior to Event 2 (11/22, Figures 5B, 6F), extending from 40m to 80m. The properties of this inversion and the position along the seasonal pycnocline were consistent with salty intrusions typical of the continental shelf along the Mid Atlantic Bight (Lentz, 2003). The short decay time is expected given the rapid mixing of the water column, and future work could utilize the continuous measurements of the Pioneer Array to further explore the generation and decay mechanisms of these intrusions.
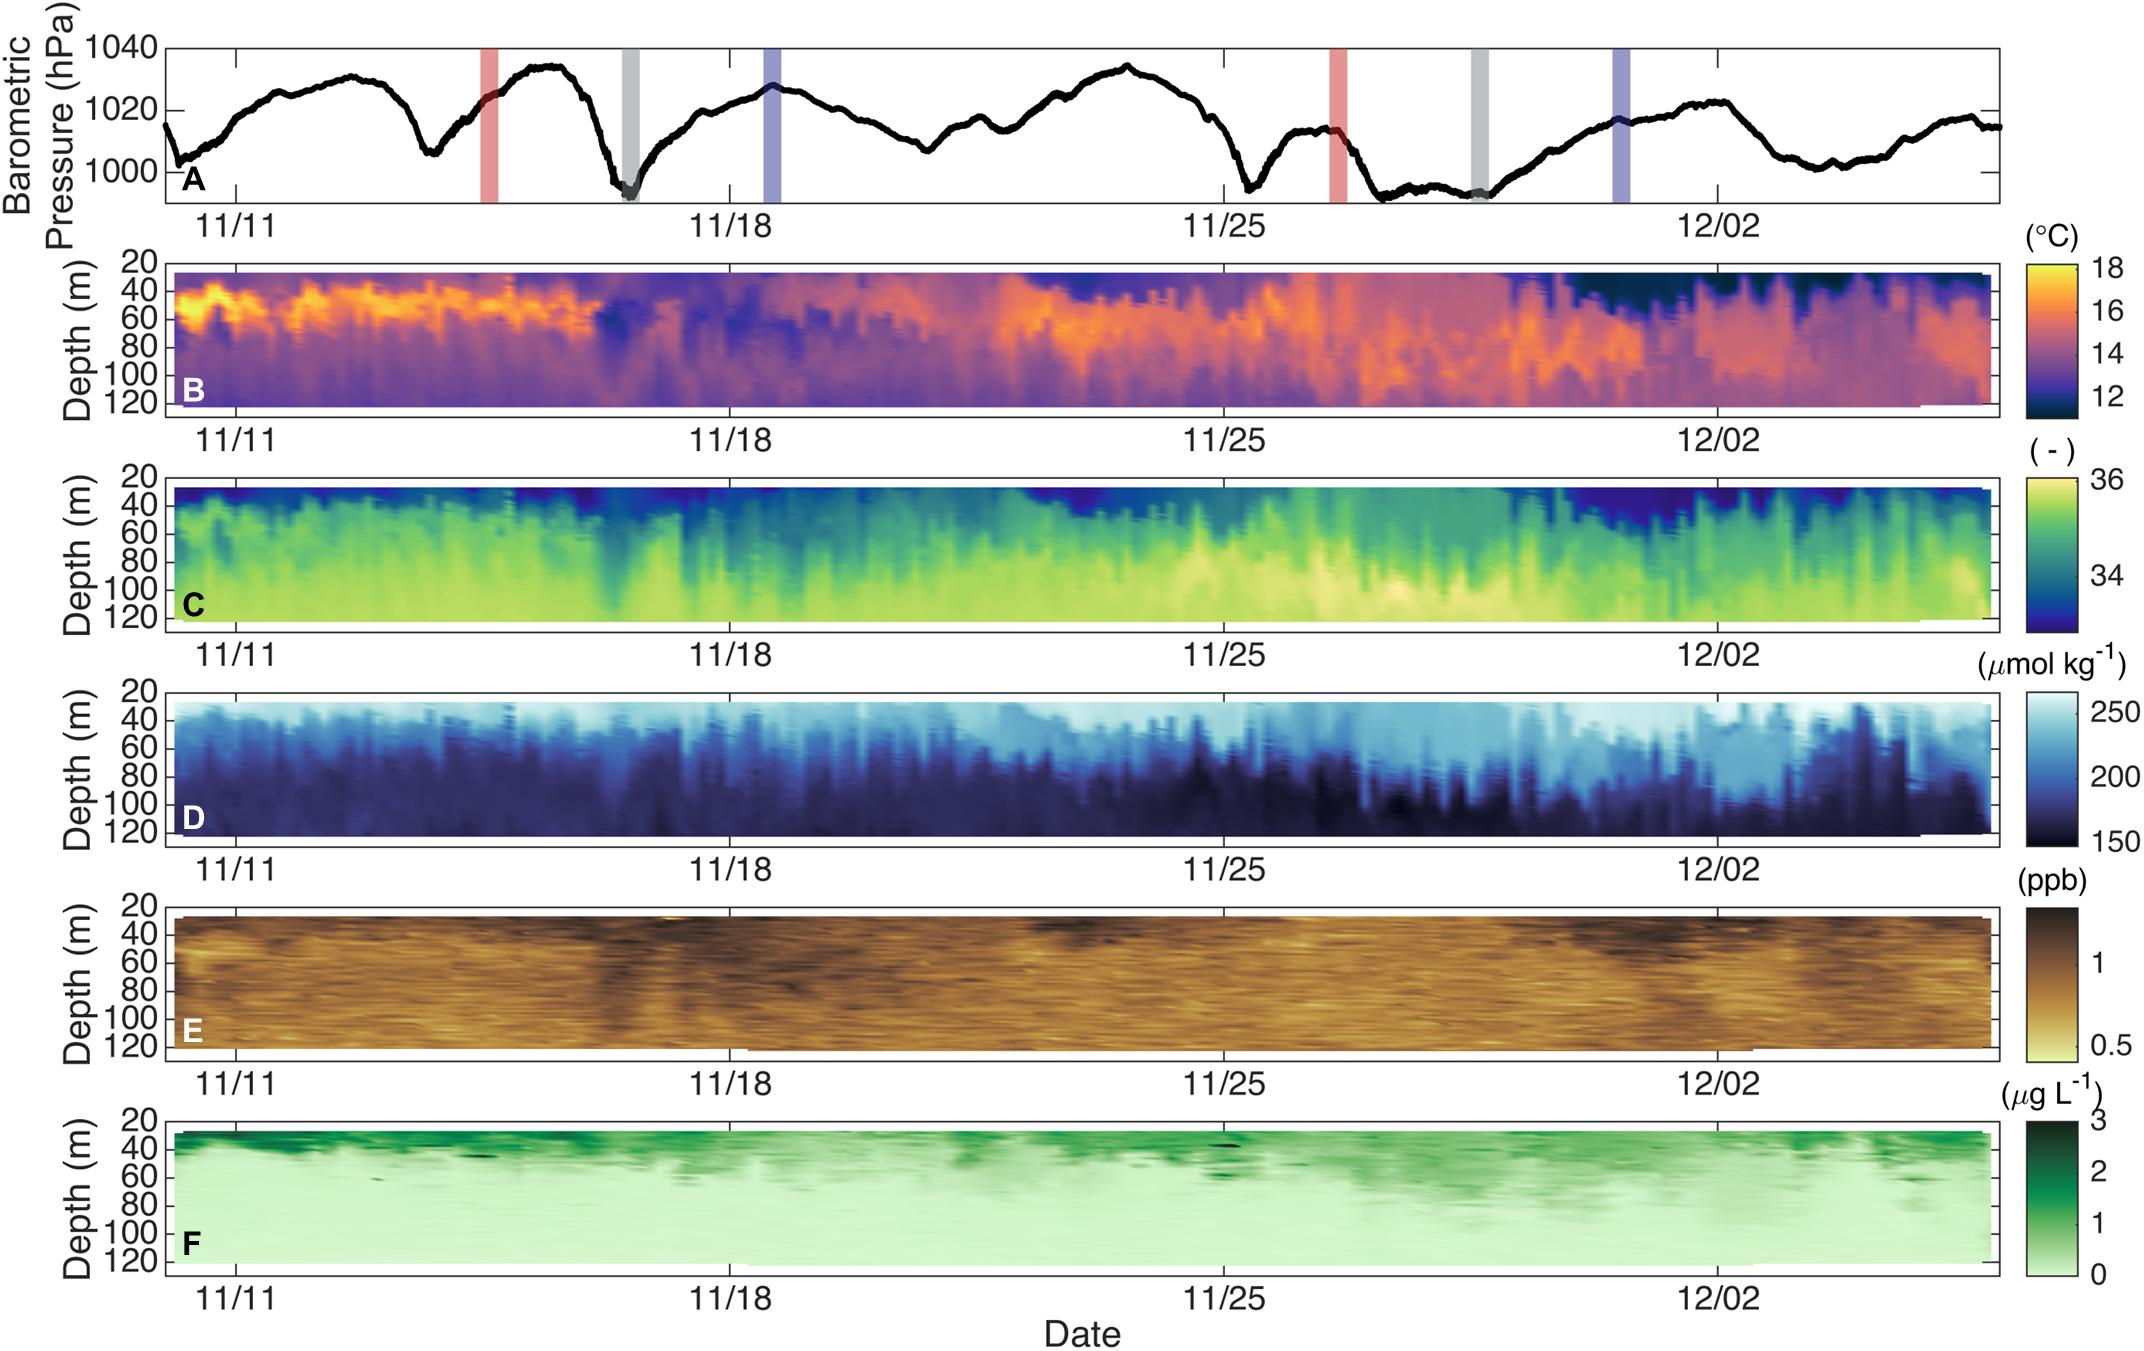
Figure 5. (A) Barometric pressure from the inshore site for 10 November to 6 December 2018. Vertical lines indicate the time 48 h before (red), during (gray), and 48 h after (blue) each event. Water-column (B) temperature, (C) practical salinity, (D) dissolved oxygen, (E) color dissolved organic matter, and (F) chlorophyll a from the central offshore site for the same time period.
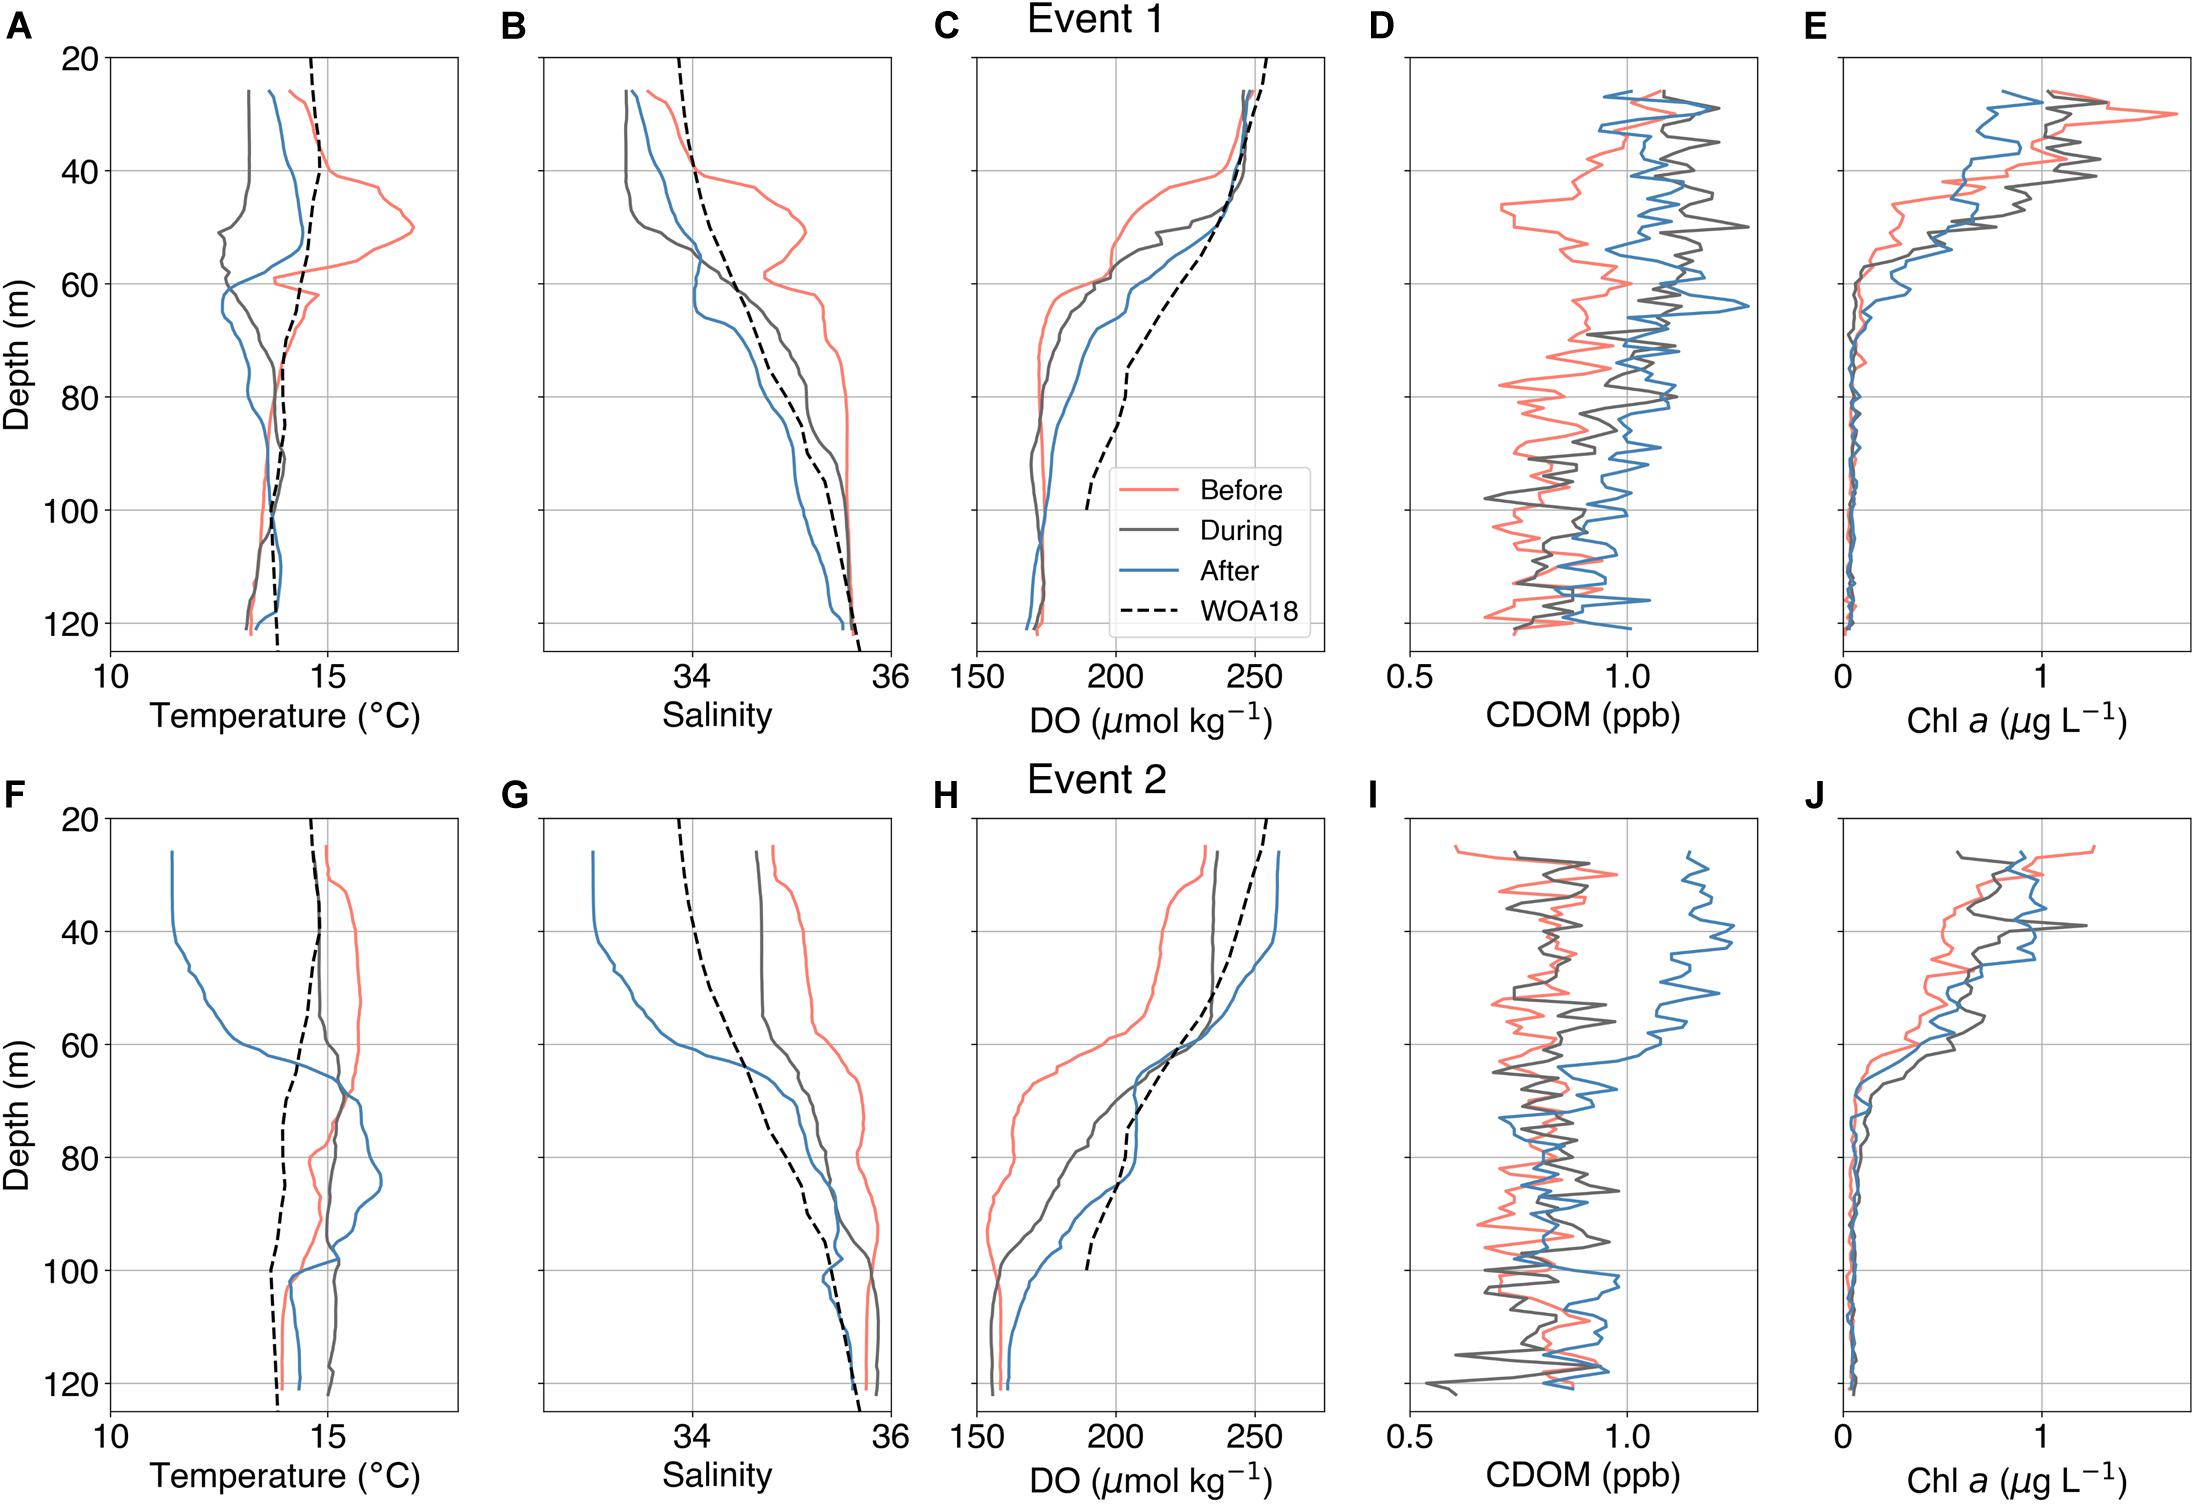
Figure 6. Temperature, salinity, dissolved oxygen (DO), colored dissolved organic matter (CDOM), and chlorophyll a (Chl a) water-column profiles before (red), during (gray), and after (blue) Event 1 (A–E) and Event 2 (F–J) at the central offshore mooring site. WOA18 November climatological average profiles of temperature, salinity, and oxygen are indicated by the dashed lines.
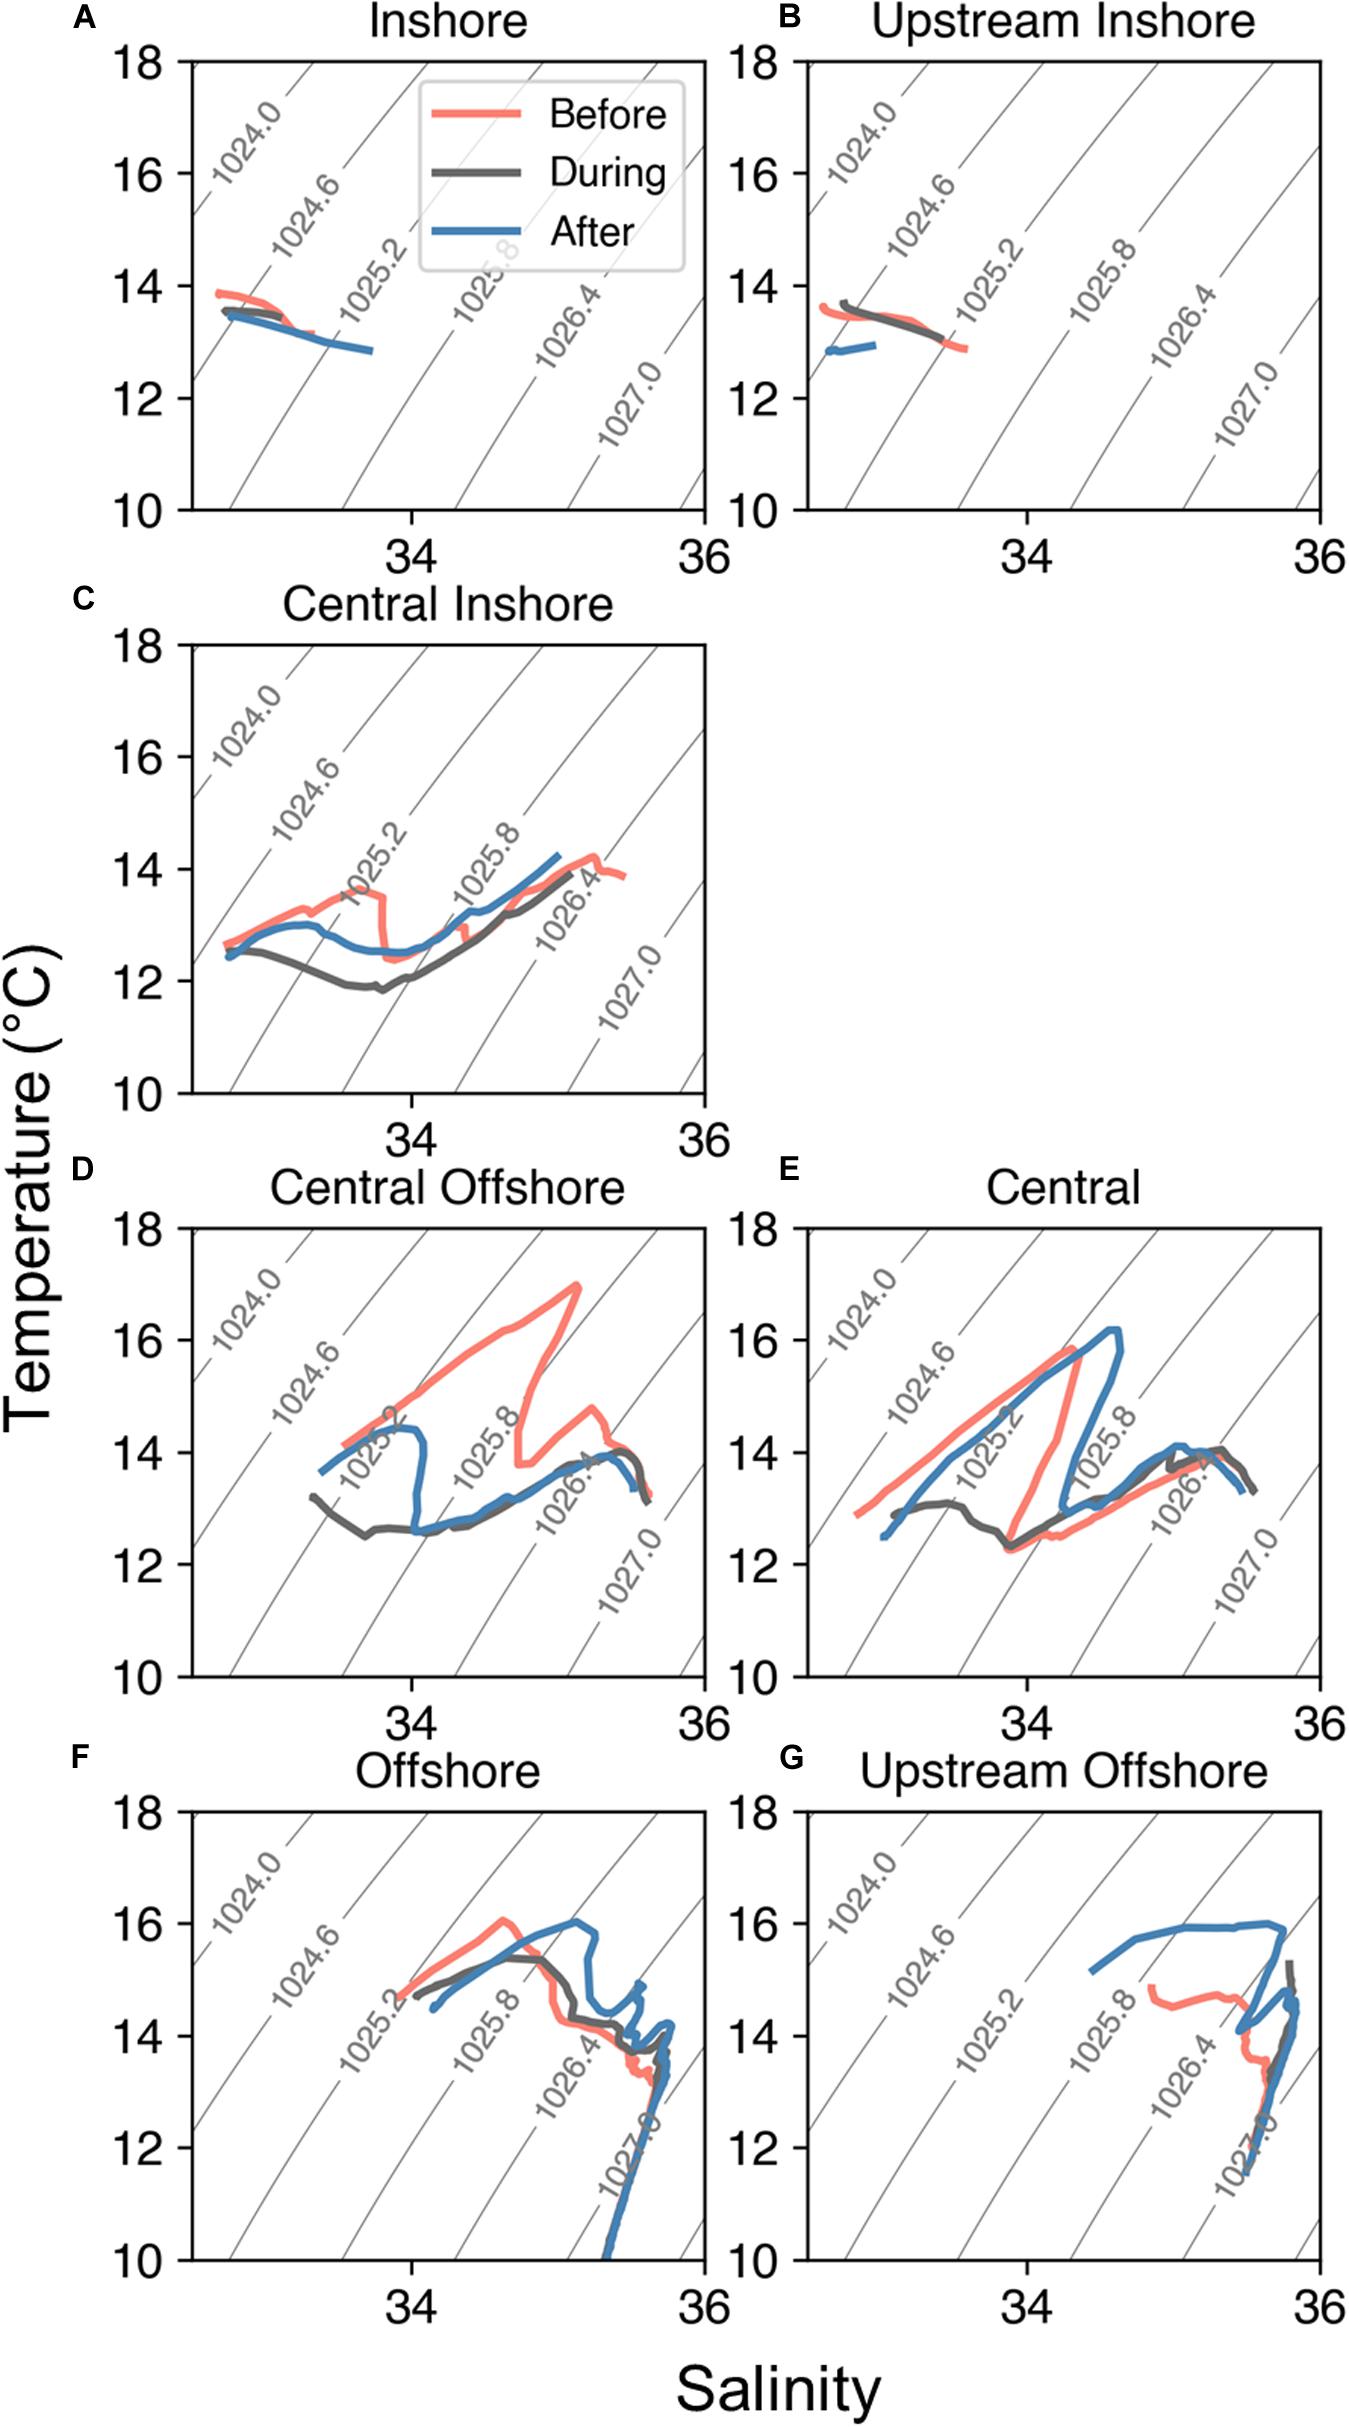
Figure 7. Temperature and salinity of the water column before (red), during (gray), and after (blue) Event 1 at the (A) inshore, (B) upstream inshore, (C) central inshore, (D) central offshore, (E) central, (F) offshore, and (G) upstream offshore sites. Contours indicate potential density (kg m–3).
A constant layer of temperature, salinity, DO, CDOM and chlorophyll a, extending from the surface down to approximately 60m, was observed at the onset of Event 2 (Figures 6F–J), indicating intense turbulent mixing during the event. Much colder (<12°C), fresher (<33), and oxygenated (>250 μmol kg–1) waters with an increased concentration of CDOM were observed in the upper 25 to 60 m starting 30 November 2018, two days after Event 2 (Figures 6F–I). Meteorological and ocean surface current observations from the central surface mooring, in addition to satellite measurements, indicate the cooling was associated with southward advection of cooler Gulf of Maine waters across the array (Figures 3, 4B) rather than a widespread cooling as in Event 1 (Figures 3, 4A).
The impact of Event 1 on temperature and salinity varied spatially both across and along the shelf slope (Figure 7), while a uniform cooling response was observed across the array during Event 2 (data not shown). Observations from all seven profiler moorings indicated that conditions prior to Event 1 were highly variable across the shelfbreak. Variability along the shelf (90 m depth) at both the inshore (Figure 7A) and upstream inshore (Figure 7B) was low, with temperatures at both sites before, during, and after Event 1 ranging from 12.8–13.8°C. Minimal cooling (-0.3 and -0.6°C) was observed following Event 1 at both the inshore and upstream inshore sites.
The temperature inversion between 40 and 60 m observed at the central offshore site (148 m depth; Figures 6A, 7D) during Event 1 was also observed at the central site (130 m depth; Figure 7E) on the upstream (eastern) side of the array. Maximum temperatures between 40 and 60 m prior to Event 1 were 17.0 and 15.9°C at the central offshore and central sites, respectively, 2.3 and 3.2°C warmer than the corresponding inshore and upstream inshore sites. Maximum inversion temperatures were reduced by ∼3°C during Event 1, at which point the temperatures at the central offshore and central sites were <0.5°C warmer than the corresponding inshore and upstream inshore sites. Following Event 1, the central offshore site remained cool with a maximum temperature of 14.4°C between 40 and 60 m where the warm thermal inversion had been present (Figures 6A, 7D). At the central site, the temperature inversion was once again present, with a maximum water temperature of 16.3°C (Figure 7E). We observed additional post-Event 1 warming on the upstream side of the array at the upstream offshore site (452 m depth); maximum water temperatures between 40 and 60 m increased from 14.8°C prior to Event 1 to 16.0°C after Event 1 (Figure 7G). Similarly, warm water remained present at the offshore site (450 m depth) where temperatures in the same depth range varied from 15.4 to 16.1°C during the same period (Figure 7F).
During and after Event 1, satellite-derived SST indicated an intrusion of warm surface water extending to 40° N (Figure 4A; Supplementary Figure S1). The SST and temperature/salinity properties within the warm inversion layer at the central and central offshore mooring sites, in addition to observed pre-event northwesterly surface current (Figure 3F), suggest mixing with slope/gulf stream water (e.g., Harden et al., 2020; Figures 6A,B). The temperature and salinity within the upper 80 m observed prior to and during Event 1 compare well with the slope eddy structure described in Gawarkiewicz et al. (2001). Both the offshore and upstream offshore sites remained influenced by slope water throughout the passing of Event 1 (Figures 7F,G). This water mass appeared to continue mixing onto the shelf slope at the central site following Event 1’s passing, as exhibited by the warm post-storm temperatures observed at the central site reminiscent of the conditions prior to Event 1 (Figure 7E). This reemergence of the slope water mass following Event 1 was not observed to the west at the central offshore site (Figure 7D), perhaps either as a result of storm-driven mixing on the shelf slope or a movement of the slope front.
Latent and sensible heat fluxes prior to Event 1, and satellite SSTs indicated the presence of warm surface water over the central and offshore mooring sites (Supplementary Figure S1). Observations from the array indicated that during Event 1, latent and sensible heat fluxes to the atmosphere led to the widespread sea surface cooling, observed not only over the mooring array but also across the shelf and Gulf of Maine (Figure 4A; Supplementary Figure S1). The impact of event-driven mixing in the surface layer is also apparent in the deepening of the oxycline (Figure 6C). However, the magnitude of the cooling across the array was variable, and subsurface observations suggested the intrusion of a slope/Gulf Stream water mass throughout the passing of Event 1 which likely resulted in different water column temperature responses (Figure 7).
During and after Event 2, latent and sensible fluxes did not appear to account for cooling sea surface temperatures (Figure 3E). Instead, most surface cooling appeared to be associated with the advection of colder water into the shelf-slope region (Figure 1, 3F, 4B). Profiler observations revealed that the advected waters were colder, fresher, more oxygenated, and contained more CDOM than waters prior to Event 2 (Figures 6F–I). These patterns are indicative of coastal water from the Gulf of Maine being transported offshore via the coastal current (Mountain, 1977; Figure 1). As Event 2 passed, and SST cooled, chlorophyll a increased and the system appeared to return to pre-event conditions.
Overall, the investigation of these two events demonstrates our capability to address the importance of a multitude of interdisciplinary oceanographic processes including cross-shelf/along-shelf dynamics, biochemical interactions, and air-sea interactions before, during, and after pressure anomalies. The case study presented validate the conceptual design for the Pioneer Array (Trowbridge et al., 2019; Gawarkiewicz and Plueddemann, 2020) by leveraging multiple collocated continuous time series over a large spatial area. We demonstrated the potential for predictive analysis with an anomaly detection algorithm. Then, based on the identification of those events, we interrogated a wide range of data products available from the OOI to resolve the variability in and drivers of ocean response. The long-standing time series also allows for hypothesis-driven research such as climatology of the shelfbreak region, seasonal variability regarding Gulf Stream meanders and warm-core rings (Chen et al., 2014; Zhang and Gawarkiewicz, 2015), the influence of extreme events on shelf biogeochemical response (as demonstrated within the present case study), or the influence of a warming climate on shelf exchange. Historically, the number of datasets with repeat annual observations necessary to explore these potential shifts in climatology are limited in either number of variables (Forsyth et al., 2015) or temporal/seasonal coverage (Harden et al., 2020). The combination of high-resolution observations and temporal coverage of the OOI array should allow a much more detailed analysis of specific oceanographic processes contributing to the trends in warming and future shifts in these exchange processes (Harden et al., 2020).
As demonstrated, this framework is especially valuable because it uses data that can be collected even when ship-based science cannot be conducted (global pandemics, harsh weather, storms, or minor events that may otherwise go unnoticed). The availability of telemetered observatory data means that ocean response can also be monitored in near real-time in support of forecasting, co-occurring ship-based efforts, or to mobilize additional resources in response to interesting phenomena. These continuous observing systems provide real-world, broad applications to benefit society, including early tsunami warnings, weather and flooding events, El Niño periods, hypoxic events, and harmful algal blooms. Moreover, ocean observatories provide unprecedented access to the ocean, regardless of proximity. Development of a remote team science framework establishes a pipeline for virtual mentorship and education tools that use observatory data to communicate oceanographic concepts while building data skills and understanding of integrated applications (Greengrove et al., 2020).
Through engagement of communities outside of oceanography and the geosciences, it is possible to further expand the research potential and constructive applications of observatory data. As an example, we chose to use simple metrics for event detection to demonstrate the potential of more developed and complex algorithms for identifying patterns of interest. Data mining is an essential method for identifying signals in large and sometimes noisy datasets (Liu et al., 2017). The goal of our case study was to identify acute atmospheric pressure events which made it possible to focus on a single variable. Accordingly, we chose the commonly utilized 3-sigma rule as our algorithm for anomaly detection due to its simplicity and demonstrate that it could be used by non-atmospheric scientists without a detailed understanding of the region-specific atmospheric processes. Future work could include more extensive collaboration with the data science community to develop a more complex multivariate approach synthesizing many data streams (Wu and Zhang, 2003), identifying patterns from noisy data (Leung et al., 2014), and/or reducing long time series to key and compact features (Lee and Staneva, 2020).
Using this case study focused on Gulf Stream dynamics, we showed the utility of multidisciplinary collaboration of ECS using open-source data from a range of locations and sensor networks. Further, this work was performed across institutional and geographic boundaries, within a resource-limited environment and much of it during a global pandemic. In addition to insights into physical and biogeochemical processes across time and spatial scales, we demonstrated how ECS can overcome challenges in accessing and analyzing OOI data through close collaboration and interdisciplinary skill sharing.
Data synthesis is necessary to address ocean science questions, but interpretation of interdisciplinary data requires a variety of expertise. For instance, knowledge of the geographic region or system, instruments and sensor capabilities, data access, analysis, and visualization can all be compiled within a diverse research team. Within this project, our team consisted of ECS whose areas of expertise include physical, chemical, and biological oceanography, data science, marine geophysics, and coastal geology (Table 2). The inclusion of varied mastery enables a more comprehensive understanding of a system. This integrated outcome has been shown across research fields (Hall et al., 2018).
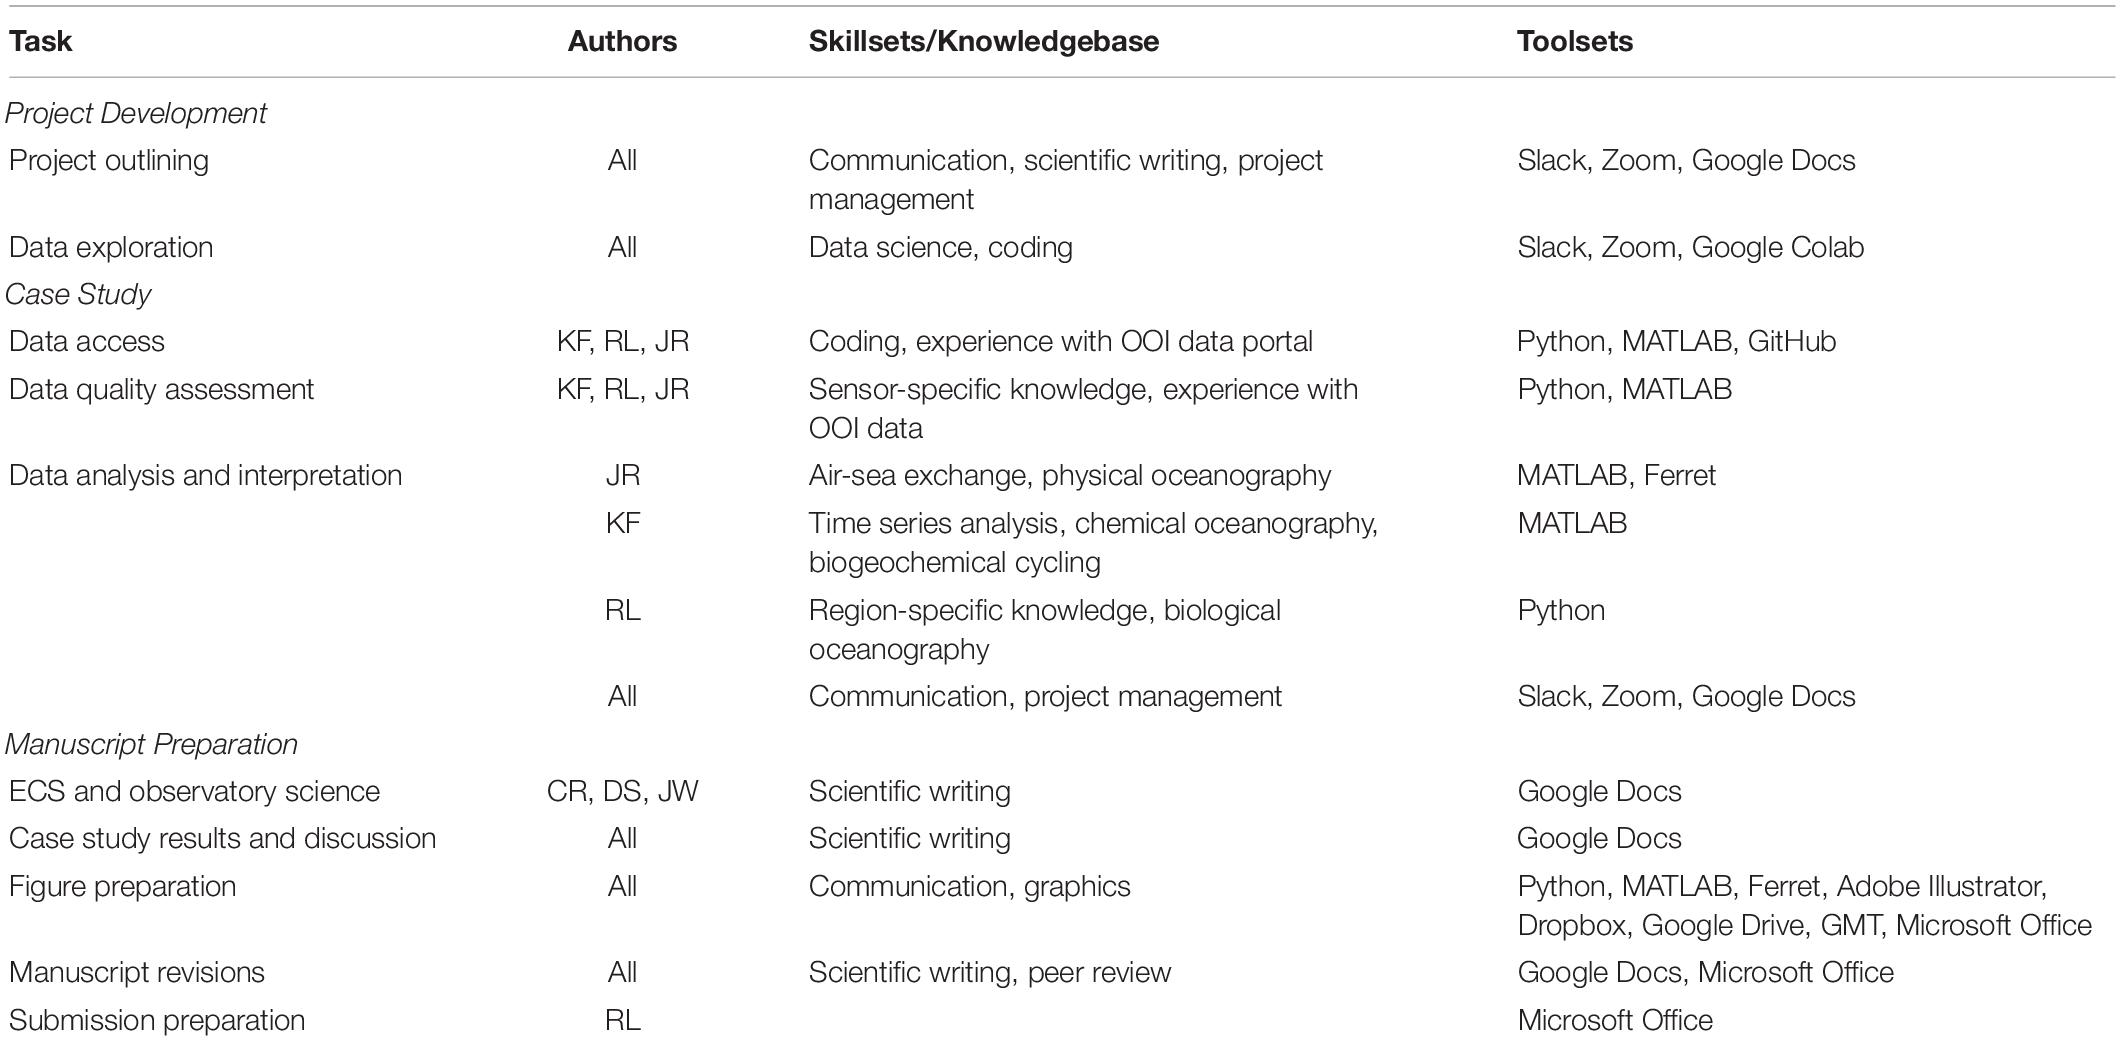
Table 2. Author skill, knowledge, and toolset contributions needed to conduct remote collaborative research.
Open data has the potential to promote such integrative and collaborative interdisciplinary research, particularly among ECS (e.g., Carpenter et al., 2009). Although ocean science has been historically considered collaborative, ECS are particularly well-suited to move forward using team science. Formal team science (Bennett and Gadlin, 2012) allows for collaborative groups to form that span a wide range of skills and expertise. By engaging diverse scientists with differing skill sets from design to interpretation, we engendered a holistic approach to this study, which allowed scientists without an extensive background specifically in atmospheric or ocean science to explore air-sea interactions. This model also facilitated lateral mentorship and skill sharing, learning from the expertise of team members, regardless of professional standing. Through these research activities and mentorship, ECS gain skills that extend beyond the expertise of their own communities and the ability to produce more competitive proposals and future publications, potentially influencing the trajectory of their research agenda.
Despite the value of interdisciplinary collaborations, the benefits of participating in collaborative research are typically diminished for ECS. Traditional evaluation and reward systems built around specialization, funding limitations, and the importance placed on first authorship often disincentivize larger collaborative efforts, despite the potential scientific gains (Goring et al., 2014). As was true of the production of this work, ECS are typically not financially supported for research outside of their institute- or grant-directed programs. Thus, the work and time to establish these community-driven collaborations is largely uncompensated, and still requires outside support for expenses such as workshops and publication fees.
The remote nature of multidisciplinary and often cross-institutional collaborations also requires a set of tools for shared project management and execution. In addition to the scientific knowledge and data-specific skill set, we found skill sets such as communication, writing, and project management were imperative to maintaining progress, particularly as research was being done outside of typical institutional support (Table 2). Acknowledging these common constraints among ECS and developing guidelines for collaborations (e.g., OOI-ECS Code of Conduct4) alleviates many of these challenges by ensuring accountability and equity among collaborators. Additionally, the establishment of a community of practice, unified by a research agenda and shared toolkit (Wenger-Trayner and Wenger-Trayner, 2015), provides a platform for both research and networking that can be conducive to developing important team science skills among ECS. Our collaboration was facilitated by digital communication platforms (e.g., Slack, Zoom; Table 2), which allowed a range of interactions (e.g., file sharing/presentation, messaging, small/large meetings). For scientific analysis, a key component of our ability to collaborate remotely and across platforms and coding languages was the use of open-source data and development tools (e.g., Google Drive, GitHub5), which demonstrates the potential to implement similar techniques on publicly available computational platforms (e.g., OOICloud6, Google COLAB7, and National Research Cloud8). Although open access to data is not new, open access to cloud-based computational resources and technical support from a robust and accessible data science community is lowering the barriers to working with ocean observatories data. These resources also ensure reproducibility and allow researchers to directly engage with datasets and analyses utilized by others in the community. That so much could be accomplished during the COVID-19 pandemic, and with limited traditional resources, illustrates the usefulness of observatory data for those with restricted access to historical oceanographic tools and platforms. This work demonstrates that future research exploring important oceanographic questions can be conducted from anywhere in the world with community-driven resources and tools to support further discovery.
By engaging larger and more diverse communities, we incorporate many perspectives and increase the potential to accelerate data-driven analyses and discoveries from ocean observatory data. The goals and strategies of such a collaboration, in close alignment with the OceanObs’19 Outcomes and Living Action Plan9, relies on scientific engagement beyond oceanography. Incorporation of data mining expertise and techniques from the data science community would allow expansion of our framework to identify long-term trends in baseline data and provide a better understanding of anthropogenic impacts, such as ocean warming and acidification. The inclusion of biological data, such as species distributions, would further expand the application of observatory data to ocean management decisions (Cocquempot et al., 2019). Beyond marine science and technology, inclusion of law and policy researchers could lead to more effective integration of scientific findings into management, industry, and government actions. Ultimately, scientific endeavors are funded and undertaken in order to provide meaningful benefits to society – incorporating social science, indigenous, and community stakeholder perspectives in future endeavors would enable science that is truly translational, and both considers and highlights the human dimension.
1. Interdisciplinary research is most feasible when done as collaborative work among scientists with diverse specialties.
2. Collaborative research among ECS provides an opportunity to share and develop new skill sets while producing effective science that benefits from the inclusion of varied perspectives and skill sets. This range of insight increases the potential for scientific discovery and the application of findings.
3. Openly available ocean data provided by observatory systems improves the equity of access to scientific data for both research and education.
4. Open-access tools and software for data access, analysis, and peer-to-peer communication help facilitate collaborative research.
5. Institutional support and expanding the knowledge pool for such collaborative projects is needed to address global issues and maximize the potential of observatory systems.
Three publicly available datasets were used for the case study. The data for the OOI Pioneer Array can be accessed via the OOI Data Portal (first accessed 10 March 2020, https://ooinet.oceanobservatories.org/data_access/#CP). World Ocean Atlas 18 climatology is available via the National Oceanographic and Atmospheric Administration National Centers for Environmental Information (first accessed 27 April 2020, https://www.nodc.noaa.gov/OC5/woa18/woa18data.html). Satellite-derived sea surface temperature can be accessed via Jet Propulsion Laboratory’s PODAAC Group for High Resolution SSTs (GHRSST) Level 4 MUR (first accessed 27 April 2020, https://podaac.jpl.nasa.gov/dataset/MUR-JPL-L4-GLOB-v4.1). The data, code, and further documentation of analyses are available at https://github.com/ooi-ecs/ECS-Observatory-Collaboration. An archive of all materials used in this study are included in Levine et al. (2020).
CR, DS, and JW were responsible for the “Introduction” and “Discussion.” KF, RL, and JR were responsible for the “Methods for Case Study” and “Case Study Results and Discussion.” Additional details of contributions can be found in Table 2. All authors contributed to the interpretation of case study findings, improved the manuscript, approved it for submission, and design and planning of the project.
Funding for publication fees was provided by the Ocean Observatories Initiative Facility Board.
The authors declare that the research was conducted in the absence of any commercial or financial relationships that could be construed as a potential conflict of interest.
We would like to acknowledge the support of the OOI Early Career Scientist Community of Practice. We would also like to acknowledge Lauren Schmahl for her work on Figure 1. We would like to thank Annette DeSilva and the Ocean Observatories Initiative Facility Board for their support of this project, Craig Risien for guidance on accessing data, Christopher Wingard for assistance in identifying sources of poor data quality, and the reviewers for their helpful comments which have improved the manuscript.
The Supplementary Material for this article can be found online at: https://www.frontiersin.org/articles/10.3389/fmars.2020.593512/full#supplementary-material
Supplementary Figure 1 | Satellite sea surface temperature (SST,°C) observed on (A) 14 November, (B) 16 November, and (C) 18 November during the passing of Event 1. SST observed on (D) 26 November, (E) 28 November, and (F) 30 November during the passing of Event 2. SST measurements are gridded to 1 km resolution, see section “Auxiliary Datasets” for additional details.
Adame, M. F., Roberts, M. E., Hamilton, D. P., Ndehedehe, C. E., Reis, V., Lu, J., et al. (2019). Tropical coastal wetlands ameliorate nitrogen export during floods Front. Mar. Sci. 6:671. doi: 10.3389/fmars.2019.00671
Bennett, L. M., and Gadlin, H. (2012). Collaboration and team science: from theory to practice. J. Investig. Med. 60, 768–775. doi: 10.2310/JIM.0b013e318250871d
Benway, H. M., Lorenzoni, L., White, A. E., Fiedler, B., Levine, N. M., Nicholson, D. P., et al. (2019). Ocean time series observations of changing marine ecosystems: an era of integration, synthesis, and societal applications. Front. Mar. Sci. 6:393. doi: 10.3389/fmars.2019.00393
Bodmer, P., Attermeyer, K., Pastor, A., and Catalán, N. (2019). Collaborative projects: unleashing early career scientists’ power. Trends Ecol. Evol. 34, 871–874. doi: 10.1016/j.tree.2019.07.016
Carpenter, S. R., Armbrust, E. V., Arzberger, P. W., Chapín, F. S., Elser, J. J., Hackett, E. J., et al. (2009). Accelerate synthesis in ecology and environmental sciences. Bioscience 59, 699–701. doi: 10.1525/bio.2009.59.8.11
Chen, K., He, R., Powell, B. S., Gawarkiewicz, G. G., Moore, A. M., and Arango, H. G. (2014). Data assimilative modeling investigation of Gulf Stream Warm Core Ring interaction with continental shelf and slope circulation. J. Geophys. Res. 119, 5968–5991. doi: 10.1002/2014JC009898
Cocquempot, L., Delacourt, C., Paillet, J., Riou, P., Aucan, J., Castelle, B., et al. (2019). Coastal ocean and nearshore observation: a French case study. Front. Mar. Sci. 6:324. doi: 10.3389/fmars.2019.00324
Collins, M., Sutherland, M., Bouwer, L., Cheong, S.-M., Frölicher, T. L., Jacot Des Combes, H., et al. (2019). Extremes, Abrupt Changes and Managing Risks. Available online at: https://report.ipcc.ch/srocc/pdf/SROCC_FinalDraft_Chapter6.pdf (accessed July 13, 2020).
Davidson, F., Alvera-Azcárate, A., Barth, A., Brassington, G. B., Chassignet, E. P., Clementi, E., et al. (2019). Synergies in operational oceanography: the intrinsic need for sustained ocean observations. Front. Mar. Sci. 6:450. doi: 10.3389/fmars.2019.00450
Dzwonkowski, B., Kohut, J. T., and Yan, X.-H. (2009). Seasonal differences in wind-driven across-shelf forcing and response relationships in the shelf surface layer of the central mid-atlantic bight. J. Geophys. Res. 114, 1–15. doi: 10.1029/2008jc004888
Fennel, K., Wilkin, J., Levin, J., Moisan, J., O’Reilly, J., and Haidvogel, D. (2006). Nitrogen cycling in the middle atlantic bight: results from a three-dimensional model and implications for the north atlantic nitrogen budget, global biogeochem. Cycles 20:GB3007. doi: 10.1029/2005GB002456
Forsyth, J. S. T., Andres, M., and Gawarkiewicz, G. G. (2015). Recent accelerated warming of the continental shelf off New Jersey: observations from the CMV Oleander expendable bathythermograph line. J. Geophys. Res. Oceans 120, 2370–2384. doi: 10.1002/2014JC010516
Fratantoni, P. S., and Pickart, R. S. (2003). Variability of the shelf break jet in the Middle atlantic bight: internally or externally forced? J. Geophys. Res. 108:3166. doi: 10.1029/2002JC001326
Ganse, S., Van Salvetat, F., Blandin, J., Bihan, C., Le, Niclas-Chirugien, L., et al. (2019). “Fixed observatories and long time-series of dissolved oxygen measurements: good quality data is a challenge,” in Proceedings of the OCEANS 2019 - Marseille (Piscataway, NJ: IEEE), 1–7.
Garcia, H. E., Weathers, K., Paver, C. R., Smolyar, I., Boyer, T. P., Locarnini, R. A., et al. (2019). World Ocean Atlas 2018, Volume 3: Dissolved Oxygen, Apparent Oxygen, Utilization, and Oxygen Saturation. A Mishonov Technical Ed. NOAA Atlas NESDIS 83. Washington, DC: NOAA.
Gawarkiewicz, G., Bahr, F., Beardsley, R. C., and Brink, K. H. (2001). Interaction of a slope eddy with the shelfbreak front in the Middle Atlantic Bight. J. Phys. Oceanogr. 31, 2783–2796.
Gawarkiewicz, G., and Plueddemann, A. J. (2020). Scientific rationale and conceptual design of a process-oriented shelfbreak observatory: the OOI Pioneer Array. J. Oper. Oceanogr. 13, 19–36. doi: 10.1080/1755876X.2019.1679609
Gawarkiewicz, G., Todd, R., Zhang, W., Partida, J., Gangopadhyay, A., Monim, M.-U.-H., et al. (2018). The changing nature of shelf-break exchange revealed by the OOI pioneer array. Oceanography 31, 60–70. doi: 10.5670/oceanog.2018.110
Geib, C. (2020). The Long-Term Effects of Covid-19 on Field Science. Usplash. Available online at: https://undark.org/2020/03/31/coronavirus-science-long-term-effects/ (accessed July 6, 2020).
Ginther, D. K., Schaffer, W. T., Schnell, J., Masimore, B., Liu, F., Haak, L. L., et al. (2011). Race, ethnicity, and NIH research awards. Science 333, 1015–1019. doi: 10.1126/science.1196783
Goring, S. J., Weathers, K. C., Dodds, W. K., Soranno, P. A., Sweet, L. C., Cheruvelil, K. S., et al. (2014). Improving the culture of interdisciplinary collaboration in ecology by expanding measures of success. Front. Ecol. Environ. 12, 39–47. doi: 10.1890/120370
Gough, K. V., Yankson, P. W., Wilby, R. L., Amankwaa, E. F., Abarike, M. A., Codjoe, S. N., et al. (2019). Vulnerability to extreme weather events in cities: implications for infrastructure and livelihoods. J. Br. Acad. 7, 155–181. doi: 10.5871/jba/007s2.155
Greengrove, C., Lichtenwalner, C. S., Palevsky, H. I., Pfeiffer-Herbert, A., Severmann, S., Soule, D., et al. (2020). Using authentic data from NSF’s ocean observatories initiative in undergraduate teaching: an invitation. Oceanography 33, 62–73. doi: 10.5670/oceanog.2020.103
Hall, K. L., Vogel, A. L., Huang, G. C., Serrano, K. J., Rice, E. L., Tsakraklides, S. P., et al. (2018). The science of team science: a review of the empirical evidence and research gaps on collaboration in science. Am. Psychol. 73, 532–548. doi: 10.1037/amp0000319
Harden, B. E., Gawarkiewicz, G. G., and Infante, M. (2020). Trends in physical properties at the Southern New England shelf break. J. Geophys. Res. 125, 1–12. doi: 10.1029/2019JC015784
Harris, P., Sotirakopoulos, K., Robinson, S., Wang, L., and Livina, V. (2019). A statistical method for the evaluation of long term trends in underwater noise measurements. J. Acoust. Soc. Am. 145, 228–242. doi: 10.1121/1.5084040
Hoarfrost, A., Balmonte, J. P., Ghobrial, S., Ziervogel, K., Bane, J., Gawarkiewicz, G., et al. (2019). Gulf Stream ring water intrusion on the Mid-Atlantic Bight continental shelf break affects microbially driven carbon cycling. Front. Mar. Sci. 6:394. doi: 10.3389/fmars.2019.00394
Jiang, H., Wu, Y., Lyu, K., and Wang, H. (2019). “Ocean data anomaly detection algorithm Based on Improved k-medoids,” in Proceedings of the 11th Int. Conf. Adv. Comput. Intell. ICACI 2019 (Piscataway, NJ: IEEE), 196–201.
Joyce, T. M. (1984). Velocity and hydrographic structure of a gulf stream warm-core ring. J. Phys. Oceanogr. 14, 936–947.
JPL Mur MEaSUREs Project (2015). GHRSST Level 4 MUR Global Foundation Sea Surface Temperature Analysis (v4.1). Ver. 4.1.
Lawrence, P. A. (2003). The politics of publication - Authors, reviewers and editors must act to protect the quality of research. Nature 422, 259–261. doi: 10.1038/422259a
Lee, W. J., and Staneva, V. (2020). Compact representation of temporal processes in echosounder time series via matrix decomposition. arXiv [Preprint]. Available online at: http://arxiv.org/abs/2007.02906 (accessed July 10, 2020).
Lentz, S. J. (2003). A climatology of salty intrusions over the continental shelf from georges bank to cape hatteras. J. Geophys. Res. Ocean. 108, 1–12. doi: 10.1029/2003jc001859
Lentz, S. J. (2008). Observations and a model of the mean circulation over the Middle Atlantic Bight continental shelf. J. Phys. Oceanogr. 38, 1203–1221. doi: 10.1175/2007JPO3768.1
Leung, C. K. S., MacKinnon, R. K., and Jiang, F. (2014). “Reducing the search space for big data mining for interesting patterns from uncertain data,” in Proc. - 2014 IEEE Int. Congr. Big Data, BigData Congr. 2014 (Piscataway, NJ: IEEE), 315–322.
Levine, R. M., Fogaren, K. E., Rudzin, J. E., Russoniello, C. J., Soule, D. C., and Whitaker, J. M. (2020). Software, Data, and Additional Documentation for: Open Data, Collaborative Working Platforms, and Interdisciplinary Collaboration (v1.0), Zenodo. Available online at: https://zenodo.org/record/4150102
Liu, Y., Qiu, M., Liu, C., and Guo, Z. (2017). Big data challenges in ocean observation: a survey. Pers. Ubiquitous Comput. 21, 55–65. doi: 10.1007/s00779-016-0980-2
Locarnini, R. A., Mishonov, A. V., Baranova, O. K., Boyer, T. P., Zweng, M. M., Garcia, H. E., et al. (2019). World Ocean Atlas 2018, Volume 1: Temperature. A. Mishonov Technical Ed. NOAA Atlas NESDIS 81. Washington, DC: NOAA.
Lozier, M. S., Reed, M. S. C., and Gawarkiewicz, G. G. (2002). Instability of a shelfbreak front. J. Phys. Oceanogr. 32, 924–944.
Mendez-Tejeda, R., Pérez-valentín, K. A., and Barreto-orta, M. (2020). Impact of extreme weather events on the beaches of puerto rico: the case of ocean park. San Juan. 8, 1–5. doi: 10.12691/marine-8-1-1
Ondoa, G. A., Almar, R., Castelle, B., Testut, L., Léger, F., Sohou, Z., et al. (2019). Sea level at the coast from video-sensed waves: comparison to tidal gauges and satellite altimetry. J. Atmos. Ocean. Technol. 36, 1591–1603. doi: 10.1175/JTECH-D-18-0203.1
ORION Executive Steering Committee (2005). Ocean Observatories Initiative Science Plan. Washington, DC: Joint Oceanographic Institutions Inc.
ORION Executive Steering Committee (2007). Ocean Observatories Initiative (OOI) Scientific Objectives and Network Design: A Closer Look. Washington, DC: Joint Oceanographic Institutions Inc.
Pershing, A. J., Alexander, M. A., Hernandez, C. M., Kerr, L. A., Le Bris, A., Mills, K. E., et al. (2015). Slow adaptation in the face of rapid warming leads to collapse of the Gulf of Maine cod fishery. Science 350, 809–812. doi: 10.1126/science.aac9819
Radetsky, P. (1994). The modern postdoc: prepping for the job market. Science 265, 1909–1910. doi: 10.1126/science.265.5180.1909
Ruhl, H. A., André, M., Beranzoli, L., Çaĝatay, M. N., Colaço, A., Cannat, M., et al. (2011). Societal need for improved understanding of climate change, anthropogenic impacts, and geo-hazard warning drive development of ocean observatories in European Seas. Prog. Oceanogr. 91, 1–33. doi: 10.1016/j.pocean.2011.05.001
Sagoolmuang, A., and Sinapiromsaran, K. (2017). “Median-difference window subseries score for contextual anomaly on time series,” in Proceedings of the 2017 8th Int. Conf. Inf. Commun. Technol. Embed. Syst. IC-ICTES 2017 - Proc (Piscataway, NJ: IEEE).
Sanders, F., and Gyakum, J. R. (1980). Synoptic–dynamic climatology of the “bomb”. Mon. Wea. Rev. 108, 1589–1606.
Schowengerdt, R. A. (2007). “The Nature of Remote Sensing,” in Remote Sensing, ed. R. A. Schowengerdt (Burlington: Elsevier), 1–10.
Smith, S. R., Alory, G., Andersson, A., Asher, W., Baker, A., Berry, D. I., et al. (2019). Ship-based contributions to global ocean, weather, and climate observing systems. Front. Mar. Sci. 6:434. doi: 10.3389/fmars.2019.00434
Trowbridge, J., Weller, R., Kelley, D., Dever, E., Plueddemann, A., Barth, J. A., et al. (2019). The ocean observatories initiative. Front. Mar. Sci. 6:74. doi: 10.3389/fmars.2019.00074
Venkatesan, R., Navaneeth, K. N., Vedachalam, N., and Atmanand, M. A. (2019). “Observing the oceans in real time - Need for affordable technology and capacity development,” in Proceedings of the Ocean. 2019 MTS/IEEE Seattle, Ocean (Piscataway, NJ: IEEE).
Ward, N. D., Megonigal, J. P., Bond-Lamberty, B., Bailey, V. L., Butman, D., Canuel, E. A., et al. (2020). Representing the function and sensitivity of coastal interfaces in Earth system models. Nat. Commun. 11, 1–14. doi: 10.1038/s41467-020-16236-2
Wenger-Trayner, E., and Wenger-Trayner, B. (2015). Communities of Practice: A Brief Introduction. Available online at: https://wenger-trayner.com/wp-content/uploads/2015/04/07-Brief-introduction-to-communities-of-practice.pdf (accessed June 27, 2020).
Wu, X., and Zhang, S. (2003). Synthesizing high-frequency rules from different data sources. IEEE Trans. Knowl. Data Eng. 15, 353–367. doi: 10.1109/TKDE.2003.1185839
Yang, P., Zhang, Y., Bastviken, D., Lai, D. Y. F., Yang, H., Zhang, Y. F., et al. (2020). Large increase in diffusive greenhouse gas fluxes from subtropical shallow aquaculture ponds during the passage of typhoons. J. Hydrol. 583:124643. doi: 10.1016/j.jhydrol.2020.124643
Zhang, W. G., and Gawarkiewicz, G. G. (2015). Dynamics of the direct intrusion of Gulf Stream ring water onto the Mid-Atlantic Bight shelf. Geophys. Res. Lett. 42, 7687–7695. doi: 10.1002/2015GL065530
Keywords: big data, ocean observing, ocean response, data mining, COVID-19 pandemic, remote collaboration, middle Atlantic bight, early career researchers
Citation: Levine RM, Fogaren KE, Rudzin JE, Russoniello CJ, Soule DC and Whitaker JM (2020) Open Data, Collaborative Working Platforms, and Interdisciplinary Collaboration: Building an Early Career Scientist Community of Practice to Leverage Ocean Observatories Initiative Data to Address Critical Questions in Marine Science. Front. Mar. Sci. 7:593512. doi: 10.3389/fmars.2020.593512
Received: 25 August 2020; Accepted: 02 November 2020;
Published: 03 December 2020.
Edited by:
Christopher Cvitanovic, Australian National University, AustraliaReviewed by:
Indi Hodgson-Johnston, University of Tasmania, AustraliaCopyright © 2020 Levine, Fogaren, Rudzin, Russoniello, Soule and Whitaker. This is an open-access article distributed under the terms of the Creative Commons Attribution License (CC BY). The use, distribution or reproduction in other forums is permitted, provided the original author(s) and the copyright owner(s) are credited and that the original publication in this journal is cited, in accordance with accepted academic practice. No use, distribution or reproduction is permitted which does not comply with these terms.
*Correspondence: Robert M. Levine, TGV2aW5lUkB1dy5lZHU=; Christopher J. Russoniello, Q2hyaXMucnVzc29uaWVsbG9AbWFpbC53dnUuZWR1
†Present address: Kristen E. Fogaren, Department of Earth and Environmental Sciences, Boston College, Chestnut Hill, MA, United States
Disclaimer: All claims expressed in this article are solely those of the authors and do not necessarily represent those of their affiliated organizations, or those of the publisher, the editors and the reviewers. Any product that may be evaluated in this article or claim that may be made by its manufacturer is not guaranteed or endorsed by the publisher.
Research integrity at Frontiers
Learn more about the work of our research integrity team to safeguard the quality of each article we publish.