
94% of researchers rate our articles as excellent or good
Learn more about the work of our research integrity team to safeguard the quality of each article we publish.
Find out more
ORIGINAL RESEARCH article
Front. Mar. Sci., 11 November 2020
Sec. Aquatic Microbiology
Volume 7 - 2020 | https://doi.org/10.3389/fmars.2020.589566
This article is part of the Research TopicTowards a Mechanistic Understanding of Marine Microbial EcosystemsView all 10 articles
 Haibo Li1,2,3
 Xue Chen1,2,3
 Michel Denis4
 Yuan Zhao1,2,3
 Lingfeng Huang5,6
 Zengjie Jiang7
 Wuchang Zhang1,2,3*
 Tian Xiao1,2,3
Microbial food web (MFW) in the seawater encompasses the smallest organisms: viruses, autotrophic prokaryotes and heterotrophic prokaryotes (HP), nanoflagellates, eukaryotic phytoplankton and ciliates. For many years, scientists investigated the MFW structure differences in distinct water masses. However, the MFW structure seasonal variation in coastal areas remains poorly documented. In this study, we report on the seasonal and spatial variations of the MFW structure in the temperate Sanggou Bay in four successive seasons, from spring to winter. With a temperature increase from 1.90 to 24.20°C, HP biomass increased from 3.77 to 135.77 μg C dm–3, almost covering the whole variation range for the global ocean. The autotrophic (AUTO) components, including Synechococcus, phototrophic picoeukaryotes (PEUK) and pigmented nanoflagellates (PNF), exhibited biomass variation ranges as large as previously reported. The MFW structure seasonal variation was driven by MFW relative biomasses (biomass ratios of MFW components to HP). With the increase of HP biomass, PNF and PEUK relative biomasses increased more rapidly than those of other groups while that of ciliates slightly decreased. The HETE:AUTO (biomass ratio of heterotroph to autotroph organisms) decreased with temperature, it was <1 in summer and >1 in other seasons. Cluster analyses distinguished Inside Bay and Outside Bay on the basis of hydrological characteristics. Consistently, the two subdivisions of Sanggou Bay exhibited different MFW structures as well as distinct tintinnid communities. The main MFW structure difference between Inside and Outside Bay was the biomass ratios of AUTO components to HP. Our results showed that the variations of autotrophic component biomass ratios relative to HP were the main factor responsible for the MFW structure seasonal variation. The spatial difference in MFW structure as well as in tintinnid taxonomic composition between Inside and Outside Bay was linked to the semienclosed nature of the Bay that does not favor efficient mixing with outside Yellow Sea waters.
The marine planktonic microbial food web (MFW) is a vital component of the pelagic ecosystem (Pomeroy, 1974; Azam et al., 1983). It encompasses the smallest marine organisms: viruses, autotrophic (Prochlorococcus and Synechococcus) prokaryotes and heterotrophic prokaryotes (HP), nanoflagellates, eukaryotic phytoplankton and ciliates (Sherr and Sherr, 1988; Kirchman, 2008). Abundances and biomasses of the MFW components may vary by 3 orders of magnitude in response to complex physiochemical and biological changes in different oceanic habitats. Very often they did not change in the same direction (increase or decrease) or with the same amplitude. Therefore, the spatial and temporal variations of MFW in different ocean areas are critical to our understanding of the pelagic ecosystem dynamics.
The biomass and abundance relationships among different MFW components (Microbial Structure) were compared in previous studies. According to the involved organisms, Microbial Structure was divided into several levels. Because picophytoplankton in one sample could be simultaneously analyzed by flow cytometry, the relative contribution of different picophytoplankton components (Synechococcus, Prochlorococcus and phototrophic picoeukaryotes) to total picophytoplankton was most frequently studied and was named as picophytoplankton community structure (e.g., Van Dongen-Vogels et al., 2012). When heterotrophic bacteria were included, it was called microbial community structure (Bock et al., 2018) or picoplankton community structure (e.g., Zubkov et al., 1998, 2000; Otero-Ferrer et al., 2018). The term MFW structure was used when ciliates and flagellates were incorporated into the microbial community (Garrison et al., 2000), which was scarcely studied.
The Microbial Structure temporal variation in a given study site is poorly documented. At two deep (>1000 m) Adriatic Sea stations, picoplankton community was dominated by SYN in December, while HP and PEUK were dominant in April (Šantić et al., 2019). Picoplankton community structure was investigated over 6 months at a station off Baja California (>100 m depth). Picoplankton biomass was positively and significantly correlated with Chl a (Linacre et al., 2010). In the Arabian Sea, HP biomass was higher than other MFW components in all seasons (Garrison et al., 2000). Temperate coastal waters exhibited the largest seasonal temperature differences in the world ocean (Mackas et al., 2012) which might generate MFW structure seasonal variations. However, the seasonal variation of MFW in temperate coastal waters has rarely been studied.
In contrast with the seasonal variation, the Microbial Structure spatial variation received more attention. At large scale level, different provinces exhibited different picoplankton community structures along the Atlantic Meridional Transect (Zubkov et al., 1998, 2000) and between coastal water and open sea in the central Adriatic Sea (Šantić et al., 2014). At mesoscale, microbial community structure was compared inside and outside of mesoscale eddies (Fernandez et al., 2008). At smaller scale, upwelling conditions influenced the picoplankton community structure in oceans south of Australia (Van Dongen-Vogels et al., 2012) and in coastal China Sea (Wu et al., 2014). Stratification (Bouman et al., 2011; Mena et al., 2019) and fronts (Pan et al., 2006) also separated water masses with different Microbial Structure. The coast geomorphology increases the diversity of habitat (Pierrot-Bults and Angel, 2012). The shoreline curvature forms bays in many places around the world ocean, which trap seawater inside and generate different environmental conditions with outside of the bay. As a result, the MFW inside and outside of the bay might be different, but this remains to be substantiated.
Sanggou Bay located in the east part of Shandong Peninsula, is a semi-enclosed (mouth of 11.5 km, area of 144 km2) Bay in the Yellow Sea (Figure 1). The maximum and average depths of the Bay are 21 and 7.5 m, respectively. The seasonal temperature variation of 2–26°C in Sanggou Bay (Kuang et al., 1996) is one of the largest in the world ocean (Mackas et al., 2012). In fact, only very limited regions of the ocean have annual temperature variation larger than 12°C (Mackas et al., 2012). Sanggou Bay is among the most heavily exploited bays in the world, with suspended aquaculture rafts covering nearly 2/3 of the area. Each raft holds up cultured plants (kelps, asparagus) or animals (oysters, scallops) over most of the year. The cultured organisms could influence the MFW through releasing dissolved organic matter and direct grazing on the MFW (Lu et al., 2015a, b; Zhao et al., 2016). As the Yellow Sea waters intrude into the Bay from the north and outflow from the south slowly, water masses should be different inside and outside of the Bay (Zeng et al., 2015).
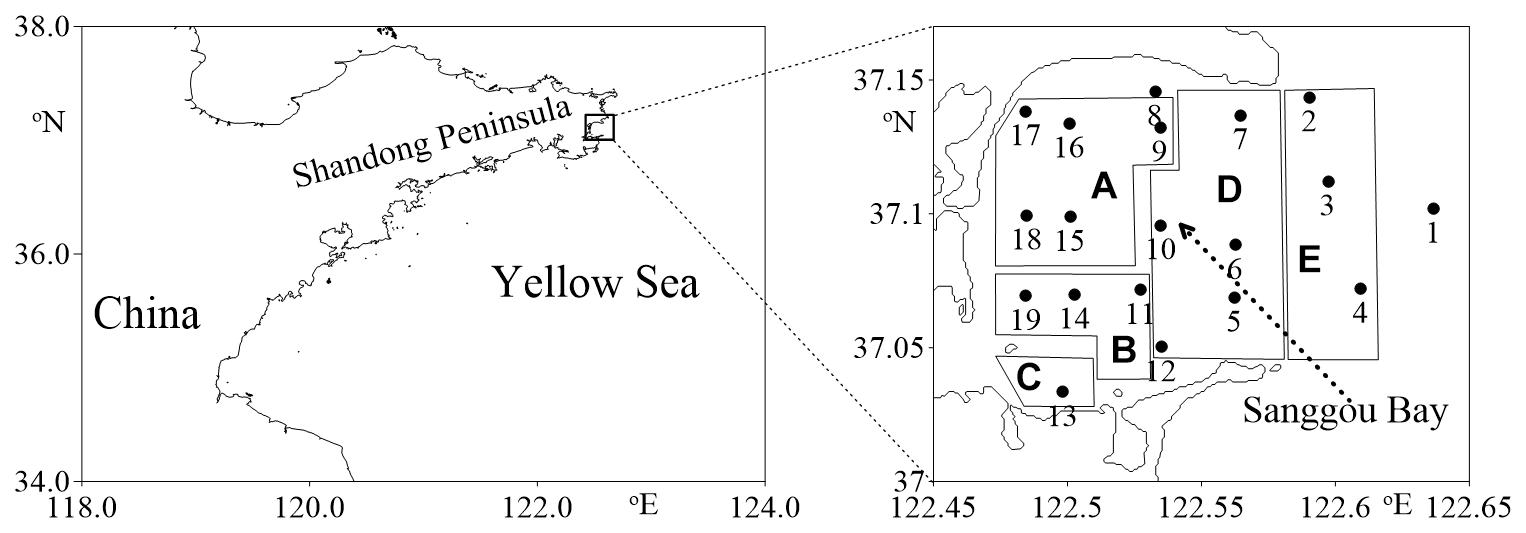
Figure 1. Location of the sampling stations superimposed on the aquaculture area [(A) scallop monoculture area, (B) oyster monoculture area, (C) fish monoculture area, (D) kelp and bivalve polyculture area, (E) kelp Saccharina japonica monoculture area].
In this study, we analyzed the biomass of different MFW components in the Sanggou Bay in four successive seasons (from spring to winter) in order to identify (1) the seasonal variation of the MFW structure; (2) the difference of MFW structure inside and outside the Bay. Our hypotheses are that (1) variation trends and amplitudes of MFW components in different seasons should be different, which will lead to the seasonal variation of MFW structure; (2) differences of water masses inside and outside of the Bay will induce MFW structure differences.
The Sanggou Bay MFW was assessed in the area located in 37.02–37.15°N and 122.45–122.65°E (Figure 1). Four cruises were conducted on spring (April 23–24, 2011), summer (August 3–4, 2011), autumn (October 26–27, 2011), and winter (January 5–6, 2012), on board the R/V Lurongyuyang-65577. The same 19 stations were occupied and sampled at each cruise (Figure 1).
Surface seawater samples were collected by bucket at each station. Temperature and salinity of surface seawater were determined by a portable water quality analyzer YSI (Professional Plus made in United States) as soon as the seawaters were collected by dropping the probe into the bucket seawater. Different subsamples were collected for chlorophyll a (Chl a) concentration determination, abundances of picoplankton, nanoflagellates and ciliates counting. Picoplankton included HP, Synechococcus (SYN) and phototrophic picoeukaryotes (PEUK). Nanoflagellates (NF) were divided into pigmented NF (PNF) and heterotrophic NF (HNF). We defined SYN, PEUK and PNF as autotrophic organisms, while HP, HNF and ciliates were defined as heterotrophic organisms. ACLW-RS chlorophyll turbidity temperature sensor (ALEC Electronics Co., Ltd., Japan) with a precision of ±0.1 μg dm–3 was used to determine the Chl a concentration. Detailed description of nutrient concentration determination was shown in Zhao et al. (2016).
Picoplankton subsamples (5 cm3) were fixed onboard with paraformaldehyde (final concentration 1%) immediately after collection and kept at room temperature for about 15 min, then freeze-trapped and stored in liquid nitrogen on the boat. Samples were stored at −80°C once in the laboratory where analyses were carried out within 3 months.
The seawater samples were thawed at room temperature before analysis. Picoplankton analyses were run with a FACS Vantage SE flow cytometer (Becton Dickinson) equipped with a water-cooled argon laser (488 nm, Coherent). To analyze autotrophic picoplankton, subsamples (1 cm3) were initially supplemented with 1 mm3 fluorescent beads suspension (2 μm, Polysciences) to be used as internal standard, and red fluorescence was set as the trigger signal to discard signals from HP and inorganic particles. SYN and PEUK were resolved on the basis of their side scatter and red fluorescence signals (Marie et al., 2000). For HP analysis, seawater subsamples (50 mm3) were diluted five fold with TE buffer (Tris-EDTA, 100 mM Tris-Cl, 10 mM EDTA, pH = 8.0, Sigma, United States), then stained with the nucleic acid dye SYBR Green I (Molecular Probes, United States) (final dilution 10–4, v/v) and let incubate 20 min in the dark before analysis. HP were resolved on the basis of their green fluorescence from staining and scatter properties (Marie et al., 2000). Data was collected and analyzed with CellQuest software (Version 3.3, Becton Dickinson). Biomass values of SYN, PEUK and HP were calculated by using the following conversion factors: 250 fg C cell–1 (Li et al., 1992), 1500 fg C cell–1 (Zubkov et al., 1998), 20 fg C cell–1 (Lee and Fuhrman, 1987), respectively.
For the enumeration of NF cells, seawater samples were pre-filtered through a nylon mesh of 20 μm pore size by gravity, then fixed with cold glutaraldehyde (final concentration 0.5%, v/v). Subsamples (20 cm3) were filtered onto 0.2 μm pore size black polycarbonate membrane filters at <100 mm Hg pressure. When 1 cm3 of the sample remained in the funnel, turned off the vacuum pump and stained the sample with DAPI (final concentration 10 μg cm–3) for 5 min, then turned on the pump again to let the residual liquid pass through the membrane filter completely. Then mounted the filter on a microscope slide, dropped a few drips of paraffin on the filter center and placed a coverslip on the top. Finally, stored the sample slide in the dark at −20°C immediately. NF cells were counted using epifluorescence microscopy (Leica DM4500B) at 1000× magnification. PNF and HNF were distinguished by the presence of red-autofluorescence in the former with a blue excitation filter set (Tsai et al., 2005). At least 30 fields of view were examined. Flagellates abundances were calculated from the average of cell counts made on duplicate samples. The length and width of a NF cell were measured on photomicrographs using the Leica DM 4500 self-carried software. At least 60 cells (PNF and HNF) were measured per sample. Cell volumes of NF individuals were estimated by assuming their nearest geometrical figures. The mean cell volumes were estimated and converted to carbon biomass using a conversion factor of 0.22 pg C μm–3 (Børsheim and Bratbak, 1987).
For ciliate counts, 1 dm3 seawater samples were fixed with Lugol’s solution (final concentration 1%). After 48 h settling, the supernatant was gently siphoned out to concentrate each ciliate sample to about 100 cm3. A subsample of 20 or 25 cm3 was settled in an Utermöhl counting chamber for at least 24 h, then examined using an inverted microscope (Olympus IX 71) at magnification of 100× or 200×. Aloricate ciliates and tintinnids were counted and their abundances were calculated respectively. Species of tintinnids were identified based on their morphological characteristics according to references (Kofoid and Campbell, 1929, 1939; Zhang et al., 2012). About 5–10 individuals of each species (a total of 75–150 individuals) were picked out randomly for calculating the biovolume. Ciliate dimensions including body length, oral diameter, etc., were measured and average biovolume of each taxon was estimated from appropriate geometric shapes. Biomass values of aloricate ciliates were calculated from their biovolume multiplied by a conversion factor (0.19 pg C μm–3) (Putt and Stoecker, 1989). The tintinnid biomass was assumed to occupy 30% of the lorica volume (Gilron and Lynn, 1989).
Correlation analysis was conducted using SPSS version 19. Spearman rank correlation analysis was used to estimate relationships between biological and environmental variables. Cluster analysis was performed using Primer 5.0 based on (i) environment variables (temperature, salinity), (ii) biomasses of six microbial groups, and (iii) abundances of different tintinnid species. Group-average linkage based on Bray-Curtis similarity matrix of fourth root transformed from original data was used.
Seasonally, temperature varied within a large range (Table 1) from 1.90°C in winter to 24.20°C in summer. Salinity fell in the range 26.17–31.57 over all four seasons, with the lowest salinity value observed in summer and the highest in winter. Over the four seasons, chlorophyll a (Chl a) concentration varied from 0.42 to 38.74 μg dm–3 (Figure 2 and Table 1). Both the lowest and the highest concentration of dissolved inorganic nitrogen (DIN) occurred in autumn, which were 0.96 and 32.15 μM, respectively. Average DIN concentration was the lowest in summer and highest in autumn. PO43– concentration fell in the range 0.00–0.23 μM over all four seasons, average concentration was the highest in spring and the lowest in winter (Table 1).
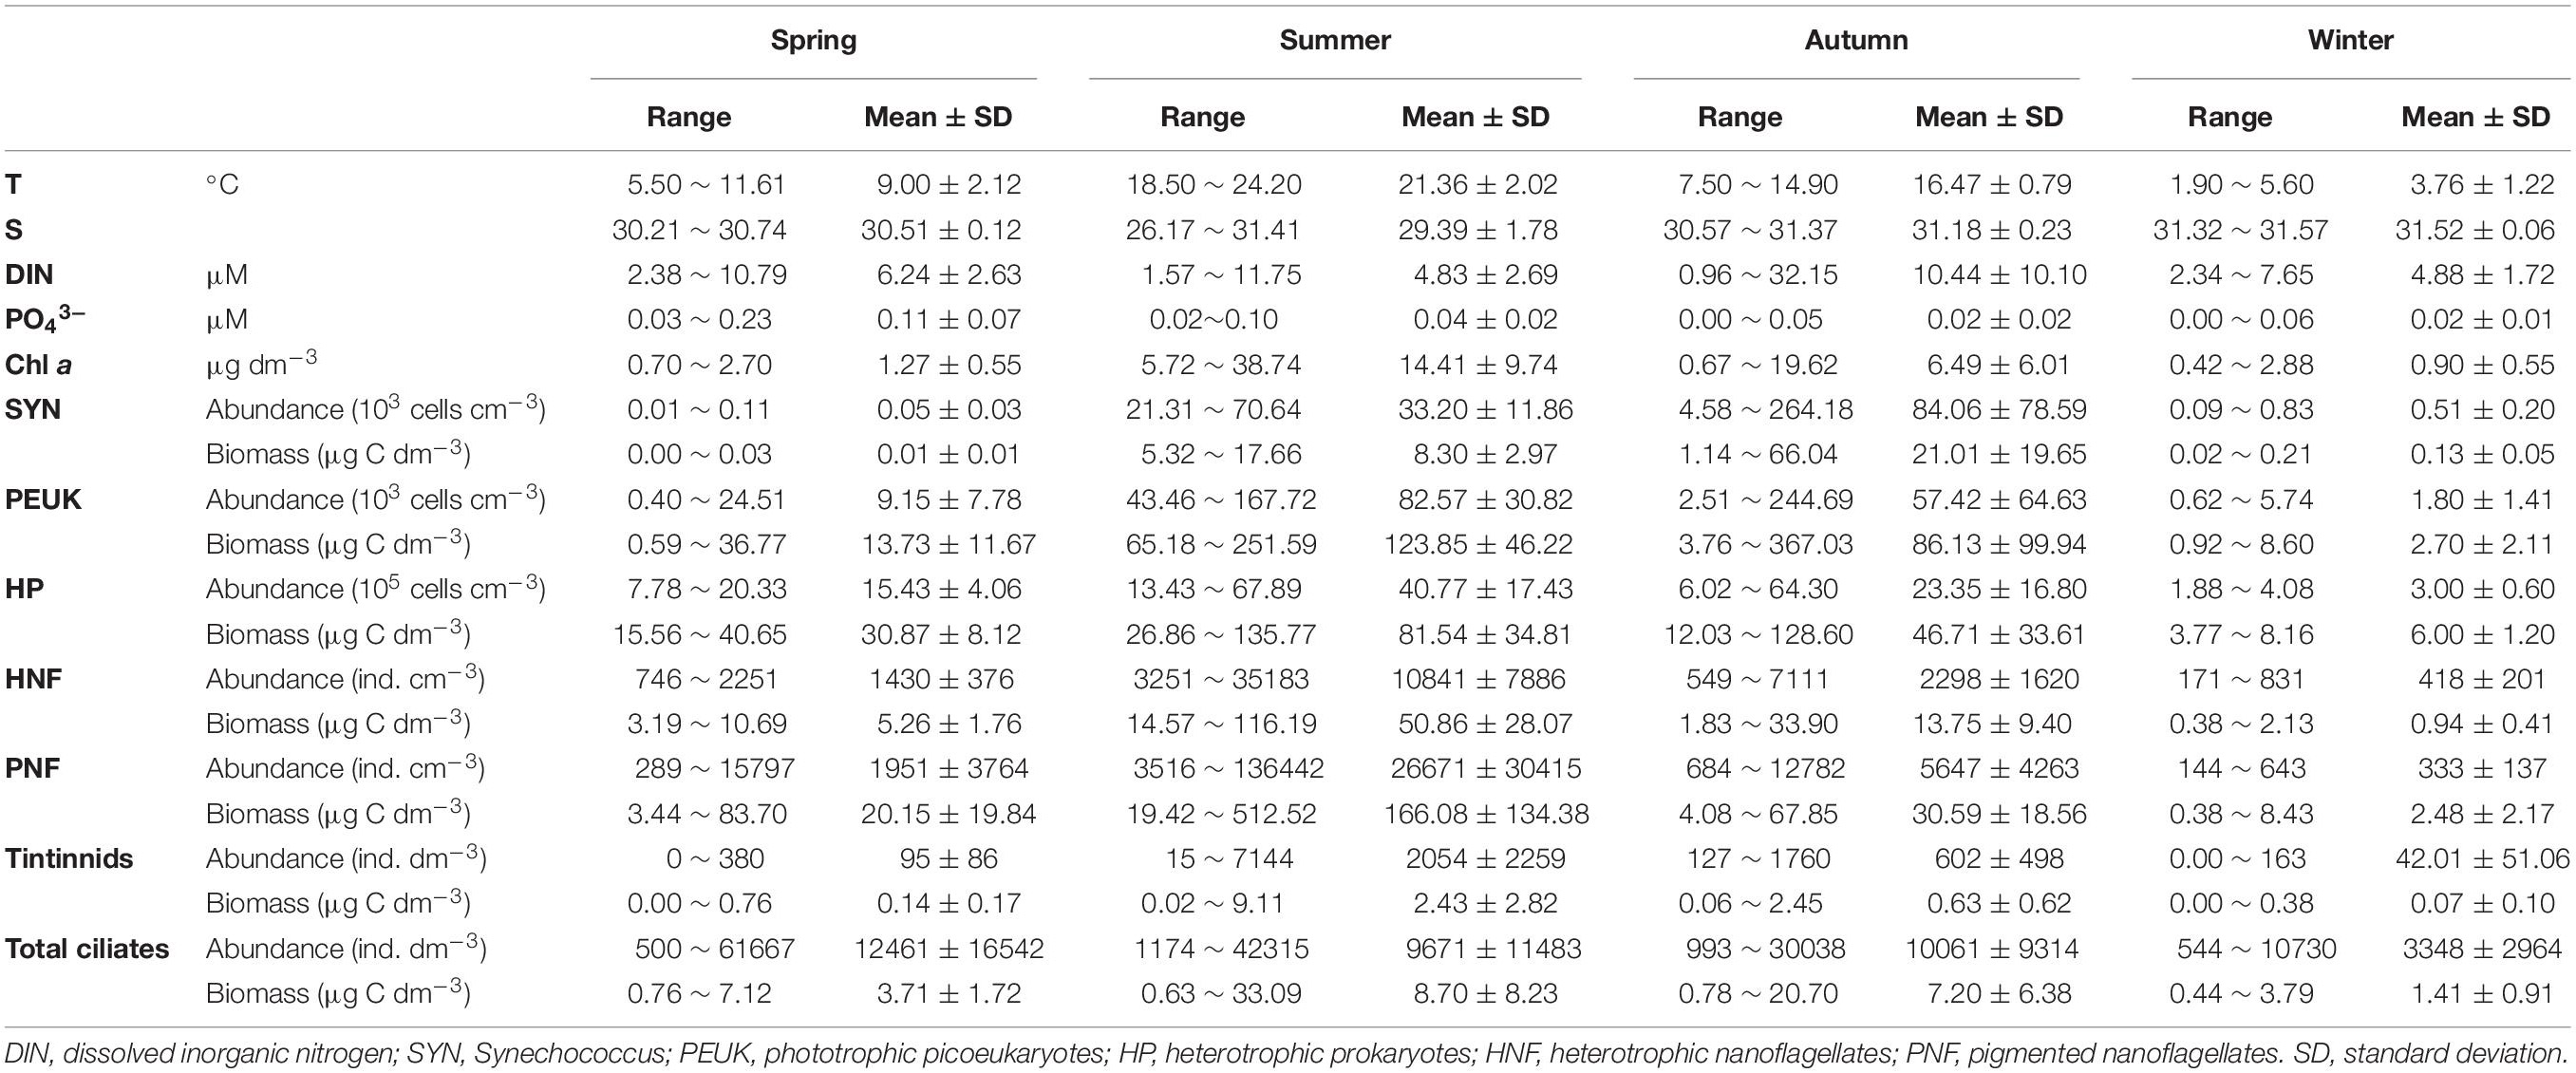
Table 1. Maximum, minimum, and average values of temperature (T), salinity (S), Chlorophyll a concentration (Chl a), nutrient concentrations, microbial food web component abundances and biomasses in Sanggou Bay at four consecutive seasons.
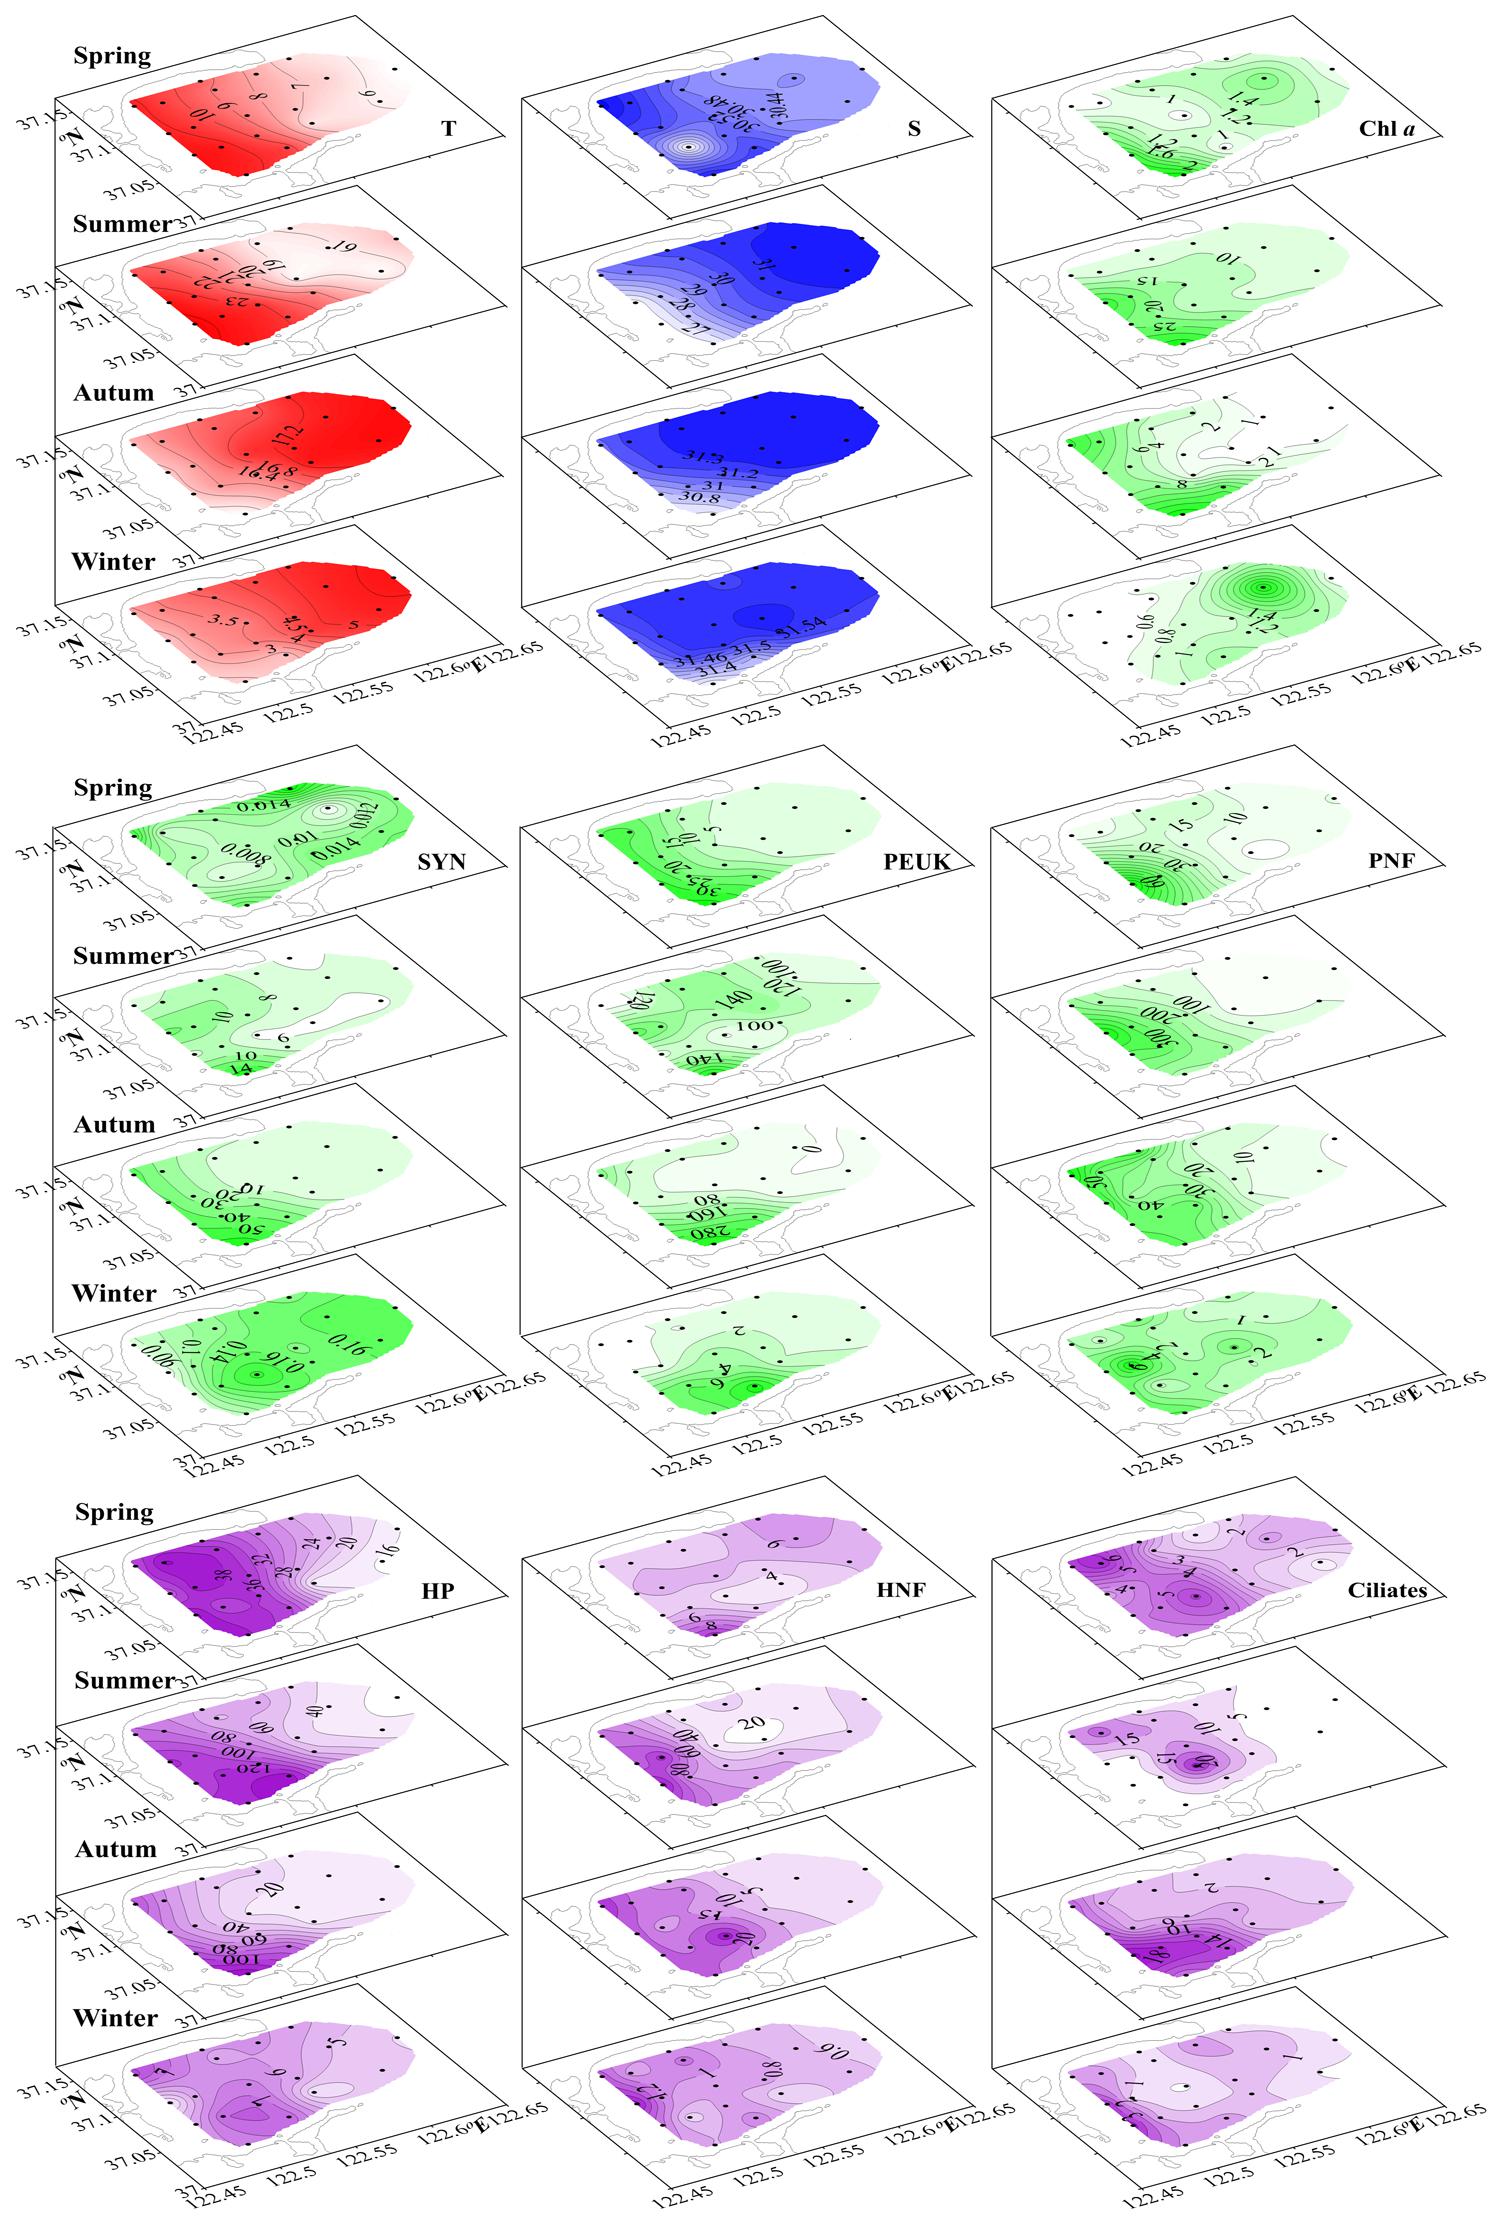
Figure 2. Seasonal surface distribution of temperature (T, °C), salinity (S), Chlorophyll a concentration (Chl a, μg dm–3), and microbial food wed component biomasses (μg C dm–3) through four successive seasons, spring to winter. SYN, Synechococcus; PEUK, phototrophic picoeukaryotes; PNF, pigmented nanoflagellates; HP, heterotrophic prokaryotes; HNF, heterotrophic nanoflagellates.
Temperature and salinity had obvious changes from outer part to inner part of the bay. The outer part had higher temperature in autumn and winter and vice versa in spring and summer (Figure 2). The inner part had lower salinity in summer, autumn and winter. The spatial salinity difference was very narrow in spring, autumn and winter (0.53, 0.74, and 0.25, respectively). In summer, salinity varied in the range 26.17–31.41 (Table 1). Similarly, Chl a concentrations showed inner-outer Bay gradients. In spring, Chl a concentration was high in both outer and inner parts of the bay with a narrow band of low values in between. In summer and autumn, Chl a concentration was very high in the inner part of the bay and sharply decreased toward outer part. In winter, it was higher in the outer part than in the inner part (Figure 2).
The six MFW component abundances and biomasses varied with seasons. HP abundances and biomasses were in the ranges 1.88–67.89 × 10⁵ cells cm–3 and 3.77–135.77 μg C dm–3, respectively (Table 1). Biomasses of all MFW components showed positive and significant correlations with temperature and Chl a (all P < 0.01; Supplementary Table S1). However, the amplitude of their increase was not proportional to that of temperature (Figure 3). Biomasses of most MFW components except SYN showed negative and significant correlations with salinity (P < 0.01; Supplementary Table S1).
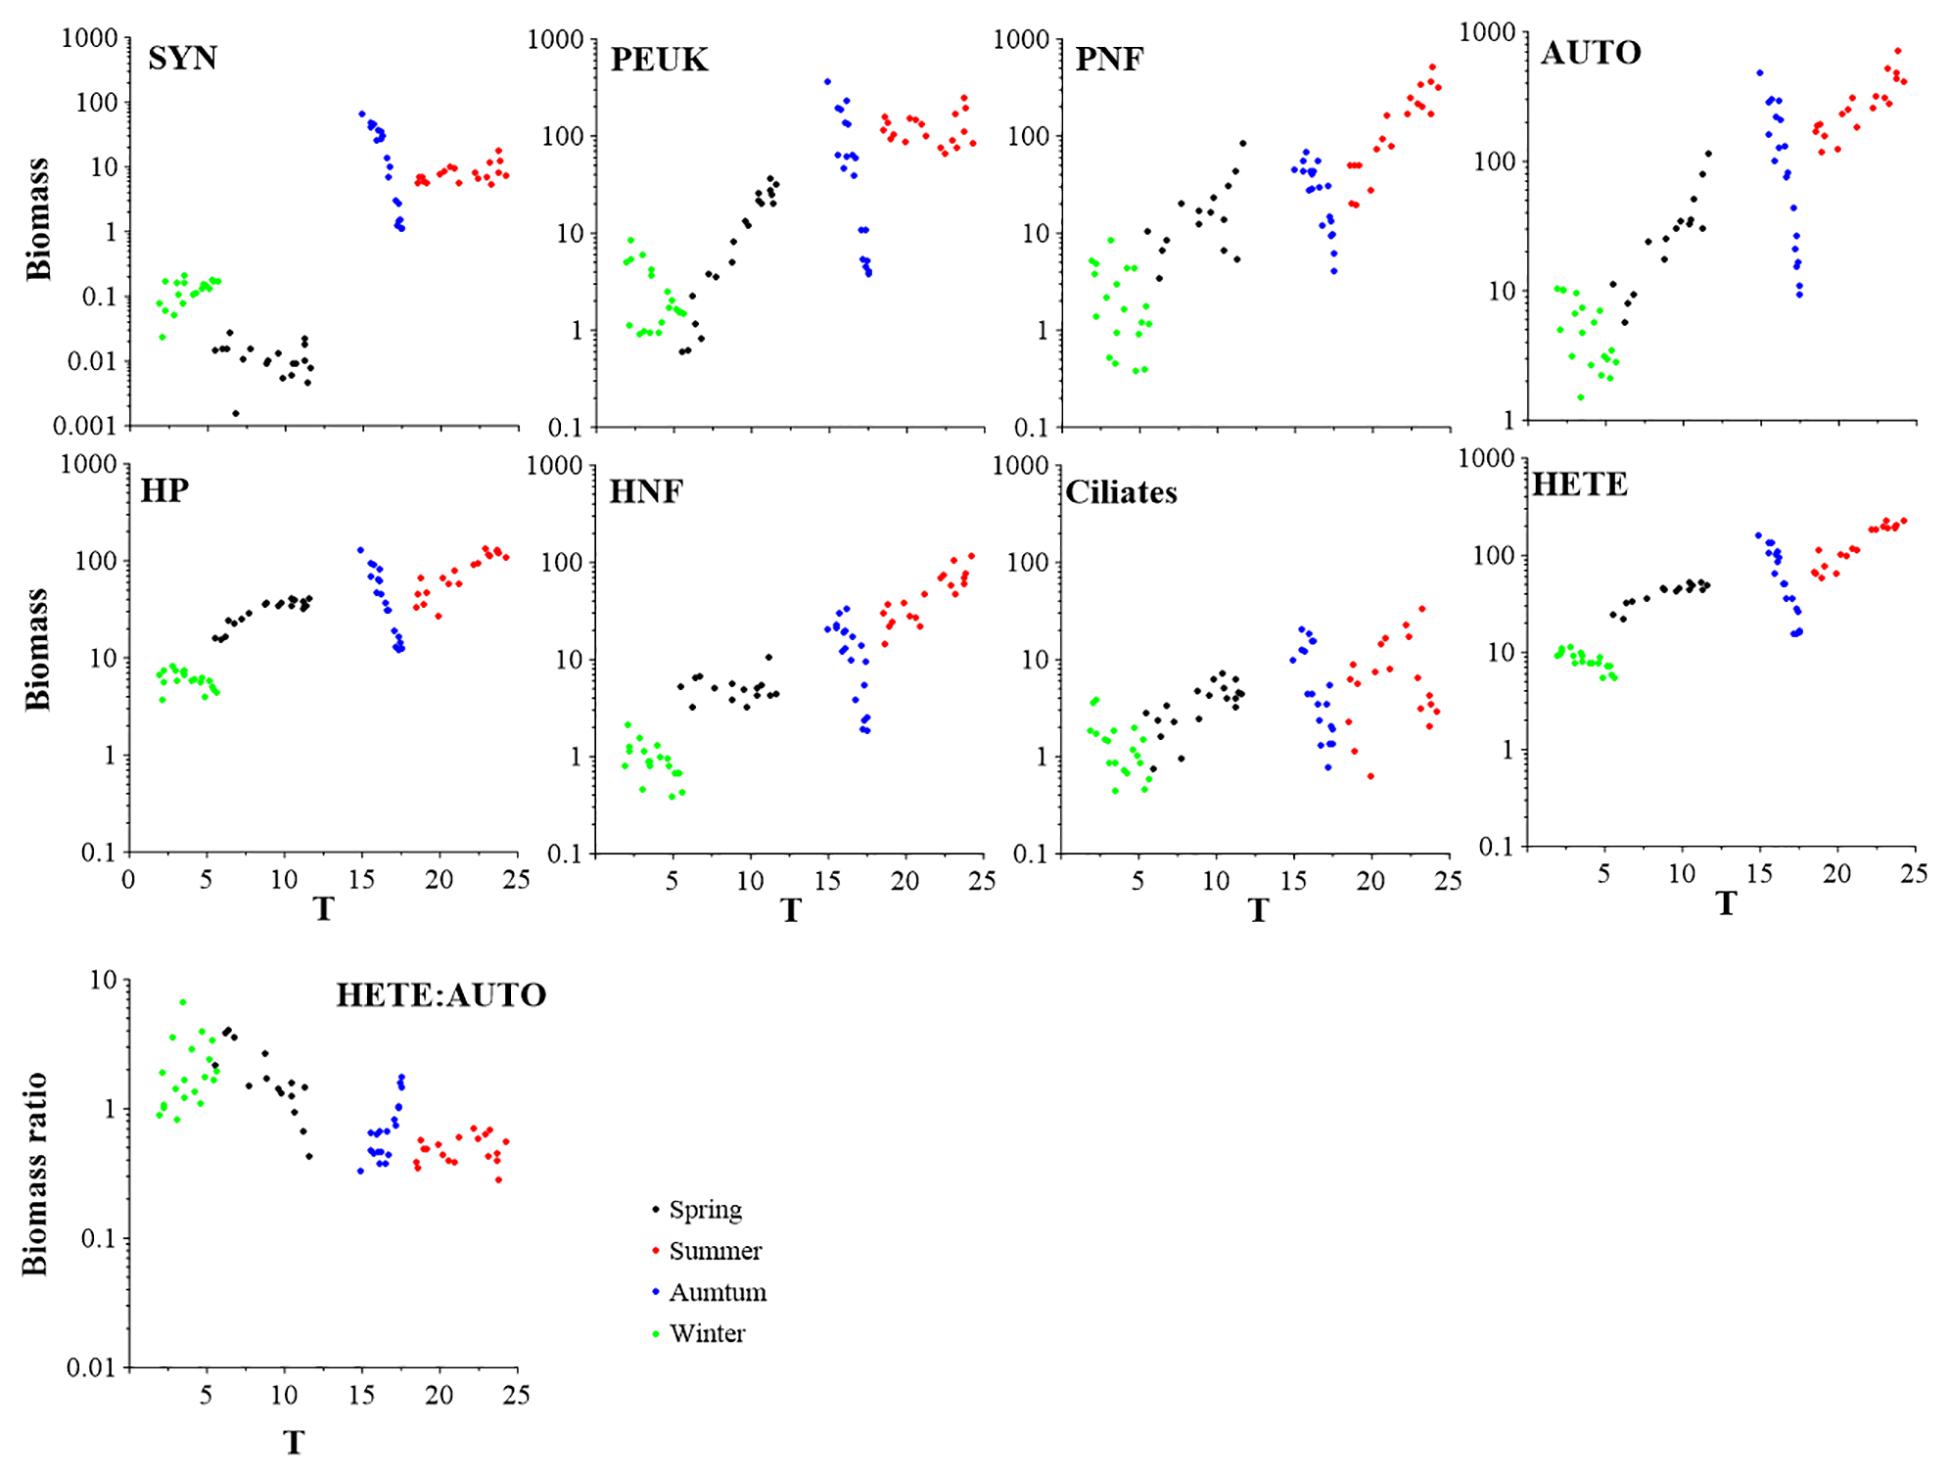
Figure 3. Variations of different microbial food web component biomasses (μg C dm–3) and biomass ratio of HETE to AUTO with respect to temperature increase. SYN, Synechococcus; PEUK, phototrophic picoeukaryotes; PNF, pigmented nanoflagellates; HP, heterotrophic prokaryotes; HNF, heterotrophic nanoflagellates; AUTO, autotrophic organisms; HETE, heterotrophic organisms.
The autotrophic (AUTO) and heterotrophic (HETE) biomasses were in the ranges 1.50–720.27 and 5.40–227.29 μg C dm–3, respectively. The AUTO and HETE biomasses showed significant positive correlations with temperature (all P < 0.01; Supplementary Table S1), but AUTO biomass increased faster than that of HETE (Figure 3). Consequently, the biomass ratio HETE:AUTO showed significant and negative correlations with temperature (P < 0.01; Supplementary Table S2).
Totally 26 tintinnid species belonging to 8 genera were identified with 4, 14, 13, and 8 species in spring, summer, autumn and winter, respectively. Among them, only Tintinnopsis beroidea was observed in all four seasons, T. acuminate occurred in 3 seasons, 7 species occurred in 2 seasons. Total tintinnid abundance was higher in summer and autumn than in winter and spring (Figure 4 and Table 1).

Figure 4. Tintinnid and main species abundance (ind. dm–3) surface distribution in four successive seasons, spring to winter.
To assess the MFW structure, the biomass values of the MFW components [including Synechococcus (SYN), phototrophic picoeukaryotes (PEUK), pigmented nanoflagellates (PNF), heterotrophic nanoflagellates (HNF)] and ciliates were normalized by that of HP belonging to the same sample. Among them, PNF relative biomass had the largest variation range from 0.06 (St.7 in winter) to 4.20 (St. 18 in summer). SYN relative biomass had the narrowest variation range from 0.00 (St.3 in spring) to 0.64 (St.11 in autumn). Ciliate relative biomass was in the range 0.02 to 0.94, while PEUK relative biomass was in the range of 0.04–3.57 (Figures 5, 6). The relative biomasses of most MFW components showed significant positive correlations with temperature, Chl a and HP biomass except ciliates which was significantly and negatively correlated with those environmental variables (P < 0.01; Supplementary Table S2). All autotrophic (AUTO) components relative biomasses increased with HP biomass at a higher rate than HNF and ciliates. The only exception was that ciliate relative biomass decreased when HP biomass increased (Figure 5).
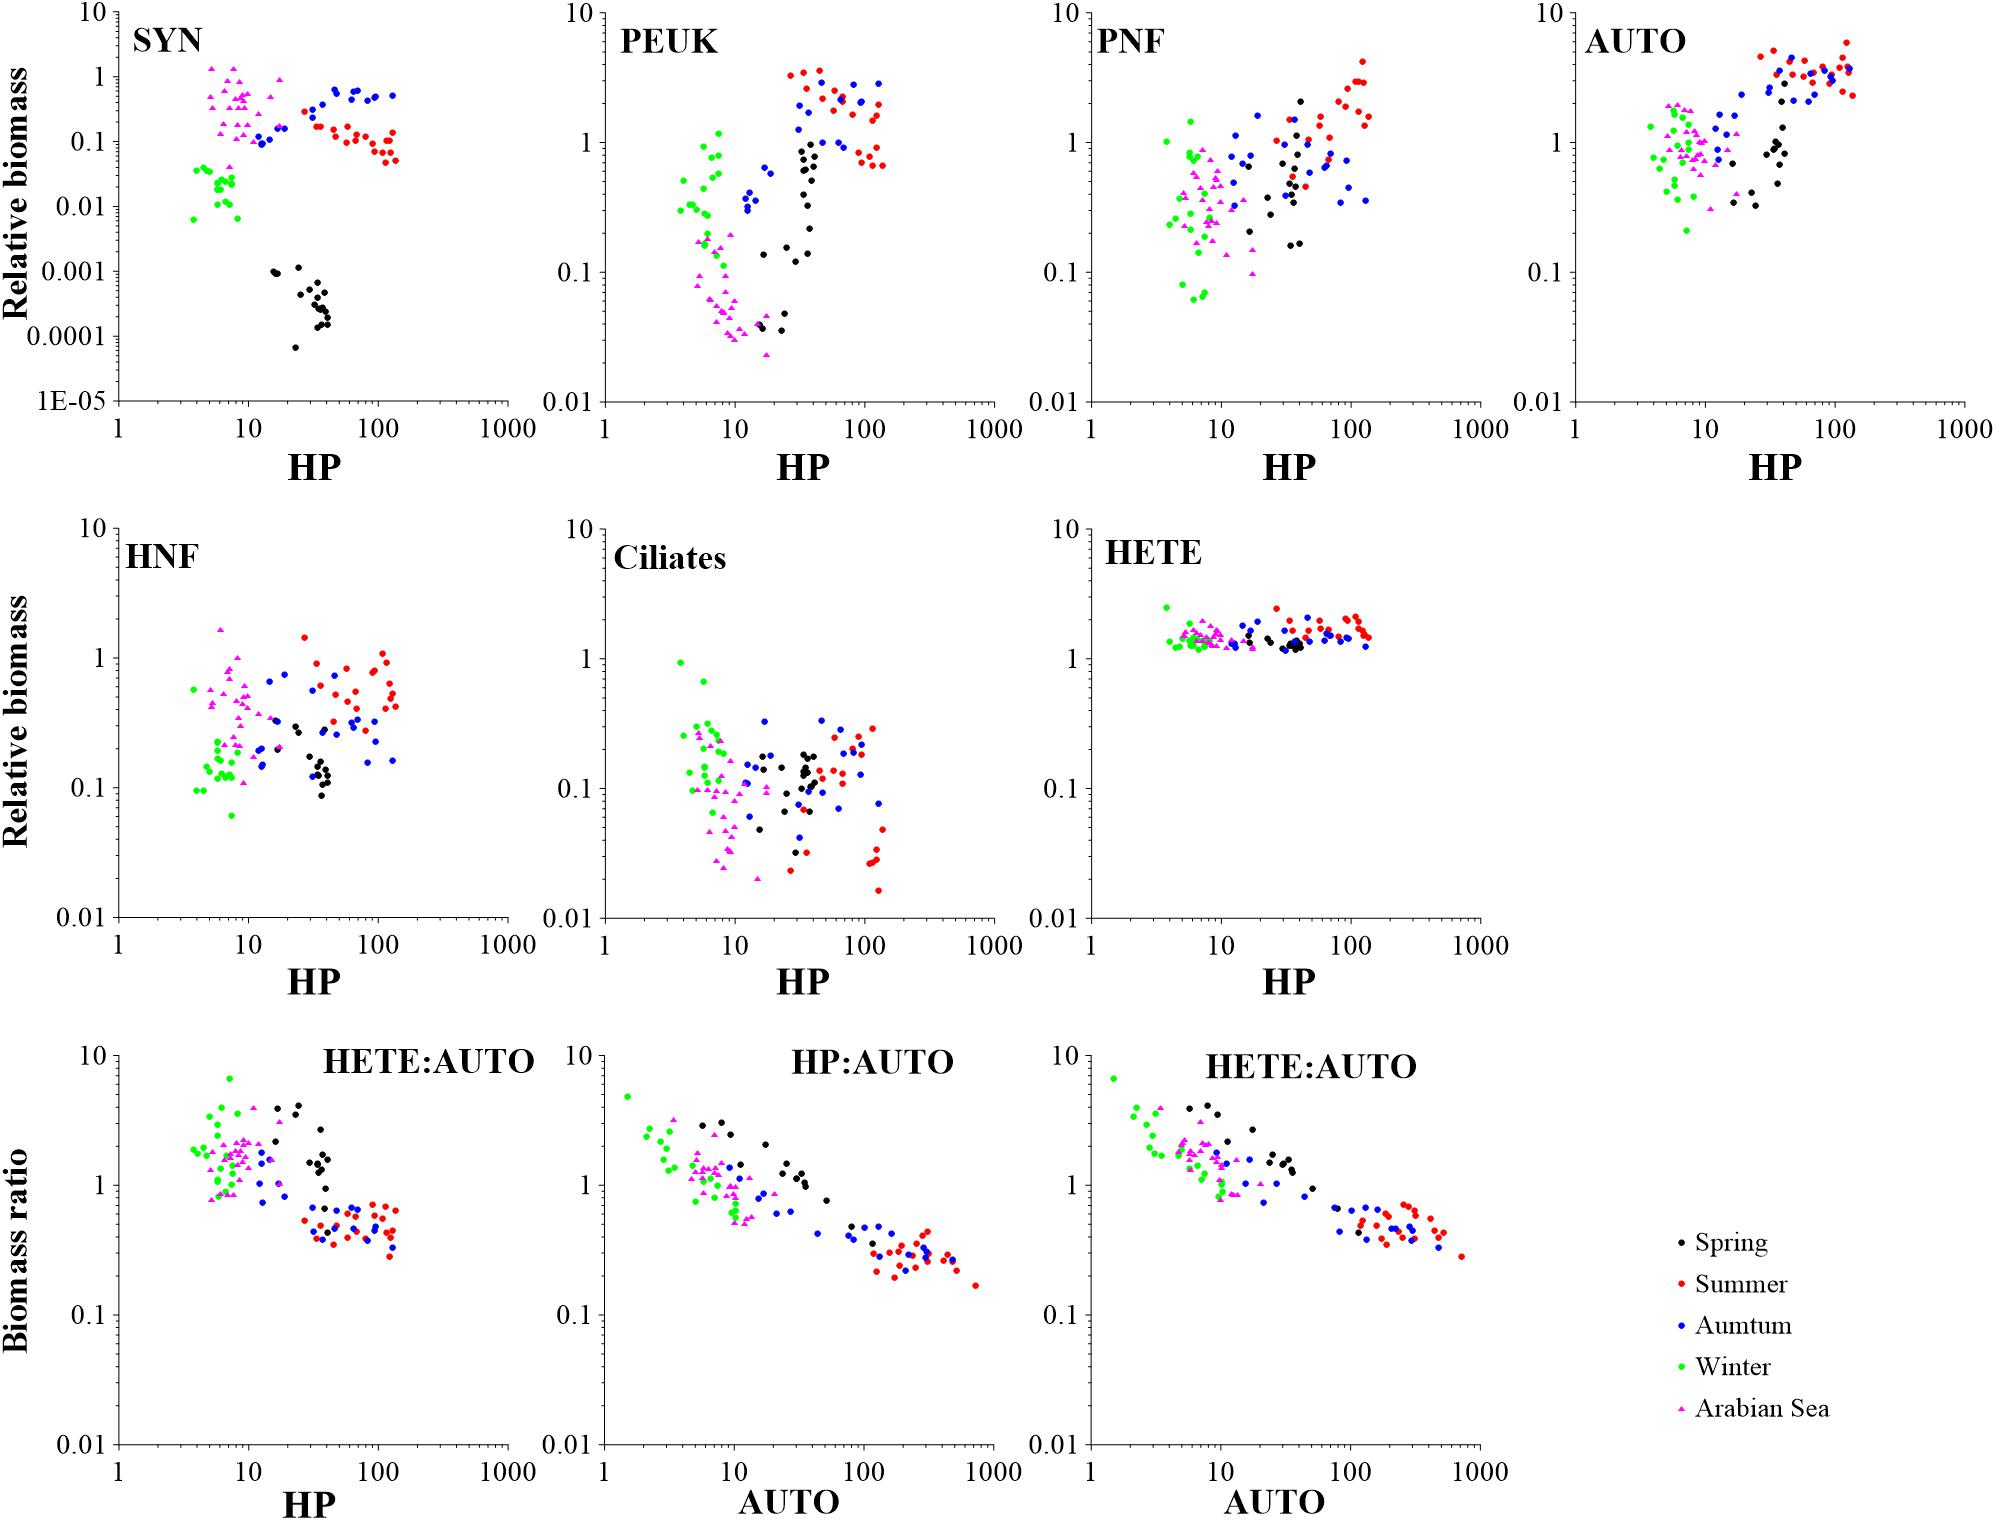
Figure 5. Microbial food web component biomass variations relative to HP biomass (μg C dm–3) changes. HETE to AUTO biomass ratio variations as a function of HP biomass increase and AUTO biomass (μg C dm–3) in Sanggou Bay and Arabian Sea. The data of Arabian Sea were extracted from Garrison et al. (2000). HP, heterotrophic prokaryotes; SYN, Synechococcus; PEUK, phototrophic picoeukaryotes; PNF, pigmented nanoflagellates; HNF, heterotrophic nanoflagellates; AUTO, autotrophic organisms; HETE, heterotrophic organisms.
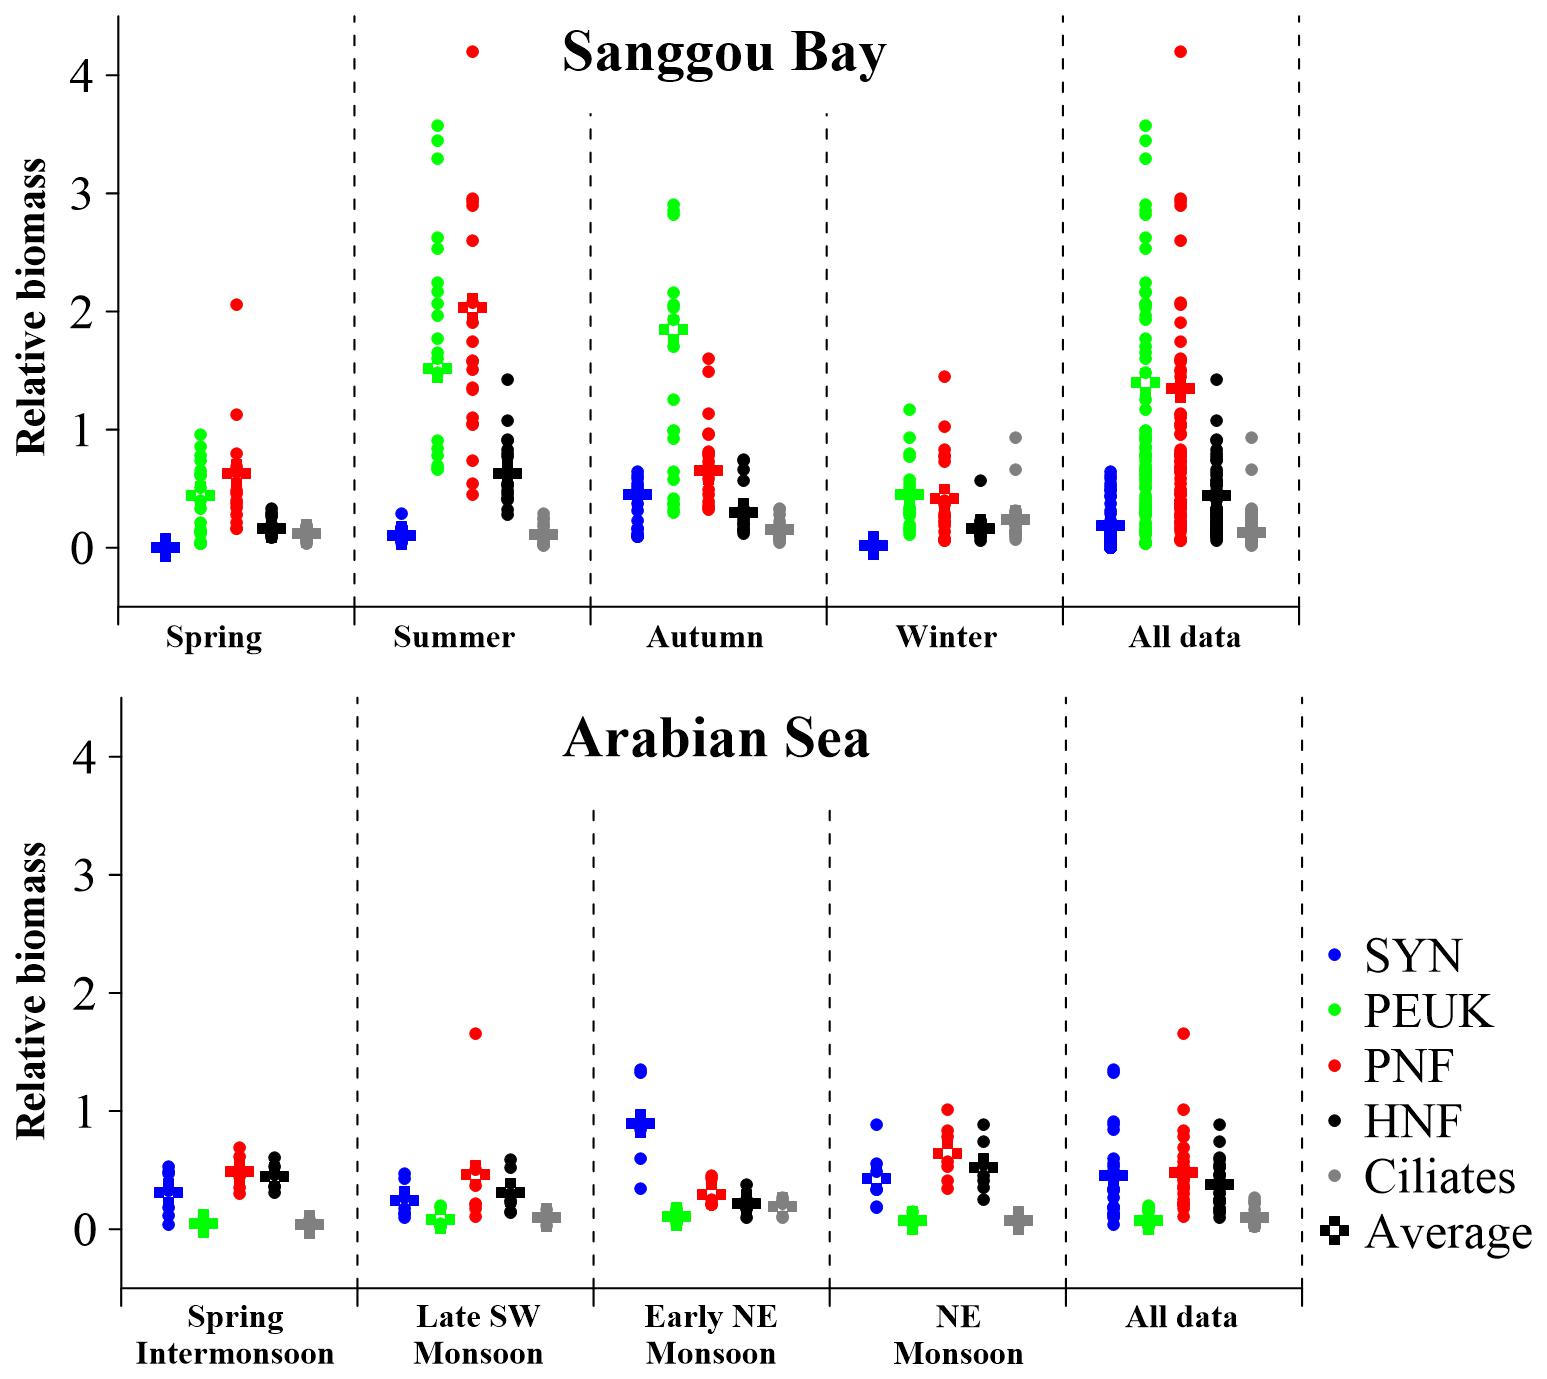
Figure 6. Microbial food web structures in Sanggou Bay and Arabian Sea in four successive seasons and Monsoon stages, respectively. The data of Arabian Sea were extracted from Garrison et al. (2000). The relative biomasses of the MFW components were normalized by the HP biomass belonging to the same sample. SYN, Synechococcus; PEUK, phototrophic picoeukaryotes; PNF, pigmented nanoflagellates; HNF, heterotrophic nanoflagellates.
The annual averaged MFW structure was thus HP: SYN: PEUK: PNF: HNF: ciliates = 1: 0.18: 1.40: 1.35: 0.44: 0.13 (Figure 6). The average relative biomass (ARB) seasonal variation trends of different organisms were distinct. ARBs of SYN and PEUK increased from spring to autumn and decreased in winter. ARBs of PNF and HNF increased from spring to summer, then decreased from summer to winter. ARB of ciliates decreased slightly from spring to summer, then increased until winter (Figure 6).
ARBs of all MFW components were <1 in spring and winter. ARBs of PEUK and PNF were >1, while SYN, HNF and ciliates were <1 in summer. In autumn, only ARB of PEUK was >1 (Figure 6). SYN ARB was lower than that of PEUK and PNF at all seasons, and was lower than that of HNF in spring, summer and winter. PEUK ARB was lower than that of PNF in spring and summer, but higher in autumn and winter. In spring and summer, PEUK ARB was higher than that of other organisms, whereas in autumn and winter, PNF ARB was the highest. PEUK and PNF ARBs were >1 over a year, while SYN, HNF and ciliate ARBs were <1 (Figure 6).
The biomass ratio of HP:AUTO decreased with the increase of AUTO biomass. When the biomass ratio of HP:AUTO was about 1, the AUTO biomass was in the range of 6–35 μg C dm–3 (Figure 5). In winter and spring, the biomass ratio HETE:AUTO was >1, while it was <1 in summer. When the biomass ratio HETE:AUTO was about 1, the HP and AUTO biomasses were in the range 5–13 and 10–40 μg C dm–3, respectively (Figure 5).
Biomass ratios of HP, HNF and ciliates to HETE were in the ranges of 0.40–0.86, 0.05–0.58, and 0.01–0.37, respectively (Figure 7). The relationships between biomass ratios of different HETE components to HETE were different: HP and ciliates were significantly and negatively correlated with HETE, while HNF was significantly and positively correlated with HETE (all P < 0.01; Supplementary Table S2). With the increase of preys (HP, SYN, PEUK, PNF, and HNF) biomass, biomass ratio of Ciliates:Preys decreased (Figure 7).
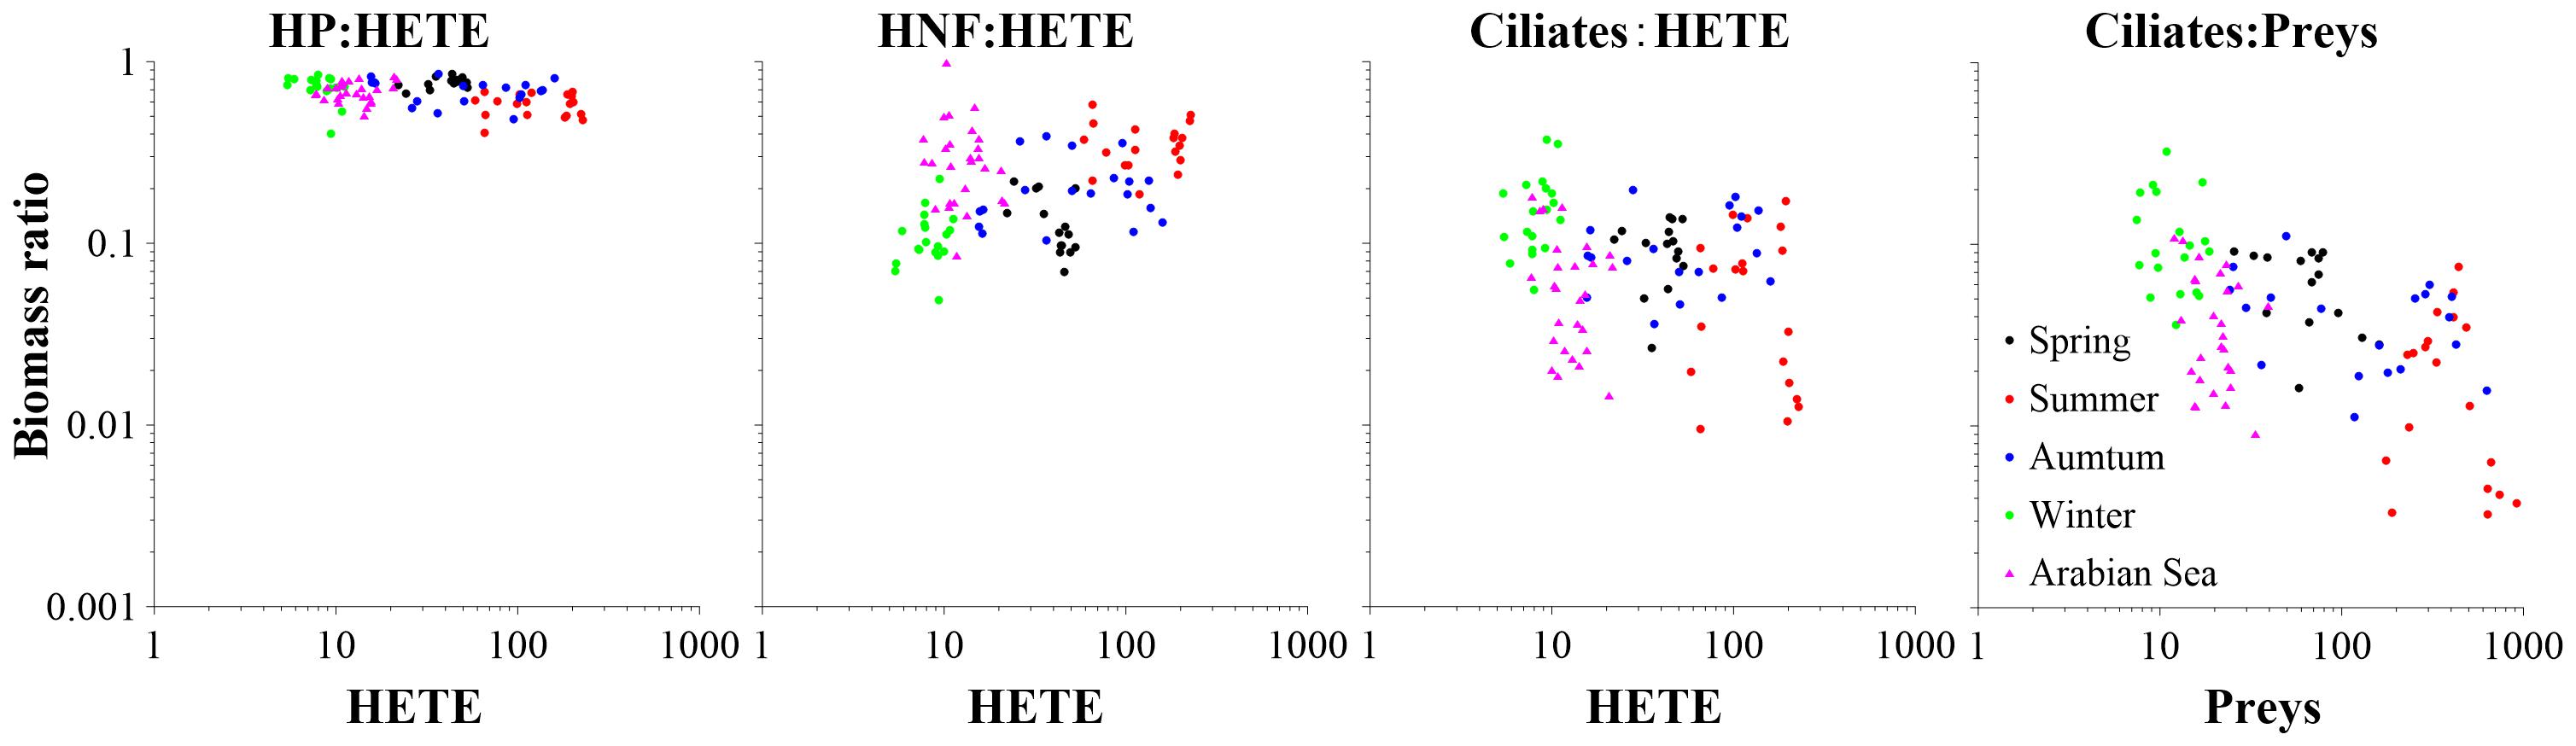
Figure 7. Biomass ratio variations of HP, HNF and ciliates to HETE with the increase of HETE biomass (μg C dm–3), and biomass ratio of ciliates to preys with the increase of prey biomass in Sanggou Bay and Arabian Sea. The data of Arabian Sea were extracted from Garrison et al. (2000). HP, heterotrophic prokaryotes; HNF, heterotrophic nanoflagellates; HETE, heterotrophic organisms.
Biomasses of MFW component showed inner-outer Bay gradients (Figure 2). For AUTO components, higher SYN biomass was observed in the outer part in spring and winter, and vice versa in summer and autumn. PEUK and PNF biomasses always exhibited higher values in the inner part (Figure 2). For HETE components, HP biomass showed higher values in the inner part than in the outer part at all seasons. In summer, autumn and winter, HNF biomass was higher in the inner part than in the outer part. In spring, HNF biomass reached higher values in both inner and outer parts with a narrow low-value band in between. The ciliate biomass exhibited higher values in the inner part over all seasons (Figure 2).
Although some tintinnid species occurred all over the bay (e.g., T. rapa in spring, T. beroidea in summer and autumn), the most conspicuous characteristic was that the inner part and outer parts of the bay had different species in every season. In spring, T. acuminata and T. brasiliensis occurred in the outer and inner parts of the bay, respectively. T. beroidea occurred in 3 stations in the outer and 2 stations in the inner part of bay, respectively. In summer, T. kofoid only occurred in the inner part, Tintinnidium primitivum mainly occurred in the outer part. T. acuminate was restricted to several stations in the north part of the bay. In autumn, E. tubulosus appeared in the inner part. T. nana and T. primitivum occurred in the outer part. In winter, high abundance of T. nana occurred in the outer part. T. beroidea occurred in 3 stations in the outer part and T. acuminata only occurred once in the outer part (Figure 4).
In each season, three distinct cluster analyses were run on three data sets of (i) environmental conditions including temperature and salinity (Supplementary Figure S1), (ii) biomasses of the MFW components (Supplementary Figure S2) and (iii) abundances of the tintinnid species (Supplementary Figure S3). All cluster analyses could divide the stations into similar Inner Bay cluster and Outer Bay cluster. Though the shape and position of the division lines between clusters were different from one season to another, they were generally similar to the nearest isothermal (Figure 8).
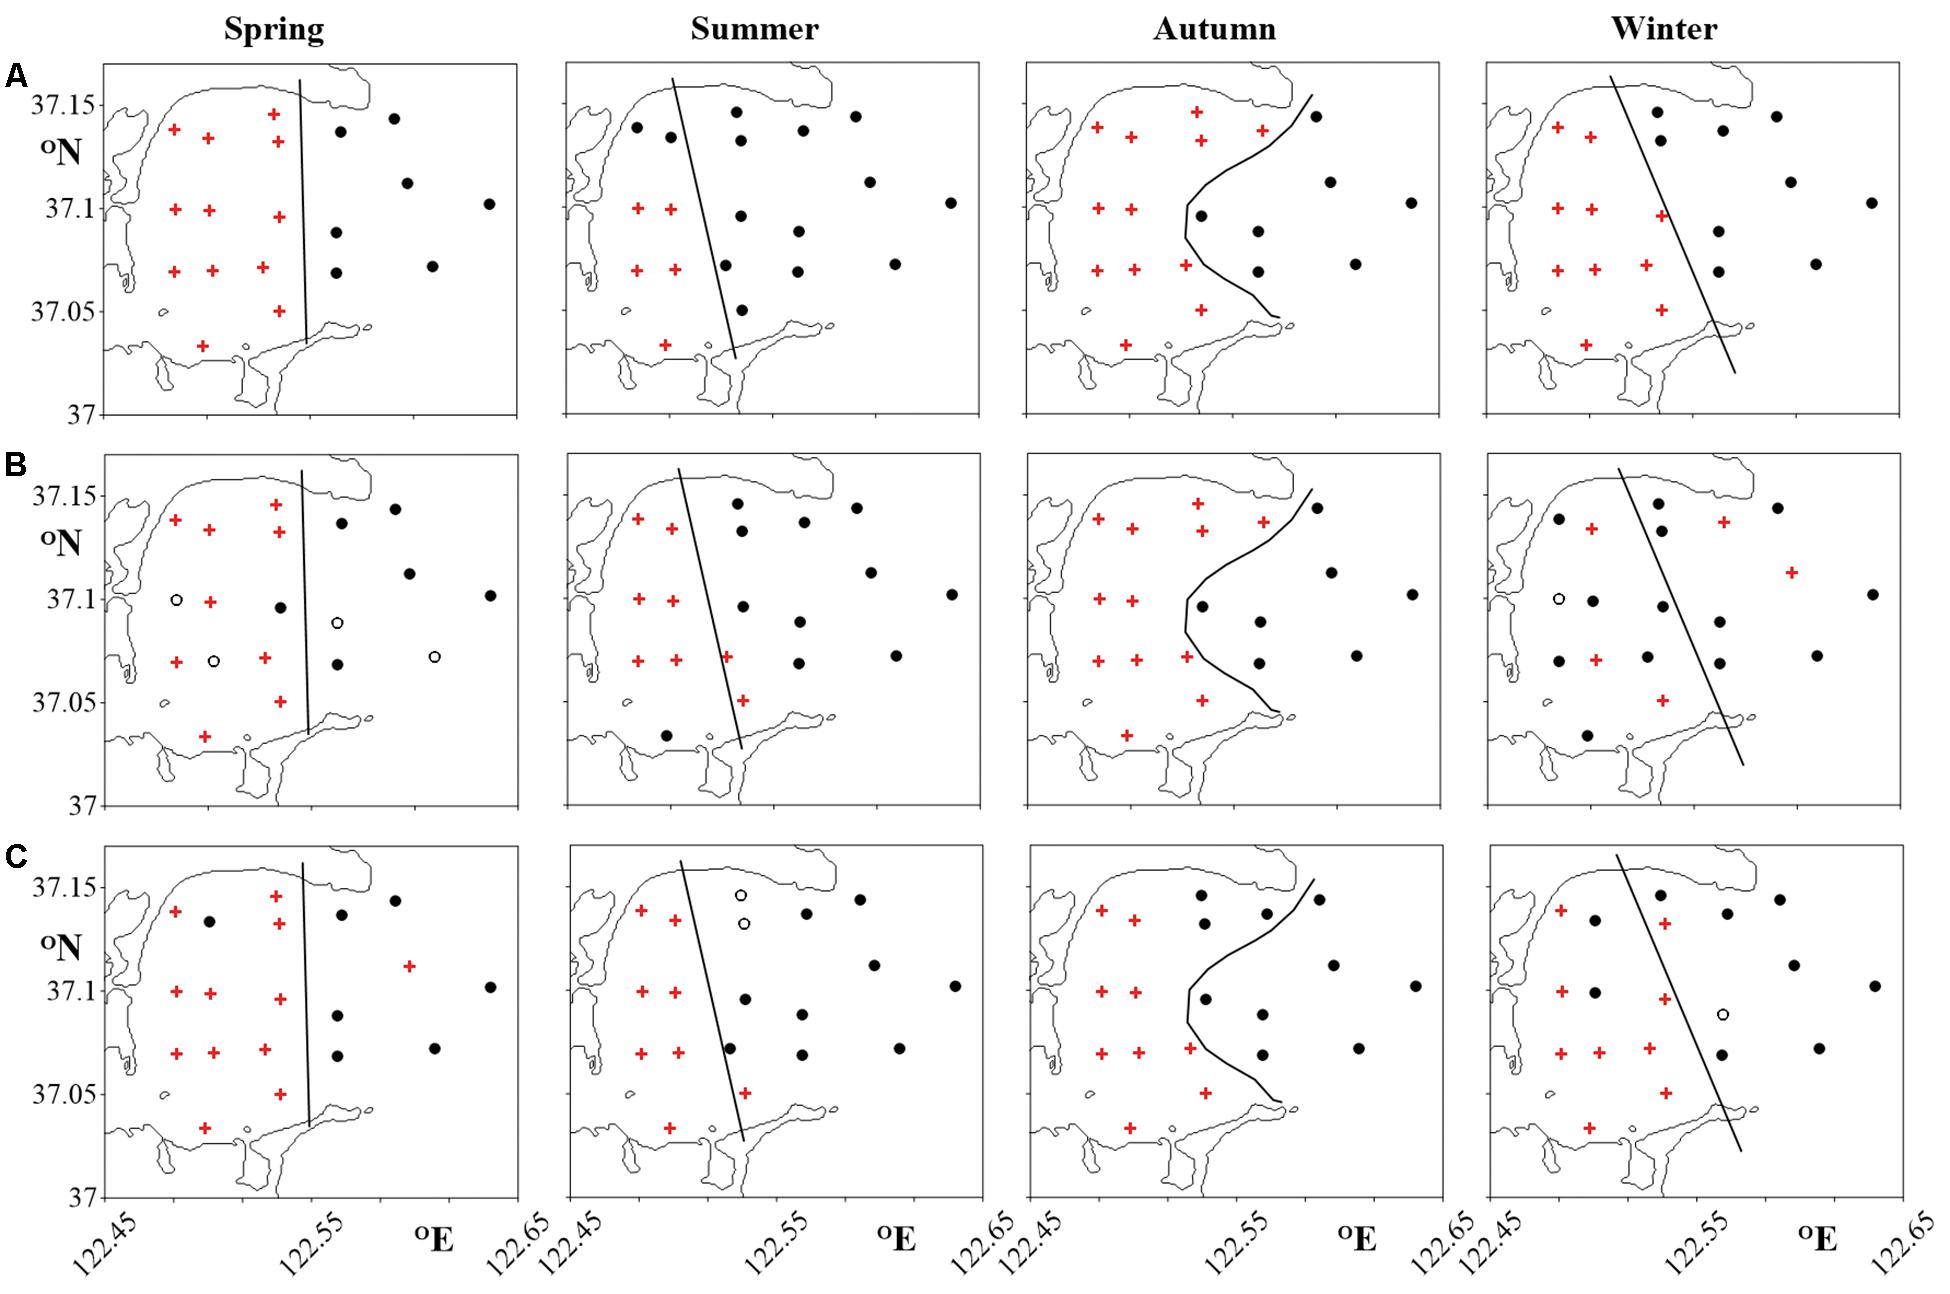
Figure 8. Cluster analysis of stations according to (A) environmental conditions; (B) microbial food web component biomasses; (C) tintinnid abundances. ∙: Outer Bay cluster stations; +: Inner Bay cluster stations; ∘: stations neither belonging to Inner Bay nor Outer Bay clusters. The solid lines show the dividing position between Inner Bay and Outer Bay in Figure 9 mainly according to (A) in the four seasons.
Differences of MFW structure between Inner Bay and Outer Bay were mainly caused by PEUK, PNF and HNF. In spring, relative biomass of PNF and PEUK were higher in Inner than Outer Bay. In summer, PEUK relative biomass was higher in Outer than Inner Bay. The HNF biomass was higher in Outer than Inner Bay in spring, but higher in Inner than Outer Bay in summer.
In autumn, the difference between Inner and Outer Bay was mainly due to SYN, PEUK and PNF. SYN and PEUK relative biomasses were higher in Inner than in Outer Bay, while PNF relative biomass was higher in Outer than Inner Bay. In winter, the difference between Inner and Outer Bay was mainly caused by PEUK and PNF, which also had higher relative biomasses in Inner than in Outer Bay (Figure 9).
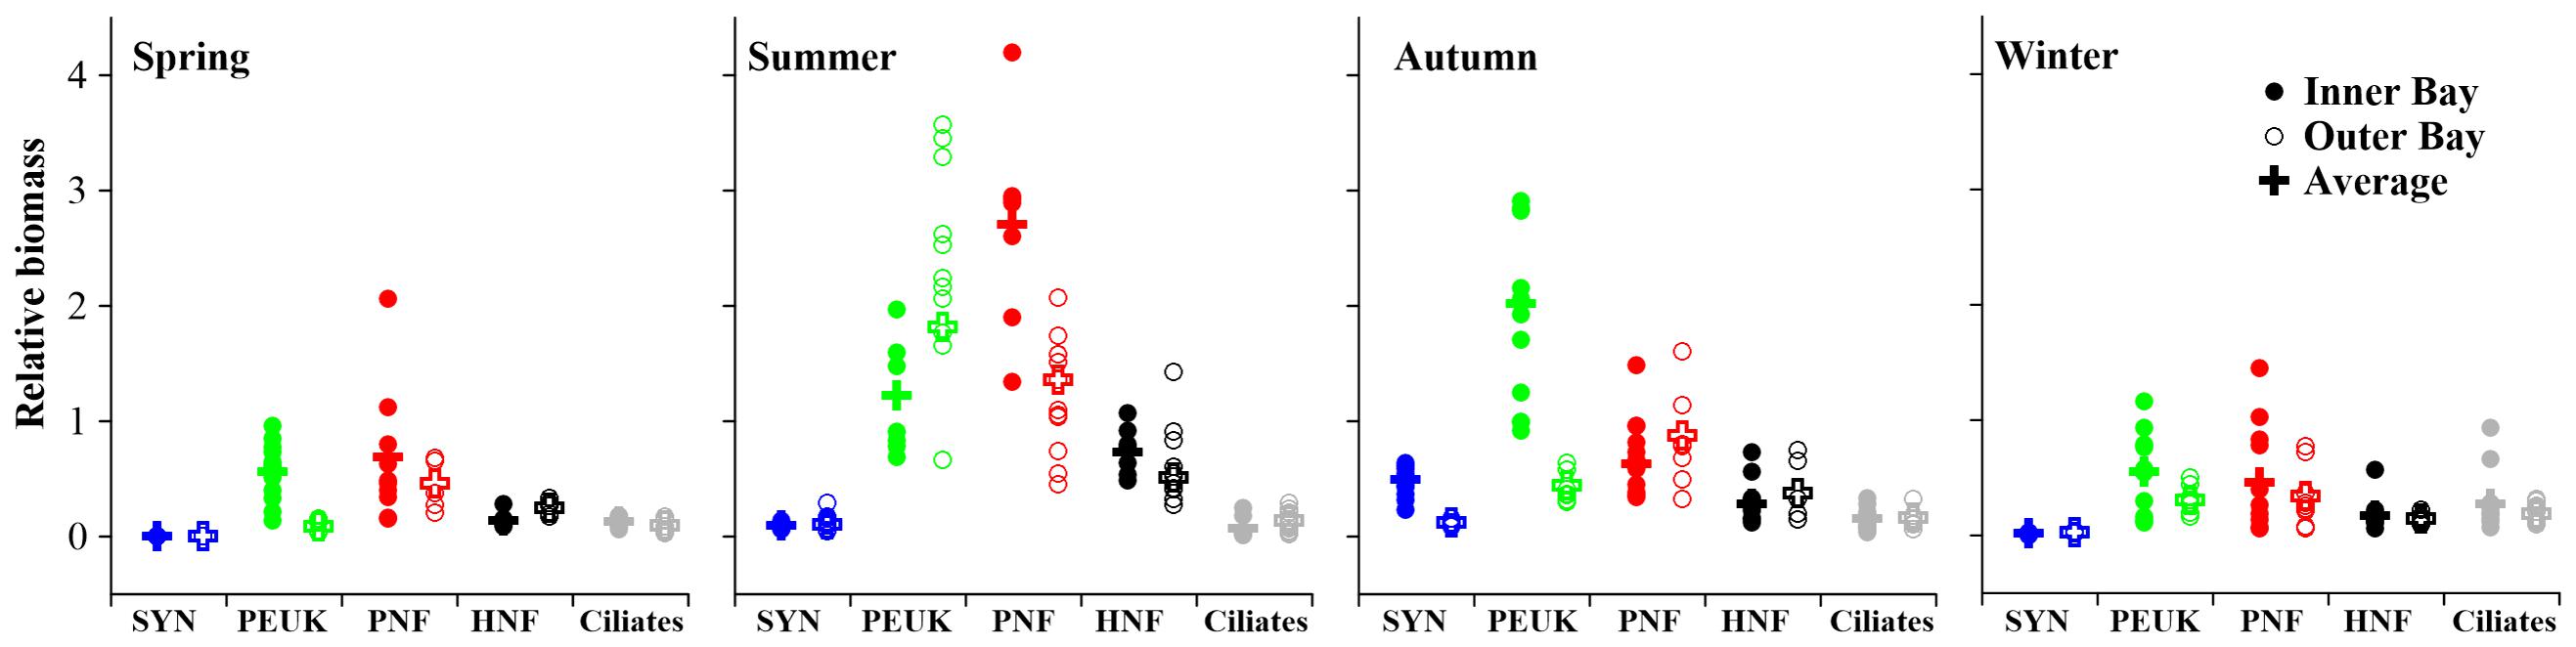
Figure 9. Microbial food web structures in Inner and Outer Sanggou Bay in four successive seasons, spring to winter. The Inner and Outer Bay boundary were shown as solid lines in Figure 8. Relative biomasses of MFW components were normalized by heterotrophic prokaryotes biomass belonging to the same sample. SYN, Synechococcus; PEUK, phototrophic picoeukaryotes; PNF, pigmented nanoflagellates; HNF, heterotrophic nanoflagellates.
Only data of surface waters were presented in this study. Most of the previous studies in the Sanggou Bay only sampled the surface layers because the bay is shallow and waters in the upper 10 m was well mixed in most seasons (Jihong Zhang, self-communication). The surface water temperature seasonal range of the Sanggou Bay was about 22°C, which was among the largest in the world ocean (Mackas et al., 2012). Salinity range was 26.17 and 31.57 in our study, this was a little larger than the range of 28.23–31.31 reported by Jiang et al. (2017) in the same Bay. The Sanggou Bay exhibited different trophic regimes, from oligotrophy to eutrophication with a large Chlorophyll a (Chl a) concentration-range from 0.42 to 38.74 μg dm–3 in present study and 0.10–20.46 μg dm–3 in Jiang et al. (2017). Phytoplankton with size fraction < 20 μm was the most important contributor to total Chl a in the Sanggou Bay, and contributed about 60.2, 83.0, 78.3, and 75.0% to total Chl a in spring, summer, autumn and winter, respectively (Jiang et al., 2017). The average concentration of DIN was highest in autumn in our study. This is consistent with Jiang et al. (2017) who observed the highest value of average DIN concentration in autumn. Seasonal variation of PO43– concentration also presented the same trend in our study as in Jiang et al. (2017): decreasing from spring to winter.
These large gradients corresponded to a large range of HP abundance (1.88–67.89 × 10⁵ cells cm–3) similar to the HP abundance ranges 1–152 and 1–100 × 105 cells cm–3 in the world ocean, reported by Sanders et al. (1992) and Gasol (1994), respectively. The autotrophic (AUTO) organism biomass in our study, which was in the range of 1.50–720.27 μg C dm–3, almost covered the full range of phytoplankton biomass in Herndl (1991), from 6.9 to 415.5 μg C dm–3. These large ranges of biomass variations showed that the MFW components in Sanggou Bay experienced very large seasonal changes.
We found that relative biomass variations of different MFW components exhibited different trends with respect to HP biomass increase. The diverse variations of different groups relative to HP biomass express the seasonal variation of the MFW. To our knowledge, this finding was not reported previously.
The work of Garrison et al. (2000) was the only one trying to compare different MFW structures in four cruises in the Arabian Sea. The HP biomass in the Arabian Sea was in the range of 5.1–17.4 μg C dm–3 in the upper 100 m, which was very similar to that in spring and winter in Sanggou Bay (Table 1). The average relative biomasses (ARB) of each MFW component was <1 at all seasons in the Arabian Sea, which is equivalent to those in spring and winter in the Sanggou Bay (Figure 6). Therefore, the seasonal variation in Sanggou Bay is larger than that in the Arabian Sea. The MFW structure differences in Arabian Sea and Sanggou Bay may be caused by lower values and a smaller range of HP biomass in the Arabian Sea than in the Sanggou Bay.
ARB of PEUK was higher than ARB of SYN in all seasons in the Sanggou Bay, but it was the opposite in the Arabian Sea (Garrison et al., 2000) (Figure 6). This obvious difference between the MFW structure in Sanggou Bay and Arabian Sea may indicate different MFWs in coastal and open waters. Previous studies on picoplankton (picophytoplankton) community structure in coastal area were focused on spatial variation, but seasonal change was very seldom investigated. The dominance of PEUK in Sanggou Bay is consistent with previous studies in coastal areas (Pan et al., 2006; Linacre et al., 2010; Bock et al., 2018; Patten et al., 2018; Otero-Ferrer et al., 2018; Mena et al., 2019). In the deep waters of Adriatic Sea, SYN dominated in December while HP and PEUK dominated in April (Šantić et al., 2019).
In our study, both AUTO and HETE biomasses increased with temperature, but with the increase of AUTO biomass, the biomass ratio of HETE:AUTO decreased. This was consistent with the work of Gasol et al. (1997) reporting that unproductive waters were characterized by high relative HETE biomass, whereas productive waters were distinguished by a smaller contribution of HETE to community biomass.
As the biomass ratio of HP:AUTO decreased with the increase of AUTO biomass, the AUTO biomass ranges where the biomass ratio of HP:AUTO was about 1 were considered as boundary below which a system can be considered oligotrophic enough for bacteria to dominate phytoplankton (Li et al., 1993). In our study, when the AUTO biomass was ranged in 6–35 μg C dm–3, the biomass ratio of HP:AUTO was about 1. This was similar with phytoplankton biomass range of 10 and 20 μg C dm–3 in Li et al. (1993).
Although flagellates and ciliates were important components of MFW, their dynamics in relation to picoplankton were very rarely studied. We found that with the increase of the HETE biomass, biomass ratio of HP and ciliates to total HETE biomass decreased slightly, while HNF biomass ratio to total HETE increased slightly (Figure 7). In the absence of similar investigation in the literature, we could estimate the proportion of different HETE component biomasses in total HETE biomass from published figures. We thus found that the biomass ratio of HP:HETE in the present work (range 0.40–0.86) was similar to that in the northeastern Atlantic Ocean (range 0.70–0.87), as derived from the work of Maixandeau et al. (2005).
In our study, HP abundances and biomasses were in the ranges 1.88–67.89 × 10⁵ cells cm–3 and 3.77–135.77 μg C dm–3, respectively (Table 1). Ciliate relative biomass was in the range 0.02–0.94, and its annual ARB was 0.16 (Figures 5, 6). This was similar to that in the Lower St. Lawrence Estuary where HP abundance and biomass were in the ranges 1.2–67.9 × 10⁵ cells cm–3 and 0.55–146.70 μg C dm–3, respectively. Meanwhile, ciliate biomass represented about 22% of HP biomass (Sime-Ngando et al., 1995). The value in our study was a little higher than that in the Arabian Sea, where ciliate relative biomass was in the range 0.02–0.26 (average 0.10) (Figures 5, 6) (Garrison et al., 2000).
With the increase of prey biomass, the biomass ratio of Ciliates:Preys decreased in our study (Figure 7). This is inconsistent with that in the deep east part of East China Sea where the ratio of ciliate biomass was larger under higher prey candidate conditions (Suzuki and Miyabe, 2007). The biomass range of ciliates (0.44–33.09 μg C dm–3) in our study (Table 1) was similar to that in the deep east part of East China Sea (0.03–29.26 μg C dm–3) (Suzuki and Miyabe, 2007). The study in the East China Sea was based on the biovolumes of ciliates and prey candidates, while our study was based on the biomasses of ciliates and prey candidates. This difference may alter the comparison, but does not affect the variation trends of both studies. In addition, the present study was based on surface data, while Suzuki and Miyabe (2007) addressed the vertical variation of ciliates and their prey candidates. This may be the main reason why the biomass ratio variation trends of ciliates to prey candidates appear different in our study and that in East China Sea.
More and more studies have indicated that MFW component distribution may be significantly influenced by water masses (Hashihama et al., 2008; Samo et al., 2012; Zhao et al., 2013; Bachy et al., 2014; Sun et al., 2020; Yang et al., 2020). Among all the seawater variables, temperature and salinity are the conservation properties used to distinguish water masses (Emery, 2001). Tintinnids were also used as water mass indicators (Modigh et al., 2003; Kim et al., 2012). In the present study, we divided the Sanggou Bay into the Inner and Outer Bay mainly according to cluster analysis based on temperature and salinity, as well as MFW component biomasses and tintinnid abundance (Figure 8).
Our results showed that in every season, the Inner and Outer Bay had different tintinnid communities (Figure 8). Similar to the division of tintinnid community, MFW structure also exhibited spatial partitioning: MFW structure was different in Inner and Outer Bay in every season (Figure 8), although the cluster analysis results based on different variables were not exactly coinciding. These divisions are generally corresponding to hydrobiological divisions (Figure 8).
In the Sanggou Bay, water intruded into the Bay mainly through north opening, while water was flowing out of the Bay through the opening south part (Zeng et al., 2015). The division into Inner and Outer Bay water masses showed obvious “north in, south out” pattern in summer, autumn and winter (Figure 9). This division pattern might be caused by exchange pattern between Inner Bay and Outer Bay. In addition to the water exchange between Inner and Outer parts of the Bay, the aquaculture activity also had influence on MFW components (Lu et al., 2015a, b). In our study, the division line between the Inner and Outer parts of the MFW in the four seasons did not match the division of aquaculture area. Therefore, the water exchange process between Inner and Outer parts of the Sanggou Bay would be the main factor influencing the MFW structure.
Tintinnids was the only MFW component that could be identified at the species level which was instrumental in distinguishing Inner Bay from Outer Bay. In the coastal area, neritic tintinnid was centered in waters at 30–50 m depth (Chen et al., 2018). Neritic species intruded from the coastal center area to the Sanggou Bay. Temperature and salinity had obvious influence on tintinnid community structure in coastal and estuarine waters (Feng et al., 2018; Li et al., 2019). As one important contributor of planktonic ciliate, aloricate ciliate distribution also showed obvious seasonal variations and was significantly influenced by water masses (Jiang et al., 2011; Yu et al., 2014). In the Jiaozhou Bay, northern China, species numbers, abundances and biomasses of both tintinnids and aloricate ciliates exhibited unimodal variations with peaks occurring in August (Jiang et al., 2011). In the Yellow Sea, ciliate (including tintinnid and aloricate ciliate) abundances and biomasses showed a clear annual cycle (Yu et al., 2014). Seasonal and spatial variations of aloricate ciliate community were not mentioned in our study. However, we speculate that aloricate ciliates might have similar seasonal and spatial variations as tintinnids.
Our study showed that MFW structure in a temperate coastal bay had different modes in different seasons. The different amplitudes of autotrophic component variations were the main reason for the seasonal change of MFW structure. Spatially, tintinnid community and MFW structure were different in Inner and Outer parts of the Sanggou Bay in every season. Those spatial differences were generated by differences in water masses in Inner and Outer parts of the Sanggou Bay.
The raw data supporting the conclusions of this article will be made available by the authors, without undue reservation.
WZ and TX designed the experimental scheme and supervised the entire project. HL and XC integrated the all data and wrote the manuscript. MD and ZJ reviewed the manuscript. YZ and LH provided the data of picoplankton and nanoflagellate, respectively. All the authors approved the final manuscript.
This work was supported by the Strategic Priority Research Program of the Chinese Academy of Sciences (No. XDA19060201), Creative Team Project of the Laboratory for Marine Ecology and Environmental Science, Qingdao National Laboratory for Marine Science and Technology (No. LMEES-CTSP-2018-1), CNRS-NSFC Joint Research Projects Program (No. 41711530149) and 2017-2019 Sino-French Cai Yuanpei Programme.
The authors declare that the research was conducted in the absence of any commercial or financial relationships that could be construed as a potential conflict of interest.
We are grateful to the captain and crew members of the R/V Lurongyuyang-65577 for their assistance during the cruises. We thank Dr. Jihong Zhang for providing the hydrological information of Sanggou Bay.
The Supplementary Material for this article can be found online at: https://www.frontiersin.org/articles/10.3389/fmars.2020.589566/full#supplementary-material
Supplementary Figure 1 | Cluster analysis of stations according to temperature and salinity in four successive seasons, spring to winter.
Supplementary Figure 2 | Cluster analysis of stations according to microbial food web component biomasses in four successive seasons, spring to winter.
Supplementary Figure 3 | Cluster analysis of stations according to tintinnid abundance in four successive seasons, spring to winter.
Azam, F., Fenchel, T., Field, J. G., Gray, J. S., Meyerreil, L. A., and Thingstad, F. (1983). The ecological role of water-column microbes in the sea. Mar. Ecol. Prog. Ser. 10, 257–263. doi: 10.3354/meps010257
Bachy, C., Moreira, D., Dolan, J. R., and Lopez-Garcia, P. (2014). Seasonal dynamics of free-living tintinnid ciliate communities revealed by environmental sequences from the North-West Mediterranean Sea. FEMS Microbiol. Ecol. 87, 330–342. doi: 10.1111/1574-6941.12224
Bock, N., Van Wambeke, F., Dion, M., and Duhamel, S. (2018). Microbial community structure in the western tropical South Pacific. Biogeosciences 15, 3909–3925. doi: 10.5194/bg-2017-562
Børsheim, K. Y., and Bratbak, G. (1987). Cell volume to cell carbon conversion factors for a bacterivorous Monas sp. enriched from seawater. Mar. Ecol. Prog. Ser. 36, 171–175. doi: 10.3354/meps036171
Bouman, H. A., Ulloa, O., Barlow, R., Li, W. K., Platt, T., Zwirglmaier, K., et al. (2011). Water-column stratification governs the community structure of subtropical marine picophytoplankton. Environ. Microbiol. Rep. 3, 473–482. doi: 10.1111/j.1758-2229.2011.00241.x
Chen, X., Li, H. B., Zhao, Y., Zhao, L., Dong, Y., Zhang, W. C., et al. (2018). Distribution of different biogeographical tintinnids in Yellow Sea and Bohai Sea. J. Ocean Univ. China 17, 371–384. doi: 10.1007/s11802-018-3482-1
Emery, W. J. (2001). “Water types and water masses,” in Encyclopedia of Ocean Sciences, eds J. H. Steele, S. A. Thorpe, and K. K. Turekian (London: Academic Press), 3179–3187. doi: 10.1006/rwos.2001.0108
Feng, M. P., Wang, C. F., Zhang, W. C., Zhang, G. T., Xu, H. L., Zhao, Y., et al. (2018). Annual variation of species richness and lorica oral diameter characteristics of tintinnids in a semi-enclosed bay of western Pacific. Estua. Coast. Shelf Sci. 207, 164–174. doi: 10.1016/j.ecss.2018.04.003
Fernandez, C., Thyssen, M., and Denis, M. (2008). Microbial community structure along 18°W (39°N–44.5°N) in the NE Atlantic in late summer 2001 (POMME programme). J. Mar. Syst. 71, 46–62. doi: 10.1016/j.jmarsys.2007.06.003
Garrison, D. L., Gowing, M. M., Hughes, M. P., Campbell, L., Caron, D. A., Dennett, M. R., et al. (2000). Microbial food web structure in the Arabian Sea: a US JGOFS study. Deep Sea Res. Part II Top. Stud. Oceanogr. 47, 1387–1422. doi: 10.1016/S0967-0645(99)00148-4
Gasol, J. M. (1994). A framework for the assessment of top-down vs bottom-up control of heterotrophic nanoflagellate abundance. Mar. Ecol. Prog. Ser. 113, 291–300. doi: 10.3354/meps113291
Gasol, J. M., Del Giorgio, P. A., and Duarte, C. M. (1997). Biomass distribution in marine planktonic communities. Limnol. Oceanogr. 42, 1353–1363. doi: 10.4319/lo.1997.42.6.1353
Gilron, G. L., and Lynn, D. H. (1989). Assuming a 50% cell occupancy of the lorica overestimates tintinnine ciliate biomass. Mar. Biol. 103, 413–416. doi: 10.1007/BF00397276
Hashihama, F., Horimoto, N., Kanda, J., Furuya, K., Ishimaru, T., and Saino, T. (2008). Temporal variation in phytoplankton composition related to water mass properties in the central part of Sagami Bay. J. Oceanogr. 64, 23–37. doi: 10.1007/s10872-008-0002-8
Herndl, G. J. (1991). Microbial biomass dynamics along a trophic gradient at the Atlantic Barrier-Reef off Belize (Central-America). Mar. Ecol. 12, 41–51. doi: 10.1111/j.1439-0485.1991.tb00082.x
Jiang, Y., Xu, H. L., Al-Rasheid, K. A. S., Warren, A., Hu, X. Z., and Song, W. B. (2011). Planktonic ciliate communities in a semi-enclosed bay of Yellow Sea, northern China: annual cycle. J. Mar. Biol. Assoc. U.K. 91, 97–105. doi: 10.1017/S002531541000175X
Jiang, Z. J., Du, M. R., Fang, J. H., Gao, Y. P., Li, J. Q., Zhao, L., et al. (2017). Size fraction of phytoplankton and the contribution of natural plankton to the carbon source of Zhikong scallop Chlamys farreri in mariculture ecosystem of the Sanggou Bay. Acta Oceanol. Sin. 36, 1–9. doi: 10.1007/s13131-017-0970-x
Kim, Y.-O., Shin, K., Jang, P.-G., Choi, H.-W., Noh, J.-H., Yang, E.-J., et al. (2012). Tintinnid species as biological indicators for monitoring intrusion of the warm oceanic waters into Korean coastal waters. Ocean Sci. J. 47, 161–172. doi: 10.1007/s12601-012-0016-4
Kofoid, C. A., and Campbell, A. S. (1929). A conspectus of the marine fresh-water ciliate belonging to the suborder Tintinnoinea, with descriptions of new species principally from the Agassiz expedition to the eastern tropical Pacific 1904-1905. Univ. Calif. Publ. Zool. 34, 1–403.
Kofoid, C. A., and Campbell, A. S. (1939). The ciliata: the tintinnoinea. Bull. Museum Comp. Zool. 84, 1–473. doi: 10.1002/9783527678518.ehg2016001
Kuang, S. H., Fang, J. G., Sun, H. L., and Li, F. (1996). Seston dynamics in Sanggou Bay. Mar. Fish. Res. 2, 60–67.
Lee, S., and Fuhrman, J. A. (1987). Relationships between biovolume and biomass of naturally derived marine bacterioplankton. Appl. Environ. Microbiol. 53, 1298–1303. doi: 10.1002/bit.260290816
Li, H. B., Wang, C. F., Liang, C., Zhao, Y., Zhang, W. C., Grégori, G., et al. (2019). Diversity and distribution of tintinnid ciliates along salinity gradient in the Pearl River Estuary in southern China. Estua. Coast. Shelf Sci. 226:106268. doi: 10.1016/j.ecss.2019.106268
Li, W. K. W., Dickie, P. M., Harrison, W. G., and Irwin, B. D. (1993). Biomass and production of bacteria and phytoplankton during the spring bloom in the western North Atlantic Ocean. Deep Sea Res. II Top. Stud. Oceanogr. 40, 307–327. doi: 10.1016/0967-0645(93)90019-J
Li, W. K. W., Dickie, P. M., Irwin, B. D., and Wood, A. M. (1992). Biomass of bacteria, cyanobacteria, prochlorophytes and photosynthetic eukaryotes in the Sargasso Sea. Deep Sea Res. A Oceanogr. Res. Pap. 39, 501–519. doi: 10.1016/0198-0149(92)90085-8
Linacre, L. P., Landry, M. R., Lara-Lara, J. R., Hernandez-Ayon, J. M., and Bazan-Guzman, C. (2010). Picoplankton dynamics during contrasting seasonal oceanographic conditions at a coastal upwelling station off Northern Baja California, Mexico. J. Plankton Res. 32, 539–557. doi: 10.1093/plankt/fbp148
Lu, J. C., Huang, L. F., Luo, Y. R., Xiao, T., Jiang, Z. J., and Wu, L. N. (2015a). Effects of freshwater input and mariculture (bivalves and macroalgae) on spatial distribution of nanoflagellates in Sungo Bay, China. Aquac. Environ. Interact. 6, 191–203. doi: 10.3354/aei00124
Lu, J. C., Huang, L. F., Xiao, T., Jiang, Z. J., and Zhang, W. C. (2015b). The effects of Zhikong scallop (Chlamys farreri) on the microbial food web in a phosphorus-deficient mariculture system in Sanggou Bay, China. Aquaculture 448, 341–349. doi: 10.1016/j.aquaculture.2015.06.021
Mackas, D. L., Greve, W., Edwards, M., Chiba, S., Tadokoro, K., Eloire, D., et al. (2012). Changing zooplankton seasonality in a changing ocean: comparing time series of zooplankton phenology. Prog. Oceanogr. 97, 31–62. doi: 10.1016/j.pocean.2011.11.005
Maixandeau, A., Lefevre, D., Karayanni, H., Christaki, U., Van Wambeke, F., Thyssen, M., et al. (2005). Microbial community production, respiration, and structure of the microbial food web of an ecosystem in the northeastern Atlantic Ocean. J. Geophys. Res. Oceans 110:C07S17. doi: 10.1029/2005JC003234
Marie, D., Simon, N., Guillou, L., Partensky, F., and Vaulot, D. (2000). “Flow cytometry analysis of marine picoplankton,” in In Living Color: Protocols in Flow Cytometry and Cell Sorting, eds R. A. Diamond and S. DeMaggio (New York, NY: Springer-Verlag), 421–454. doi: 10.1007/978-3-642-57049-0_34
Mena, C., Reglero, P., Hidalgo, M., Sintes, E., Santiago, R., Martin, M., et al. (2019). Phytoplankton community structure is driven by stratification in the oligotrophic Mediterranean Sea. Front. Microbiol. 10:1698. doi: 10.3389/fmicb.2019.01698
Modigh, M., Castaldo, S., Saggiomo, M., and Santarpia, I. (2003). Distribution of tintinnid species from 42°N to 43°S through the Indian Ocean. Hydrobiologia 503, 251–262. doi: 10.1023/B:HYDR.0000008477.38383.d6
Otero-Ferrer, J. L., Cermeno, P., Bode, A., Fernandez-Castro, B., Gasol, J. M., Moran, X. A. G., et al. (2018). Factors controlling the community structure of picoplankton in contrasting marine environments. Biogeosciences 15, 6199–6220. doi: 10.5194/bg-15-6199-2018
Pan, L. A., Zhang, J., Chen, Q., and Deng, B. (2006). Picoplankton community structure at a coastal front region in the northern part of the South China Sea. J. Plankton Res. 28, 337–343. doi: 10.1093/plankt/fbi117
Patten, N. L., Van Ruth, P. D., and Rodriguez, A. R. (2018). Spatial variability in picophytoplankton, bacteria and viruses in waters of the Great Australian Bight (southern Australia). Deep Sea Res. II Top. Stud. Oceanogr. 157, 46–57. doi: 10.1016/j.dsr2.2018.04.009
Pierrot-Bults, A. C., and Angel, M. V. (2012). Pelagic biodiversity and biogeography of the oceans. Biol. Int. 51, 9–35.
Pomeroy, L. R. (1974). The ocean’s food web, a changing paradigm. Bioscience 24, 499–504. doi: 10.2307/1296885
Putt, M., and Stoecker, D. K. (1989). An experimentally determined carbon-volume ratio for marine oligotrichous ciliates from estuarine and coastal waters. Limnol. Oceanogr. 34, 1097–1103. doi: 10.4319/lo.1989.34.6.1097
Samo, T. J., Pedler, B. E., Ball, G. I., Pasulka, A. L., Taylor, A. G., Aluwihare, L. I., et al. (2012). Microbial distribution and activity across a water mass frontal zone in the California current ecosystem. J. Plankton Res. 34, 802–814. doi: 10.1093/plankt/fbs048
Sanders, R. W., Caron, D. A., and Berninger, U. G. (1992). Relationships between bacteria and heterotrophic nanoplankton in marine and fresh waters - an inter-ecosystem comparison. Mar. Ecol. Prog. Ser. 86, 1–14. doi: 10.3354/meps086001
Šantić, D., Kovačević, V., Bensi, M., Giani, M., Vrdoljak Tomaš, A., Ordulj, M., et al. (2019). Picoplankton distribution and activity in the deep waters of the southern Adriatic Sea. Water 11:1655. doi: 10.3390/w11081655
Šantić, D., Šestanović, S., Šolić, M., Krstulović, N., Kušpilić, G., Ordulj, M., et al. (2014). Dynamics of the picoplankton community from coastal waters to the open sea in the Central Adriatic. Mediterranean Mar. Sci. 15, 179–188. doi: 10.12681/mms.701
Sherr, E., and Sherr, B. (1988). Role of microbes in pelagic food webs - a revised concept. Limnol. Oceanogr. 33, 1225–1227. doi: 10.2307/2837257
Sime-Ngando, T., Gosselin, M., Roy, S., and Chanut, J. P. (1995). Significance of planktonic ciliated protozoa in the Lower St Lawrence Estuary: comparison with bacterial, phytoplankton, and particulate organic carbon. Aquat. Microb. Ecol. 9, 243–258. doi: 10.3354/ame009243
Sun, P., Wang, Y., Laws, E., and Huang, B. Q. (2020). Water mass-driven spatial effects and environmental heterogeneity shape microeukaryote biogeography in a subtropical, hydrographically complex ocean system - A case study of ciliates. Sci. Tot. Environ. 706:135753. doi: 10.1016/j.scitotenv.2019.135753
Suzuki, T., and Miyabe, C. (2007). Ecological balance between ciliate plankton and its prey candidates, pico- and nanoplankton, in the East China Sea. Hydrobiologia 586, 403–410. doi: 10.1007/s10750-007-0715-5
Tsai, A. Y., Chiang, K. P., Chang, J., and Gong, G. C. (2005). Seasonal diel variations of picoplankton and nanoplankton in a subtropical western Pacific coastal ecosystem. Limnol. Oceanogr. 50, 1221–1231. doi: 10.4319/lo.2005.50.4.1221
Van Dongen-Vogels, V., Seymour, J. R., Middleton, J. F., Mitchell, J. G., Seuront, L. J. E. C., and Science, S. (2012). Shifts in picophytoplankton community structure influenced by changing upwelling conditions. Estua. Coast. Shelf Sci. 109, 81–90. doi: 10.1016/j.ecss.2012.05.026
Wu, M. L., Wang, Y. S., Wang, D. X., and Dong, J. D. (2014). Effects of coastal upwelling on picophytoplankton distribution off the coast of Zhanjiang in South China Sea. Oceanol. Hydrobiol. Stud. 43, 283–291. doi: 10.2478/s13545-014-0143-x
Yang, J. P., Huang, S. X., Fan, W. X., Warren, A., Jiao, N. Z., and Xu, D. P. (2020). Spatial distribution patterns of planktonic ciliate communities in the East China Sea: potential indicators of water masses. Mar. Pollut. Bull. 156:111253. doi: 10.1016/j.marpolbul.2020.111253
Yu, Y., Zhang, W. C., Zhang, C. X., Zhou, F., Zhao, N., and Xiao, T. (2014). Basin-scale variation in planktonic ciliate distribution: a detailed temporal and spatial study of the Yellow Sea. Mar. Biol. Res. 10, 641–654. doi: 10.1080/17451000.2013.852683
Zeng, D. Y., Huang, D. J., Qiao, X. D., He, Y. Q., and Zhang, T. (2015). Effect of suspended kelp culture on water exchange as estimated by in situ current measurement in Sanggou Bay, China. J. Mar. Syst. 149, 14–24. doi: 10.1016/j.jmarsys.2015.04.002
Zhang, W. C., Feng, M. P., Zhang, C. X., and Xiao, T. (2012). An Illustrated Guide to Contemporary Tintinnids in the World. Beijing: Science Press.
Zhao, L., Zhao, Y., Xu, J. H., Zhang, W. C., Huang, L. F., Jiang, Z. J., et al. (2016). Distribution and seasonal variation of picoplankton in Sanggou Bay, China. Aquac. Environ. Interact. 8, 261–271. doi: 10.3354/aei00168
Zhao, L., Zhao, Y., Zhang, W. C., Zhou, F., Zhang, C. X., Ren, J. L., et al. (2013). Picoplankton distribution in different water masses of the East China Sea in autumn and winter. Chinese J. Oceanol. Limnol. 31, 247–266. doi: 10.1007/s00343-013-2085-3
Zubkov, M. V., Sleigh, M. A., Burkill, P. H., and Leakey, R. J. G. (2000). Picoplankton community structure on the Atlantic meridional transect: a comparison between seasons. Prog. Oceanogr. 45, 369–386. doi: 10.1016/s0079-6611(00)00008-2
Keywords: microbial food web, structure, seasonal, spatial, variation, Sanggou Bay
Citation: Li H, Chen X, Denis M, Zhao Y, Huang L, Jiang Z, Zhang W and Xiao T (2020) Seasonal and Spatial Variation of Pelagic Microbial Food Web Structure in a Semi-Enclosed Temperate Bay. Front. Mar. Sci. 7:589566. doi: 10.3389/fmars.2020.589566
Received: 31 July 2020; Accepted: 20 October 2020;
Published: 11 November 2020.
Edited by:
Gipsi Lima Mendez, Catholic University of Louvain, BelgiumReviewed by:
Yong Jiang, Ocean University of China, ChinaCopyright © 2020 Li, Chen, Denis, Zhao, Huang, Jiang, Zhang and Xiao. This is an open-access article distributed under the terms of the Creative Commons Attribution License (CC BY). The use, distribution or reproduction in other forums is permitted, provided the original author(s) and the copyright owner(s) are credited and that the original publication in this journal is cited, in accordance with accepted academic practice. No use, distribution or reproduction is permitted which does not comply with these terms.
*Correspondence: Wuchang Zhang, d3VjaGFuZ3poYW5nQHFkaW8uYWMuY24=
Disclaimer: All claims expressed in this article are solely those of the authors and do not necessarily represent those of their affiliated organizations, or those of the publisher, the editors and the reviewers. Any product that may be evaluated in this article or claim that may be made by its manufacturer is not guaranteed or endorsed by the publisher.
Research integrity at Frontiers
Learn more about the work of our research integrity team to safeguard the quality of each article we publish.