- 1AZTI, Marine Research, Basque Research and Technology Alliance (BRTA), Pasaia, Spain
- 2CLS, Altimetry and in situ Oceanography, Ramonville-Saint-Agne, France
- 3LEGOS, University of Toulouse/CNRS/CNES/IRD, Toulouse, France
Satellite altimeters provide continuous information of the sea level variability and mesoscale processes for the global ocean. For estimating the sea level above the geoid and monitoring the full ocean dynamics from altimeters measurements, a key reference surface is needed: The Mean Dynamic Topography (MDT). However, in coastal areas, where, in situ measurements are sparse and the typical scales of the motion are generally smaller than in the deep ocean, the global MDT solutions are less accurate than in the open ocean, even if significant improvement has been done in the past years. An opportunity to fill in this gap has arisen with the growing availability of long time-series of high-resolution HF radar surface velocity measurements in some areas, such as the south-eastern Bay of Biscay. The prerequisite for the computation of a coastal MDT, using the newly available data of surface velocities, was to obtain a robust methodology to remove the ageostrophic signal from the HF radar measurements, in coherence with the scales resolved by the altimetry. To that end, we first filtered out the tidal and inertial motions, and then, we developed and tested a method that removed the Ekman component and the remaining divergent part of the flow. A regional high-resolution hindcast simulation was used to assess the method. Then, the processed HF radar geostrophic velocities were used in synergy with additional in situ data, altimetry, and gravimetry to compute a new coastal MDT, which shows significant improvement compared with the global MDT. This study showcases the benefit of combining satellite data with continuous, high-frequency, and synoptic in situ velocity data from coastal radar measurements; taking advantage of the different scales resolved by each of the measuring systems. The integrated analysis of in situ observations, satellite data, and numerical simulations has provided a further step in the understanding of the local ocean processes, and the new MDT a basis for more reliable monitoring of the study area. Recommendations for the replicability of the methodology in other coastal areas are also provided. Finally, the methods developed in this study and the more accurate regional MDT could benefit present and future high-resolution altimetric missions.
Introduction
Satellite altimeters are measuring sea level continuously from 1992, covering the global ocean with revisit periods of at least ∼10 days. They provide the scientific community with near real-time along-track data of sea surface height above the reference ellipsoid (SSH). For oceanic circulation studies, the variable of interest is the dynamic topography, which is the sea surface elevation above the geoid. Unfortunately, the present knowledge of the geoid is not accurate enough to compute the dynamic topography with the required precision; indeed, by construction, the last geoid model, based on the data from the Gravity field and steady-state Ocean Circulation Explorer mission (GOCE), is not able to resolve scales smaller than ∼100 km. To get rid of geoid errors, oceanographers work with Sea Level Anomalies (SLA), computed by removing a Mean Sea Surface above a reference ellipsoid (MSS) from the SSH and therefore, representing the time-dependent variability with respect to a “mean” circulation (e.g., Wunsch and Stammer, 1998). Global gridded SLA fields from several altimetric missions are being produced by data centers such as Copernicus SLTAC (e.g., Taburet et al., 2019), resolving wavelength scales ranging from ∼100 km at high latitudes to ∼800 km in the Equatorial band (Ballarotta et al., 2019). Global geostrophic currents can be derived from the sea level fields, and an approximation to the global currents can be obtained by also considering the wind contribution (Rio et al., 2014). Besides, the time anomalies of the geostrophic current estimated from the altimetry, there is a need for a reference surface, the Mean Dynamic Topography (MDT). The MDT is a key reference surface needed for estimating the Absolute Dynamic Topography (ADT) (the sea level above the geoid) from altimetric SLA, and for their assimilation into ocean modeling systems. Since 2004, global MDT solutions combining altimeter, gravimeter, and in situ data (Temperature and Salinity (T/S) profiles and surface drifters) have been routinely calculated (Rio and Hernandez, 2004; Rio et al., 2007, 2011, 2014; Mulet et al., 2020). The last solution (CNES-CLS18) provides an accurate estimate of the MDT at spatial scales larger than ∼25 km.
In coastal areas, in situ measurements are sparse (mainly on the shelf), and the first guess is less accurate, due to the impact of huge differences between the MSS and the geoid height over land, especially over the mountains (Siegismund, 2020). Consequently, even if significant improvements have been achieved (see Mulet et al., 2020), global MDT solutions are often less accurate in coastal areas than in the open ocean. In a first step, this surface is calculated by considering gravimetry and altimetry data to end up with geodetic MDT. The latest geodetic MDT has been calculated from the GOCE mission (Bingham et al., 2008; Knudsen et al., 2011; Mulet et al., 2012; Becker et al., 2014; Siegismund, 2020) and resolves scales of about 100–150 km (Mulet et al., 2012). To improve the accuracy of the geodetic MDT and to resolve lower scales, in a second process, in situ data from drifters and Argo buoys are incorporated in the computation (Rio et al., 2011, 2014). As explained before, these in situ data used in the last step of the MDT computation, are usually sparse in coastal areas. To compensate for this lack of data, an additional source of in situ information on coastal currents is proposed in this study: surface current fields from HF radars.
Coastal HF radar systems provide information in near real-time of the surface ocean state. The area and distance covered by the observations, the frequency, and the depth of the sampled water column depend on the configuration of the systems. The installation of these systems has increased worldwide, e.g., on the European coast, more than 50 HF radars were installed in the last decade (Rubio et al., 2017). Some of these operational systems continue providing operational data and have supplied since their installation a historical dataset of surface ocean current fields valuable for, besides other purposes, the study of coastal dynamics and coastal retention conditions at different spatio-temporal scales, the validation of remote ocean currents measurements or the assimilation in ocean models. In the study area (Figure 1), the south-eastern Bay of Biscay (SE-BoB), one of these systems provides since 2009 almost continuous information of the local surface current dynamics (e.g., Solabarrieta et al., 2014; Manso-Narvarte et al., 2018; Rubio et al., 2018) and can be used to obtain a robust estimation of the mean ocean surface circulation.
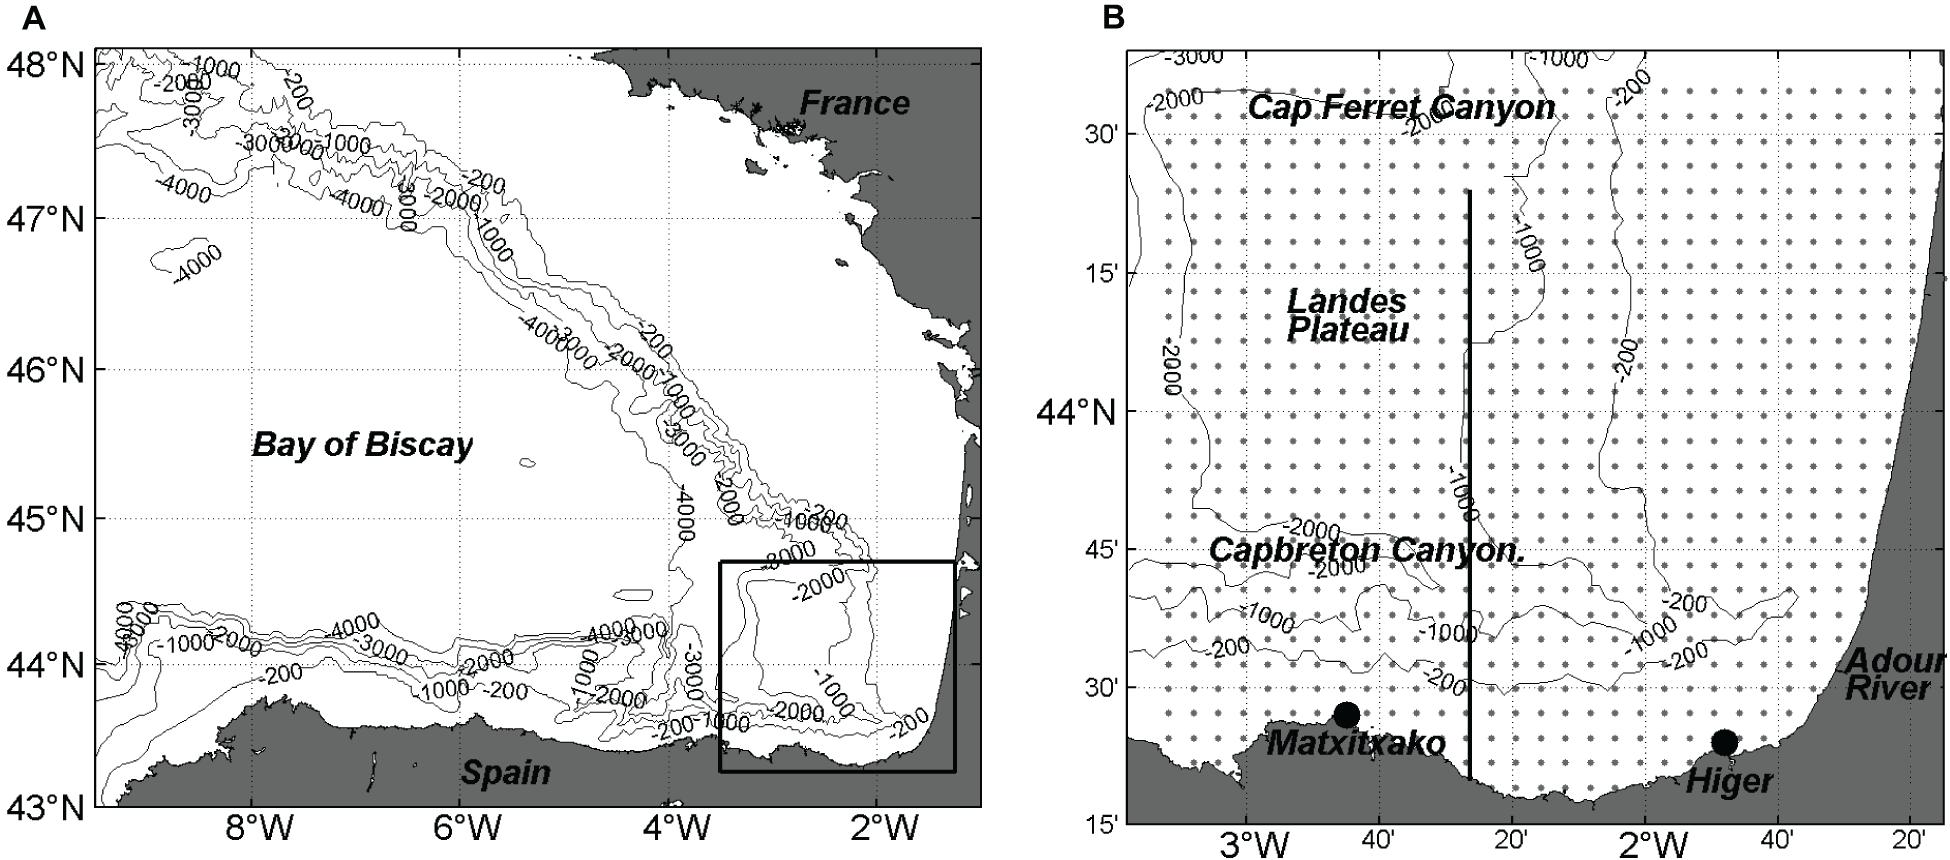
Figure 1. (A) Location of the Bay of Biscay and of the study area (black square). (B) Zoom in the study area (SE-BoB). Footprint area of the HF radar system, location of its antennas (black points), and grid points of the total currents (gray points). The black line indicates the transect analyzed in Figure 11.
Monitoring and modeling the surface circulation of the SE-BoB is quite challenging because the circulation is strongly constraint by the complex bathymetry and it is mainly driven by the high-frequency wind forcing (especially strong wind events in winter), tides and rivers discharge (mostly from the Adour river) over the shelf (Solabarrieta et al., 2014). The Iberian Poleward Current (hereafter IPC) is a slope current flowing eastward along the Spanish coast and northward along the French coast. The IPC is the most salient feature of the winter surface circulation in the SE-BoB; previous studies have shown that its variability can be observed in altimetric data (e.g., Herbert et al., 2011; Xu et al., 2015; Manso-Narvarte et al., 2018). Despite its strong seasonal and interannual variability, its signature in the mean circulation can be expected. The presence of a steep slope with canyons on the south and of the gently sloping Landes Plateau in the east represents a strong constraint on both the ocean response to wind and atmospheric pressure (e.g., Rubio et al., 2011; Kersalé et al., 2016) and on the variability of the slope current. In particular, cyclonic and anticyclonic eddies have been reported in many papers from satellite or in situ observations (e.g., Pingree and Le Cann, 1992; Caballero et al., 2008, 2016; Rubio et al., 2018); some of them are propagating westward while others are trapped by the topography (e.g., Garcia-Soto et al., 2002; Caballero et al., 2014).
In this study, we use a 9-year time series of HF radar currents, which have been shown in previous studies (Solabarrieta et al., 2014; Manso-Narvarte et al., 2018) to provide a consistent description of the ocean surface circulation with the one found in the literature (e.g., Le Cann and Serpette, 2009; Charria et al., 2013). When the mean HF radar currents were compared with the mean geostrophic current from the spatial derivatives of already existing MDTs, we found significant differences. Indeed, the CNES-CLS13 MDT (Rio et al., 2014, Figure 2A) available when this study started, presented an anomalous pattern with respect to the mean surface circulation inferred from the HF radar system (Figure 2B). The new CNES-CLS18 MDT (Figure 2C; Mulet et al., 2020) shows more realistic patterns due to the incorporation of more observations from drifters and to the improvement of the processing. In the CNES-CLS18 MDT, we observe the signature of an eastward current along the Spanish slope and shelf; however, it still presented differences with the mean HF radar surface currents. One of them concerns the cyclonic circulation, centered at around 43°42′N and 2°20′W in the HF radar: in the CNES-CLS18 product, it is shifted to the north and has a larger scale. The mean HF radar current is not expected to be identical to the one derived from the MDT, first because they are not estimated over the same period, but more importantly because the HF radar current contains both the ageostrophic and geostrophic components.
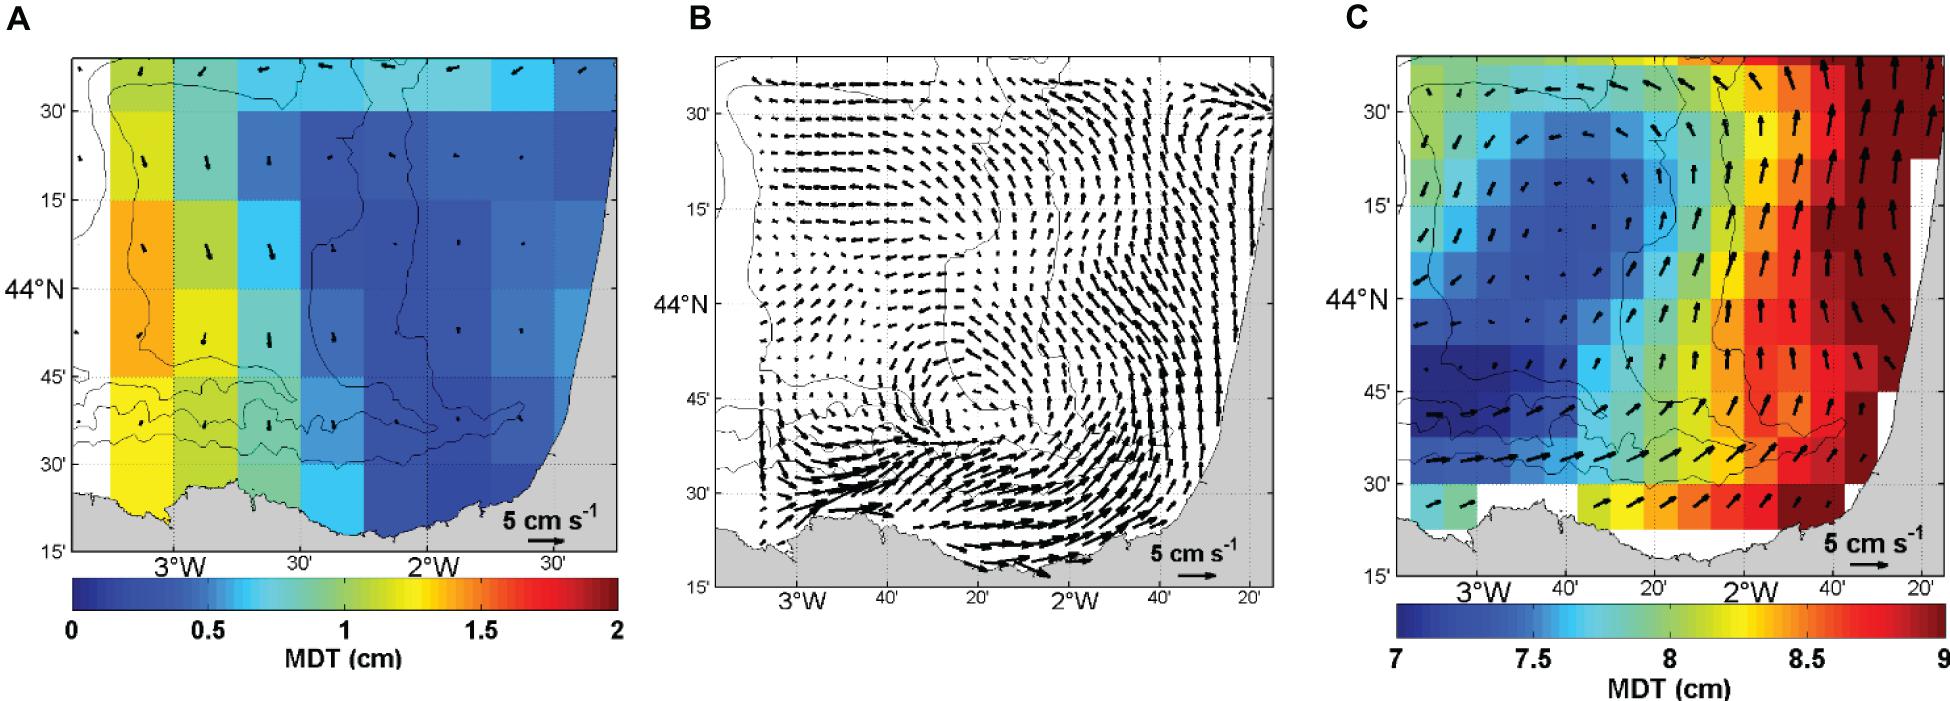
Figure 2. (A) CNES-CLS13 MDT referenced to 1993–2012 and derived geostrophic vectors, (B) HF radar-derived surface mean current velocity vectors over 2009–2017, and (C) CNES-CLS18 MDT referenced to 1993–2012 and derived geostrophic vectors.
This calls for developing a method to extract the geostrophic component from the HF radar current and make it comparable to the MDT-derived circulation. The information from the HF radar system can then be used to assess and eventually to constrain the MDT locally. This is what we propose to investigate in the present study: open the perspective for the systematic improvement of coastal MDT in areas covered by a HF radar or a network of them. The two main objectives of this study are first, to develop a method to compute the geostrophic signal from coastal HF radar data and, second, to produce a coastal MDT by integrating the HF radar system of the SE-BoB as a proof of concept. CNES-CLS18 MDT so far only includes drifters and T/S profiles (Argo, CTD, XBT). This coastal region is poorly sampled in space and time while its hydrodynamics is complex and characterized by smaller spatial scales and shorter time scales than in the open ocean. HF radar systems, in general, provide a continuous, regularly sampled, set of observations. The time series of hourly fields on a 5-km resolution grid of SE-BoB HF radar system contains information at small scales that are expected to bring valuable missing signals in the present MDT product. To extract the geostrophic signal from the HF radar surface currents, we first estimate and subtract the Ekman current; then we compute the non-divergent part of the residual current using a Helmholtz-Hodge decomposition (hereafter HHD; Girault and Raviart, 1986; Zhang et al., 2019). The efficiency of the method used to filter out the Ekman current is evaluated using a numerical simulation. Indeed, the model provides both the total surface current (equivalent to the HF radar observations) and the true geostrophic current (equivalent to the targeted current estimate to be used in the MDT calculation). We remove the Ekman component from the simulated total current using the method we want to test and obtain an estimation of the geostrophic current; the latter is then compared to the true (simulated) geostrophic current. In this study, the model is used similarly as in an Observing System Simulation Experiment; it is not used to compute the MDT strictly speaking.
The method followed to compute the coastal MDT is explained in section “Method.” Data and simulations used in this study are described in section “Data and Simulations,” while the different processing steps are explained in section “Data Processing.” The resulting coastal MDT is described in section “Coastal MDT Including HF Radar Data.” Finally, to evaluate the realism of the coastal MDT, in terms of ocean dynamics in the study area, ADT maps have been calculated, by adding the MDT to SLA. Then, geostrophic currents have been estimated from the ADT and compared to independent HF radar currents. The results of this comparison are described in section “Coastal Absolute Dynamic Topography.” Discussion and conclusions are given in section “Discussion” and “Conclusions,” respectively.
Method
The method used to compute the MDT follows Rio and Hernandez (2004), Rio et al. (2011, 2014), and Mulet et al. (2020), and consists of three steps. First, a geodetic MDT is calculated from the filtered difference between an altimetric MSS and the geoid height deduced from satellite geodetic missions and referenced to the same ellipsoid than the MSS. The effective resolution of the obtained field is governed by the spatial resolution of the geoid model used. It is around 125 km for the latest geoid models based on GOCE data. Besides, synthetic mean heights and synthetic mean geostrophic velocities are calculated using in situ measurements. Synthetic mean heights and velocities and their associated error are used to add shorter scales to the geodetic MDT and improve its accuracy, through multivariate objective analysis. In situ data do not have the same physical content as MDT and thus they need to be processed in order to be consistent with MDT and associated geostrophic mean current. As in the computation of the MDT CNES-CLS18 we use T/S profiles and surface drifters. However, in the present study, we also consider velocities from HF radar. The processing of the T/S profiles is the same as for the MDT CNES-CLS18, while the processing of surface drifters is also the same except that in the present study we add another step to remove residual ageostrophic signals as described in section “Removal of Residual Ageostrophic Signal: HHD.”
The novelties of the present approach, in comparison with previous studies (Mulet et al., 2020) are first, the computation of a new geodetic first guess in the BoB (section “Filtered Geodetic MDT”); second, the incorporation of HF radar data; and finally, an additional step to remove residual ageostrophic signals from the drifter and HF radar currents using HHD (section “Removal of Residual Ageostrophic Signal: HHD”).
Data and Simulations
HF Radar Data
The coastal radar data used in this work come from the HF radar system located in the SE-BoB (see the position of the two antennas or radial stations and the footprint in Figure 1B). It provides hourly surface current measurements of the 2–3 first meters of the water column and it has been operational since 2009. The coverage of the radial data is up to 150 km, and the range cell and angular resolution are set to 5 km and 5°, respectively. Radial data are quality-controlled using advanced procedures based on velocity and variance thresholds, signal to noise ratios, and radial total coverage. Since the deployment of the HF radar system, the receiving antenna pattern of the two HF radar radial stations has been calibrated at least every 2 years. A more detailed description of the system, and the HF radar data validation exercises are provided by Solabarrieta et al. (2014, 2015, 2016) and Rubio et al. (2011, 2018, 2019, 2020). Total currents, gridded into a 5 km resolution regular orthogonal mesh, were obtained by applying a least mean square algorithm (spatial interpolation radius of 10 km) in the areas where there was enough information from the two radial stations. For this work, radial currents were processed to generate Open Mode Analysis (OMA) spatially gap-filled total derived currents (Kaplan and Lekien, 2007), by using the HFradar_Progs Matlab package1, based on Gurgel (1994) and Lipa and Barrick (1983). 85 OMA modes, built setting a minimum spatial scale of 20 km, were used to generate hourly gap-filled total fields (Solabarrieta et al., 2016; Hernández-Carrasco et al., 2018).
Drifters and T/S Profiles
In addition to radar data, we also used velocities estimated from 15 m depth drogued and undrogued SVP-type drifters (Lumpkin et al., 2013), and Argo float drifting at the surface (YOMAHA database; Lebedev et al., 2007), reprocessed from January 1993 to December 2016. The T/S profiles from the CORA database (Szekely et al., 2019) have been processed to calculate the dynamic heights and an estimate of the MDT called “synthetic MDT.”
Figure 3A shows the sum of the number of observations from the drifters, Argo floats drift and T/S profiles in each grid point (5 km × 5 km) within the HF radar footprint. The number goes from no observation (white grid points) to a maximum of 50 observations. This number of observations contrasts with the hourly total current observations provided by the HF radar in each grid point from 2009 to 2017 (Figure 3B).
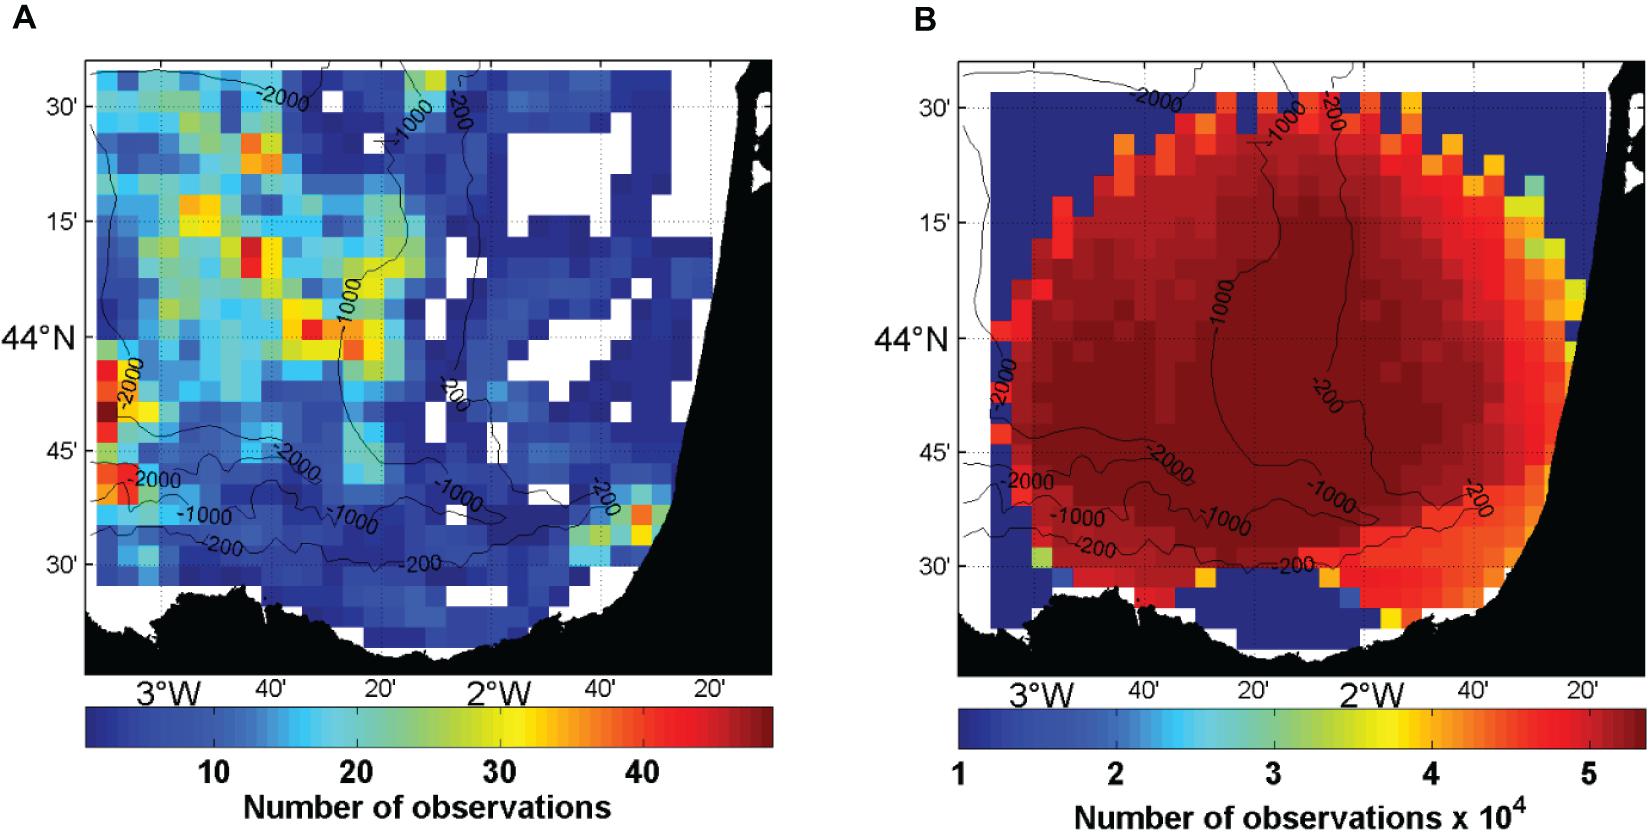
Figure 3. (A) Sum of the number of observations from drifters, Argo-floats drifting at the surface and T/S profiles, used in the MDT computation, within the HF radar currents grid and (B) sum of the number of HF radar observations (×104).
Altimetric and Wind Data
For the computation of a time series of daily ADT maps (coastal MDT + SLA, referenced to 1993–2012), SLA maps from the regional European DT2018 product (Taburet et al., 2019) over 2009 to 2018 have been selected. Additional SLA maps from the Global DT2018 products (Taburet et al., 2019) have been used within the in situ data processing (section “Drifters and T/S Profiles”).
To compute the wind-driven circulation, we use an operational product of the Meteorological Agency of Galicia (MeteoGalicia). It consists in simulated winds from the Weather Research and Forecasting model, provided every hour with a native resolution of 12 km, They have been shown to reproduce observed wind-fields correctly in the study area (Ferrer et al., 2010).
High-Resolution Coastal Simulation
To assess the performance of the approach used to remove the Ekman component from the total currents, we use outputs from a high-resolution coastal simulation. The Symphonie model is a free surface primitive equations model developed for regional and coastal hydrodynamics (Marsaleix et al., 2008) and has been set-up in the Bay of Biscay with different configurations (Herbert et al., 2011; Toublanc et al., 2018; Ghantous et al., 2020). In the used configuration, the domain covers the whole Bay of Biscay, but the grid has a very variable spatial resolution with an enhanced resolution over the shelves (between 500 and 900 m in the SE-BoB) and 55 generalized sigma levels. Assuming a ratio of 5–6 with the horizontal resolution, the effective resolution of the model lies between 3 and 6 km, therefore, consistent with the radar grid resolution. The local radius of deformation, estimated from the simulation, is between 2 and 15 km from the inner shelf to the Landes Plateau but decreases down to ∼1 km over the shelf in winter when the water column is well mixed. This configuration and the assessment of the simulation through comparisons with observations are described in Toublanc et al. (2018). Symphonie is forced by the ECMWF operational analyses provided every 3 h; the air-sea fluxes are then computed from the atmospheric variables and the bulk formula of Large and Yeager (2004). At the open-boundaries, the model is forced by nine tidal constituents and by the 3D non-tidal large-scale circulation in the Iberian-Biscay-Ireland (IBI) domain from the operational IBI36V2R1 product (1/36° resolution) from the Copernicus Marine environment monitoring service (CMEMS). The model outputs consist of hourly surface currents (i.e., currents at the first model level) and SSH fields. A Butterworth low-pass filter with a cut-off period of 48 h is applied to the hourly surface currents to filter out the tidal and inertial motion, as this is done for the hourly HF radar measurements. Hereafter, this filtered surface current is referred to as the “total current.” Tides are removed from the hourly SSH fields using a classical harmonic analysis approach. The inverse barometer signal is estimated from the forcing atmospheric pressure at every model point and removed from the hourly SSH fields. Finally, to compute the geostrophic current, the SSH fields are averaged every 24 h; the averaging period is 25 h to filter out possible residual M2 tidal signal due to non-stationary tides. The Symphonie simulation is available over 2011–2012. We briefly describe below the main characteristics of the simulated surface currents and compare them with the observed ones from the HF radar.
Comparisons between the spectral contents of the simulated and HF radar currents for time scales shorter than 10 days, show a very good agreement for the main peaks (diurnal, semi-diurnal and inertial). We also find that the levels of energy for periods >1 day are overestimated by the Symphonie model over the slope, and mostly for the meridional component (not shown). At monthly and seasonal time scales, qualitative comparisons suggest that the model overestimates the extension and the amplitude of the IPC, especially northward along the slope at about 2°W. Such a bias on the amplitude of the IPC might be related to the lack of resolution to properly represent the constraint by the bathymetry on the circulation. In summer, the flow is also eastward on average, but it is much weaker and located over the shelf. Both the simulation and HF radar measurements indicate the occurrence of eddies; in particular, an anticyclone develops regularly in winter over the Landes Plateau with no counterpart in the observations. Figure 4 compares the seasonal surface currents and kinetic energy per unit of mass (in m2 s–2) as observed by the HF radar and as simulated by the model. It illustrates the overestimation by the Symphonie model of the energy in both seasons. However, except for the slope current at 2°W in winter, there is an overall acceptable agreement in the distribution of the flow. Over the eastern shelf, the circulation is weaker but is probably underestimated by both the model and the radar because of the model resolution and HF radar grids. The kinetic energy undergoes a strong seasonality with a decrease in summer except along the inner shelf in both the model and the observations.
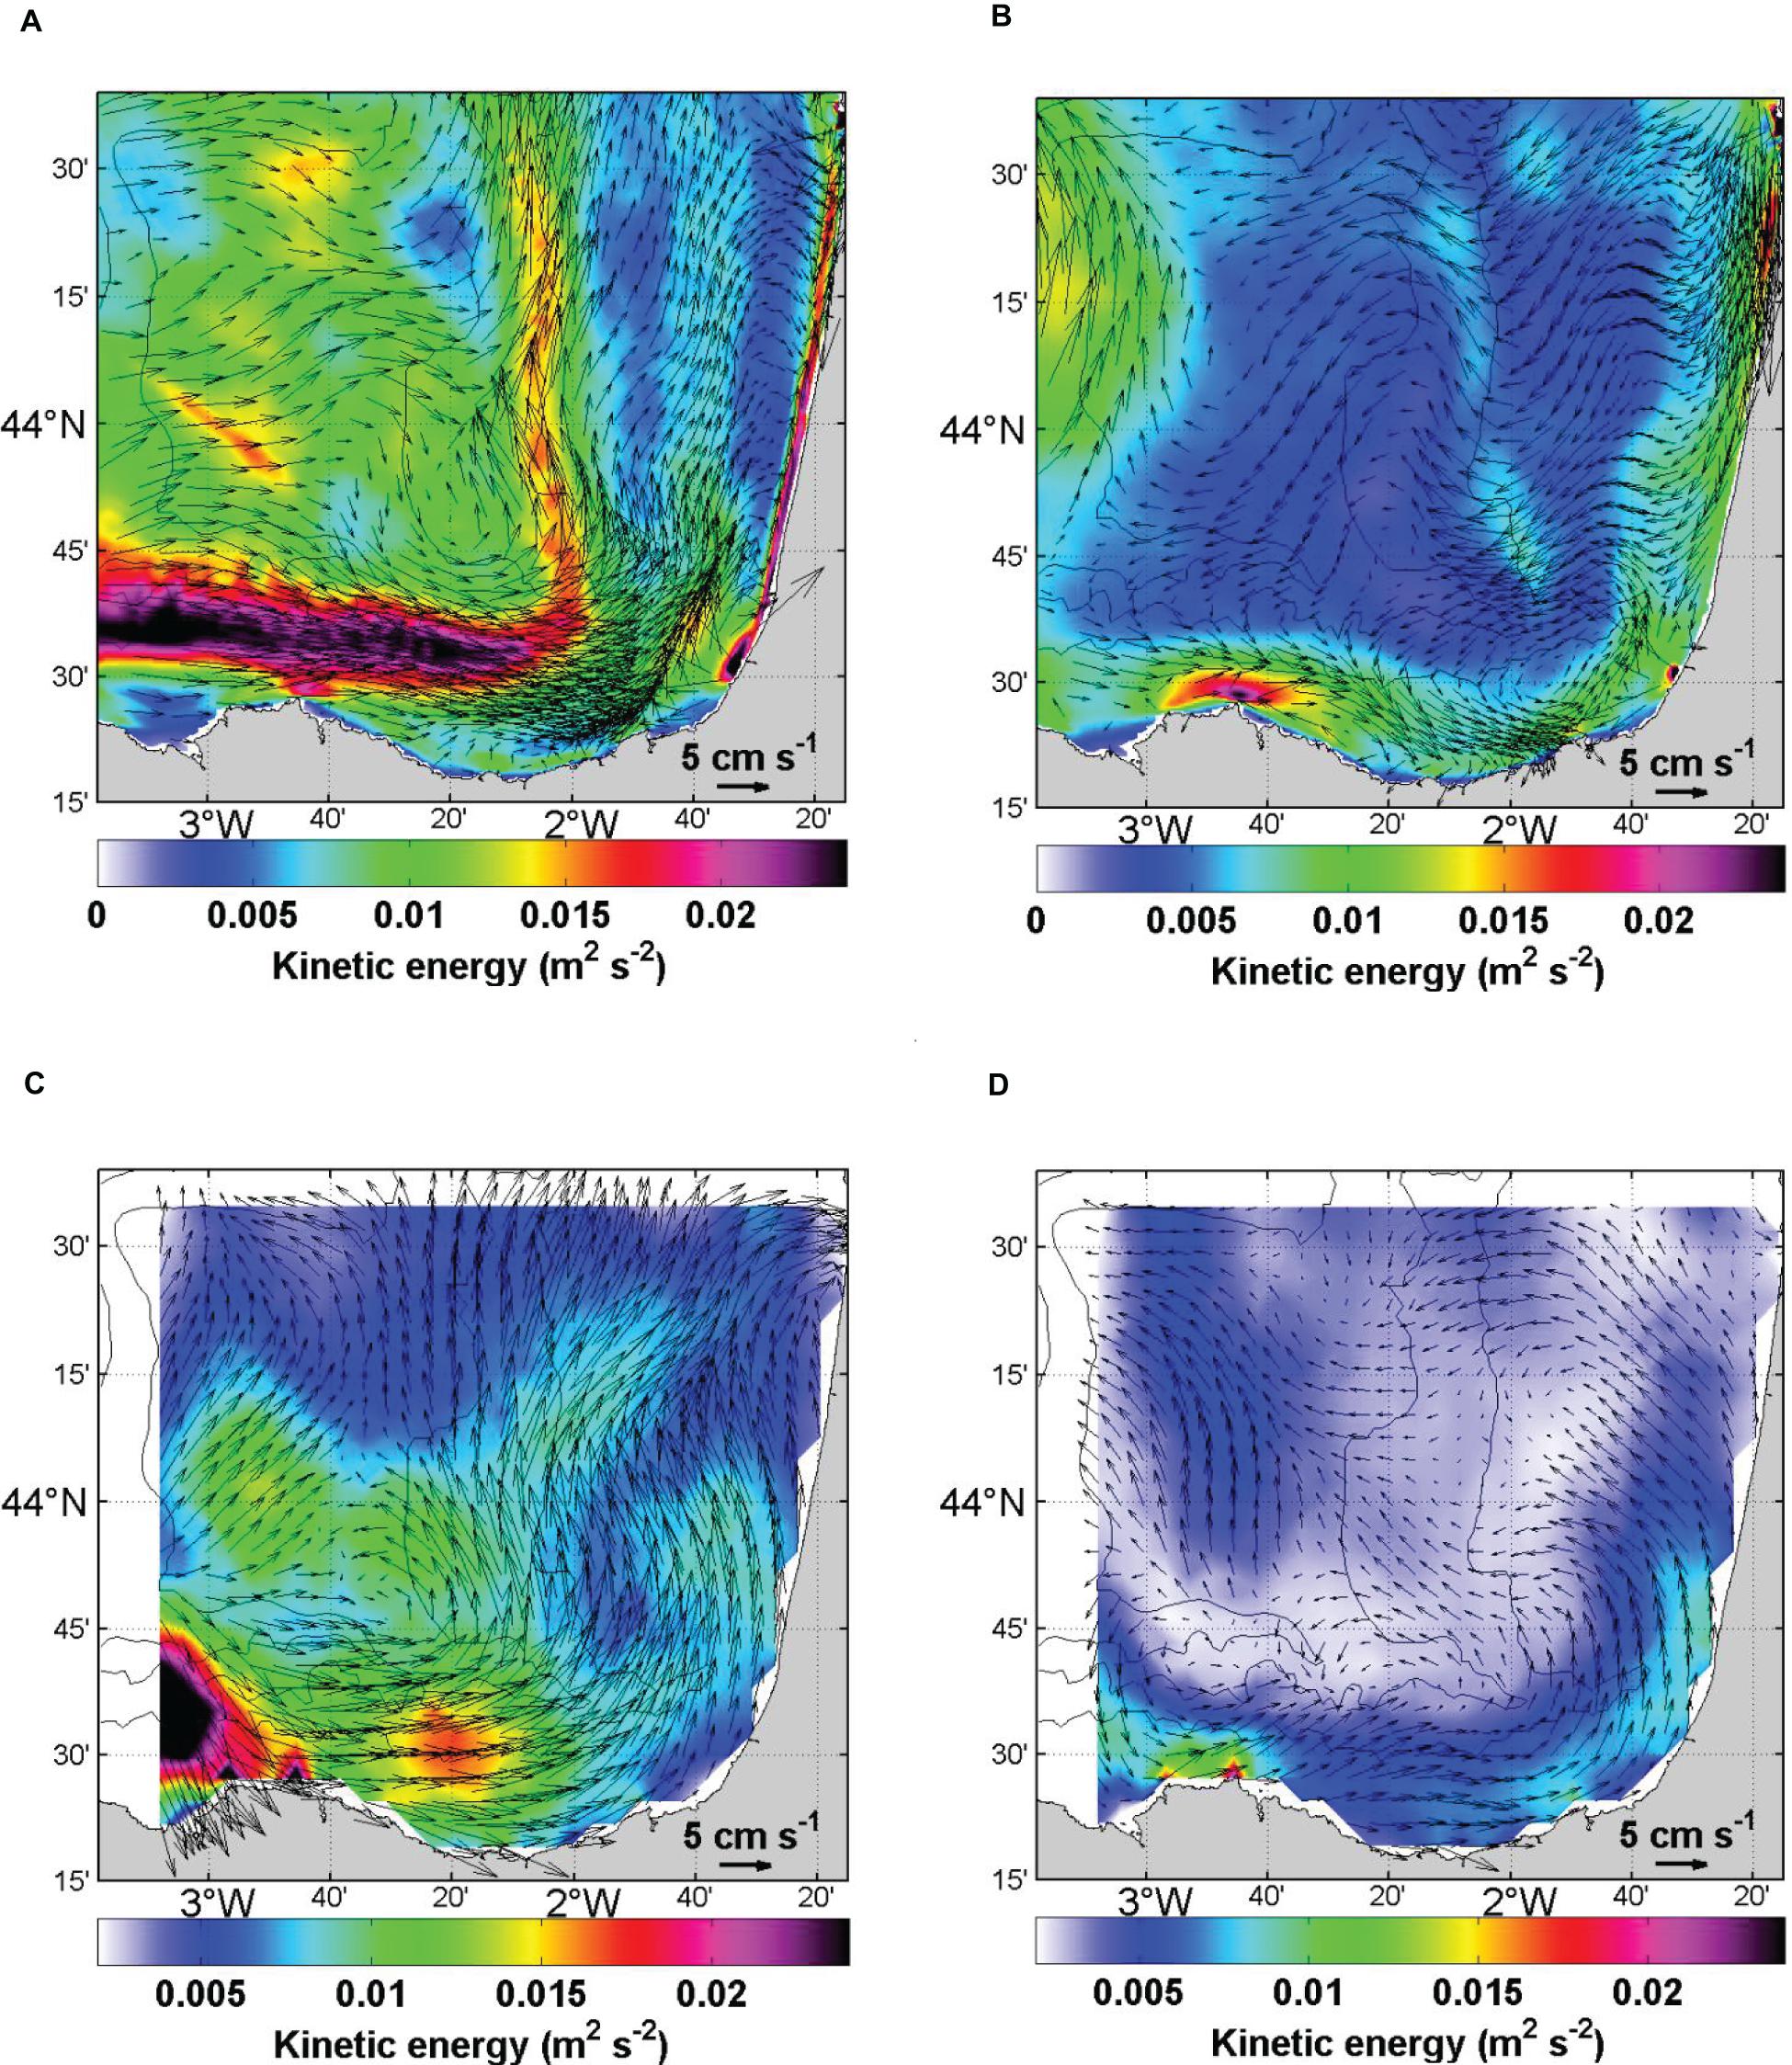
Figure 4. Surface currents and kinetic energy per unit of mass (in m2 s–2) for winter/summer from the simulation (A,B) and the HF radar (C,D), respectively. The summer and winter seasons are, respectively defined from May to August and from October to January (to December in 2012 since January 2013 is not available).
The overall circulation of the simulated surface currents averaged over the whole period 2011–2012 (not shown) is weak (mean amplitude lower than 8 cm s–1). Note that this average is not representative of a long term mean circulation (such as 1993–2012 that is the reference time period for altimetric data) because some episodic mesoscale features (meanders or eddies) have a signature in this short average but cannot be considered as long term mean feature of the circulation.
Data Processing
Filtered Geodetic MDT
The altimeter MSS resolves spatial scales down to a few kilometers. However, geoid models built from GOCE satellite measurements are not able to resolve scales smaller than 80 km by construction and their errors rapidly grow at scales shorter than 100 km. Therefore, the raw difference between the altimeter MSS and the GOCE geoid height is noisy; therefore, filtering is needed to remove it. The raw difference between the MSS CNES-CLS15 (Pujol et al., 2018) and the geoid model GOCO05s (Mayer-Gürr et al., 2015) shows a huge unrealistic and negative anomaly (less than 30 cm) over the Pyrenees and the mountains along the Cantabrian coast. This anomaly also affects the signal over the sea within the coastal area; thus, even if a land mask is used before filtering, this negative anomaly affects the final CNES-CLS18 first guess and as a result, the associated circulation along the Spanish coast is unrealistic. Thus, in this study, we apply a larger mask including the land and the pixels close to the coast. Consequently, the first guess of this coastal MDT better resolves the circulation, being in a better agreement with the literature (Manso-Narvarte et al., 2018).
Synthetic Mean Heights From T/S Profiles
The synthetic mean heights from T/S profiles are the one used in the MDT CNES-CLS18. The process followed with this dataset is fully detailed in Rio et al. (2011). It consists of first, computing dynamic heights from T/S profiles, adding the deep baroclinic and the barotropic part of the signal to have the same physical content as in the MDT, and second, removing the temporal variability using SLA maps to estimate a mean referenced to the same period as the DT2018 SLA maps (i.e., 1993–2012).
The synthetic MDT observations computed at each position and location of the T/S profiles are averaged to a 1/4° × 1/4° regular grid to compute “super-observations” of the MDT. The residual noise in the super-observations is filtered by the objective analysis, considering the associated observational errors. These errors depend on the number of observations per grid cell and on the maximum profile depths.
Synthetic Mean Velocities From Drifters and HF Radar
As explain in section “Method,” total velocities from drifters and HF radar need to be processed to only extract the geostrophic component that is consistent with MDT. This processing, based on an Ekman model (section “Removal of Ageostrophic Signal: Ekman Model”) and HHD (section “Removal of Residual Ageostrophic Signal: HHD”), is fully described in sections “Drifters Processing” and “HF radar Processing.”
Removal of Ageostrophic Signal: Ekman Model
The Ekman currents (Uek) are estimated following the simplified model of Rio et al. (2014):
where β and θ are spatially and monthly varying climatological coefficients determined empirically, and τ is the wind stress.
To evaluate the benefit of applying the “Ekman correction” we test it on the simulated fields. First, daily total and geostrophic surface currents are estimated. The latter is computed from the spatial derivatives of the daily SSH as this would be done from altimetric data maps. Hereafter, it is considered as the true geostrophic current (in the model world). Then, we estimate daily Ekman currents, using equation (1) and the daily average of the wind stress field calculated by the Symphonie model over the period 2011–2012. Then, the root mean square (RMS) over the whole period of the daily differences between the surface current and the geostrophic current is computed, before and after removing the Ekman current. This way we estimate the RMS of the ageostrophic current for both the zonal (u) and meridional (v) components. Before removing the Ekman current, the RMS is, on average over the basin, 4.9 and 5.6 cm s–1, respectively for u and v (not shown). After removing the Ekman current, the RMS decreases to 3.9 and 3.6 cm s–1 for u and v, respectively. The larger decrease in the meridional component is expected since the area is dominated by westerlies. These calculations indicate that removing the Ekman component following the method of Rio et al. (2014) is indeed efficient, but that a residual ageostrophic signal is still present.
Consequently, the current measurements corrected from the Ekman current may still contain a residual ageostrophic signal, although it tends to be weak when averaged over a multi-year period. Furthermore, the Ekman approximation given by equation (1) has been derived for open ocean motion, but in this study area, the presence of coastlines, shelf, and canyons (e.g., the Capbreton canyon) are obstacles to the establishment of an Ekman Current as in the open sea. Thus, we add an additional processing compared with what it is done for the MDT CNES-CLS18, consisting in applying a HHD as explained in the next section.
Removal of Residual Ageostrophic Signal: HHD
To remove the residual ageostrophic component, we proceed through a decomposition of current into a divergent and a rotational (non-divergent) component. We use HHD, which writes as follows:
Where is the 2D vector to be decomposed, θ and ψ the associated geopotential and stream function, respectively; and is the unit vector in the vertical direction. The divergent part (∇θ ) corresponds to the residual ageostrophic currents. For the HF radar current, it is mainly oriented north-westward and is likely related to uncertainties in the Ekman correction. The non-divergent part ( ) corresponds to our targeted signal: the mean geostrophic current.
Drifters Processing
The mean current estimated from drifters is the one used in the MDT CNES-CLS18 except that in this study we apply an HDD. First, a low pass filter is applied along the trajectory for removing the tidal and inertial components. Then, Ekman currents are estimated and removed as described in section “Removal of Ageostrophic Signal: Ekman Model.” The wind slippage is estimated and removed from the undrogued SVP drifters. The geostrophic current anomalies associated with the DT2018 SLA maps are interpolated in space and time on the drifters’ positions and removed from the drifter velocities, to estimate a mean that is referenced to the 1993–2012 period. Finally, all these observations are averaged into a 1/8° × 1/8° regular grid, to compute the so-called “super observations” of mean current, referenced to 1993–2012. Unlike for the MDT CNES-CLS18, an additional step is done: the HHD is applied to remove residual ageostrophic signal.
HF Radar Processing
One of the novelties of this study is the use of HF radar in the MDT computation. This section describes their processing. First, Ekman currents is computed using the wind stress from MeteoGalicia. Then, hourly Ekman currents and hourly gap-filled HF radar currents are 48-h low-pass filtered. Ekman currents are removed from the HF radar currents and finally, the resulting fields are averaged over the study period (2009–2017). After that, the HHD is applied to remove residual ageostrophic signal. Finally, the mean current computed from HF radar data is re-referenced over the 1993–2012 period using Equation 4:
where UHFR1993–2012 and UHFR2009–2017 are the geostrophic mean velocities from HF radar referenced over 1993–2012 and 2009–2017, respectively, and <Usla > 2009–2017 the mean over 2009–2017 of the geostrophic current anomalies associated with SLA referenced over the 1993–2012 period.
The resulting mean geostrophic currents are shown in Figure 5. As expected, the highest geostrophic signal in the study area is observed in the path followed by the IPC along the Cantabrian shelf/slope. Mean geostrophic currents are moderate around the canyon-centered cyclonic circulation and on the northern limit (excluding the area close to the coast) of the study area.
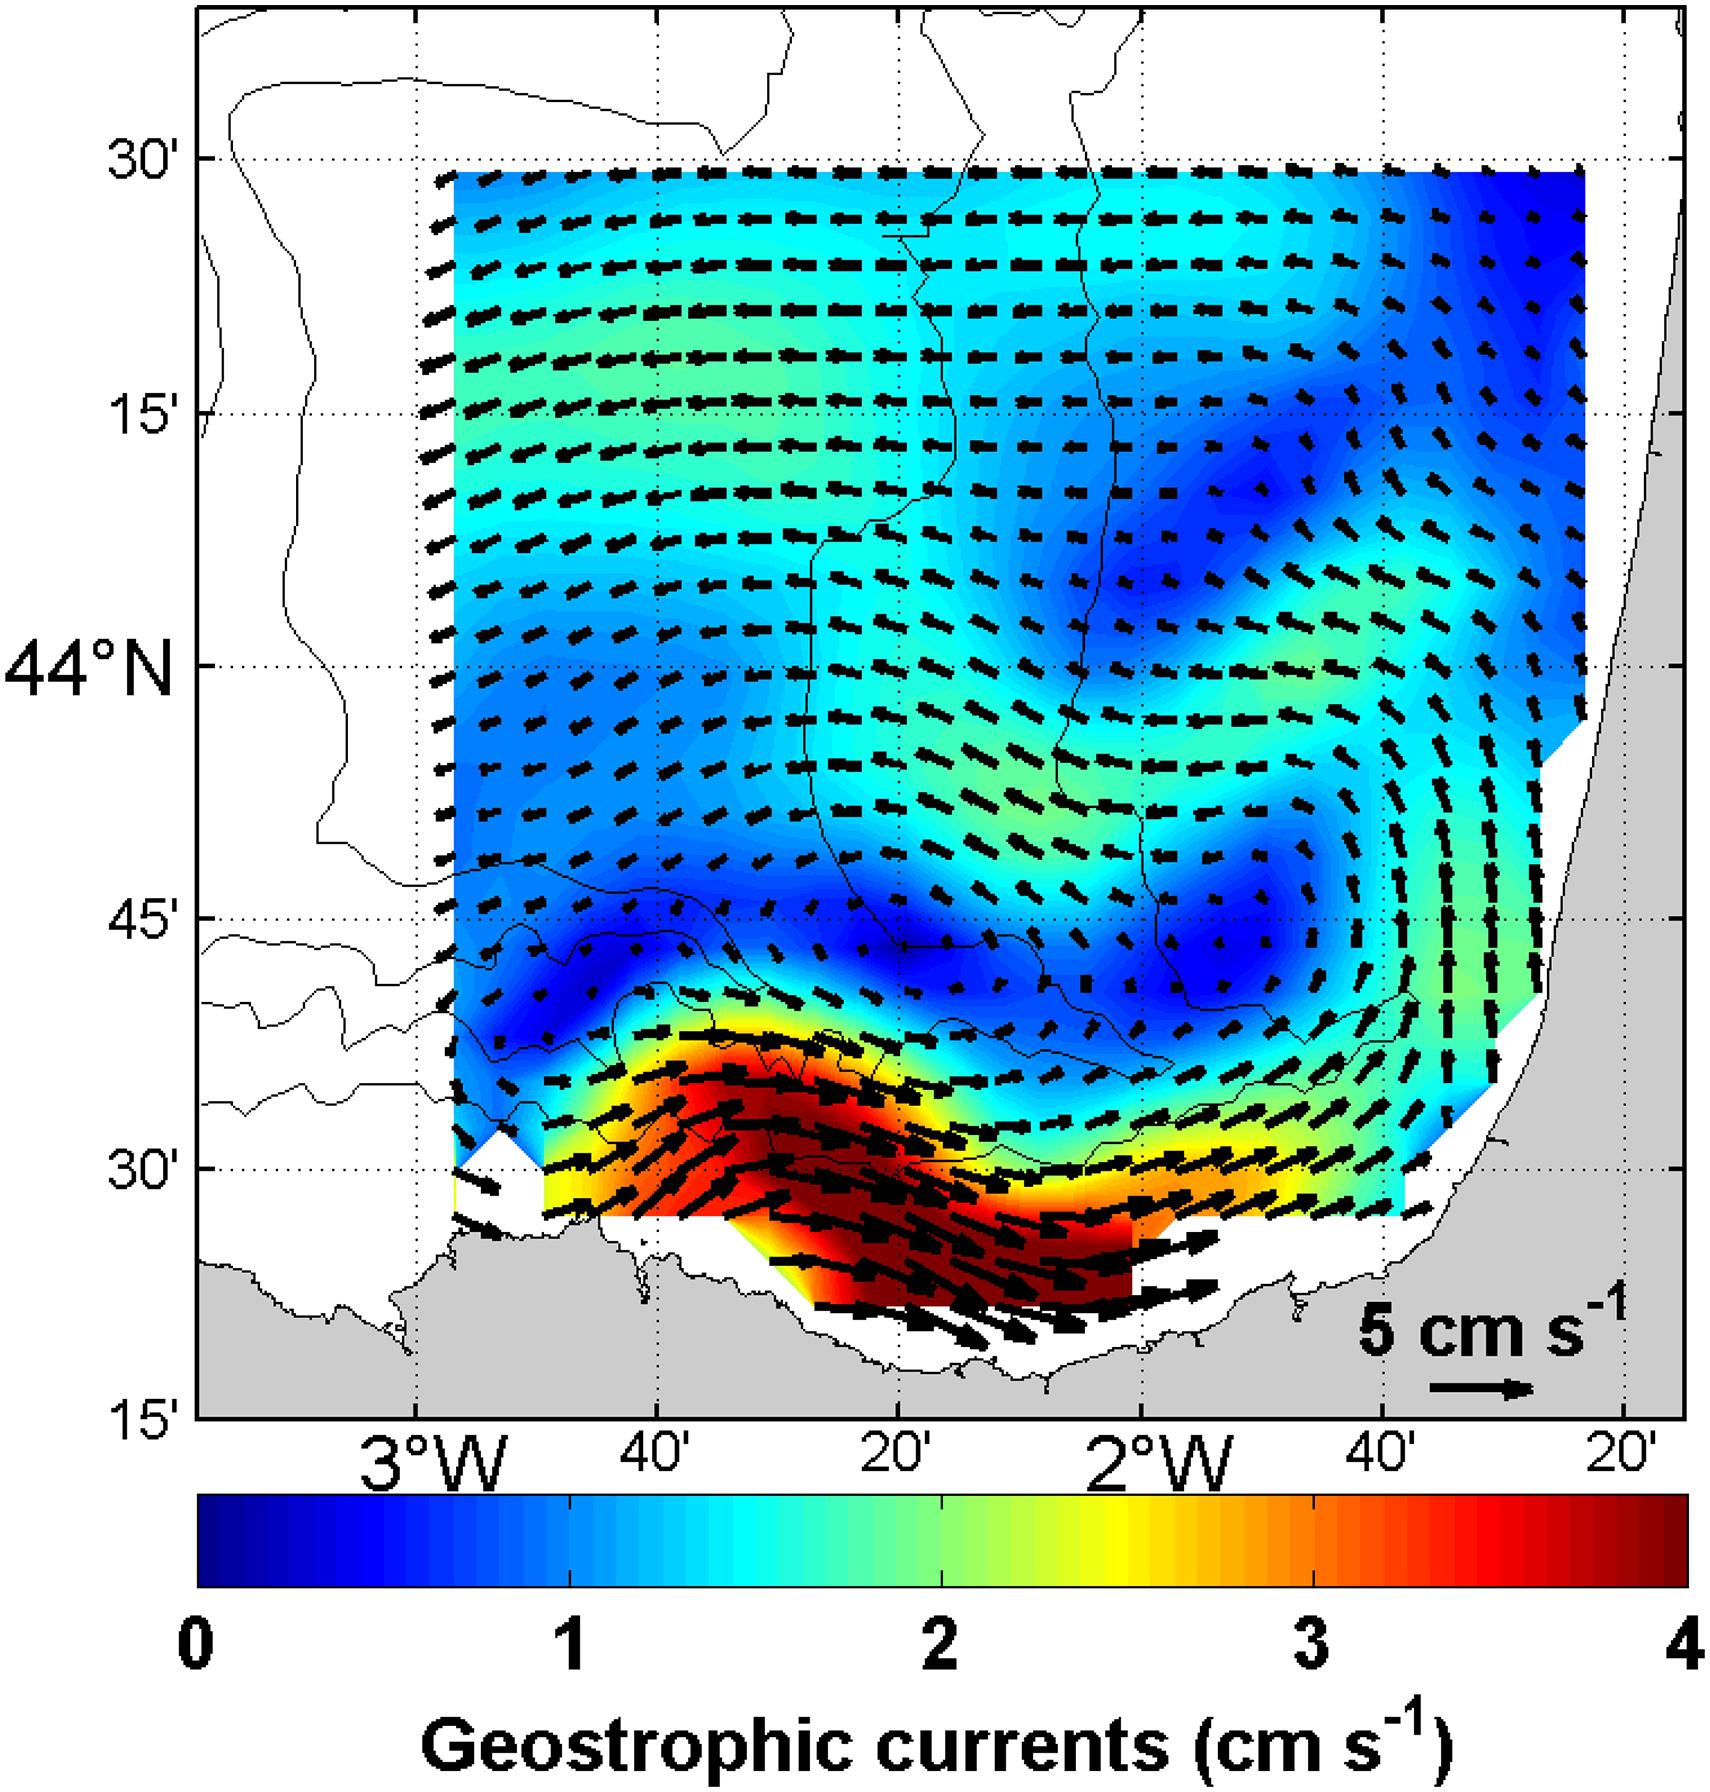
Figure 5. Mean geostrophic currents (cm s–1) in the SE-BoB measured from the HF radar and computed following the process explained in section “HF Radar Processing.”
As explained before, an error estimation must be considered in the multivariate objective analysis. Since in this study we include a new input of in situ data, we consider here two main errors in the HF radar measurements. The first one is the instrumental/observational error, i.e., the difference between a measured value of the surface currents and the true value; the second one is the geometrical error originated from the reconstruction of the total current fields that combines the radial velocities measured from each antenna (Rubio et al., 2017).
Estimating the instrumental/observational error of the radial measurement is not trivial since there is no independent dataset to validate HF radar currents at each measurement point. Comparisons with in situ measurements are often pointwise (e.g., moored ADCP) or very limited in time (e.g., surface drifter trajectory) and allow to validate only partially the region/period covered by the radar. From previous studies in other areas where HF radar data are compared to surface drifter clusters or AD, whose uppermost bins are not deeper than 5 m, RMS differences typical values between 3 and 12 cm s–1 are obtained (e.g., Ohlmann et al., 2007; Molcard et al., 2009; Kalampokis et al., 2016). In the case of the SE-BoB HF radar system, the RMS of the differences observed between the current velocities from the HF radar and moored ADCPs (1 or 2 sites depending on the period, and from measurements at a depth of 12 m) ranges between 8 and 10 cm s–1 (Solabarrieta et al., 2014). Therefore, in this study, we assumed a constant 9 cm s–1 upper bound for the instrumental/observational error.
The generation of OMA gap-filled fields from the radial velocities introduces additional errors on the gridded currents. We estimate those errors based on the method of Kaplan and Lekien (2007). The variance of the mean geometrical error for the zonal and meridional components of the current ranges from 0 to 1.2 cm2 s–2 and from 0 to 0.6 cm2 s–2, respectively and depends on the distance from the antenna (Figure 6).
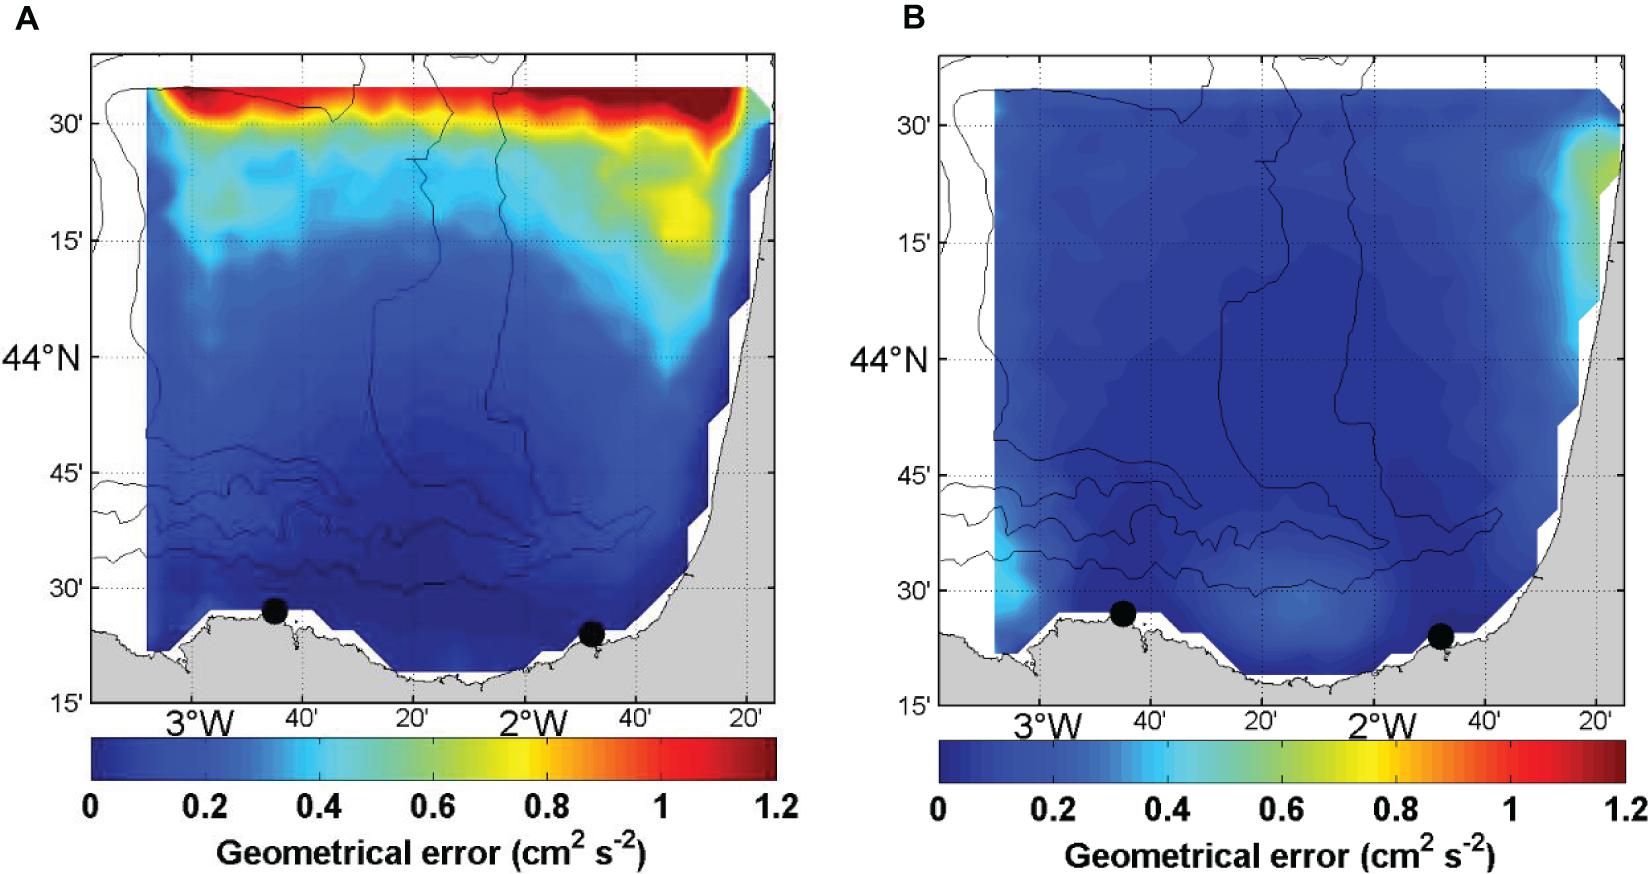
Figure 6. Geometrical error (cm2 s–2) of the zonal (A) and meridional (B) components of the HF radar currents from the OMA data and 2009–2017 period. The black points indicate the location of the HF radar antennas.
Additional error sources should be considered in future work, for instance the errors associated with the extraction of the geostrophic component. Indeed, residual ageostrophic signal could impact the final result.
Results
Coastal MDT Including HF Radar Data
The synthetic mean height and velocity fields and their associated error, the first guess MDT, the a priori knowledge of the MDT variance, and the a priori knowledge of the MDT zonal and meridional correlation scales are used to improve the short scales of the filtered geodetic MDT through a multivariate objective analysis. We have kept the same a priori values for the MDT variance and correlation scales as for the CNES-CLS18 MDT calculation.
The Bay of Biscay coastal MDT is based on a large scale first guess that has been improved by introducing the information from drifters, T/S profiles, and HF radar. The impact of each dataset in the solution has been tested separately (Figure 7). The addition of the mean geostrophic current field from the HF radar changes the first guess very locally and adds a cyclonic circulation pattern in the very south-eastern part of the region (Figure 7A). Drifters data sharpen the gradient in the coastal area, introducing meanders to this gradient, and leading to a more intense cyclonic circulation in the SE-BoB (Figure 7B). The latter is however less marked than the one observed in the HF radar mean current. Finally, the dynamic heights from the T/S profiles (Figure 7C) also sharpen the gradient and lead to a cyclonic circulation consistent with the HF radar one, but the associated height inside the cyclone is smaller. The dynamic heights are thus also needed to locally constrain the height of the coastal MDT along with the associated gradients.
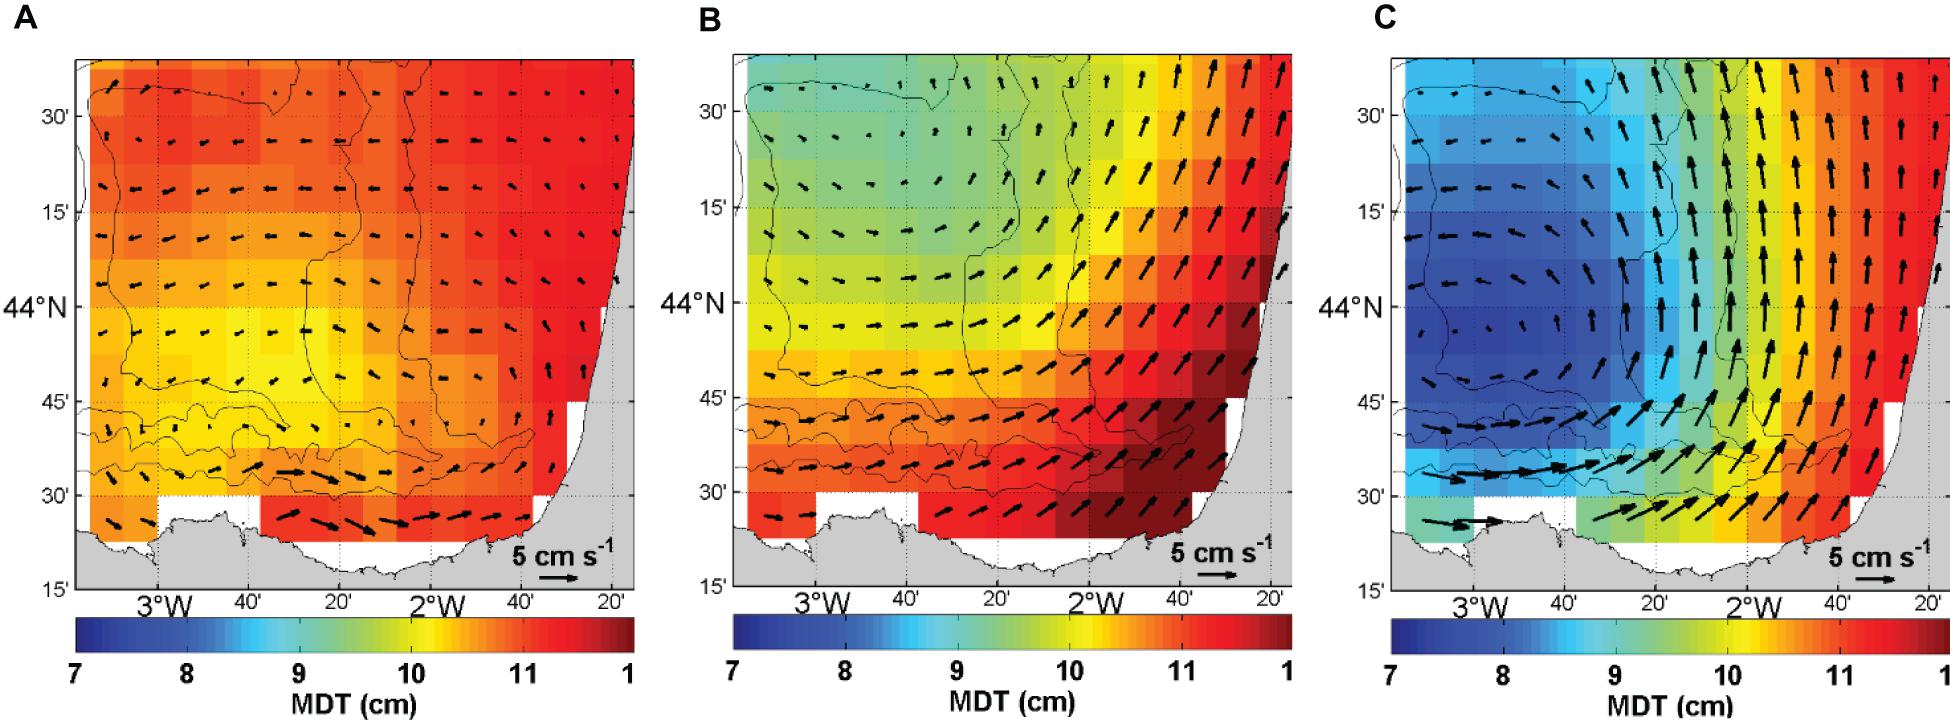
Figure 7. Coastal MDT (cm) computed using data only from HF radar (A), drifters (B), and T/S profiles (C).
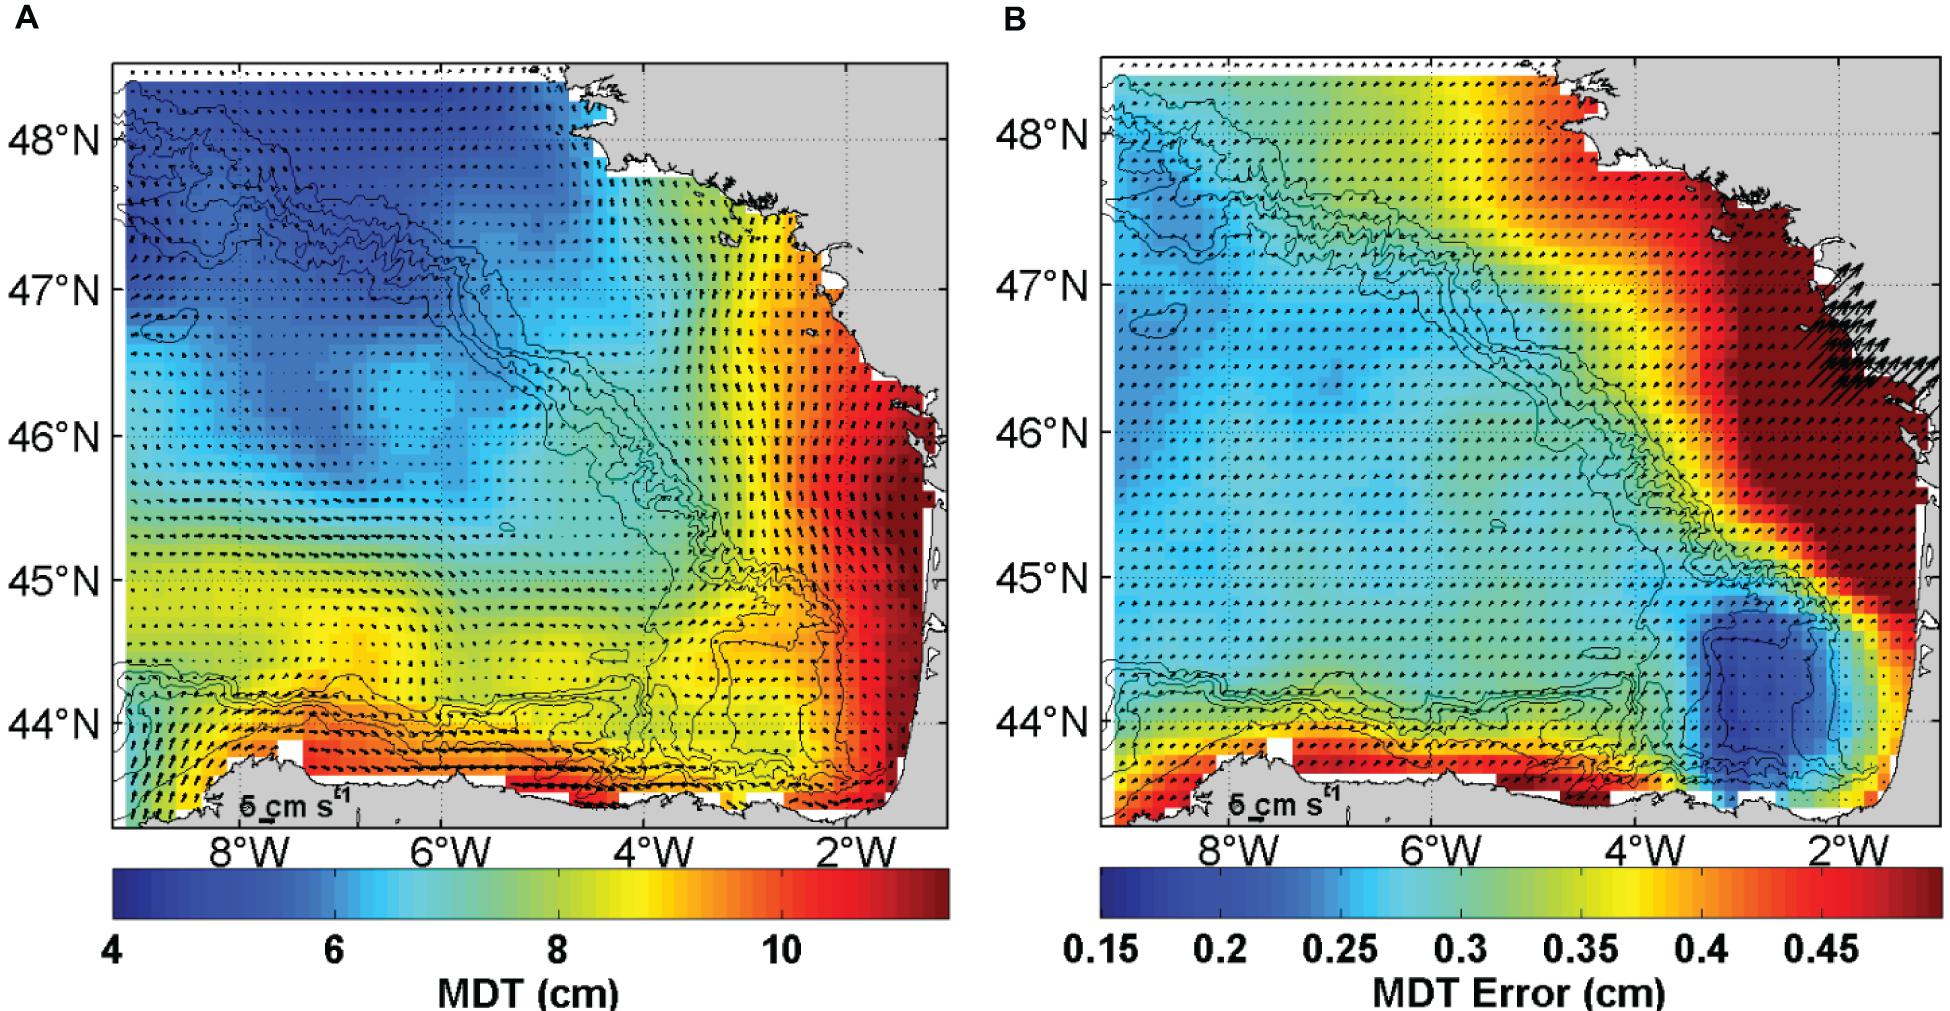
The resulting coastal MDT (Figure 8A) shows a large-scale pattern with low values (∼5 cm) in the abyssal plain and higher values (>10 cm) over the shelf/slope. Figure 8B shows the associated formal error computed through the objective analysis. This error is known to be underestimated but the patterns are instructive in showing the improvement due to HF radar: the lowest error is located under the HF radar footprint and the highest is found close to the coast where there is no information from HF radar.
The 1/8° spatial resolution of the coastal MDT is the same as the new CNES-CLS18 and provides twice the resolution of the old MDT (CNES-CLS13). Figure 9 illustrates the better match between the geostrophic currents and the bathymetry when the geostrophic currents are computed from the coastal MDT in comparison with that from the CNES-CLS18 MDT. Consequently, the signature of the IPC is clearly visible in the coastal MDT, while it is not in the CNES-CLS18 MDT.
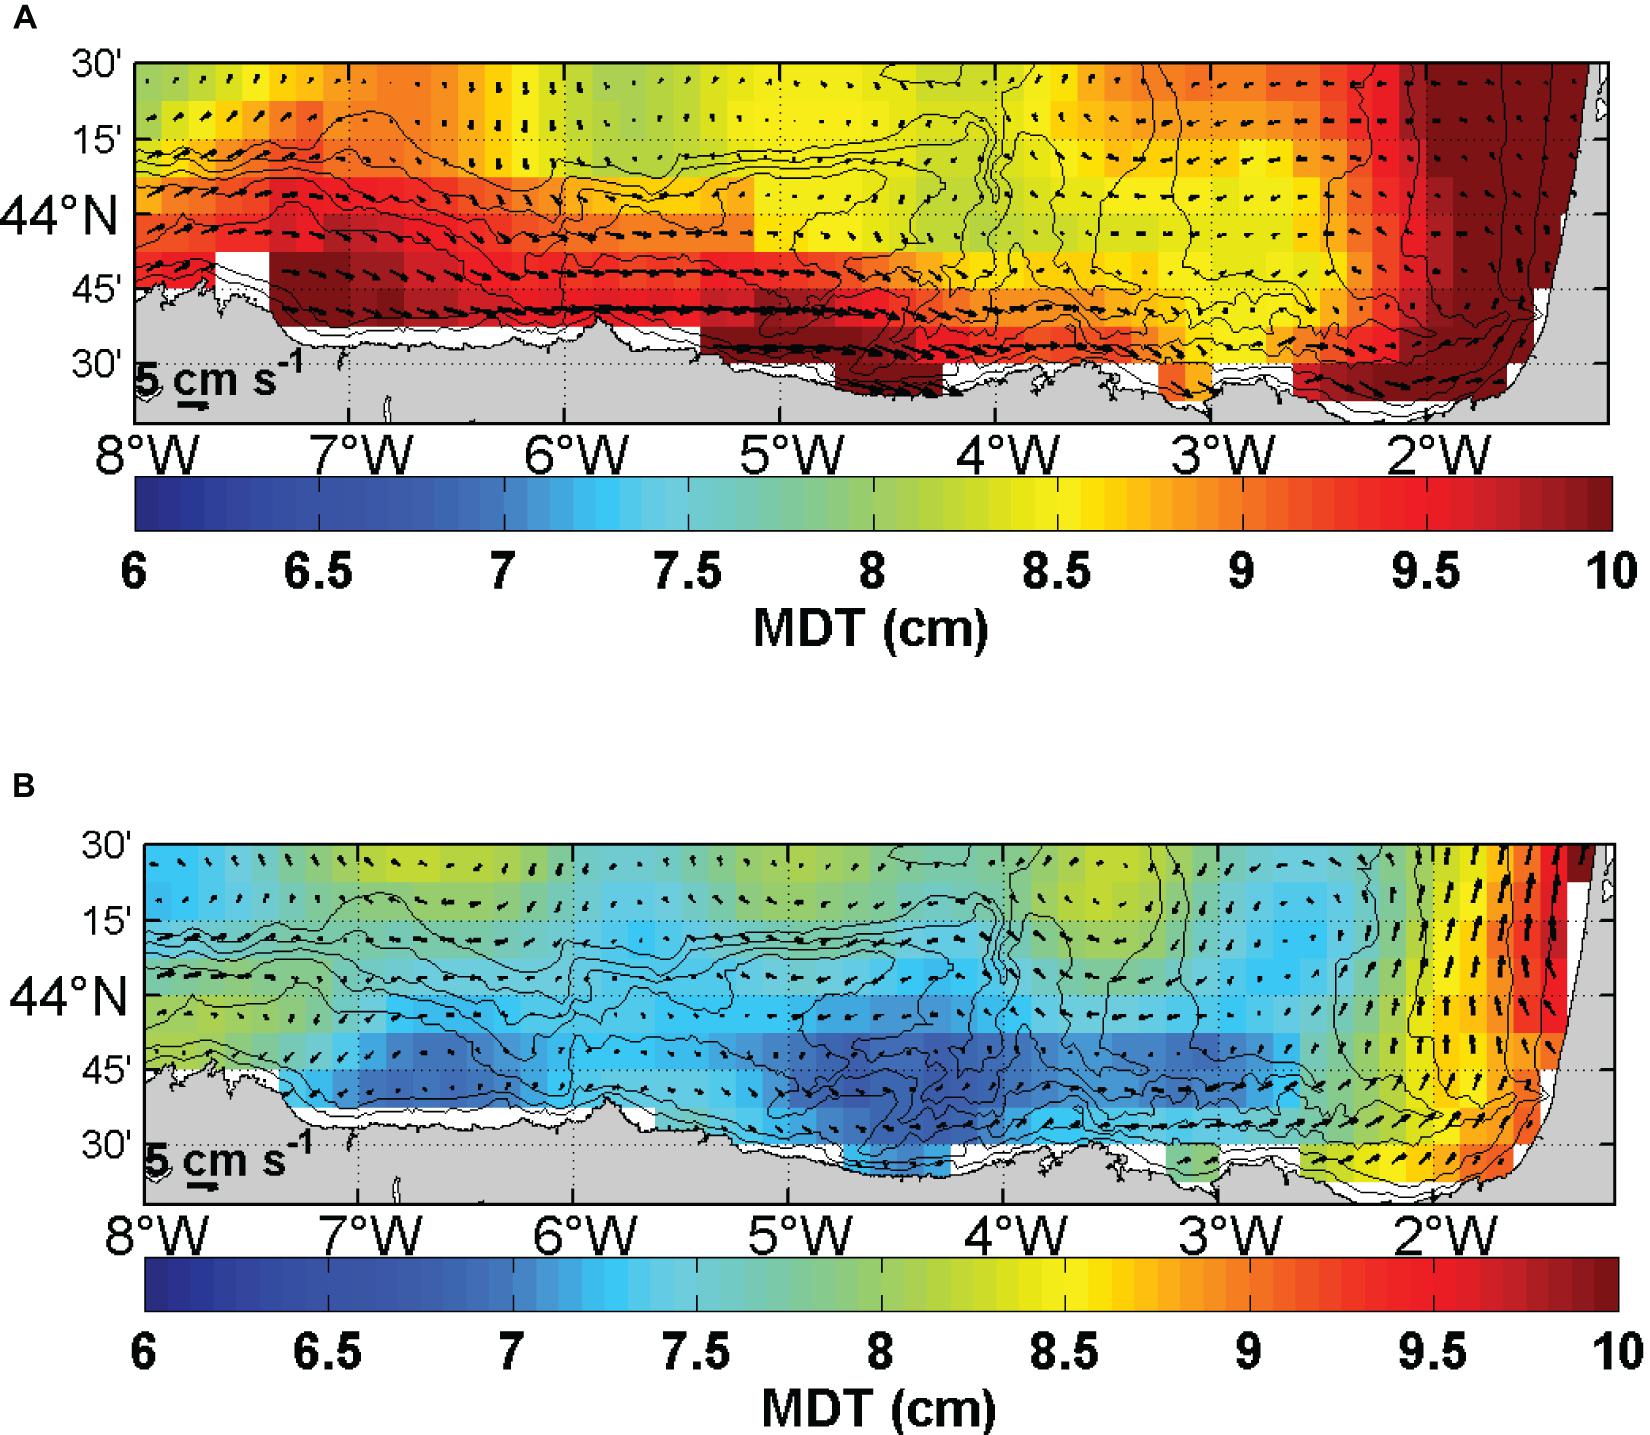
Figure 9. Zoom of the coastal (A) and CNES-CLS18 MDT (cm) and the corresponding geostrophic currents (B).
Coastal Absolute Dynamic Topography
To assess the quality of the coastal MDT, the mean currents derived from the coastal ADT and those estimated from the ADT calculated with the global CNES-CLS18 MDT are compared to the HF radar total currents. Since the HF radar observations for 2018 are not included in the coastal MDT computation, the velocities derived from the ADT are independent of the HF radar currents in 2018.
For the year 2018, daily ADT maps over the Bay of Biscay are computed by adding the coastal MDT to the SLA (both referenced to 1993–2012) from the European DT2018 dataset (Taburet et al., 2019). To get closer to the total currents, the Ekman currents obtained using Rio et al. (2014) are added to the ADT derived geostrophic currents.
As indicated in Table 1, the correlation is higher for u than for v. In every case, the correlations are higher when using the coastal MDT, instead of the CNES-CLS18 MDT. As expected, the correlation is higher when including Ekman current.

Table 1. Correlation coefficients between the components of the currents from the ADT (by using the coastal and the CNES-CLS18 MDTs and with/without including Ekman current) and the mean HF radar considering, for 2018.
In 2018, the mean surface currents measured by the HF radar range between 0.15 and 15.11 cm s–1, being stronger over the slope, where the IPC dominates the dynamics; currents spatial mean is 3.28 cm s–1 (Figure 10A). The mean currents derived from the CNES-CLS18 ADT (Figure 10B) range between 0.10 and 6.93 cm s–1 and have a spatial mean of 3.52 cm s–1. They show larger scale patterns with intense currents in the north/east that are not consistent with HF radar observations. They also show an intensification related to the IPC, but it is not as consistent with the bathymetry as for the HF radar and the coastal ADT (Figure 10C) that ranges from 0.17 to 7.03 cm s–1 (spatial mean = 2.37 cm s–1). This is the case for instance, near the Cantabrian coast around 2.3°W, where the meandering of the IPC is better resolved with the coastal ADT. Along the French coast (around 44.25°N), the north-eastward currents from the coastal ADT are underestimated with respect to the HF radar mean currents. Consequently, the 2018 mean currents based on coastal MDT resolve finer scales than the ones based on CNES-CLS18 MDT and are in good agreement with HF radar. However, there are still some inconsistencies that could be due to errors in the methodology (isolation of the geostrophic currents and MDT computation), and to the input data (uncertainties in the observations). Differences could be also explained by additional signal resolved by the HF radar (not only geostrophy and Ekman currents).
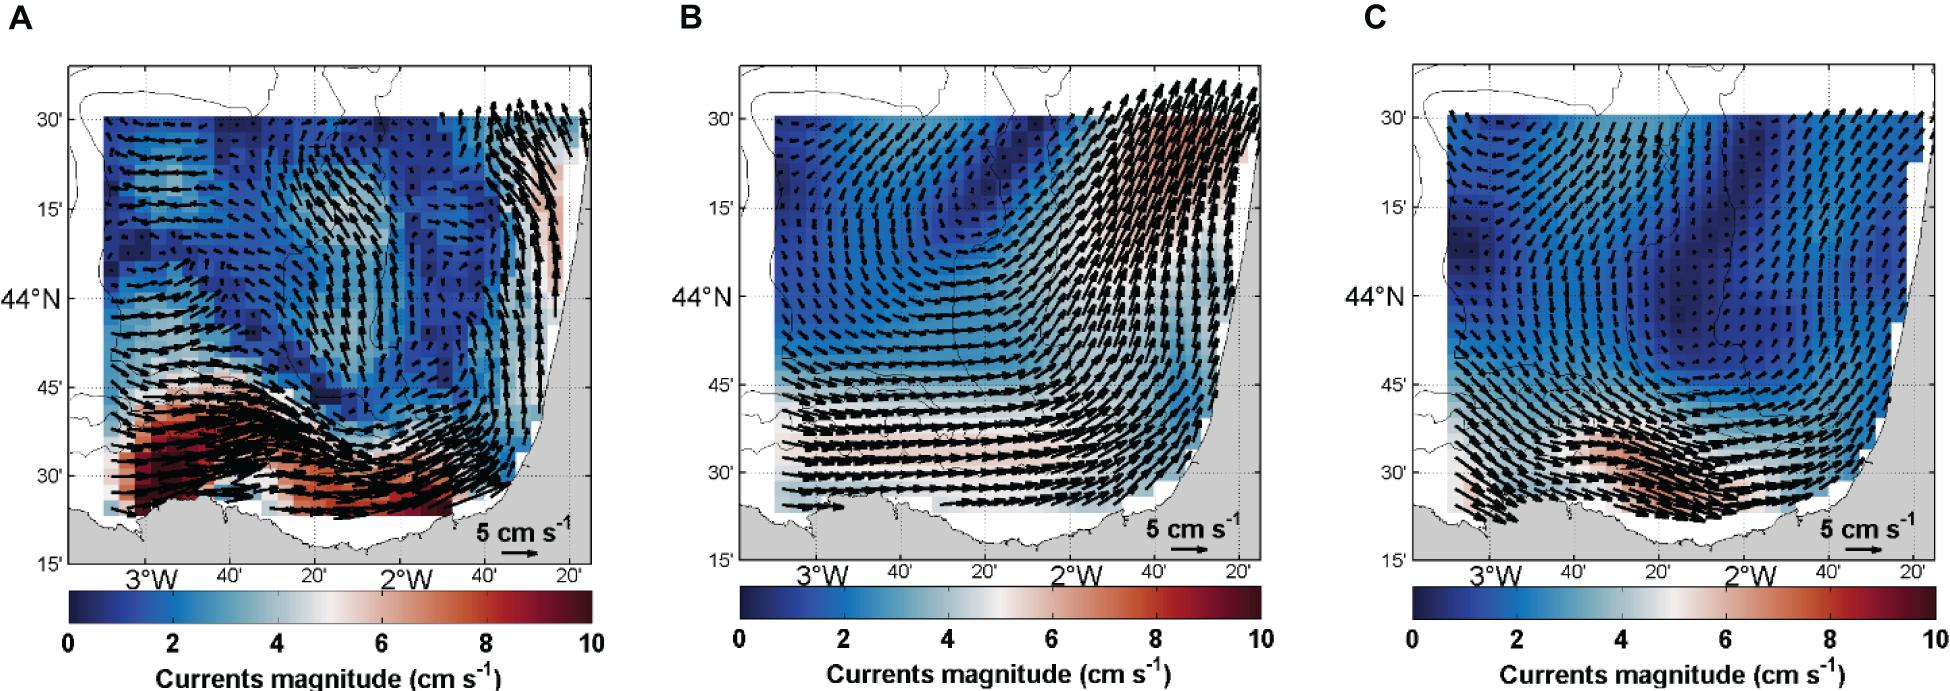
Figure 10. Current fields and magnitude (cm s–1) averaged over 2018 obtained from (A) HF radar total currents, (B) CNES-CLS18 ADT, and (C) coastal ADT.
Concerning its performance to detect oceanographic events, the time variability of the coastal (Figure 11A) and CNES-CLS18 (Figure 11B) ADT is computed along a transect on the slope area, where the IPC is observed during autumn-winter. The transect goes from the coast to 44.4°N (see Figure 1B) and it is centered in 2.44°W; the offshore limit of the continental slope (i.e., 1000 m depth) is shown with a black line. The spatial mean of the transect has been removed for each time step, to remove the seasonal variability and, better observe the spatial gradients along the transect. The time series correspond to 2014 since during November of that year an intensification of the IPC around this area generated an anticyclonic eddy that was monitored for several weeks (Rubio et al., 2018). The signal of the IPC was observed as an increase of the sea level height constrained to the slope. The intensification of the ADT around November 2014 goes from the coast to 44.4°N in CNES-CLS18 (Figure 11A), while in coastal MDT (Figure 11B) it is constrained to the slope in agreement with Rubio et al. (2018). This result indicates that the latter resolves better the spatial extension of this seasonal current, due to the higher spatial resolution and accuracy of the coastal MDT.
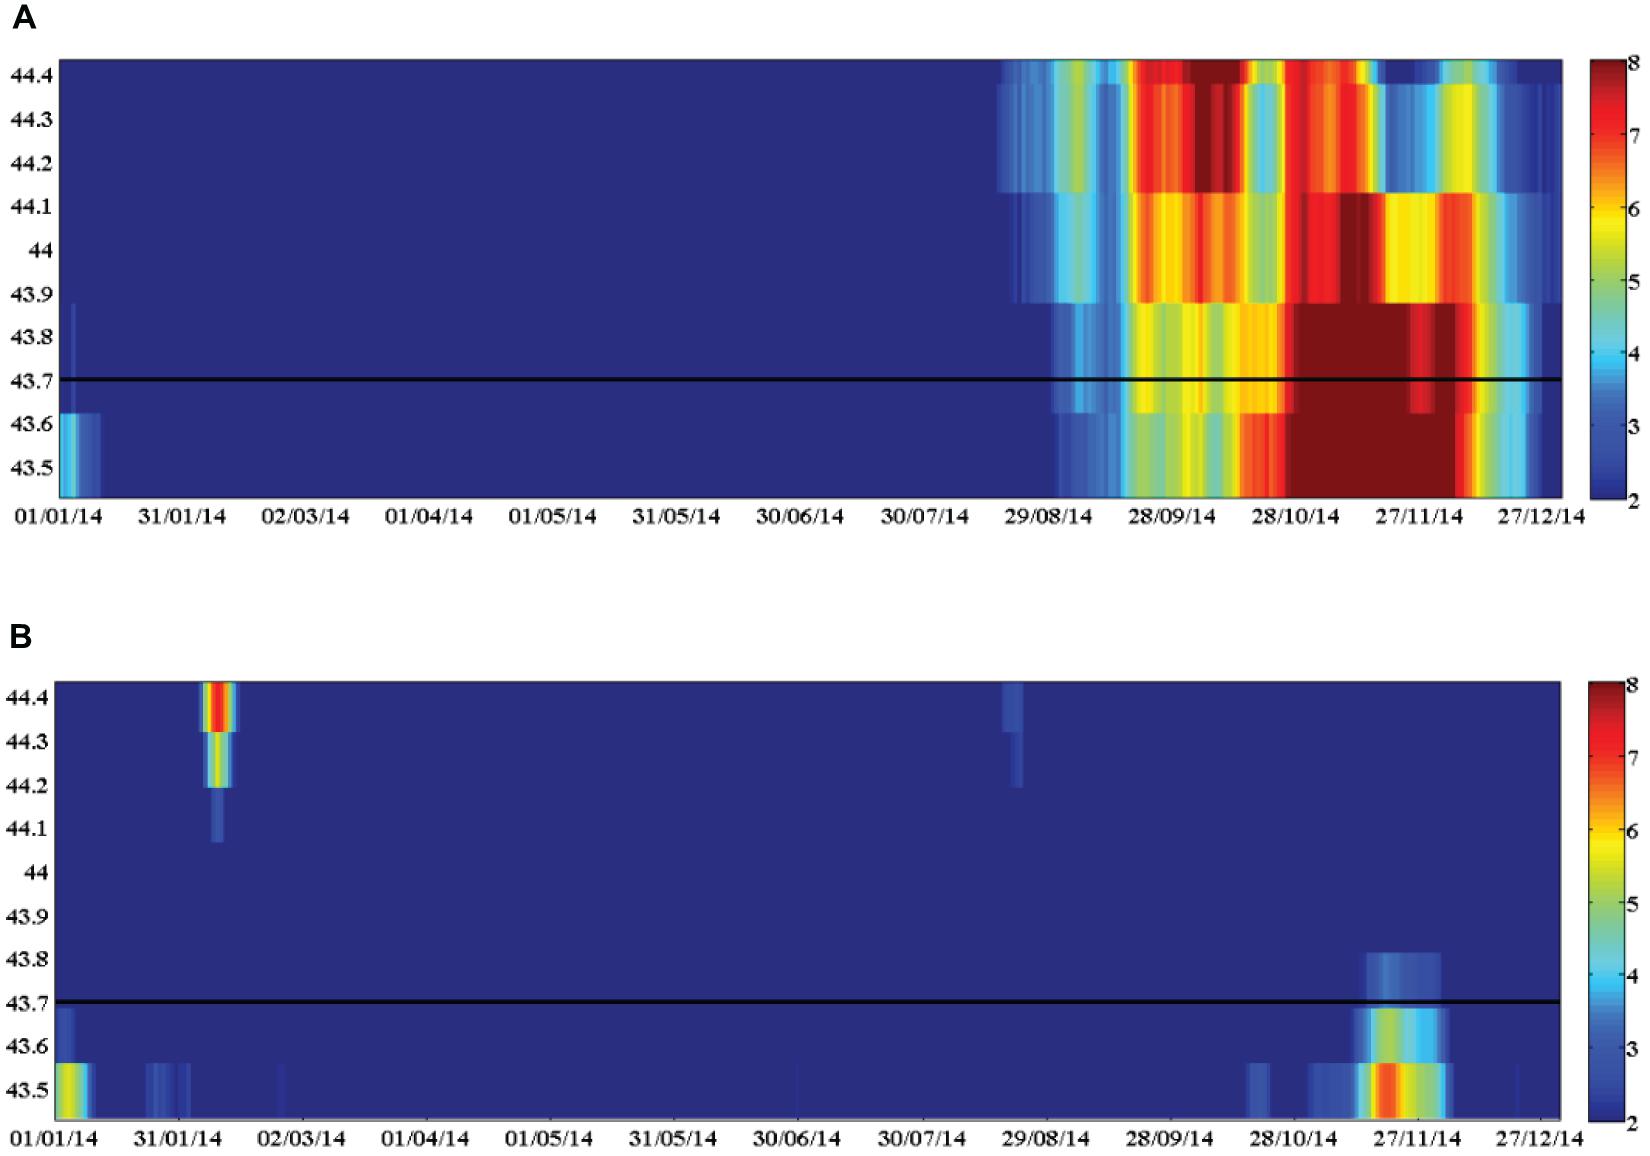
Figure 11. Time evolution of the ADT (cm) along a transect (see the location in Figure 1B) crossing an area of influence of the IPC (2.44 W), during 2014, computed from the CNES-CLS18 MDT (A) and the Coastal MDT (B). Note that the spatial mean along the tracks has been removed from the ADT in each position. The black line is the offshore limit (1000 m) of the continental slope.
Discussion
Different improvements have been applied in the computation of the coastal MDT. First, regarding the first guess in the MDT computation, we have adapted the filtering process to better remove the inconsistency between the MSS and the geoid close to the coast. This was necessary in this area since the mountains along the Cantabrian coast and those from the Pyrenees have a signature in the continental geoid that is leaking over the coastal zone due to the filtering process. Second, an additional source of coastal-based data has been incorporated for the MDT computation: surface ocean currents from coastal HF radars. While T/S profiles are useful to better constrain the surface height values, the current velocities estimated from HF radar or drifters help to sharpen the gradients which are of a few cm. Moreover, the HF radar brings information close to the coast, where observations from drifters and T/S profiles are sparse. These improvements have resulted in a coastal MDT that resolves the current and the cyclonic circulation in the SE-BoB (constrained by the bathymetry), better than the CNES-CLS13 and CNES-CLS18 MDTs. The spatial resolution of this coastal MDT and of the resulting ADT is 1/8°. The daily resolution of the ADT, resulting from the addition of the SLA to the MDT, will be enough to better resolve mesoscale processes (e.g., coastal eddies) in the study area.
Currently, the MDT is provided together with an estimate of its uncertainties due to the optimal interpolation errors, resulting from the spatial distribution of the observations, the a priori error of the observations and from the a priori correlation functions and radii. The MDT error (Figure 8B) is low (<2 mm), where the density of HF radar observations is high and increases toward the French coast (4–5 mm). However, the current MDT error calculation underestimates the effective uncertainties of the MDT. The MDT error estimates must, therefore, be improved in the future, by considering more realistic information of the observations error budget. For instance, the retrieval of a larger database of in situ or remote surface currents measurements will be useful to provide a more accurate estimation of the instrumental errors. Also, estimating and tacking into account errors due to the processing is important. Indeed, residual ageostrophic signal and residual temporal variability should affect the “synthetic observations” and thus the final MDT. Another perspective of this study is to directly use radial data from HF radar instead of OMA fields in the MDT computation. Doing this, we expect to better exploit the HF radar signal, to avoid introducing errors due to OMA gridding and to better resolve the smaller scales.
The number of installations of HF radar systems has increased in the last decade and continues growing, which broadens the possibility of replicating the methodology presented here to improve the accuracy of the MDT in other coastal areas. This will consequently benefit the different altimetric products computed from this reference ocean surface that are relevant in the assimilation into coastal configurations of operational numerical models. However, before envisaging the replicability of this methodology to other coastal areas, several aspects should be considered. First, when removing ageostrophic currents, the specific dynamics of the study area must be considered. As a prerequisite for the inclusion of HF radar data in the MDT computation, we removed the ageostrophic component of the observed surface currents. Initially, we removed the Ekman currents following the approach of Rio et al. (2014), based on an analytical wind-Ekman current model fed with empirical coefficients. Then, we removed the residual ageostrophic component, by using a decomposition of total currents into a divergent and a rotational (non-divergent) component, assuming that only the rotational component corresponds to the geostrophic currents. The effect of removing the ageostrophic currents is quantitatively evaluated by its application to a reference true based on realistic Symphonie model numerical simulations. Our results suggest that, in this study area, the geostrophic contribution to the total surface current is relatively high. The ratio of the amplitude of the geostrophic currents over total surface currents is showing a large seasonality (Figure 12). In winter, it is on average larger than 70% and reaches more than 90% along the slope and at the south-western part of the Landes Plateau. This large contribution is related to the IPC and the recurrence of mesoscale eddies in the area. In summer, the geostrophic contribution drops mainly over the Landes Plateau (∼50–60%) but remains high over the southern shelf (eastward flow) and along the 50 m isobath over the eastern shelf. Depending on the geostrophic/ageostrophic balance in the total currents of the target coastal area and the forcing behind the surface current regime, the methods to extract the geostrophic component should be adapted.
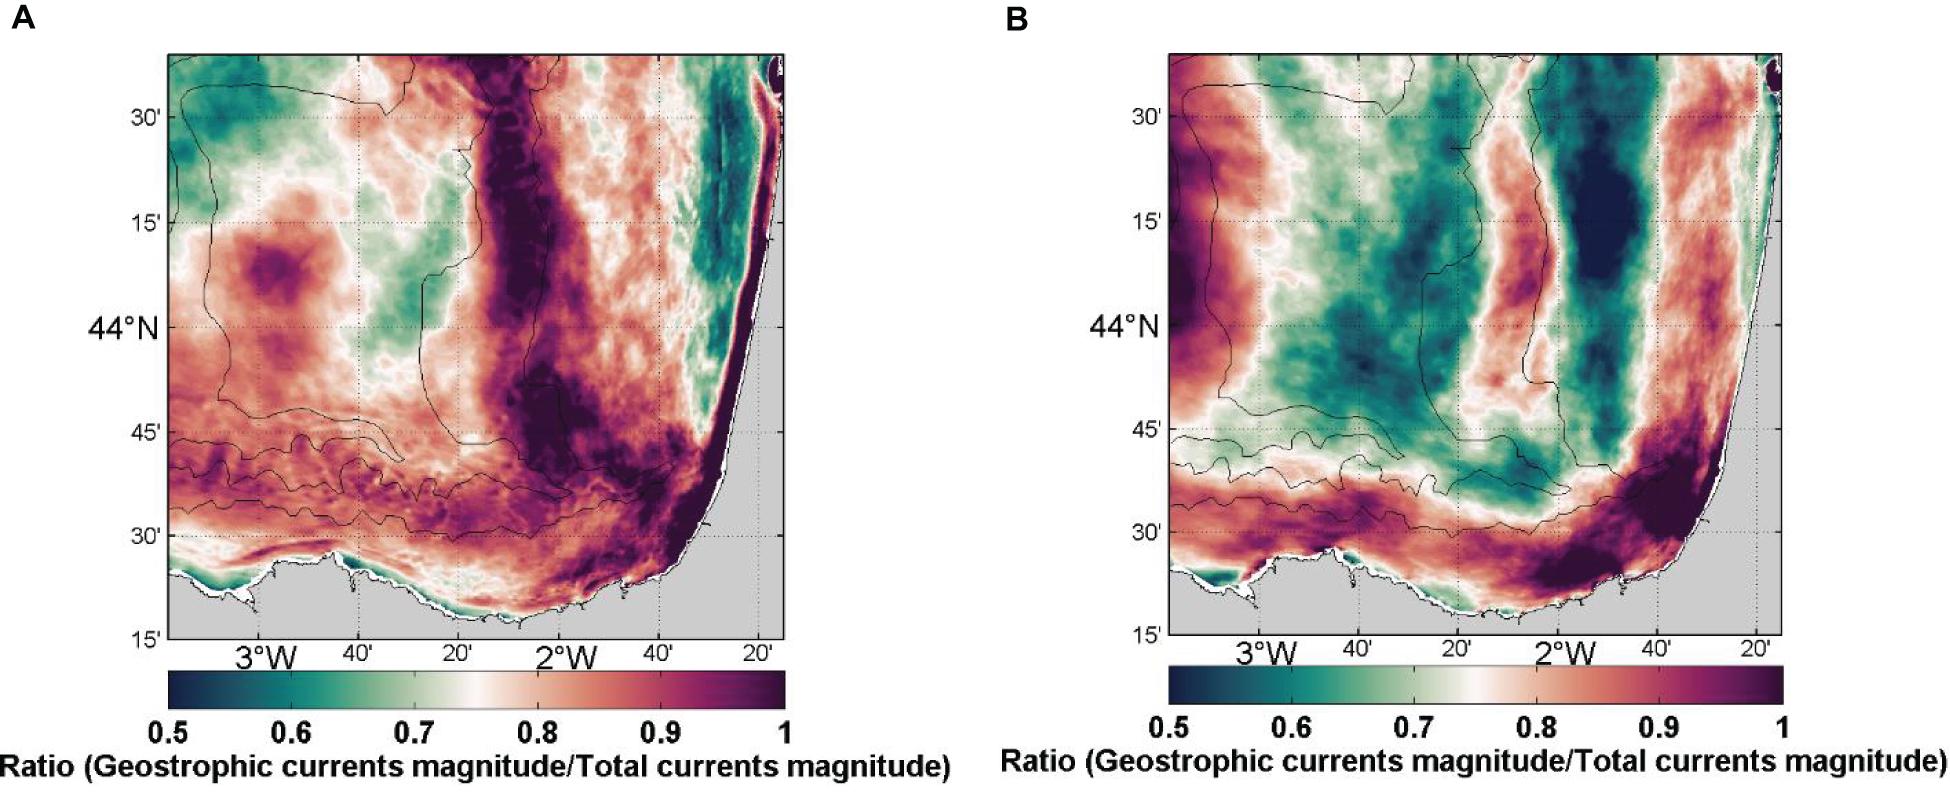
Figure 12. Mean ratio over winter (A) and summer (B) of the geostrophic current magnitude over the total surface current magnitude. Winter is from October 2011 to January 2012 and from October 2012 to December 2012, from the simulation. Summer is from May to September. The 100, 200, and 2000 m isobaths are shown.
Second, the availability of a minimum number of years of almost continuous quality-controlled radar data should be ensured to guarantee the consistency of the computed MDT. In the case of the SE-BoB the minimum temporal length needed for robust computation of the geostrophic mean field was estimated to be around 5 years. However, it is difficult to determine which is the threshold for other areas, and the use of a similar analysis to the one performed in this study is recommended. Besides the temporal coverage, it is also important to consider the spatial coverage of the HF radar data, which depends mainly on the operating frequency. We consider that only the HF radar systems operating at frequencies under 24 MHz (with a theoretical maximum range ≥ 50 km from the coast) would be adapted to the computation of the MDT. Due to the limited resolution of altimetric data, the inclusion of higher resolution data from frequency systems would not have a strong impact, and even less in terms of geostrophic currents, since closer to the coast the measured dynamics are not expected to have a strong geostrophic component.
The systems embedded in a large network of HF radars offering continuous coverage along the coast, or at least offering a complete picture of the main geostrophic features (taking into account the spatial correlation lengths inferred for instance from satellite observations or model simulations), will be the best suited. In Europe, the use of HF radar systems is growing at a rate of around six new radars installed per year (Rubio et al., 2018), with over 72 HF radars currently deployed2. The number of systems worldwide is much larger (Roarty et al., 2019), and the data are being collected by the Global High-Frequency Radar Network3. However, for most of the systems, historical data are not still processed/stored following standard procedures, which could prevent the use of their information in the computation of an improved MDT at basin or global scales. Current efforts from the European HF radar community and CMEMS In situ Thematic Centre could be very beneficial for this purpose, through ensuring an increasing amount of reprocessed surface currents data sets in the CMEMS catalog.
Finally, improving the MDT at small-scales is a crucial issue for the exploitation of high-resolution altimetric data, such as those provided along-track by Sentinel-3 or the future 2-D SWOT data. For the first months of the SWOT mission (both for the 1-day and 21-day orbits), a challenge will be to validate the products, especially in coastal areas. In this respect, HF radar measurements will bring very valuable synoptic 2D surface information that no other in situ measurements can provide. They may be used to better understand the spatial scales that can be effectively observed with SWOT data. However, such comparisons will require two conditions. The first condition is the possibility to extract geostrophic currents from HF radars; this has been explored in this study and will probably be further investigated in the context of the preparation of SWOT. The second condition is the availability of an accurate MDT to compute ADT from SWOT observations. This will be fulfilled, at least locally, where the MDT calculations made herein can be replicated.
Conclusion
The novelties of the present approach are equation (1) the addition of a new in situ dataset, surface currents from HF coastal radars, as input in the computation of the MDT, and (2) the methodology to remove the ageostrophic currents from this new dataset. We have provided a method to introduce information from HF radar data in the MDT computation, and shown the positive impact to use this coastal-based data source. Besides, we have also assessed the impact of each data source (T/S profiles from Argo floats, drifters, and HF radar) in the MDT computation. It has been found that all the observing systems used herein for improving the first guess of the MDT are needed and complementary. Several considerations are also discussed in the view of the possible application of the methodology to other coastal areas. The growing availability of surface currents HF radar data will enable the improvement of altimetric products in the coastal area, and thus their use for assimilation in operational coastal numerical models.
Data Availability Statement
The raw data supporting the conclusions of this article will be made available by the authors, without undue reservation.
Author Contributions
SM, NA, AR, and AC contributed to the main structure and contents. SM, AR, and NA advised the MDT computation, HF radar processing, and analysis and model simulations, respectively. FT produced the Symphonie simulation and CB the ADT maps. SM, NA, IM-N, CB, and AC produced the figures. All authors contributed to the article and approved the submitted version.
Funding
This study has been supported by the 2nd call of the Service Evolution program of Copernicus Marine Environment Monitoring Service, in the framework of the COMBAT project. The Coastal Ocean Observing System of the SE-BoB is owned by the coastal Directorate of Emergency Attention and Meteorology of the Basque Government and managed in collaboration with AZTI. Altimetry data used in this study were developed, validated, and distributed by Collecte Localisation Satellites (CLS), France as the Sea Level Thematic Assembly Center of CMEMS. Wind-data has been provided by MeteoGalicia (WRF; http://mandeo.meteogalicia.es/thredds/catalogos/WRF_2D/catalog.html). Part of this study has been supported by the JERICO-NEXT and JERICO-S3 projects, funded by the European Union’s Horizon 2020 Research and Innovation Program under grant agreement no. 654410 and 871153. IM-N was supported by a Ph.D. fellowship from the Department of Environment, Regional Planning, Agriculture and Fisheries of the Basque Government. The numerical simulations with the Symphonie model were performed using HPC resources from CALMIP/France (grant 2017 p1119) and GENCI/CINES/France (grants 2018-A0040110098). The contribution of NA is supported by Centre National de la Recherche Scientifique (CNRS).
Conflict of Interest
The authors declare that the research was conducted in the absence of any commercial or financial relationships that could be construed as a potential conflict of interest.
Acknowledgments
Thanks to D. Allain and F. Lyard at LEGOS for the Tidal Toolbox of the SIROCCO suite used to detide Symphonie SSH fields (https://sirocco.obs-mip.fr/other-tools/prepost-processing/comodo-tools/). This paper is contribution n° 1001 from AZTI, Marine Research, Basque Research and Technology Alliance (BRTA).
Footnotes
- ^ https://github.com/rowg/hfrprogs
- ^ http://eurogoos.eu/high-frequency-radar-task-team/
- ^ http://global-hfradar.org/
References
Ballarotta, M., Ubelmann, C., Pujol, M. I., Taburet, G., Fournier, F., Legeais, J. F., et al. (2019). On the resolutions of ocean altimetry maps. Ocean Sci. 15, 1091–1109. doi: 10.5194/os-15-1091-2019
Becker, S., Brockmann, J. M., and Schuh, W. D. (2014). Mean dynamic topography estimates purely based on GOCE gravity field models and altimetry. Geophys. Res.Lett. 41, 2063–2069. doi: 10.1002/2014gl059510
Bingham, R. J., Haines, K., and Hughes, C. W. (2008). Calculating the ocean’s mean dynamic topography from a mean sea surface and a geoid. J. Atmos. Oceanic Technol. 25, 1808–1822. doi: 10.1175/2008JTECHO568
Caballero, A., Ferrer, L., Rubio, A., Charria, G., Taylor, B. H., and Grima, N. (2014). Monitoring of a quasi-stationary eddy in the bay of biscay by means of satellite, in situ and model results. Deep-Sea Res. II Top. Stud. Oceanogr. 106, 23–37. doi: 10.1016/J.DSR2.2013.09.029
Caballero, A., Pascual, A., Dibarboure, G., and Espino, M. (2008). Sea level and eddy kinetic energy variability in the bay of biscay, inferred from satellite altimeter data. J. Mar. Syst. 72, 116–134. doi: 10.1016/j.jmarsys.2007.03.011
Caballero, A., Rubio, A., Ruiz, S., Le Cann, B., Testor, P., Mader, J., et al. (2016). South-eastern bay of biscay eddy-induced anomalies and their effect on chlorophyll distribution. J. Mar. Syst. 162, 57–72. doi: 10.1016/j.jmarsys.2016.04.001
Charria, G., Lazure, P., Le Cann, B., Serpette, A., Reverdin, G., Louazel, S., et al. (2013). Surface layer circulation derived from lagrangian drifters in the bay of biscay. J. Mar. Syst. 10, S60–S76.
Ferrer, L., Liria, P., Bolaños, R., Balseiro, C. F., Carracedo, P., González-Marco, D., et al. (2010). “Reliability of coupled meteorological and wave models to estimate wave energy resource in the Bay of Biscay,” in Proceedings of the 3rd International Conference on Ocean Energy (ICOE), (Spain: ICOE).), 6.
Garcia-Soto, C., Ingre, R. D., and Valdés, L. (2002). Navidad development in the southern bay of biscay: climate change and swoddy structure from remote sensing and in situ measurements. J. Geophys. Res. 107:C8. doi: 10.1029/2001JC001012
Ghantous, M., Ayoub, N., de Mey-Frémaux, P., Vervatis, V., and Marsaleix, P. (2020). Ensemble downscaling of a regional ocean model. Ocean Modelling 145:101511. doi: 10.1016/j.ocemod.2019.101511
Girault, V., and Raviart, P. A. (1986). Finite Element Methods for Navier–Stokes Equations: Theory and Algorithms. Berlin: Springer.
Gurgel, K. W. (1994). Shipborne measurement of surface current fields by HF radar. L’Onde Electr. 74, 54–59.
Herbert, G., Ayoub, N., Marsaleix, P., and Lyard, F. (2011). Signature of the coastal circulation variability in altimetric data in the southern bay of biscay during winter and fall 2004. J. Mar. Syst. 88, 139–158. doi: 10.1016/j.jmarsys.2011.03.004
Hernández-Carrasco, I., Solabarrieta, L., Rubio, A., Esnaola, G., Reyes, E., and Orfila, A. (2018). Impact of HF radar current gap-filling methodologies on the Lagrangian assessment of coastal dynamics. Ocean Sci. 14, 827–847. doi: 10.5194/os-14-827-2018
Kalampokis, A., Uttieri, M., Poulain, P. M., and Zambianchi, E. (2016). Validation of HF radar-derived currents in the gulf of naples with lagrangian data. IEEE Geosci. Remote Sens. Lett. 13, 1452–1456. doi: 10.1109/lgrs.2016.2591258
Kaplan, D. M., and Lekien, F. (2007). Spatial interpolation and filtering of surface current data based on open-boundary modal analysis. J. Geophys. Res. Oceans 112:C12.
Kersalé, M., Marié, L., Le Cann, B., Serpette, A., Lathuilière, C., Le Boyer, A., et al. (2016). Poleward along-shore current pulses on the inner shelf of the bay of biscay. Estuar. Coast. Shelf Sci. 179, 155–171. doi: 10.1016/j.ecss.2015.11.018
Knudsen, P., Bingham, R., Andersen, O., and Rio, M. H. (2011). A global mean dynamic topography and ocean circulation estimation using a preliminary GOCE gravity model. J. Geodesy, 85, 861–879. doi: 10.1007/s00190-011-0485-8
Large, W. G., and Yeager, S. (2004). Diurnal to decadal global forcing for ocean and sea-ice models: the data sets and flux climatologies. (Colorado,U S A: NCAR Technical).
Le Cann, B., and Serpette, A. (2009). Intense warm and saline upper ocean inflow in the southern bay of biscay in autumn-winter 2006-2007. Cont. Shelf. Res. 29, 1014–1025. doi: 10.1016/j.csr.2008.11.015
Lebedev, K. V., Yoshinari, H., Maximenko, N. A., and Hacker, P. W. (2007). YoMaHa’07: Velocity data assessed from trajectories of Argo floats at parking level and at the sea surface. (Honolulu, U S A.: IPRC).
Lipa, B. J., and Barrick, D. E. (1983). Least-squares methods for the extraction of surface currents from CODAR crossed-loop data: application at ARSLOE. IEEE J. Ocean. Eng. 8, 1–28.
Lumpkin, R., Grodsky, A. S., Centurioni, L., Rio, M. H., Carton, J. A., and Lee, D. (2013). Removing spurious low-frequency variability in drifter velocities. J. Atmos. Oceanic Technol. 30, 353–360. doi: 10.1175/jtech-d-12-00139.1
Manso-Narvarte, I., Caballero, A., Rubio, A., Dufau, C., and Birol, F. (2018). Joint analysis of coastal altimetry and high-frequency (HF) radar data: observability of seasonal and mesoscale ocean dynamics in the bay of biscay. Ocean Sci. 14, 1265–1281. doi: 10.5194/os-14-1265-2018
Marsaleix, P., Auclair, F., Floor, J. W., Herrmann, M. J., Estournel, C., Pairaud, I., et al. (2008). Energy conservation issues in sigma-coordinate free-surface ocean models. Ocean Modelling 20, 61–89. doi: 10.1016/j.ocemod.2007.07.005
Mayer-Gürr, T., Pail, R., Gruber, T., Fecher, T., Rexer, M., Schuh, W.-D., et al. (2015). The combined satellite gravity field model GOCO05s. Austria: Institute of Geodesy.
Molcard, A., Poulain, P. M., Forget, P., Griffa, A., Barbin, Y., Gaggelli, J., et al. (2009). Comparison between VHF radar observations and data from drifter clusters in the gulf of la spezia (mediterranean sea). J. Mar. Syst. 78, S79–S89.
Mulet, S., Rio, M. H., and Bruinsma, S. (2012). Accuracy of the preliminary GOCE GEOID models from an oceanographic perspective. Marine Geodesy 35, 314–336. doi: 10.1080/01490419.2012.718230
Mulet, S., Rio, M. H., Etienne, H., Artana, C., Cancet, M., Dibarboure, G., et al. (2020). The new CNES-CLS18 Global Mean Dynamic Topography. Submitted to Ocean Science.
Ohlmann, C., White, P., Washburn, L., Emery, B., Terrill, E., and Otero, M. (2007). Interpretation of coastal HF radar–derived surface currents with high-resolution drifter data. J. Atmos. Ocean. Technol. 24, 666–680. doi: 10.1175/jtech1998.1
Pingree, R. D., and Le Cann, B. (1992). Three anticyclonic slope water oceanic eDDIES (SWODDIES) in the southern bay of biscay in 1990. Deep-Sea Res. 39, 1147–1175. doi: 10.1016/0198-0149(92)90062-x
Pujol, M.-I., Schaeffer, P., Faugère, Y., Raynal, M., Dibarboure, G., and Picot, N. (2018). Gauging the improvement of recent mean sea surface models: a new approach for identifying and quantifying their errors. J. Geophys. Res 123, 5889–5911. doi: 10.1029/2017JC013503
Rio, M. H., Guinehut, S., and Larnicol, G. (2011). New CNES−CLS09 global mean dynamic topography computed from the combination of GRACE data, altimetry, and in situ measurements. J. Geophys. Res 116:C7.
Rio, M. H., and Hernandez, F. (2004). A mean dynamic topography computed over the world ocean from altimetry, in-situ measurements and a geoid model. J. Geophys. Res. 109:C12032. doi: 10.1029/2003JC002226
Rio, M. H., Mulet, S., and Picot, N. (2014). Beyond GOCE for the ocean circulation estimate: synergetic use of altimetry, gravimetry, and in situ data provides new insight into geostrophic and Ekman currents. Geophys. Res.Lett. 41, 8918–8925.508.
Rio, M. H., Poulain, P. M., Pascual, A., Mauri, E., Larnicol, G., and Santoleri, R. (2007). A mean dynamic topography of the mediterranean sea computed from altimetric data, in-situ measurements and a general circulation model. J. Mar. Syst. 65, 484–508. doi: 10.1016/j.jmarsys.2005.02.006
Roarty, H., Cook, T., Hazard, L., George, D., Harlan, J., Cosoli, S., et al. (2019). The global high frequency radar network. Front. Marine Sci. 6:164. doi: 10.3389/fmars.2019.00164
Rubio, A., Caballero, A., Orfila, A., Hernández-Carrasco, I., Ferrer, L., González, M., et al. (2018). Eddy-induced cross-shelf export of high chl-a coastal waters in the SE bay of biscay. Remote sens. Environ. 205, 290–304. doi: 10.1016/j.rse.2017.10.037
Rubio, A., Hernández-Carrasco, I., Orfila, A., González, M., Reyes, E., Corgnati, L., et al. (2020). A lagrangian approach to monitor local particle retention conditions in coastal areas. copernicus marine service ocean state report. J. Oper. Oceanogr. 13:1785097.
Rubio, A., Mader, J., Corgnati, L., Mantovani, C., Griffa, A., Novellino, A., et al. (2017). HF radar activity in European coastal seas: next steps toward a pan-european HF radar network. Front. Marine Sci. 4:8. doi: 10.3389/fmars.2017.00008
Rubio, A., Manso-Narvarte, I., Caballero, A., Corgnati, L., Mantovani, C., Reyes, E., et al. (2019). The seasonal intensification of the slope iberian poleward current. copernicus marine service ocean state report. J. Oper. Oceanogr. 12, 13–18. doi: 10.1080/1755876X.2019.1633075
Rubio, A., Reverdin, G., Fontán, A., González, M., and Mader, J. (2011). Mapping near-inertial variability in the SE bay of biscay from HF radar data and two offshore moored buoys. Geophys. Res. Lett. 38:L19607.
Siegismund, F. (2020). A spectrally consistent globally defined geodetic mean dynamic ocean topography. J. Geophys. Res. Oceans 125:e2019JC016031. doi: 10.1029/2019JC016031
Solabarrieta, L., Frolov, S., Cook, M., Paduan, J., Rubio, A., González, M., et al. (2016). Skill assessment of HF radar–derived products for lagrangian simulations in the bay of biscay. J. Atmos. Oceanic Technol. 33, 2585–2597. doi: 10.1175/JTECH-D-16-0045.1
Solabarrieta, L., Rubio, A., Cárdenas, M., Castanedo, S., Esnaola, G., Méndez, F. J., et al. (2015). Probabilistic relationships between wind and surface water circulation patterns in the SE bay of biscay. Ocean Dyn. 65, 1289–1303. doi: 10.1007/s10236-015-0871-5
Solabarrieta, L., Rubio, A., Castanedo, S., Medina, R., Fontán, A., González, M., et al. (2014). Surface water circulation patterns in the southeastern bay of biscay: new evidences from HF radar data. Cont. Shelf. Res. 74, 60–76. doi: 10.1016/j.csr.2013.11.022
Szekely, T., Gourrion, J., Pouliquen, S., and Reverdin, G. (2019). The CORA 5.2 dataset: global in-situ temperature and salinity measurements dataset. data description and validation. Ocean Sci. Discuss. 2019:RC2. doi: 10.5194/os-2018-144
Taburet, G., Sanchez-Roman, A., Ballarotta, M., Pujol, M.-I., Legeais, J.-F., Fournier, F., et al. (2019). DUACS DT2018: 25 years of reprocessed sea level altimetry products. Ocean Sci 15, 1207–1224. doi: 10.5194/os-15-1207-2019
Toublanc, F., Ayoub, N. K., Lyard, F., Marsaleix, P., and Allain, D. J. (2018). Tidal downscaling from the open ocean to the coast: a new approach applied to the bay of biscay. Ocean Modelling 124, 16–32. doi: 10.1016/j.ocemod.2018.02.001
Wunsch, C., and Stammer, D. (1998). Satellite altimetry, the marine geoid, and the oceanic general circulation. Ann. Rev. Earth Planetary Sci. 26, 219–253. doi: 10.1146/annurev.earth.26.1.219
Xu, W., Miller, P. I., Quartly, G. D., and Pingree, R. D. (2015). Seasonality and interannual variability of the european slope current from 20 years of altimeter data compared with in situ measurements. Remote Sens. Environ. 162, 196–207. doi: 10.1016/j.rse.2015.02.008
Keywords: mean dynamic topography, HF radar, altimetry, geostrophy, Bay of Biscay, Coastal Ocean, modeling, observations
Citation: Caballero A, Mulet S, Ayoub N, Manso-Narvarte I, Davila X, Boone C, Toublanc F and Rubio A (2020) Integration of HF Radar Observations for an Enhanced Coastal Mean Dynamic Topography. Front. Mar. Sci. 7:588713. doi: 10.3389/fmars.2020.588713
Received: 29 July 2020; Accepted: 30 October 2020;
Published: 24 November 2020.
Edited by:
Agustin Sanchez-Arcilla, Universitat Politecnica de Catalunya, SpainCopyright © 2020 Caballero, Mulet, Ayoub, Manso-Narvarte, Davila, Boone, Toublanc and Rubio. This is an open-access article distributed under the terms of the Creative Commons Attribution License (CC BY). The use, distribution or reproduction in other forums is permitted, provided the original author(s) and the copyright owner(s) are credited and that the original publication in this journal is cited, in accordance with accepted academic practice. No use, distribution or reproduction is permitted which does not comply with these terms.
*Correspondence: Ainhoa Caballero, YWNhYmFsbGVyb0BhenRpLmVz
 Ainhoa Caballero
 Sandrine Mulet
 Nadia Ayoub
 Ivan Manso-Narvarte
 Xabier Davila
 Christine Boone2
 Anna Rubio