 Sergio Stefanni1*
 Diana Catarino2,3
 Pedro A. Ribeiro2†
 Mafalda Freitas4,5
 Gui M. Menezes2
 Francis Neat6
 David Stanković7
- 1Stazione Zoologica Anton Dohrn, Naples, Italy
- 2OKEANOS Center, Department of Oceanography and Fisheries, University of the Azores, Horta, Portugal
- 3Department of Natural Sciences, Centre for Coastal Research, University of Agder, Kristiansand, Norway
- 4Department of Life Sciences, University of Madeira, Funchal, Portugal
- 5Direção Regional de Pescas, Regional Government of Madeira, Funchal, Portugal
- 6Global Ocean Institute, World Maritime University, Malmo, Sweden
- 7Marine Biology Station Piran, National Institute of Biology, Piran, Slovenia
According to the most recent taxonomical revision, the deep-sea dogfish genus Deania encompasses four species. Three of them, D. calcea, D. profundorum, and D. hystricosa, occur in the North Atlantic. Whilst D. profundorum can be identified by the presence of a subcaudal keel, the other two species are not easily visually distinguished. Uncertainties over identification raises concerns over stock units and whether management plans are adequate. In this study we compared onboard visual identification of Deania specimens, with morphological inspection of skin denticles under stereo microscope and with independent molecular taxonomical assignment using two molecular markers. Particular emphasis was paid to specimens identified as D. calcea and D. hystricosa in the NE Atlantic where these species potentially occur sympatrically and may be easily confused. In the past the species have been discriminated on the basis of the size of skin denticles (skin roughness), but our study showed that the crown length of skin denticles covaries with size (and sex), irrespective of species, and therefore this is not a reliable morphological character and should not be used to discriminate between the two species. Phylogenetic analyses did not indicate that D. hystricosa to be a distinct lineage from D. calcea. Interestingly, however four individuals (specimens from: UK, Azores Is., Madeira Is. and Seine seamount) formed a well-defined sub-clade nested within the D. calcea clade, possibly a signature of a past vicariance event or a result of coalescent stochasticity.
Introduction
The vulnerability of sharks to commercial fishing pressure has been well-documented (Baum et al., 2003; Myers and Worm, 2003) and it is widely acknowledged that deep-sea sharks (>200 m depth) are some of the most vulnerable species to fishing pressure (Garcia et al., 2008). Deep-sea sharks have slow growth rates, long life span with late maturation, very low fecundity, and long gestation periods (up to 2 years). Hence deep-sea sharks have population doubling times that can be twice as long as their shallower counterparts (Stevens et al., 2000) and populations can take decades to recover from fishing impacts (Garcia et al., 2008; Simpfendorfer and Kyne, 2009). An International Plan of Action for the Conservation and Management of Sharks adopted in 1999 stipulated that shark-fishing countries should produce national programmes for the conservation and management of sharks. However, only a few countries are currently providing detailed information on deep-sea bycatch, with many lumping species together as “deep-sea sharks” when they report their catches (Ebert and Mostarda, 2015). Furthermore, when species names can be traced back from the original datasets, frequent misidentification and/or taxonomic uncertainties make it difficult to estimate the true impact the fishery is having on deep-sea shark species (e.g., Iglésias et al., 2010; Veríssimo et al., 2014).
Despite their ecological importance and the fact that many are red-listed by the International Union for Conservation of Nature (IUCN, 2020), phylogenetic relationships within deep-sea sharks are still poorly understood and taxonomy is still a challenge (e.g., Veríssimo et al., 2014; White et al., 2017). In this study, we focus on the four nominal species of the deep-sea squaloid sharks belonging to the genus Deania (Jordan and Snyder, 1902) from the family Centrophoridae. The genus Deania includes species commonly caught by deep-sea commercial fisheries. The conservation and extinction risk assessed by the IUCN reports that D. calcea is categorized as “least concern,” same for all other Deania spp. with the exception of Deania hystricosa reported as “data deficient” (Nieto et al., 2015; Millar and Dickey-Collas, 2018; IUCN, 2020). Deania spp. are bathydermersal species inhabiting continental slopes and seamounts usually between 200 and 2,000 m depth (Bass et al., 1976; Yano, 1991; Compagno, 2005; Weigmann, 2016) depending on the latitude. In terms of distribution, the long snouted deepwater dogfish Deania calcea (Lowe, 1839) and the arrowhead dogfish Deania profundorum Smith and Radcliffe, 1912 have been described as present worldwide; while the rough longnose dogfish Deania hystricosa Garman, 1906 and the longsnout dogfish Deania quadrispinosa McCulloch, 1915 have patchy records (Froese and Pauly, 2019).
Identification keys are effective to distinguish Deania species from other deep-water sharks, but within the genus it is problematic to discern among the species. Whilst D. profundorum can be identified by the presence of a subcaudal keel on the lower surface of the caudal peduncle (Ebert and Stehmann, 2013), the other species lack this feature are not easily distinguished by visual examination. D. quadrispinosa can be distinguished from either D. calcea or D. hystricosa by comparing the distance from exposed origin of first dorsal–fin spine to first dorsal fin rear tip, and the distance from free rear tip to second dorsal–fin spine (Ebert and Mostarda, 2015). According to the literature, separation between D. calcea and D. hystricosa is based on the skin denticle size (Compagno, 2005; Ebert and Stehmann, 2013). Moderately large lateral trunk denticles (crown length of about 0.5 mm) correspond to D. calcea, while very large denticles (crown length of about 1 mm) correspond to D. hystricosa (e.g., Ebert and Stehmann, 2013). Due to these putative differences, some simplified guides for onboard practical identification indicate D. hystricosa as the species with very rough skin (Ebert and Fowler, 2015) or “harsh to the touch” as reported in the original description by Garman (1906). Measurement of denticle size while onboard is difficult and impractical, and using the level of “skin roughness” is a subjective criterion. Furthermore, the relationship between body size and skin roughness (denticle size and density) has not yet been investigated. Uncertainties on assigning the correct identification while onboard has raised concern for the correct management of local as well as global fisheries (Ebert and Stehmann, 2013).
In this study we compared onboard visual identification of Deania specimens with laboratory inspection of skin denticles under stereo microscope and two molecular markers for an independent taxonomical assignment. Particular emphasis was paid to D. calcea and D. hystricosa in the NE Atlantic and, by performing a detailed examination of skin denticles on representative specimens belonging to these two putative species, we evaluated the diagnostic performance of skin denticle characters for species discrimination.
Materials and Methods
Sample Collection
A total of 271 Deania samples were collected between 2003 and 2010 from various scientific surveys (Figure 1). All specimens were measured, sexed, and identified onboard according to key morphological characters (e.g., Ebert and Stehmann, 2013). Preliminary identification of the specimens was: 76 D. calcea, 42 in doubt between D. calcea and D. hystricosa, 63 D. hystricosa, and 90 D. profundorum. A subset of 117 representative samples was selected for further molecular screening (Table 1, Supplementary Table 1). Samples of white muscle tissue were stored in 95% ethanol and maintained at −20°C until processed for molecular analysis.
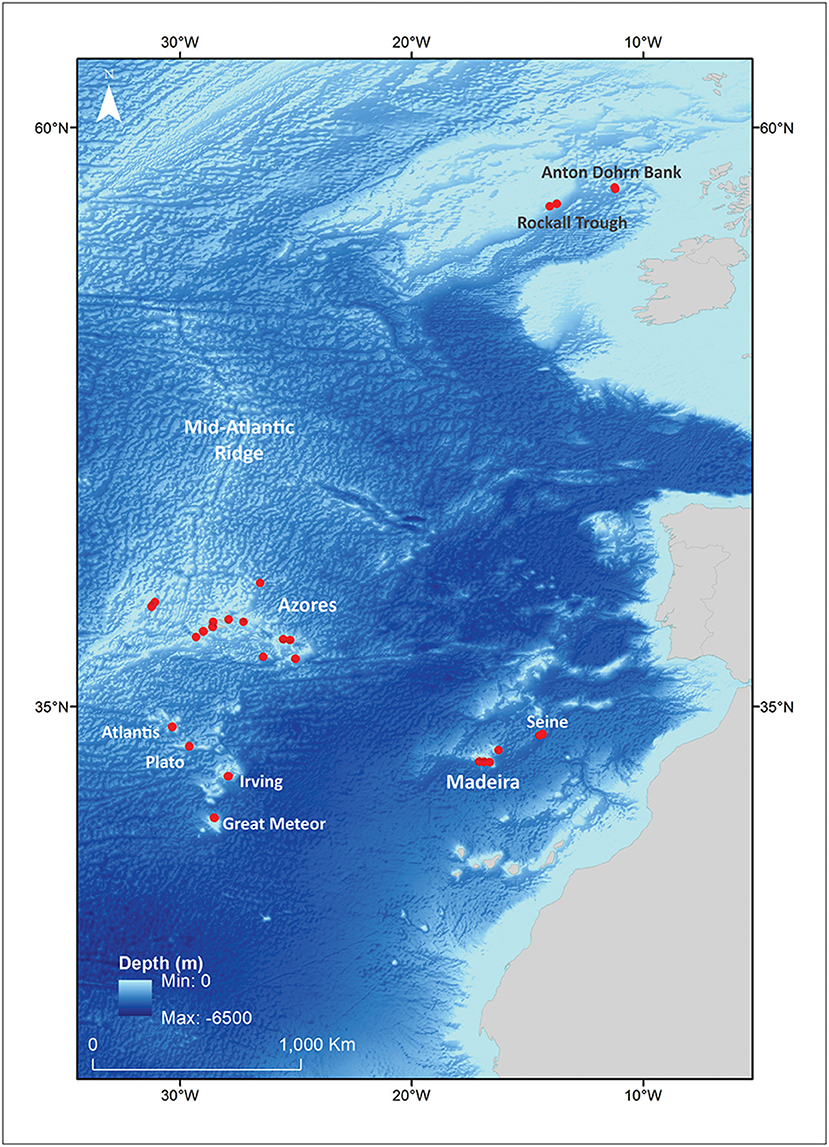
Figure 1. Sampling areas for Deania species in the NE Atlantic (see also Table 1) used in the molecular and denticle analyses.
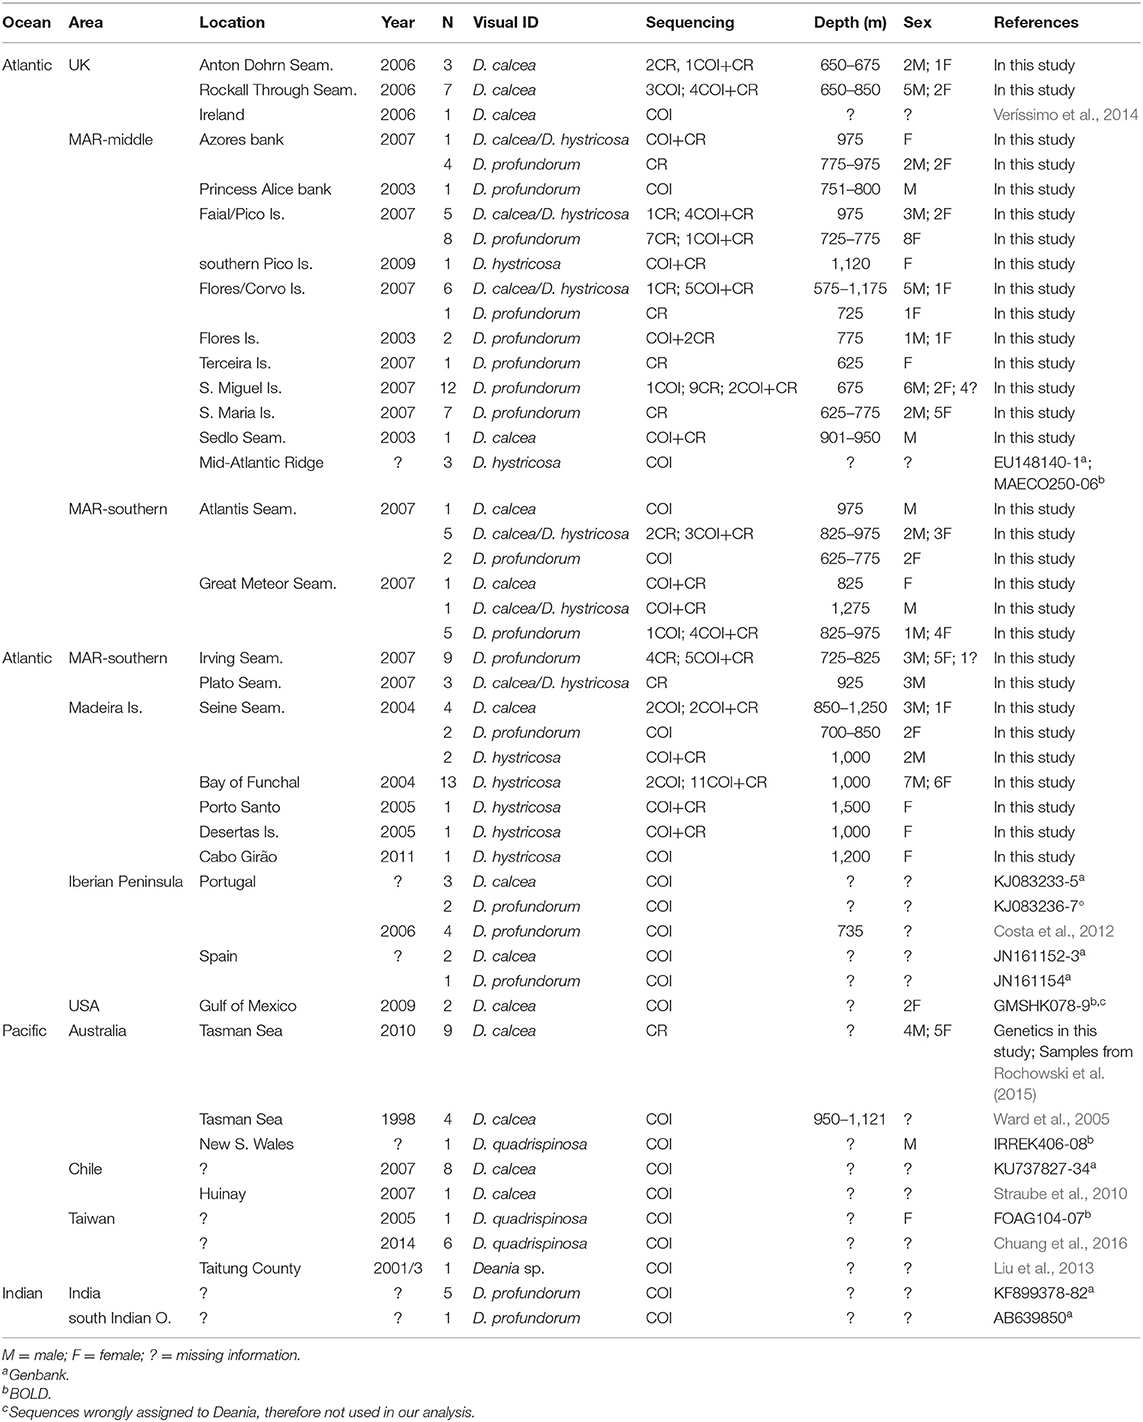
Table 1. List of Deania specimens collected for this study and mtCOI and/or mtCR sequences available in literature or public databases.
Molecular Analysis
Total genomic DNA was extracted from a small portion of muscle tissue using the E.Z.N.A.® Mag-Bind Tissue DNA Isolation Kit (Omega Bio-tek) following the manufacturer's protocol and using the autonomous extractor KingFisher mL (Thermo—Electron Coorporation, USA). A fragment of ~680 bp of the mitochondrial cytochrome c oxidase subunit I (COI) gene was amplified in 102 individuals by polymerase chain reaction (PCR) using FishF1 and FishR1 primers (Ward et al., 2005). A ~1,100 bp fragment encompassing the entire mtDNA control region was amplified by PCR in 108 individuals using primers Pro-L and 12S282, which are complementary to the flanking proline tRNA and 12S rRNA genes, (Keeney et al., 2003), respectively. PCR reaction mixtures were similar for both markers and included ~20 ng of DNA template, 0.2 μM of each primer, 10 μL of 2x PCR Master Mix (Promega) containing the reaction buffer, dNTPs, MgCl2, and Taq polymerase, and ultra-pure water to a final volume of 20 μL. The PCR thermal profile was 2 min at 94°C, 35 cycles of 30 s at 94°C, 1 min at 50°C (for COI) or 57°C (for the control region) and 1.5 min at 72°C, and a final extension step of 7 min at 72°C. A no template control reaction was included in all PCR reactions. PCR products were either purified with ExoSAP-IT (GE Healthcare) or separated by electrophoresis on a 1% agarose gel and excised using the illustra GFX PCR DNA and Gel Band Purification Kit (GE Healthcare). Sequencing of both strands of each PCR product was performed at BMR Genomics commercial facility (www.bmr-genomics.it) based in Padua, Italy, using the same set of primers.
Sequences were checked using Aliview v. 1.24 (Larsson, 2014) and aligned by eye or using MAFFT v. 7 (Katoh and Standley, 2013). Fifty additional Deania COI sequences available in Genbank and BOLD System (Table 1, Supplementary Table 1) were added along with sequences of Centrophorus squamosus (COI: JF493080) and Squalus acanthias (NC_002012 for both CR and COI) to be used as outgroups. Missing or ambiguous end regions were trimmed to the same length so that all COI sequences in the data set had the same final length of 619 bp, while the length of CR sequences varied from 1,008 to 1,013 bp. Summary statistics (number and frequency of haplotypes, number of polymorphic sites, transitions, transversions, and nucleotide composition), haplotype diversity (h) and nucleotide diversity (π) were computed using DnaSP 5.10 (Librado and Rozas, 2009).
We used jmodeltest (Guindon and Gascuel, 2003; Darriba et al., 2012) for the nucleotide substitution model selection under AICc (Akaike, 1974), and MrBayes v. 3.2.6 (Ronquist et al., 2012) and PhyML v 3.0 (Guindon and Gascuel, 2003) for phylogeny reconstruction (Bayesian inference, BI, and Maximum likelihood, ML, respectively). We have reconstructed phylogenies for both markers and for the concatenated data set. We ran PhyML online on the ATCG bioinformatics platform (http://www.atgc-montpellier.fr/) using the proposed model and assessed node supports with 1,000 bootstrap replicates. We have run MrBayes on the CIPRES Science Gateway portal v. 3.3 (Miller et al., 2010) using the BEAGLE library (Ayres et al., 2012) in two independent runs of 10 million generations sampled every 1,000 generations for each of the data sets. After each run we verified adequate sampling (ESS >> 200) and convergence with Tracer (Rambaut et al., 2014) and applied a 25% burn-in.
To resolve the phylogenetic relationships between the main Deania clades we compared the marginal likelihoods of different topological hypothesis. We estimated those using the Bayes factors (BF) and the stepping-stone (SS) approaches as proposed by Xie et al. (2011). For the marginal likelihood calculations we selected a subset of COI sequences composed of two sequences from each clade and sequences belonging to the outgroups. We used pairwise distances estimated with Maximum Composite Likelihood in MEGA X v. 10.1 (Stecher et al., 2020) to select the two most distant sequences from each clade. We tested the topological hypothesis in MrBayes by placing a hard constrain to force the sister relationships between all the combinations of the three Deania clades and compared their marginal likelihoods. For the BF approach we estimated marginal likelihoods using harmonic means of the likelihood values of the MCMC sample by running two independent runs of 10 million generations sampled every 1,000 generations for each of the three tested hypotheses. Finally, we plotted the distribution of pairwise genetic distances using uncorrected p-distances and applied two species delimitation models for testing the presence of a barcoding gap and partitioning the data into candidate species. We applied the sequence-based ABGD (Automatic Barcode Gap Discovery; Puillandre et al., 2012) and the phylogeny-based mPTP (Multi-rate Poisson tree processes; Kapli et al., 2017) models to both mtDNA markers. ABGD analysis was performed using the default setting with both pair-wise uncorrected p-distances and by applying the K2P nucleotide substitution model; while the mPTP analyses were fed with the BI tree performing four independent MCMC chains each lasting 10 million iterations with samples saved every 50,000 generations.
The relationships between the COI and CR haplotypes were also estimated and visualized as haplotype networks constructed using the Integer neighbor-joining (IntNJ) technique approach available in the PopART software v. 1.7 (Leigh and Bryant, 2015).
Dermal Denticle Analysis
A portion of skin was collected from the area just below the first dorsal fin from specimens caught in the Azores and Madeira archipelagos. A total of 149 Deania species skin were sampled from individuals of different sizes and sexes, collected between 575 and 1,500 meters depth. Skins were then inspected under a Leica MZ 16FA stereomicroscope, using a 13.5x zoom, and measurements of the denticles were taken using tpsDig 2.31 software (Rohlf, 2017). D. profundorum were checked for comparison purposes only, as emphasis was addressed on those specimens visually identified as either D. calcea, D. hystricosa or of uncertain taxonomic status (D. calcea/D. hystricosa).
Images were taken from the top and the side to reveal details on shapes and sizes of the denticles, and the crown lengths were used to perform a multiple regression analysis using linear models. The mean of the measurement of three dermal denticles belonging to each specimen was used to investigate any correlation between biological variables (total length, sex, and capture depth) and denticle size and the interaction effect between variables. The best model fit was chosen according to the lowest AIC value, and in case the difference in AIC between two models were <2 units, the model with less estimated parameters was selected for statistical inference (Burnham and Anderson, 2002). Statistical analyses were performed in R v. 3.6.3 (R Core Team, 2020).
Results
Genetic Diversity Among Deania Species
The concatenated sequence alignment was 1,663 bp long (1,629 bp without outgroups): 619 bp (for COI) and 1,012 bp (1,044 bp without outgroups; for CR), respectively. All sequences were deposited in Genbank (Supplementarys Table S2, S3). All samples visually identified as D. profundorum and D. quadrispinosa grouped according to their predicted taxonomy, except for two D. calcea sequences downloaded from BOLD that were wrongly identified as D. quadrispinosa (FOAN841-11.COI-5P, FOAN842-11.COI-5P). On the other hand, the specimens initially identified as D. calcea or D. hystricosa grouped together in a single clade except for four specimens that clustered in a separate well-defined subclade. The large clade was named D. calcea while the subclade (housing haplotypes form the UK, Azores Is., Madeira Is., and Seine seamount) was named D. calcea2 (Figure 2). While for two of the four D. calcea2 specimens both markers were sequenced (shared haplotype for CR “CR_DH-SH01,” and unique haplotypes for COI “COI_DH-MD102” and “COI_DH-MAD115”) for the other two only the CR (haplotypes “CR_DH-UK135” and “CR_DH-AZ102”) was sequenced (Figure 2).
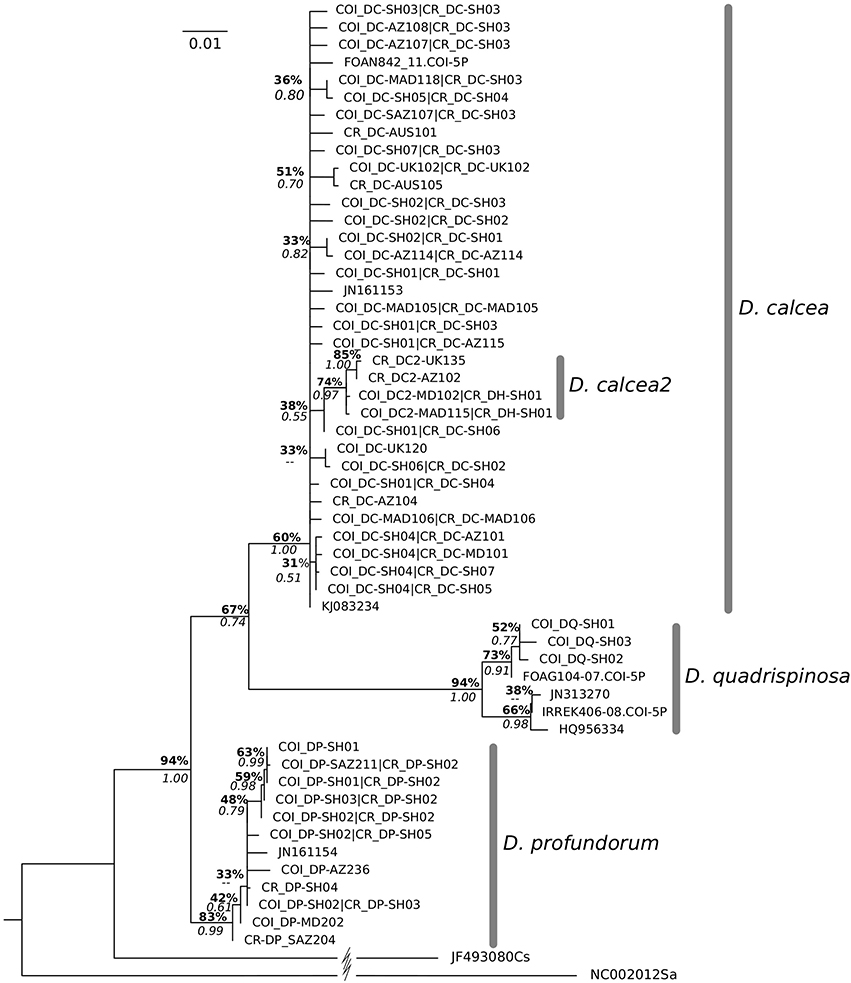
Figure 2. Bayesian phylogenetic tree of Deania species obtained using concatenated sequences (COI and CR). The scale bar indicates the number of substitutions per site and values at branches represent Bayesian posterior probabilities and bootstrap values obtained for the Maximum Likelihood tree. Nodes where Bayesian posterior probability was under 0.50 are not reported.
Overall, the analysis of COI sequences of 144 and CR sequences of 111 Deania individuals, identified 30 COI and 26 CR distinct sequences, respectively. Most of these sequences belonged to the D. calcea clade: 83 COI (19 haplotypes) and 60 CR (20 haplotypes). The D. profundorum clade had a smaller number of sequences: 55 COI (eight haplotypes) and 48 CR (six haplotypes). The D. quadrispinosa clade had the lowest number of sequences: 12 COI (seven haplotypes). The D. calcea clade hosted the highest levels of haplotype diversity in CR (Hd = 0.889), while D. quadrispinosa showed the highest in COI (Hd = 0.872), and D. profundorum had the lowest values for both mtDNA genes (Hd = 0.654 and 0.671, in CR and COI respectively) (Table 2). D. quadrispinosa hosted by far the highest levels of nucleotide diversity in COI (π = 0.0086), while values for D. profundorum were among the lowest for both genes (π = 0.0020 and 0.0025, in CR and COI, respectively) (Table 2).
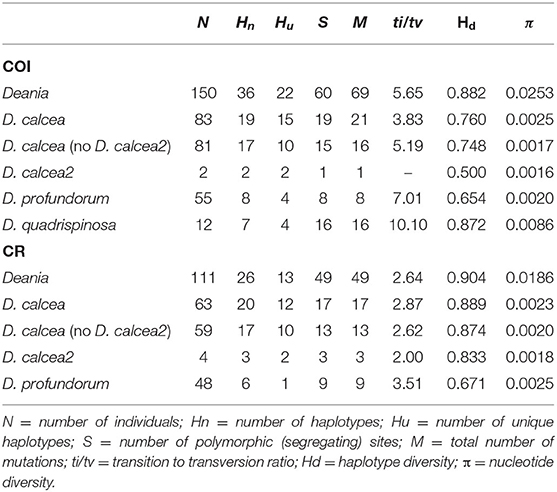
Table 2. Summary statistics for COI and CR.
The best nucleotide substitution model for COI and CR was HKY+G+I (Hasegawa et al., 1985; Yang, 1993). The phylogenetic inference based on the concatenated, as well as separated mitochondrial DNA markers (Supplementary Figures 1, 2), retrieved four distinct clades with D. quadrispinosa being the sister taxon to the clade D. calcea and D. profundorum represented the basal split within Deania (Figure 2). Both tree topologies placed D. calcea2 subclade nested within the D. calcea grouping (Figure 2). Bootstrap support and posterior probability values of the D. calcea2 subclade nested within the D. calcea grouping are not very high (0.74 and 0.97, respectively; Figure 2), but there is consistency in recovering the same topology also from phylogenetic inference using individual genes. Marginal likelihood of this tree topology has been compared with the other two alternatives by placing a hard constrain to force different sister relationships within the Deania clade (Table 3). Both approaches support as the most probable phylogenetic inference, the topology where D. profundorum is basal in the Deania genus and D. calcea2 is nested within D. calcea clade (SS = −1616.43 and BF = −1591.40, respectively) (Table 3).
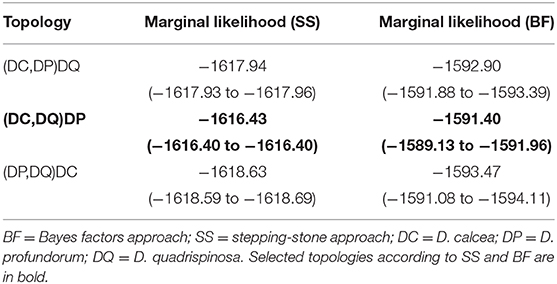
Table 3. Marginal likelihood calculations for the three tree topologies using subset of COI sequences (see text for details) by placing a hard constrain to force different sister relationships within the Deania clade.
The ABGD analysis does not provide any support for D.calcea2 subclade to be considered as a distinct species, either using K2P or uncorrected p-distances, for COI and CR. Nevertheless, applying the test on the COI matrix of distances calculated with K2P model, ABGD detects recursive partitioning within the D. quadrispinosa clade (Figure 3).
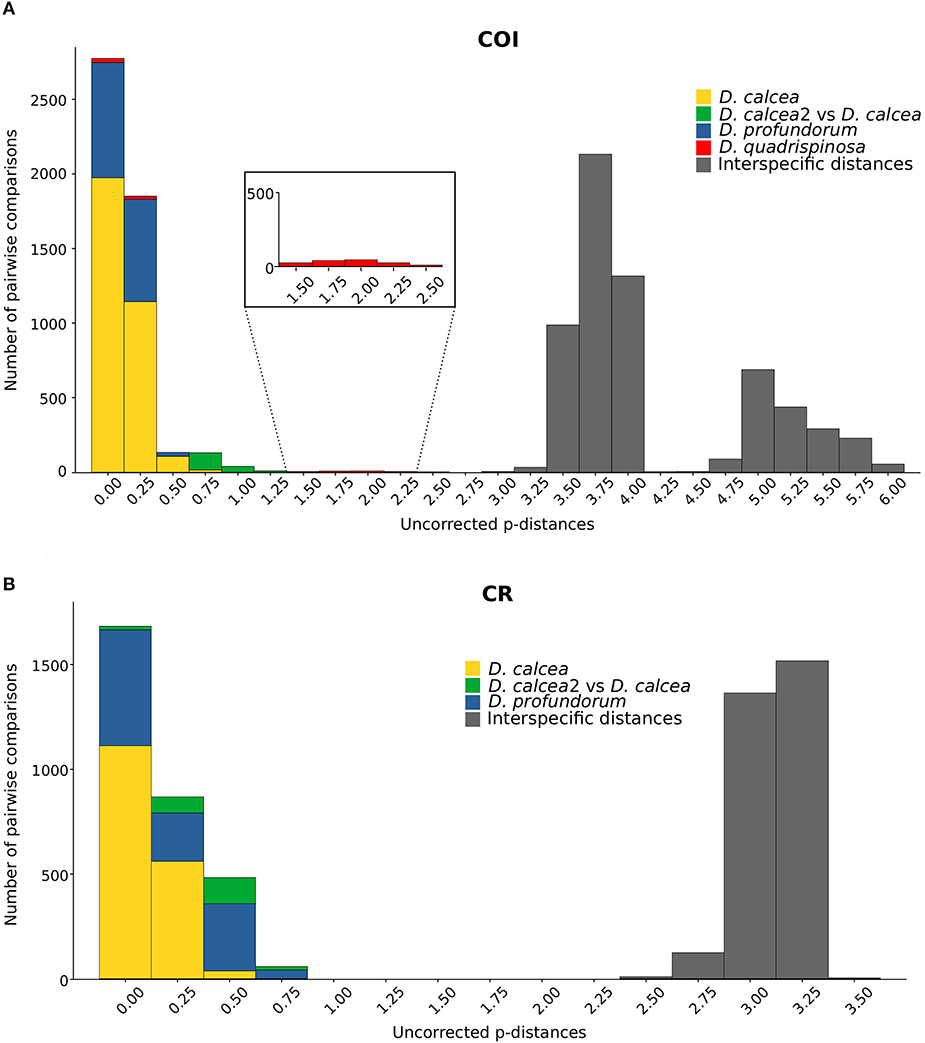
Figure 3. Histograms with genetic uncorrected p-distances for COI (A) and CR (B). Square in (A) is a magnification.
The tree topologies estimated for the mPTP analyses reflected the ABGD output providing no support for D. calcea2 as distinct species for both mtDNA markers, but indicating the two putative species within D. quadrispinosa clade (Supplementary Figure 3).
The intraspecific relationship between D. calcea and D. calcea2 was further explored using a haplotype gene genealogy reconstruction analysis. The IntNJ network positions the D. calcea2 in a peripheral position of D. calcea haplotypes, for both mtDNA markers (Figure 4). There are a minimum of 3 (in CR) or 4 (in COI) nucleotide substitutions from the nearest D. calcea haplotype, one (in CR) or two (in COI) mutations more than among the D. calcea haplotypes (Figure 4A). The nucleotide substitutions that unambiguously distinguish D. calcea from D. calcea2 are: two transitions (C–T at position 721 and G–A at position 738) in CR, and two transversions (T–A at position 49, A–T at position 235) and two transitions (T–C at position 379 and 475) in COI (Figure 4B).
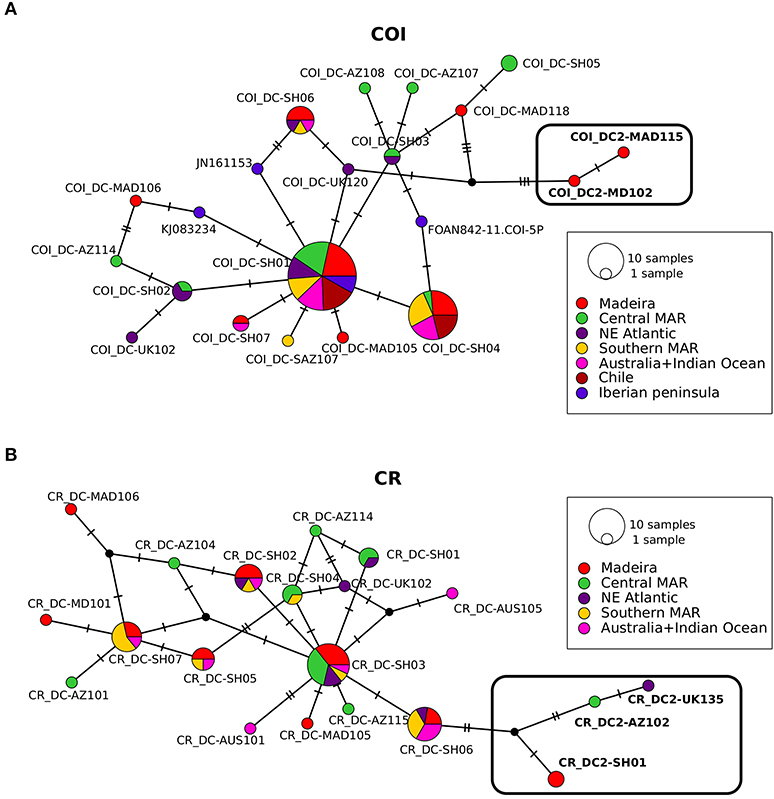
Figure 4. Integer neighbour-joining haplotype networks for COI (A) and CR (B). Circles represent haplotypes and size is proportional to the relative frequencies. Colours are associated to sampling localities and the numbers of substitutions are indicated with bars when more than one. Haplotype coding is given in Supplementary Table S1.
Denticle Shape and Size Among Deania Species of the NE Atlantic
From the 149 D. calcea/D. hystricosa skin samples analyzed, 52 belonged to females measuring between 80 and 111 cm TL (mean = 96.2 cm TL), while 92 belonged to males measuring between 75 and 90 cm TL (mean = 84.3 cm TL). Skin denticle height varied between 1.080–2.102 and 0.753–1.908 mm (for females and males, respectively); while crown length varied between 0.544–1.200 and 0.380–1.013 mm (for females and males, respectively).
Dermal denticles in Deania are pitchfork-shaped (Figure 5), formed by a medial cusp and two lateral cusps, one on each side. From the visual inspection, differences among individuals are noticeable in the shape (e.g., slender or wide) and relative size (elongated or short) of the three cusps. Some denticles also showed extra spines along the cusps or at the anterior edge of the crown (e.g., Figure 5D).
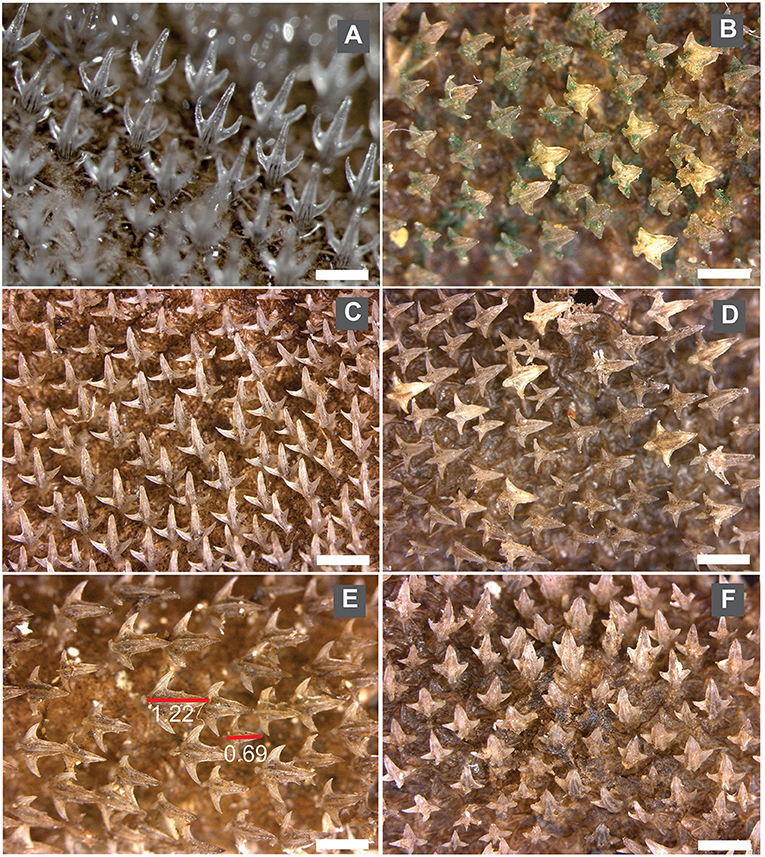
Figure 5. Images of dermal denticles belonging to different Deania species from the NE Atlantic (A) Dermal denticles from D. profundorum; (B) D. calcea2 MAD115 (see Figure 2), a female with TL = 93.5 cm; (C) D. calcea MAD117, a male with TL = 83.7 cm; (D) D. calcea MAD110, a female with TL = 83.6. The white mark in each image corresponds to 1 mm.
Among the 4 specimens whose sequences clustered as D. calcea2, dermal denticles were only available for specimen MAD115 (Figure 5B) and they presented short and wide cusps. In D. calcea specimens, the majority had elongated and slender denticles (Figure 5C), however a few individuals (e.g., MAD111; Figure 5F) had shorter denticles with wide cusps.
The analyses of denticle data indicated that crown length increases proportionally with specimen body size and it is also related to sex. The best supported model was the one where denticle size is explained by both TL and sex (linear model: β = 0.20, SE = 0.18: p < 0.0001, adjusted R2 = 0.48; AIC: −220.86, df = 4), but still, size alone is a good predictor of denticle crown length (p < 0.001). On the other hand, depth did not show any statistical correlation in predicting denticle size, although large females were captured at shallower depths than males (Supplementary Figure 4).
Discussion
According to the literature accompanied by dichotomous keys for the identification of three Deania species for the North Atlantic (e.g., Cadenat and Banche, 1981; Compagno, 1984; Castro, 2011; Ebert and Stehmann, 2013), the character that uniquely identifies D. profundorum is the presence of a subcaudal keel, which is absent in the other species. Our molecular findings based on the two mtDNA genes (COI and CR) supported the visual identification for D. profundorum, but leave uncertainty for the separation between D. calcea and D. hystricosa. Morphological identification relying on the skin roughness assessment was not supported by the genetic analysis, since all sequences of the specimens classified as D. hystricosa or as D. calcea/D. hystricosa clustered together as D. calcea. Such findings are also supported by the recent study by Rodríguez-Cabello et al. (2020) indicating the difficulties of visually inspecting of Deania specimens from northern Spain.
Phylogenetic inferences suggest D. profundorum to be the basal split in Deania and D. quadrispinosa as the sister taxon of the clade D. calcea (Figure 2). Although, four of our individuals showed distinct haplotypes that formed the only well-defined subclade D. calcea2 nested within the D. calcea clade (Figure 2), more focused analyses shows that the supports on the D. calcea2 node are not very high, regardless of the inference approach used. In both ABGD and mPTP analyses the subclade D. calcea2 was never delimited as a distinct species, but always tightly clustered within the D. calcea clade. The only situation in which the two analyses reveal any further clustering on putative species is in D. quadrispinosa. D. quadrispinosa is the clade with the lowest number of COI sequences but hosted by far the highest levels of nucleotide diversity. However, D. quadrispinosa was not actively sampled in our research and all sequences derived from publicly accessible databases (GenBank and BOLD). Therefore, interpretation of this results should be taken with caution as nucleotide diversity may be overestimated.
D. calcea2 uniquely differs genetically from D. calcea sequences for two transitions in CR and two transversions + two transitions in COI. This level of genetic differentiation is comparable to the one reported for the intraspecific variability between Centroscymnus coelolepis, another deep water shark, from the Atlantic and the Mediterranean Sea (Catarino et al., 2015). Here the Strait of Gibraltar may have acted as geographical barrier and the authors invoked cryptic speciation by genetic drift (Catarino et al., 2015), but for D. calcea, the distribution of the main clade and the subclade overlaps as they live in sympatry (Weigmann, 2016; Froese and Pauly, 2019). For this reason, we might consider two plausible hypotheses to explain the relationship between these two units: incipient speciation or introgression. Nevertheless, the fact that D.calcea2 sub-clade is not supported by morphology nor phylogeography, coalescent stochasticity could also be accounted for the formation of a separate sub-clade as coalescence is a random process (Knowles and Maddison, 2002; Hudson and Turelli, 2003).
No inference can be made on the basis of the molecular makers used in this study and validations of the most plausible hypothesis, either biological or merely a result of stochastic forces, can only be made exploring genomic data. Only fine resolution analysis of nuclear markers might provide further insights on the speciation processes associated to these two species. A recent comparative study applying ddRAD sequencing to identify inter-gene pool SNPs in Deania calcea from the Atlantic and the Pacific, reported effective panmixia across sampling sites (Keggin, 2017). However, this work does not seem to have included specimens whose COI sequences match with any those reported for D. calcea2 specimens, that for us remains an open question. The lack of hybrids between D. calcea and D. calcea2 would support the hypothesis of incipient speciation, while evidence of hybridization between the two would favor the hypothesis of an historical vicariance event. An example of vicariance or lineage sorting in a large panmictic population of deep-sea sharks is reported for Centroscymnus crepidater (Cunha et al., 2012). This species presents a marked divergence between the two clades (24 mutational steps in CR), and the trigger for the separation was attributed to the oceanic cooling observed during the Miocene (Cunha et al., 2012).
The original description of D. hystricosa, refers to the type specimen that was a female captured off Japan (Garman, 1906). Half a century later, with the revision of several species belonging to the suborder Squaloidea, Bigelow and Schroeder (1957) revised the classification of Deania species based on the shape of their teeth. The D. hystricosa type specimen was lost, but from the detailed original description the authors did not find any support to maintain the status of distinct species for D. hystricosa, considering it a synonym of D. calcea. A few decades later, Compagno (1984) resurrected the species name after revising the description of D. mauli (Cadenat and Banche, 1981) from Madeira Island. This newly reported species presented large denticles compared to those of D. calcea, but very similar to the ones reported for D. hystricosa (Garman, 1906). Therefore, D. mauli was synonymised with D. hystricosa, and no further revision on this genus has been made since, adopting as discriminant character between D. calcea and D. hystricosa the size of their dermal denticles (e.g., Ebert and Stehmann, 2013).
In our study the specimens genetically identified as D. calcea exhibited skin denticles with a large variety of patterns (e.g., slender/wide, extra spines, etc), including similar to the ones reported in Cadenat and Banche (1981) described as D. calcea and D. mauli. We did not find distinctive patterns or size ranges to be attributed to either D. calcea or D. hystricosa. Moreover, the only denticles available for D. calcea2 (MAD115, Figure 5B) were among the smallest compared to those measured in D. calcea specimens of similar total length (Figure 6). According to our findings, denticle crown length increased accordingly to the size of the specimen (Figure 6) strengthening the doubt on the validity of considering D. hystricosa as a nominal species. In this respect, our findings are in agreement with Rodríguez-Cabello et al. (2020) although they scrutinized a limited number of specimens. Our results also suggested that crown length was marginally correlated with sex, contrarily to the findings of Rodríguez-Cabello et al. (2020). Although in D. calcea, as in many squaloid sharks, females attain bigger sizes than males (Irvine et al., 2012; Rochowski et al., 2015), the results shown by the regression lines, mean that for specimens of the same size, in general females had slightly bigger crown lengths compared to males, suggesting some degree of sexual dimorphism in denticle crown length. While positive correlation between denticle and body size in sharks is commonly reported (e.g., in deep-sea sharks: Weigmann et al., 2015), evidence of sexual dimorphism in denticle morphology is rarely described (e.g., in Scyliorhinus canicula: Crooks et al., 2013). Sexual dimorphism associated with larger denticles in females has been suggested to be an adaptation to male biting during mating (Crooks et al., 2013) that in extreme situations may cause severe wounds on the female partner (Ritter and Amin, 2019).
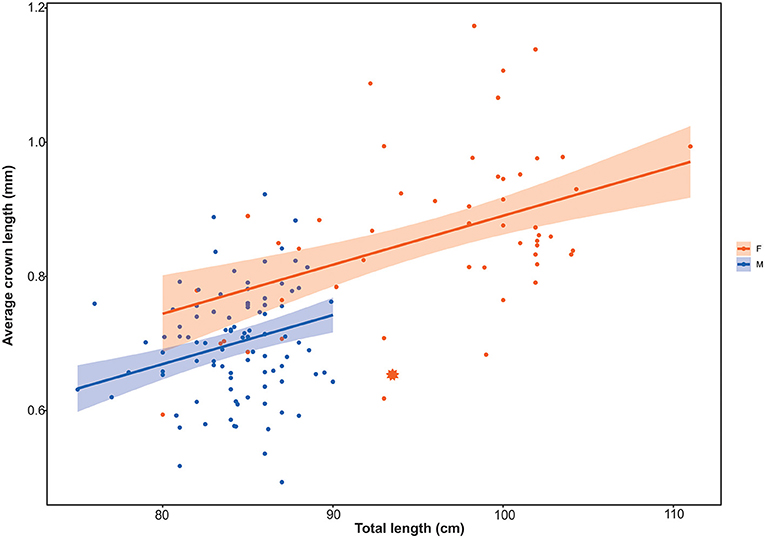
Figure 6. Crown denticle size plotted against specimen total length for D. calcea, showing the regression lines and respective 95% confidence intervals calculated by the model and data colour coded by sex. * = MAD115, specimen belonging to the D. calcea2 subclade.
According to the crown length diagnosis, most of the females were identified as D. hystricosa, while the majority of males were identified as D. calcea. In our dataset (n = 149) we found that those specimens with an average crown length ≥0.85 mm (as a proximity to the definition of “very large—around 1 mm” and therefore attributable to the classification as D. hystricosa), resulted to be mainly females with only few males (58 vs. 4%, respectively). We found that crown length could not be used as a diagnostic character (either 0.5 or 1.0 mm), since it was impossible to draw a boundary to distinguish either one or the other species. Moreover, denticle size varies within individuals according to region of the body (Rodríguez-Cabello et al., 2020), leading to the conclusion that this is not a good identification character for discriminating between D. calcea and D. hystricosa. Although shape and size of dermal denticles are useful to distinguish between families or genera (e.g., Centrophorus vs. Deania), there are cases in which dermal denticles go through marked ontogenic changes from juveniles to adults that could resemble denticles belonging to distinct taxa (e.g., White et al., 2013; Veríssimo et al., 2014; Centrophorus spp.).
Targeted fishing of deep-water sharks is prohibited in European waters, although by-catch is still allowed in certain circumstances and limits (quota; Reg. UE 2018/2025) and is likely to be a threat for this long lived species. Biological and catch information are fundamental to assess species vulnerability and for a sustainable fisheries management, and at the base of this information is an accurate species identification. A better knowledge of the species diagnostic features and molecular taxonomy, will reduce the level of taxonomic uncertainties and misidentification, improving fisheries management and promoting species conservation. In European waters, the long snouted deepwater dogfish is captured as a by-catch of deep-water fisheries that started to be exploited during the early 1960's (Gordon, 2001), when the traditional fisheries on the continental shelf declined (Koslow et al., 2000).
Current conservation assessments and fisheries management consider D. calcea and D. hystricosa as separate species, at least in the NE Atlantic. According to our analyses, past datasets reporting them separately, should now be merged and any time series or stock assessments adjusted accordingly. The landings of D. calcea in Portugal were around 120 tons/year in the last decade (DGPA, 2010). Similarly, the IUCN red list reports D. calcea as a species of least concerned (LC) and D. hystricosa as data deficient (DD) species. The IUCN red list assessment should likewise be revised to reflect the fact that these are the same species in the NE Atlantic. Lumping of species is likely to result in a more favorable assessment of conservation or stock status, but it should be born in mind that this species, like most deep-water sharks, is still highly vulnerable to exploitation. Despite protection in the form of landings prohibition and an EU wide trawling ban at depths >800 m, bycatch by longline and trawler vessels remains a threat.
Data Availability Statement
The datasets presented in this study can be found in online repositories. The names of the repository/repositories and accession number(s) can be found in the article/Supplementary Material.
Ethics Statement
All specimens were caught during scientific surveys authorized by: the local Government of the Azores and the local Government of Madeira following the protocols accepted by the Institute for Marine Research (IMAR) and the University of the Azores, Department of Oceanography and Fisheries (UAz-DOP) in accordance with the Portuguese law and the Scottish Fishery Research annual surveys.
Author Contributions
SS, GM, and FN conceived and designed the study. SS, DC, PR, GM, FN, and MF carried out the sampling. SS, DC, PR, and DS performed all the analysis. SS, DC, and DS drafted the manuscript. All authors contributed to reach the final version, gave final approval for publication, and agree to be held accountable for the work performed therein.
Funding
This research has been funded as part of the DEECON project Unraveling population connectivity for sustainable fisheries in the Deep Sea, approved by the European Science Foundation (ESF) under the EUROCORES programme (Proposal no. 06-EuroDEEP-FP-008 and SFRH-EuroDEEP/0002/2007). PR was funded by the Portuguese Science Foundation (FCT) under the DEECON project with a postdoctoral grant (ref. SFRH/BPD/33682/2009). DS was financially supported by Slovenian Ministry of Education, Science and Sport, the European Regional Development Fund (Operational Programme for the Implementation of the EU Cohesion Policy in the period 2014-2020, 5442-15/2016/18, C3330-17-529025), and by the Slovenian Research Agency (research core funding No. P1-0237 Coastal Marine Research).
Conflict of Interest
The authors declare that the research was conducted in the absence of any commercial or financial relationships that could be construed as a potential conflict of interest.
Acknowledgments
Samples were collected during the Annual Survey by Marine Scotland for the UK government; the OASIS project (FP5, EVK3-CT-2002-00073-OASIS); the PESCPROF research project (co-financed by EU Interreg III B program); DEECON project (Proposal no. 06-EuroDEEP-FP-008 and SFRH-EuroDEEP/0002/2007) and Demersais annual survey (Azores government) thank you to Bastien Rochowski (University of Melbourne) for providing the Australian samples. We would like to thanks to all the research teams and crews onboard of the several surveys for the help with sample collection. Many thanks to Ricardo Medeiros (IMAR/DOP) for providing the map and to Kim Halvorsen (IMR, Norway) for the help with the modeling analyses. The author wish to thanks the two reviewers whose work has greatly improved the manuscript.
Supplementary Material
The Supplementary Material for this article can be found online at: https://www.frontiersin.org/articles/10.3389/fmars.2020.588192/full#supplementary-material
References
Akaike, H. (1974). A new look at the statistical model identification. IEEE Trans. Automatic Control 19, 716–723. doi: 10.1109/TAC.1974.1100705
Ayres, D. L., Darling, A., Zwickl, D. J., Beerli, P., Holder, M. T., Lewis, P. O., et al. (2012). BEAGLE: an application programming interface and high-performance computing library for statistical phylogenetics. Syst. Biol. 61, 170–173. doi: 10.1093/sysbio/syr100
Bass, A. J., D'aubrey, J. D., and Kistnasamy, N. (1976). Sharks of the east coast of Southern Africa. VI. The families Oxynotidae, Squalidae, Dalatiidae, and Echinorhinidae. Investig. Rep. Oceanogr. Res. Inst. 45, 1–103.
Baum, J. K., Myers, R. A., Kehler, D. G., Worm, B., Harley, S. J., and Doherty, P. A. (2003). Collapse and conservation of shark populations in the Northwest Atlantic. Science 299, 389–392. doi: 10.1126/science.1079777
Bigelow, H. B., and Schroeder, W. C. (1957). A study of the sharks of the suborder Squaloidea. Bullet. Museum Comparative Zool. Harvard College 117, 1–150.
Burnham, K. P., and Anderson, D. R. (2002). Model Selection and Multimodel Inference: A Practical Information-Theoretical Approach. 2d ed. New York, NY: Springer-Verlag.
Cadenat, J., and Banche, J. (1981). Requins de Méditerranée et d'Atlantique (plus particulièrement de la côte occidentale d'Afrique). Faune Tropicale OSTROM 21, 1–330.
Catarino, D., Knutsen, H., Veríssimo, A., Olsen, E. M., Jorde, P. E., Menezes, G., et al. (2015). The Pillars of Hercules as a bathymetric barrier to gene-flow promoting isolation in a global deep-sea shark (Centroscymnus coelolepis). Mol. Ecol. 24, 6061–6079. doi: 10.1111/mec.13453
Chuang, P.-S., Hung, T.-C., Chang, H.-A., Huang, C.-K., and Shiao, J.-C. (2016). The species and origin of shark fins in Taiwan's fishing ports, markets, and customs detention: a DNA barcoding analysis. PLoS ONE 11:e0147290. doi: 10.1371/journal.pone.0147290
Compagno, L. J. V. (1984). FAO Species Catalogue. Vol. 4. Sharks of the world. An annotated and illustrated catalogue of shark species known to date. Part 2—Carcharhiniformes. FAO Fish. Synop. Rome: FAO. 125, 251–655.
Compagno, L. J. V. (2005). “Checklist of living Chondrichthyes,” in Reproductive Biology and Phylogeny of Chondrichthyes: Sharks, Rays and Chimaeras, Vol. 3, ed Hamlett, W.C. (Endfield: Science Publishers), 503–548.
Costa, F. O., Landi. M., Martins, R., Costa, M. H., Costa, M. E., Carneiro, M., et al. (2012). A ranking system for reference libraries of DNA barcodes: application to marine fish species from Portugal. PLoS ONE 7:e35858. doi: 10.1371/journal.pone.0035858
Crooks, N., Babey, L., Haddon, W. J., Love, A. C., and Waring, C. P. (2013). Sexual dimorphisms in the dermal denticles of the lesser-spotted catshark, Scyliorhinus canicula (Linnaeus, 1758). PLoS ONE 8:e76887. doi: 10.1371/journal.pone.0076887
Cunha, R. L., Madeira, C., Coscia, I., Mariani, S., Stefanni, S., and Castilho, R. (2012). Ancient mitochondrial DNA divergence in the trans-oceanic deep-sea shark Centroselachus crepidater. PLoS ONE 7:e49196. doi: 10.1371/journal.pone.0049196
Darriba, D., Taboada, G. L., Doallo, R., and Posada, D. (2012). jModelTest 2: more models, new heuristics and parallel computing. Nat. Methods 9:772. doi: 10.1038/nmeth.2109
Ebert, D. A., and Fowler, S. (2015). A Pocket Guide to Sharks of the World. (Princeton, NJ: Princeton University Press), 256.
Ebert, D. A., and Mostarda, E. (2015). Identification guide to the deep-sea cartilaginous fishes of the Southeastern Atlantic Ocean. FishFinder Programme (Rome: FAO), 70.
Ebert, D. A., and Stehmann, M. F. W. (2013). Sharks, Batoids and Chimaeras of the North Atlantic. FAO Species Catalogue for Fishery Purposes, No. 7. (Rome: FAO), 523.
Froese, R., and Pauly, D. (2019). FishBase. World Wide Web Electronic Publication. Available online at: www.fishbase.org. (accessed June 10, 2020).
Garcia, V. B., Lucifora, L. O., and Myers, R. A. (2008). The importance of habitat and life history to extinction risk in sharks, skates, rays and chimaeras. Proc. Royal Soc. B 275, 83–89. doi: 10.1098/rspb.2007.1295
Gordon, J. D. M. (2001). Deep-water fisheries at the Atlantic frontier. Continental Shelf Res. 21, 987–1003. doi: 10.1016/S0278-4343(00)00121-7
Guindon, S., and Gascuel, O. (2003). A simple, fast and accurate method to estimate large phylogenies by maximum-likelihood. Systematic Biol. 52, 696–704. doi: 10.1080/10635150390235520
Hasegawa, M., Kishino, H., and Yano, T. (1985). Dating of the human-ape splitting by a molecular clock of mitochondrial DNA. J. Mol. Evol. 22, 160–174. doi: 10.1007/BF02101694
Hudson, R. R., and Turelli, M. (2003). Stochasticity overrules the “three-times rule:” genetic drift, genetic draft, and coalescent times for nuclear loci vs. mitochondrial data. Evolution 57, 182–190. doi: 10.1111/j.0014-3820.2003.tb00229.x
Iglésias, S. P., Toulhout, L., and Sellos, D. P. (2010). Taxonomic confusion and market mislabelling of threatened skates: important consequences for their conservation status. Aquatic Conservation Marine Freshw. Ecosyst. 20, 319–333. doi: 10.1002/aqc.1083
Irvine, S. B., Daley, R. K., Graham, K. J., and Stevens, J. D. (2012). Biological vulnerability of two exploited sharks of the genus Deania (Centrophoridae). J. Fish. Biol. 80, 1181–1206. doi: 10.1111/j.1095-8649.2012.03262.x
IUCN (2020). The IUCN Red List of Threatened Species. Version 2020-1. Available online at: www.iucnredlist.org (accessed June 10, 2020).
Jordan, D. S., and Snyder, J. O. (1902). Descriptions of two new species of squaloid sharks from Japan. Proc. U.S. Natl Museum 25, 79–81.
Kapli, P., Lutteropp, S., Zhang, J., Kobert, K., Pavlidis, P., Stamatakis, A., et al. (2017). Multi-rate Poisson tree processes for single-locus species delimitation under maximum likelihood and Markov chain Monte Carlo. Bioinformatics 33, 1630–1638. doi: 10.1093/bioinformatics/btx025
Katoh, K., and Standley, D. M. (2013). MAFFT multiple sequence alignment software version 7: improvements in performance and usability. Mol. Biol. Evol. 30, 772–780. doi: 10.1093/molbev/mst010
Keeney, D. B., Heupel, M. R., Hueter, E., and Heist, E,J. (2003). Genetic heterogeneity among blacktip shark, Carcharhinus limbatus, continental nurseries along the U.S. Atlantic and Gulf of Mexico. Marine Biol. 143, 1039–1046. doi: 10.1007/s00227-003-1166-9
Keggin, T. J. (2017). Population genomics of two deep sea sharks: Centroselachus crepidater and Deania calcea. (Master's thesis). University of Durham, Durham, UK. Available online at: http://etheses.dur.ac.uk/12350/ (accessed July 01, 2020).
Knowles, L. L., and Maddison, W. P. (2002). Statistical phylogeography. Mol. Ecol. 10, 2623–2635. doi: 10.1046/j.1365-294X.2002.01637.x
Koslow, J., Boehlert, G. W., Gordon, J. D. M., Haedrich, R. L., Lorance, P., and Parin, N. (2000). Continental slope and deep-sea fisheries: implications for a fragile ecosystem. ICES J. Marine Sci. 57, 548–557. doi: 10.1006/jmsc.2000.0722
Larsson, A. (2014). AliView: a fast and lightweight alignment viewer and editor for large datasets. Bioinformatics 30, 3276–3278. doi: 10.1093/bioinformatics/btu531
Leigh, J., and Bryant, D. (2015). POPART: full-feature software for haplotype network construction. Method. Ecol. Evol. 6, 1110–1116. doi: 10.1111/2041-210X.12410
Librado, P., and Rozas, J. (2009). DnaSP v5: a software for comprehensive analysis of DNA polymorphism data. Bioinformatics 25, 1451–1452. doi: 10.1093/bioinformatics/btp187
Liu, S.-Y. V., Chan, C.-L. C., Lin, O., Hu, C.-S., and Chen, C. A. (2013). DNA barcoding of shark meats identify species composition and CITES-listed species from the markets in Taiwan. PLoS ONE 8:e79373. doi: 10.1371/journal.pone.0079373
Lowe, R. T. (1839). A supplement to a synopsis of the fishes of Madeira. Proc. Zool. Soc. London 7, 76-92.
McCulloch, A. R. (1915). Report on some fishes obtained by the F.I.S. ENDEAVOUR on the coasts of Queensland, New South Wales, Victoria, Tasmania, South and southwestern Australia. Part III. Biol. Results Endeav. 3, 97–170.
Millar, S., and Dickey-Collas, M. (2018). Report on IUCN assessments and fisheries management approaches. ICES CM 2018/ACOM:60. (Copenhagen: ICES), 109.
Miller, M. A., Pfeiffer, W., and Schwartz, T. (2010). “Creating the CIPRES Science Gateway for inference of large phylogenetic trees,” in Proceedings of the Gateway Computing Environments Workshop (GCE). (New Orleans), 1–8. doi: 10.1109/GCE.2010.5676129
Myers, R. A., and Worm, B. (2003). Rapid worldwide depletion of predatory fish communities. Nature 423, 280–283. doi: 10.1038/nature01610
Nieto, A., Ralph, G. M., Comeros-Raynal, M. T., Kemp, J., García Criado, M., Allen, D. J., et al. (2015). European Red List of marine fishes. Luxembourg: Publications Office of the European Union.
Puillandre, N., Lambert, A., Brouillet, S., and Achaz, G. (2012). ABGD, Automatic Barcode Gap Discovery for primary species delimitation. Mol. Ecol. 21, 1864–1877. doi: 10.1111/j.1365-294X.2011.05239.x
R Core Team (2020). R: A language and environment for statistical computing. Vienna: R Foundation for Statistical Computing. Available online at: www.R-project.org/ (accessed February 03, 2020).
Rambaut, A., Suchard, M. A., Xie, D., and Drummond, A. J. (2014). Tracer v1.6. Available online at: http://beast.bio.ed.ac.uk/Tracer (accessed November 21, 2019).
Ritter, E. K., and Amin, R. W. (2019). Mating scars among sharks: evidence of coercive mating? Acta Ethol. 22, 9–16. doi: 10.1007/s10211-018-0301-z
Rochowski, B. E. A., Walker, T. I., and Day, R. W. (2015). Geographical variability in life-history traits of a midslope dogfish: the brier shark Deania calcea. J. Fish. Biol. 87, 728–747. doi: 10.1111/jfb.12756
Rodríguez-Cabello, C., Pérez, M., and Grasa, I. (2020). Taxonomic research on Deania calcea and Deania profundorum (Family: Centrophoridae) in the Cantabrian Sea (Northeast Atlantic) with comments on Deania hystricosa. Regional Stud. Marine Sci. 37:101321. doi: 10.1016/j.rsma.2020.101321
Rohlf, F. J. (2017). tpsDig, digitize landmarks and outlines, version 2.31. New York, NY: Department of Ecology and Evolution, State University of New York at Stony Brook
Ronquist, F., Teslenko, M., van der Mark, P., Ayres, D. L., Darling, A., Höhna, S., et al. (2012). MrBayes 3.2: efficient bayesian phylogenetic inference and model choice across a large model space. Syst. Biol. 61, 539–542. doi: 10.1093/sysbio/sys029
Simpfendorfer, C. A., and Kyne, P. M. (2009). Limited potential to recover from overfishing raises concerns for deep-sea sharks, rays and chimaeras. Environ. Conservation 36, 97–103. doi: 10.1017/S0376892909990191
Smith, H. M., and Radcliffe, L. (1912). Description of a new notidanoid shark from the Philippine Islands, representing a new family. Proc. U.S. Natl. Museum 41, 489–491.
Stecher, G., Tamura, K., and Kumar, S. (2020). Molecular evolutionary genetics analysis (MEGA) for macOS. Mol. Biol. Evol. 37, 1237–1239. doi: 10.1093/molbev/msz312
Stevens, J. D., Bonfil, R., Dulvy, N. K., and Walker, P. A. (2000). The effects of fishing on sharks, rays, and chimaeras (chondrichthyans), and the implications for marine ecosystems. ICES J. Marine Sci. 57, 476–494. doi: 10.1006/jmsc.2000.0724
Straube, N., Iglésias, S. P., Sellos, D. Y., Kriwet, J., and Schliewen, U. K. (2010). Molecular phylogeny and node time estimation of bioluminescent lantern sharks (Elasmobranchii: Etmopteridae). Mol. Phylogenet. Evol. 56, 905–917. doi: 10.1016/j.ympev.2010.04.042
Veríssimo, A., Cotton, C. F., Buch, R. H., Guallart, J., and Burgess, G. H. (2014). Species diversity of the deep-water gulper sharks (Squaliformes: Centrophoridae: Centrophorus) in North Atlantic waters - current status and taxonomic issues. Zool. J. Linnean Soc. 172, 803–830. doi: 10.1111/zoj.12194
Ward, R. D., Zemlak, T. S., Innes, B. H., Last, P. R., and Hebert, P. D. N. (2005). DNA barcoding Australia's fish species. Phil. Trans. Royal. Soc. Lond. B 360, 1847–1857. doi: 10.1098/rstb.2005.1716
Weigmann, S. (2016). Annotated checklist of the living sharks, batoids and chimaeras (Chondrichthyes) of the world, with a focus on biogeographical diversity. J. Fish Biol. 88, 837–1037. doi: 10.1111/jfb.12874
Weigmann, S., Vaz, D. F. B., White, W. T., de Carvalho, M. R., and Thiel, R. (2015). Distribution and comments on the morphology of Centroscymnus owstonii Garman, 1906 (Squaliformes: Somniosidae), with focus on its occurrence in the Indian Ocean. Mar. Biodiv. 46, 641–653. doi: 10.1007/s12526-015-0413-x
White, W. T., Ebert, D. A., and Naylor, G. J. P. (2017). Revision of the genus Centrophorus (Squaliformes: Centrophoridae): Part 2—Description of two new species of Centrophorus and clarification of the status of Centrophorus lusitanicus Barbosa du Bocage and de Brito Capello, 1864. Zootaxa 4344, 86–114. doi: 10.11646/zootaxa.4344.1.3
White, W. T., Ebert, D. A., Naylor, G. J. P., Ho, H.-C., Clerkin, P., Veríssimo, A., et al. (2013). Revision of the genus Centrophorus (Squaliformes: Centrophoridae): part 1 – Redescription of Centrophorus granulosus (Bloch and Schneider), a senior synonym of C. acus Garman and C. niaukang Teng. Zootaxa 3752, 35–72. doi: 10.11646/zootaxa.3752.1.5
Xie, W., Lewis, P. O., Fan, Y., Kuo, L., and Chen, M. H. (2011). Improving marginal likelihood estimation for Bayesian phylogenetic model selection. Syst. Biol. 60, 150–160. doi: 10.1093/sysbio/syq085
Yang, Z. (1993). Maximum likelihood estimation of phylogeny from DNA sequences when substitution rates differ over sites. Mol. Biol. Evol. 10, 1396–1401.
Keywords: deep-sea sharks, fishery by-catch, phylogeny, Atlantic Ocean, deep-sea dogfish, skin denticles
Citation: Stefanni S, Catarino D, Ribeiro PA, Freitas M, Menezes GM, Neat F and Stanković D (2021) Molecular Systematics of the Long-Snouted Deep Water Dogfish (Centrophoridae, Deania) With Implications for Identification, Taxonomy, and Conservation. Front. Mar. Sci. 7:588192. doi: 10.3389/fmars.2020.588192
Received: 28 July 2020; Accepted: 30 November 2020;
Published: 20 January 2021.
Edited by:
Wei-Jen Chen, National Taiwan University, TaiwanReviewed by:
Thierry Bernard Hoareau, University of Pretoria, South AfricaSho Tanaka, Tokai University, Japan
Copyright © 2021 Stefanni, Catarino, Ribeiro, Freitas, Menezes, Neat and Stanković. This is an open-access article distributed under the terms of the Creative Commons Attribution License (CC BY). The use, distribution or reproduction in other forums is permitted, provided the original author(s) and the copyright owner(s) are credited and that the original publication in this journal is cited, in accordance with accepted academic practice. No use, distribution or reproduction is permitted which does not comply with these terms.
*Correspondence: Sergio Stefanni, c2VyZ2lvLnN0ZWZhbm5pQHN6bi5pdA==
†Present address: Pedro A. Ribeiro, Department of Biological Sciences, K.G. Jebsen Center for Deep-Sea Research, University of Bergen, Bergen, Norway