 Alessandro Mannini
 Cecilia Pinto
 Paraskevas Vasilakopoulos
 Henning Winker
- Joint Research Centre (JRC), European Commission, Ispra, Italy
The natural mortality rate (M) of a fish stock is typically highly influential on the outcome of age-structured stock assessment models, but at the same time extremely difficult to estimate. In data-limited stock assessments, M usually relies on a range of empirically or theoretically derived M estimates, which can vary vastly. This article aims at evaluating the impact of this variability in M using seven Mediterranean stocks as case studies of statistical catch-at-age assessments for information-limited fisheries. The two main bodies carrying out stock assessments in the Mediterranean and Black Seas are European Union’s Scientific Technical Economic Committee for Fisheries (STECF) and Food and Agriculture Organization’s General Fisheries Commission for the Mediterranean (GFCM). Current advice in terms of fishing mortality levels is based on a single “best” M assumption which is agreed by stock assessment expert working groups, but uncertainty about M is not taken into consideration. Our results demonstrate that not accounting for the uncertainty surrounding M during the assessment process can lead to strong underestimation or overestimation of fishing mortality, potentially biasing the management process. We recommend carrying out relevant sensitivity analyses to improve stock assessment and fisheries management in data-limited areas such as the Mediterranean basin.
Introduction
The natural mortality rate (M) is a key parameter for modeling age-structured fish population dynamics. M can be defined as the proportion of fish dying from all causes except fishing (e.g., senescence, predation, cannibalism, disease, and pollution) (Froese and Pauly, 2019). Although M is often treated as constant; it is usually age- or size-dependent and may exhibit a high interannual- as well as spatial variability between subpopulations (Kenchington, 2013). Meanwhile, fishing mortality (F), the main concern for fisheries managers, is commonly estimated by deducting M from an estimate of total mortality (Z) (Quinn and Deriso, 1999; Haddon, 2011). As a result, both the perceived stock status and the associated fisheries advice rely greatly on the chosen value of M.
In contrast to several other stock assessment parameters that describe somatic growth, maturation and longevity, M is rarely directly estimable from the available data of exploited stocks, as M is essentially confounded with fishing mortality F and recruitment (Beverton and Holt, 1957; Clark, 1991, 1999; Punt et al., 2014a). Direct estimates of M could be conceptually obtained from age-length keys of resident species from inside- (closed population) and outside a protected area (Götz et al., 2008), from long data series that include size- or age- samples from early phases of light exploitation (Ricker, 1975; Csirke and Caddy, 1983), or from carefully designed mark-recapture experiments (Quinn and Deriso, 1999); however, such information is extremely scarce. Under certain data-rich circumstances, it is possible to estimate M within a statistical assessment model by integrating multiple data series including a time series of annually collected age-length keys over several years and preferably data from a large-scale tagging experiment (Lee et al., 2011; Cadigan, 2015). However, even then it is challenging to separate the effect of M from the confounding effects of recruitment variability and the size- and/or age-dependent population selectivity (Punt et al., 2014b), the latter expressing the combined effects of gear retention and differential availability, e.g., due to spatial structuring (Vasilakopoulos et al., 2020). Additionally, intrinsic parameters such as recapture reporting rates can affect the interpretation of data coming from tagging experiments (Konrad et al., 2016). Given that most datasets provide little or no information on M, assuming fixed values of M is common practice in stock assessments (Mangel et al., 2013).
In data-limited situations, analysts mostly rely on a wide range of empirical M estimators to approximate M (Kenchington, 2013 and references therein). These estimators may be derived from life history traits (e.g., Chen and Watanabe, 1989; Jensen, 1996) or from meta-analysis of datasets of unfished or lightly fished stocks (e.g., Pauly, 1980; Hoenig, 1983; Gislason et al., 2010) and consider various combinations of age, growth parameters, maturity and environmental variables to produce either a fixed value (Pauly, 1980; Hoenig, 1983; Jensen, 1996; Hewitt and Hoenig, 2005) or an age-based vector of M (e.g., Chen and Watanabe, 1989; Lorenzen, 2000). These estimators have been shown to be sensitive to the state of the population and its exploitation level, as well as the taxonomic group to which the species belongs (Kenchington, 2013). Consequently, different estimation methods for M applied to a given stock may produce estimates with high level of variation.
Accounting for uncertainty in M is fundamental not only to estimate the range of variability in the output but also to evaluate the outputs’ robustness against model assumptions (Scott et al., 2016), as already highlighted with regards to deterministic Virtual Population Analysis (VPA) (Pope, 1972) and Extended Survival Analysis (XSA) models (Cheilari and Raetz, 2009). In age-structured models, the link between the population estimates and M occurs on two levels: in the basic population dynamics equations:
and in the Baranov catch equation;
where Na,y is the number at age a in year y, Ca,yis the catch in numbers and Fa,y is the fishing mortality that is formulated here as an implicit function of the fishery selectivity pattern at age that may vary from year to year. It is obvious that when M is misspecified, F will be wrong. This can have major implications if the fisheries are managed through reference points that rely on F (e.g., Fmsy, F0.1). Beverton and Holt (1956) showed that as M increases, Fmsy increases and vice versa. Therefore, if M is fixed in the model, this makes a priori presumptions about key reference points (Mangel et al., 2013).
This article aims at evaluating the impact of using alternative M estimates in seven data-limited Mediterranean stock assessments that were conducted with a statistical catch at age model implemented using the “Assessment for All framework” (a4a Jardim et al., 2014). The two main bodies carrying out stock assessments in the Mediterranean and Black Seas are European Union’s Scientific Technical Economic Committee for Fisheries (STECF) and Food and Agriculture Organization’s General Fisheries Commission for the Mediterranean (GFCM). Fishing activities are managed mainly by controlling effort (usually in terms of fishing days) to achieve sustainable F ≤ F0.1 values (STECF, 2019a), with advice being based on the outputs of a single stock assessment model. Generally a single “best” M assumption is agreed by the relevant stock assessment expert working groups prior to being used in the assessment. However, uncertainty in M is currently not taken into consideration, which makes the issue of misspecifying M particularly acute.
Materials and Methods
Stock Assessment in the Mediterranean Sea and Case Studies
In the Mediterranean context, the main geographical fishery Management Unit corresponds to the FAO Geographical Sub-Area (GSA) (Figure 1; for more details please visit the following website)1.
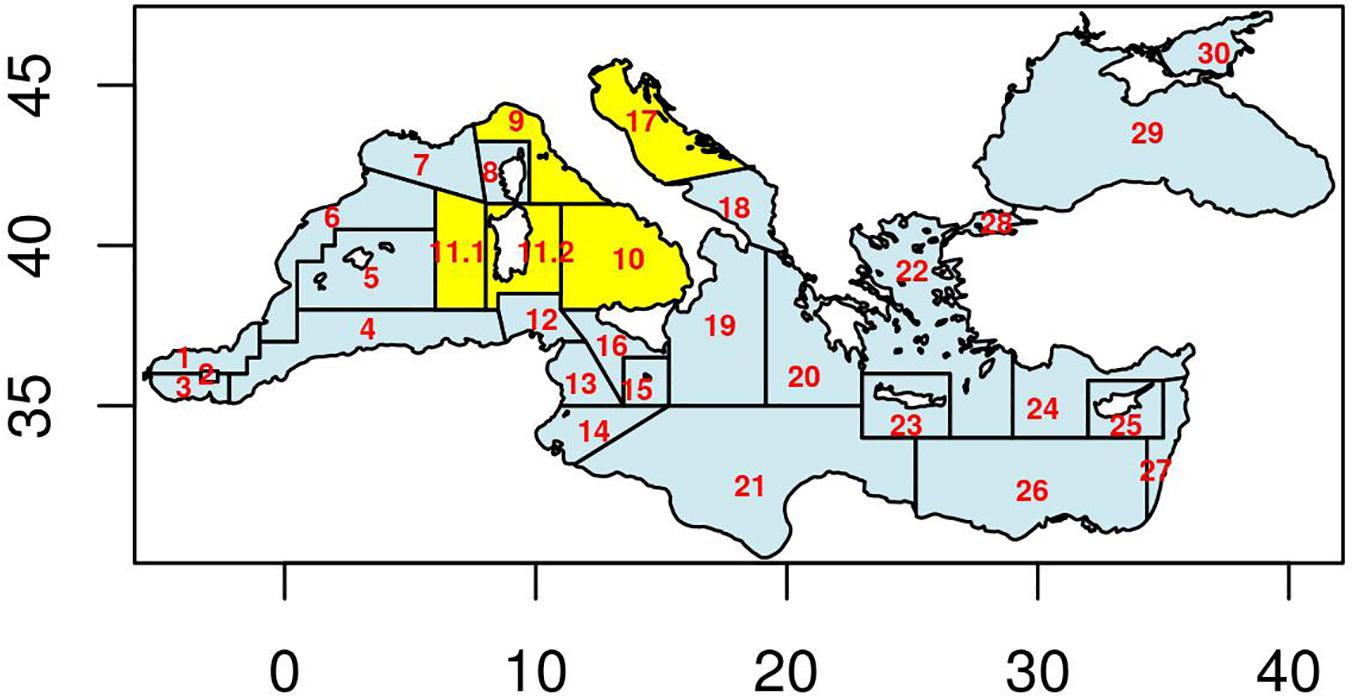
Figure 1 | FAO Geographical Subareas (GSAs) in the Mediterranean and Black Sea. Highlighted in yellow are the areas covered in the analysis of the seven stock assessment case studies. Vertical axis is Latitude and horizontal one is Longitude.
Seven demersal stocks, for which the STECF provided official advice in 2019 (STECF, 2019a, c) were considered as case studies here: blue and red shrimp [ARA – Aristeus antennatus (Risso 1816)] in GSAs 9, 10, and 11, Giant red shrimp [ARS – Aristaeomorpha foliacea (Risso 1827)] in GSAs 9, 10, and 11, Deep-water rose shrimp [DPS – Parapenaues longirostris (Lucas 1846)] in GSAs 9, 10, and 11, Norway lobster [NEP – Nephrops norvegicus (Linnaeus 1758)] in GSA 9, Red mullet (MUT – Mullus barbatus Linnaeus 1758) in GSA 9 and European hake [HKE – Merluccius merluccius (Linnaeus 1758)] in GSAs 9, 10, and 11, all exploited in the Italian waters of the Western Mediterranean Sea, and, common sole [SOL – Solea solea (Linnaeus 1758)] in GSA 17 exploited by the fleets of the Northern Adriatic Sea.
All seven stocks were assessed using a statistical catch-at-age model implemented in a4a, which utilizes the automatic differentiation within the Automatic Differentiation Model Builder (ADMB) (Jardim et al., 2014). The model is implemented in R [R 3.6.3, R Core Team (2020)] making use of the Fishery Library in R (FLR) platform (Kell et al., 2007)2.
The seven stocks chosen as case studies are all characterized by a majority of the total catches coming from demersal otter trawl operations. The available fisheries data sources for the assessments include time series of total annual catches (including discard estimates), corresponding length composition data that are raised to total numbers at length for each fishery. Abundance information in the form of density estimates by length class is obtained from the international bottom trawl survey of the Mediterranean (MEDITS). Catch and densities at length are converted into numbers at age using length slicing techniques when age-length keys were not available. The main biological parameters used as inputs in the stock assessment models are listed in Table 1. According to Brodziak et al. (2011) an estimation of the length at first maturation is needed to compute a natural mortality at age (Ma) vector (see Table 2). For all the stocks a mean value of the female length at first maturation reported by Follesa and Carbonara (2019) all the stocks was chosen.
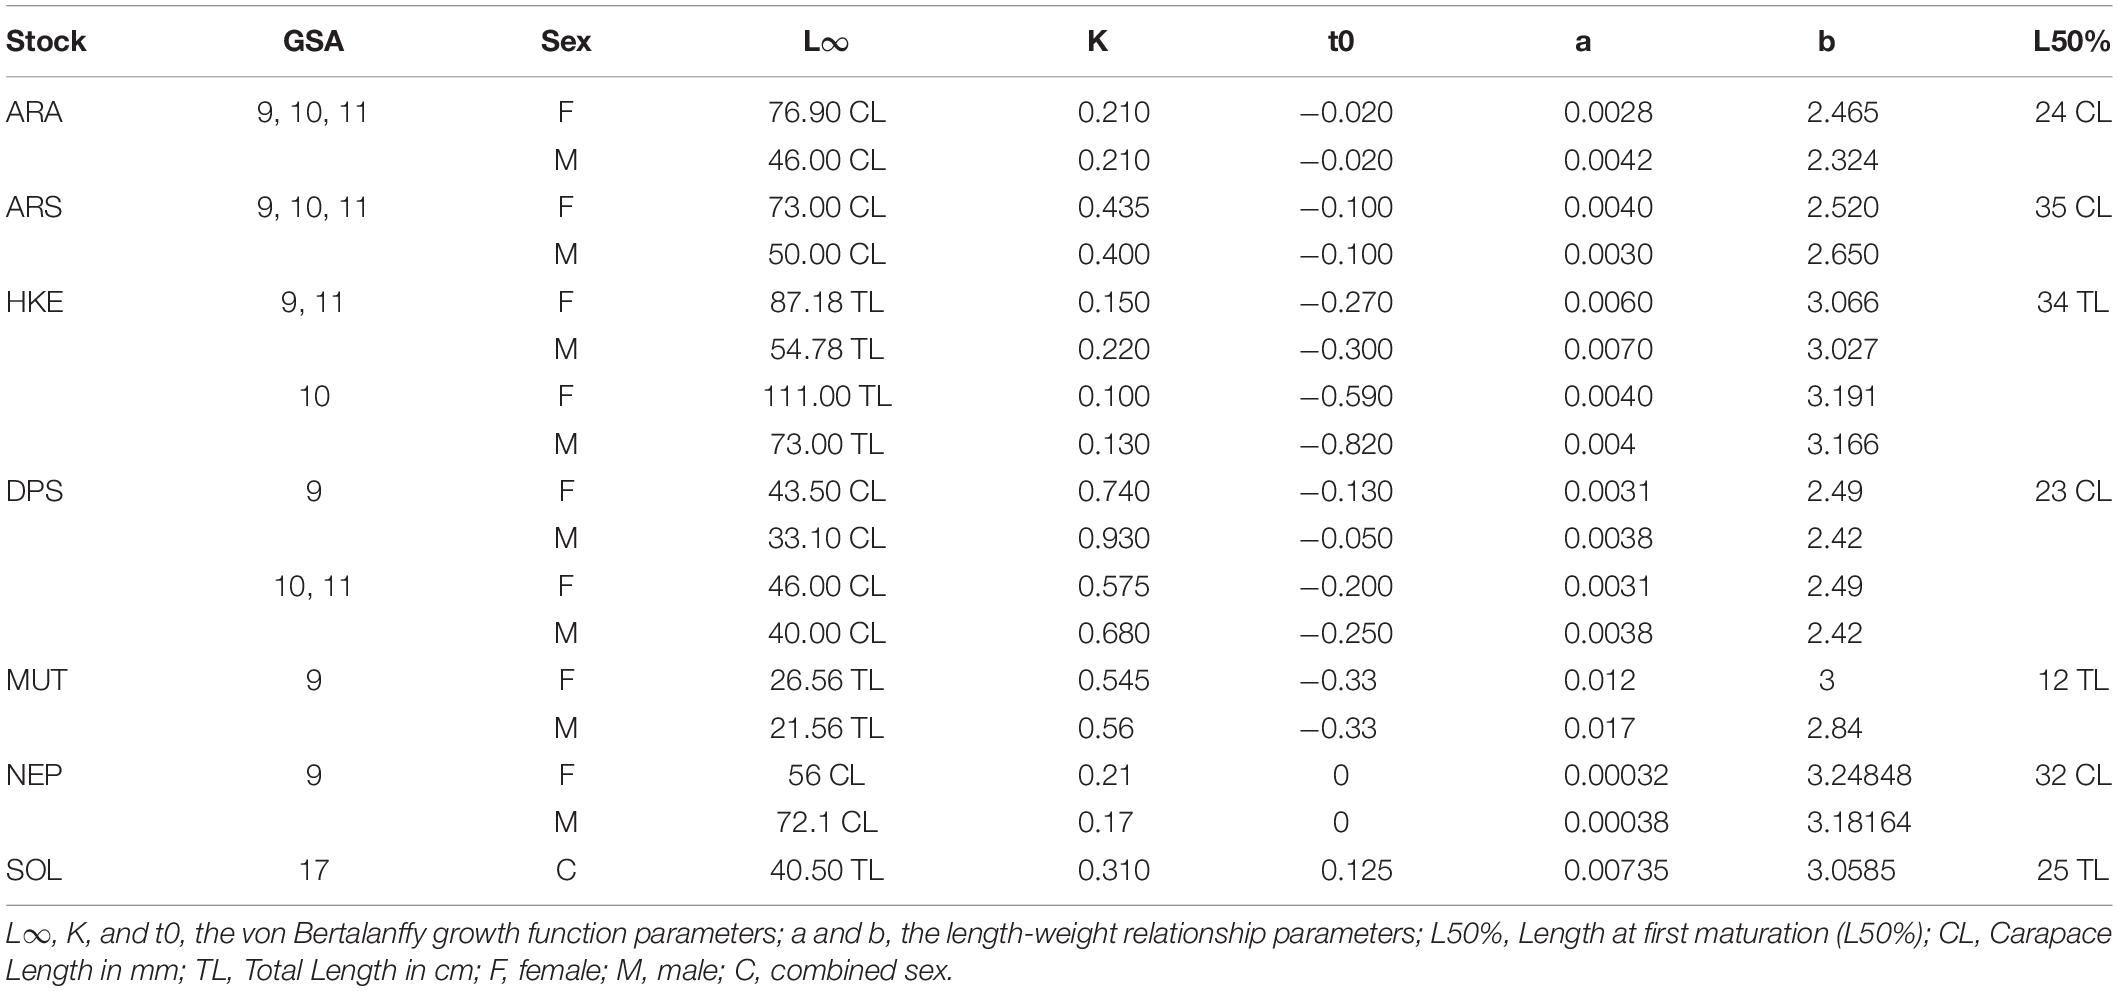
Table 1 | Main biological parameters for the 7 stocks Blue and red shrimp (ARA), Giant red shrimp (ARS), Deep-water rose shrimp (DPS) and European hake (HKE) in the FAO GSAs 9,10 and 11, Red mullet (MUT) and Norway lobster (NEP) in FAO GSA 9 and Common sole (SOL) in FAO GSA 17.
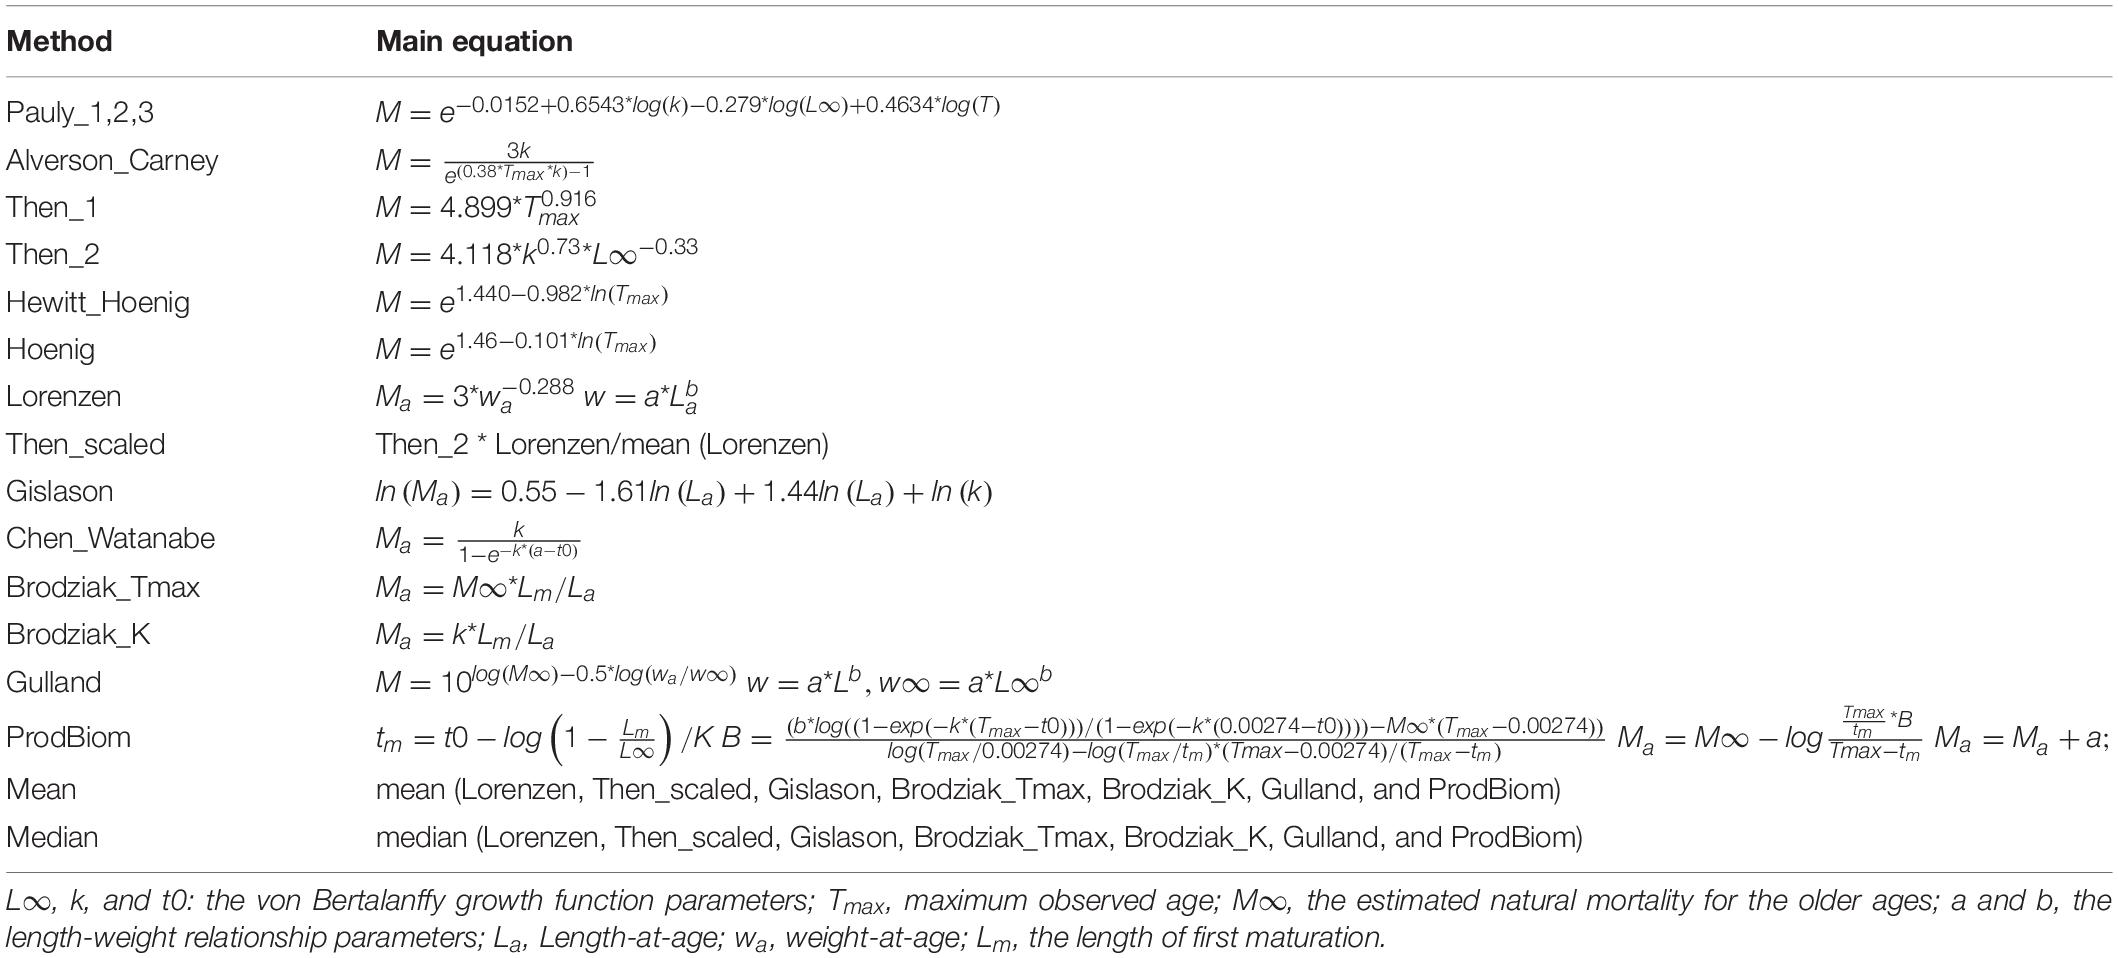
Table 2 | Methods and equations used to estimate M as a constant value or as an age-dependent vector.
The stock assessment model settings and the input data, such as catch at age, fishery independent index of abundance by age, weight at age, baseline M, and proportion of mature individuals by age are fully described in the 2019 STECF reports (STECF, 2019a, c). The only input parameter that we modified compared to the official STECF assessments was M.
Estimating Natural Mortality Rates
A range of common methods to estimate M for the purpose of stock assessment were explored during two recent benchmark meetings on European hake (Merluccius merluccius), which were organized by the GFCM: one for hake in the Adriatic Sea3 and one for hake in all other Mediterranean areas4. Here, we used the same 12 methods and approaches explored in these GFCM benchmarks. Five non-age-dependent methods for the calculation of M estimate empirical scalar values: Alverson and Carney (1975), Pauly (1980), Hoenig (1983), Hewitt and Hoenig (2005), and Then et al. (2014). Age-dependent M vectors were estimated using seven different methods: Gulland (1965), Chen and Watanabe (1989), ProdBiom [Caddy (1991), Abella et al. (1997)], Lorenzen (2000), Gislason et al. (2010), Brodziak et al. (2011). Some assumptions were made considering the species’ habitat; since the bottom sea temperature in the Mediterranean rarely goes down below 12°C and considering that all the species analyzed are demersal, when computing the Pauly equation three different scenarios of bottom temperature were considered: 12-13-14°C. For maximum age (hereafter Tmax) that was used in the Alverson and Carney, Hewitt and Hoenig, and Hoenig and Then equations, the age corresponding to the asymptotic length of the von Bertalanffy growth function (L∞) was used. For the M value of the individuals belonging to the older ages (hereafter M∞) that was needed in one of the two Brodziak equations, in the Gulland formula and in the ProdBiom estimation (Table 2), we used an average of the methods providing scalar values. The natural mortality vector by age estimated with ProdBiom was computed using the unique solution developed by Martiradonna (2012). Equations and acronyms used are listed in Table 2.
Running Stock Assessments
For this analysis, both input data and a4a model configurations were kept as in the official STECF assessments (STECF, 2019a, c). Subsequently, only the M vectors of the official stock assessment were substituted in turn with one of the new M values (either as a scalar or as a vector) and the a4a models were refitted. This resulted in 18 new stock trajectories of biomass, catches, recruitment and fishing mortality for each of the seven original assessments.
Reference Points, Advice, and Bar Charts
Reference points for management (Caddy and Mahon, 1995) were computed using a Yield per Recruit model (Beverton and Holt, 1957) available through the FLR package FLBRP (see text footnote 2). The data collection framework (European Commission [EC], 2000; European Commission [EC], 2017) only began in 2002 in the Mediterranean Sea. As discussed in the introduction, short time series undermine the estimation of reliable stock recruitment relationships needed to estimate typical reference points such as Fmsy which is commonly used in the ICES area (ICES, 2019). Therefore, in the Mediterranean context the exploitation state is estimated using an Fmsy proxy, the F0.1 value (STECF, 2019a, c; FAO, 2019). The F0.1 fishing mortality level is the fishing mortality rate at which the slope of the yield per recruit curve, as a function of fishing mortality, is 10% of its value at the origin (Gulland and Boerema, 1973). Current fishing mortality (hereafter Fcurr) was defined as the fishing mortality level of the latest year available from the official stock assessment, in agreement with STECF practice (STECF, 2019a, c). The status of exploitation was provided by the ratio between Fcurr and F0.1 for which values over 1 indicate a state of overfishing, while values below or equal to 1 indicate a state of sustainable exploitation. Three levels of exploitation were defined as: Sustainable (Fcurr/F0.1 < = 1), Overfishing (1 < Fcurr/F0.1 < = 2), Severe overfishing (Fcurr/F0.1 > 2).
The impact of the different M values on the Fcurr/F0.1 ratio was summarized in three main bar charts:
(i) as a distribution of the Fcurr/F0.1 ratios obtained from the range of M values tested for each stock. This was summarized as an histogram of the 18 different values represented as bins with a width of 1 (0–1, 1–2, 2–3, etc.);
(ii) as a histogram by M estimation method showing the ratio between number of stocks for which Fcurr/F0.1 falls in one of the three levels of exploitation over the total number of stocks analyzed.
(iii) as a histogram by stock showing the ratio between the number of cases in which Fcurr/F0.1 falls in one of the three levels of exploitation over the total number of M vectors used.
Finally, the impact on management decisions was compared between the base-case model used in the official advice for each stock by either STECF or GFCM and each of the alternative M scenarios using the relative error (%) of the form:
where Xref is the reference value of Fcurr/F01. from the official assessment and XM is the respective value given variation in M for each method.
Results
In Table 3, the main outputs in terms of Fcurr and biological reference points for all the 126 scenarios (18 natural mortality vectors for each of the 7 stocks used) are summarized. The M vector affected more the estimation of the biological reference points rather than the level of Fcurr. For biological reference points, the coefficient of variation (CV) ranged between a minimum of 0.37 in SOL17 to a maximum of 1.95 in HKE91011, while, for the current level of fishing mortality, the CV ranged between a minimum of 0.11 in MUT9 to a maximum of 0.37 in HKE91011 (Table 3).
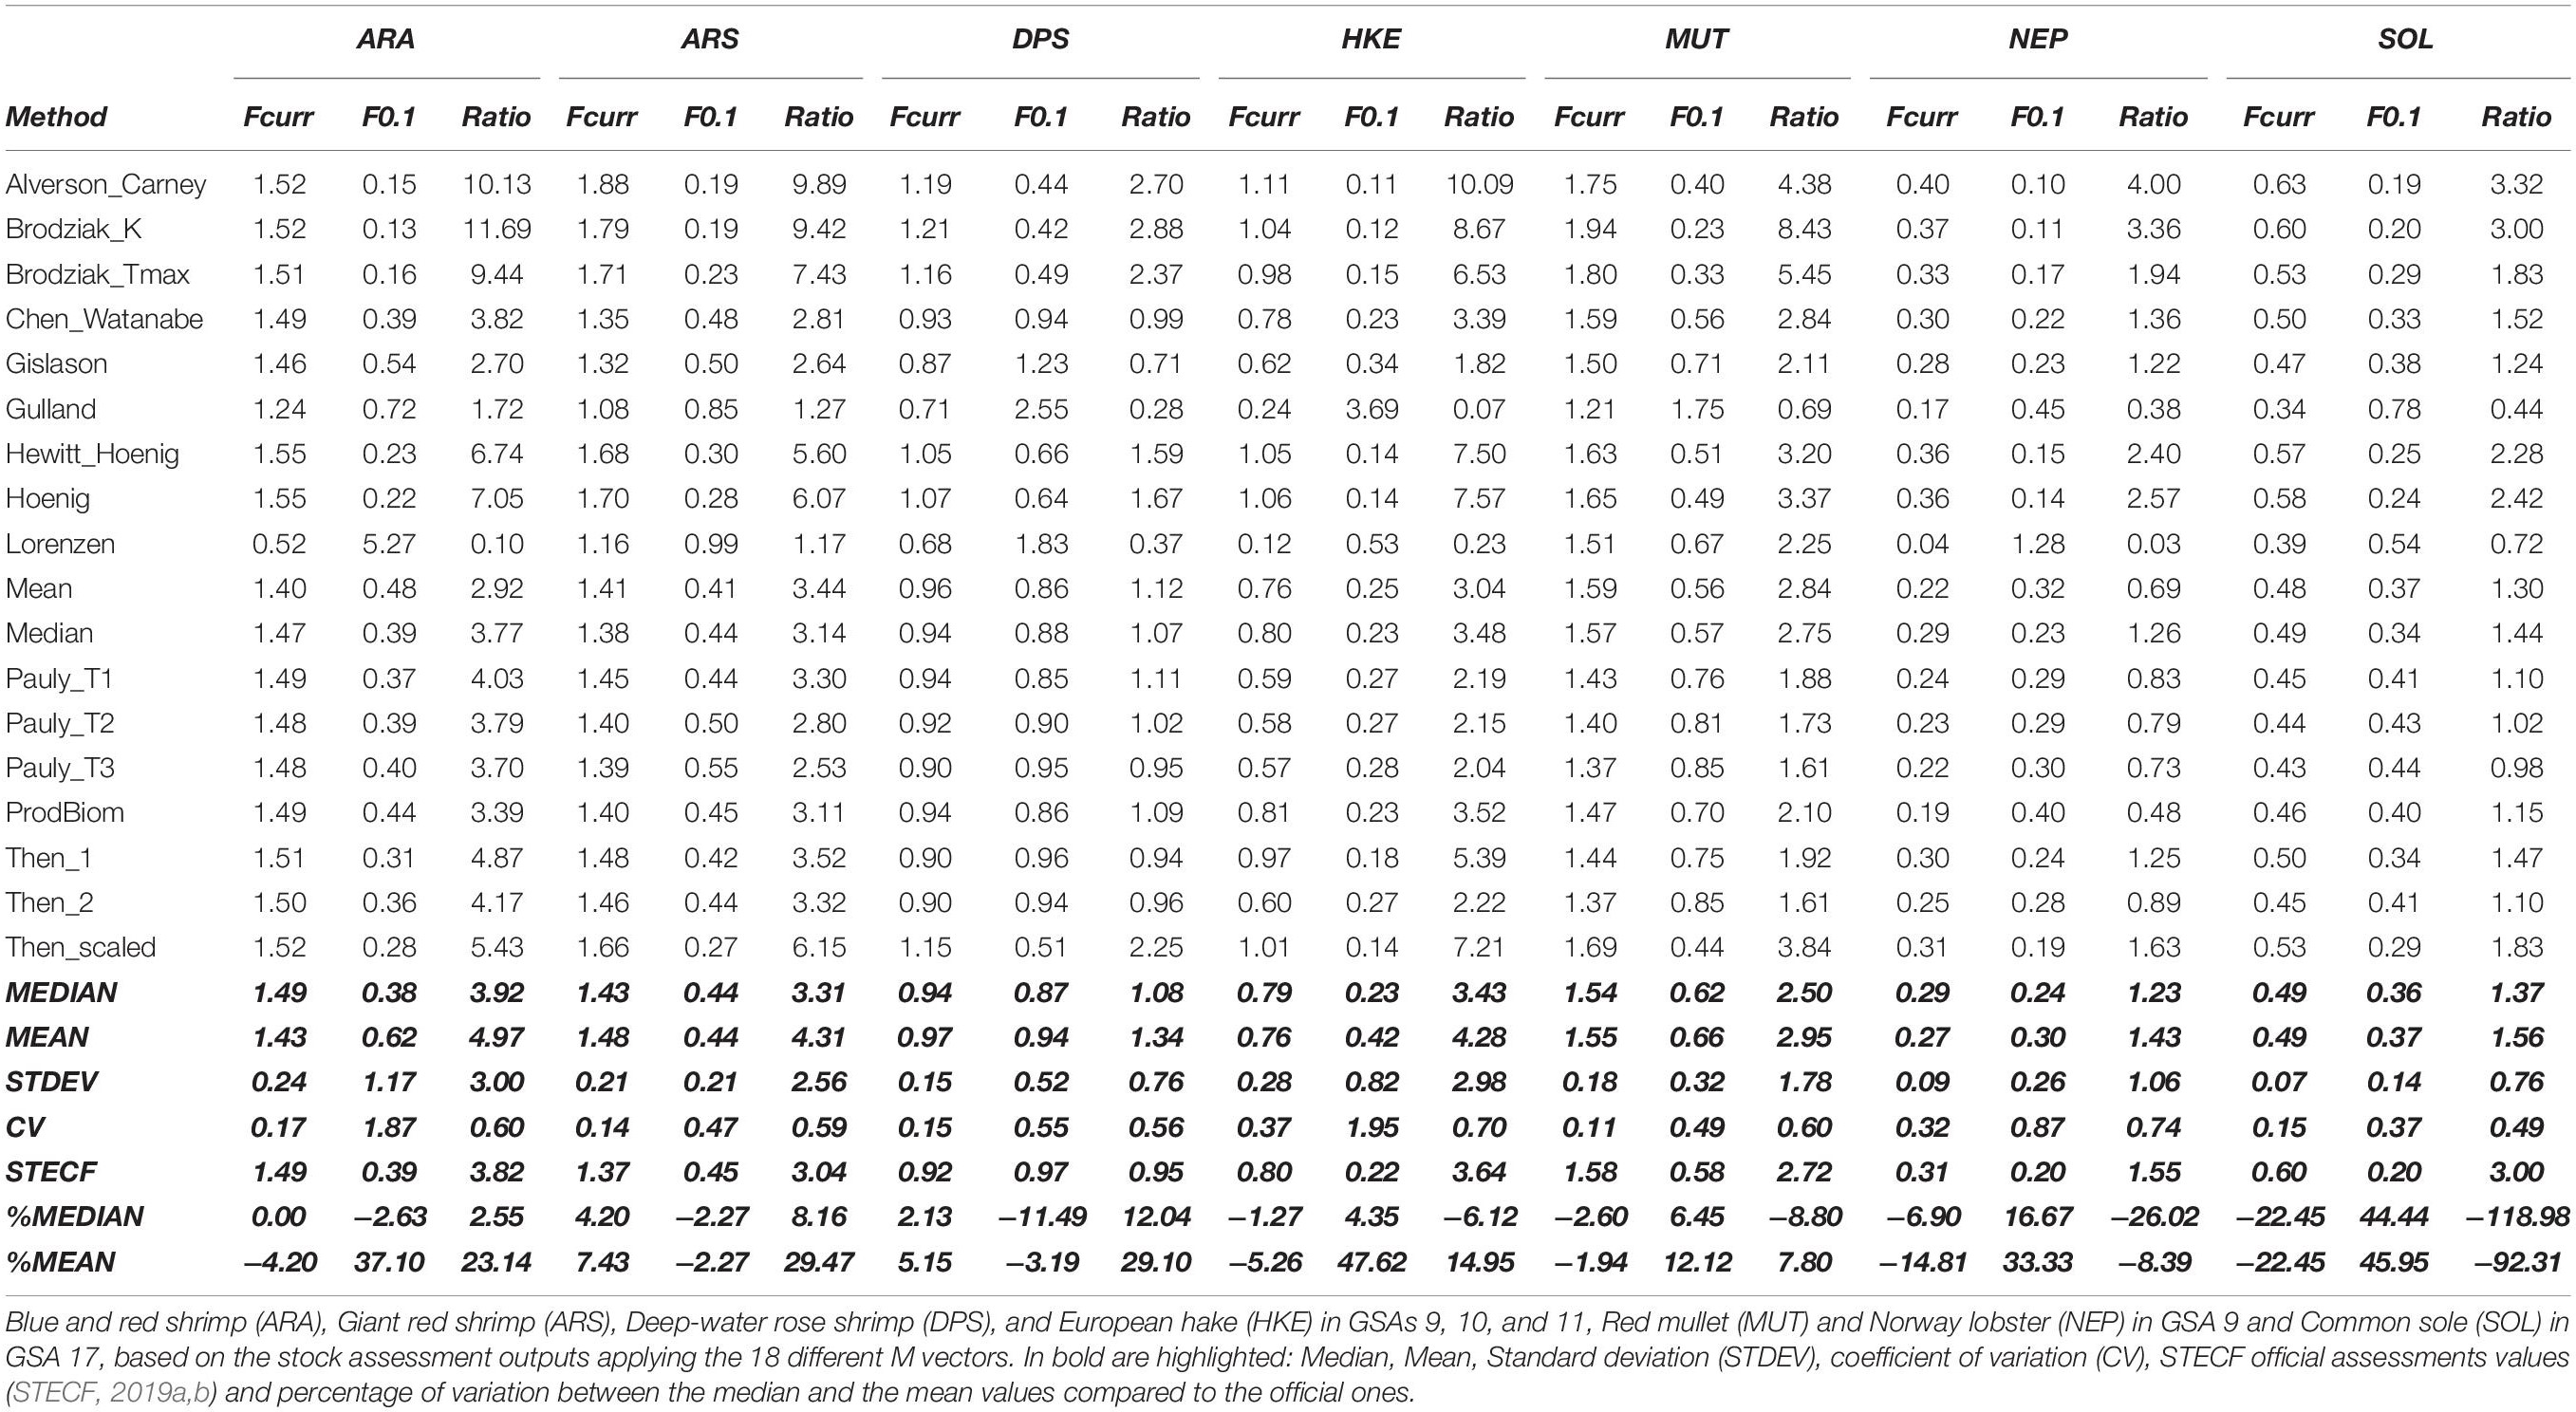
Table 3 | Current level of fishing mortality (Fcurr), biological reference level (F0.1), and the ratio (Fcurr/F0.1) for the seven stocks.
Even though the model values of the distribution of the ratio by stocks confirms a general pattern of overfishing and severe overfishing (except DPS91011 and NEP9), some of the stocks, such as ARA91011 and HKE91011, officially assessed as in severe overfishing, could be assessed as sustainably fished (Figure 2). ARA91011, ARS91011, and HKE91011 showed the widest Fcurr/F0.1 ranges while DPS91011 and SOL17 the narrowest ones (Figure 2).
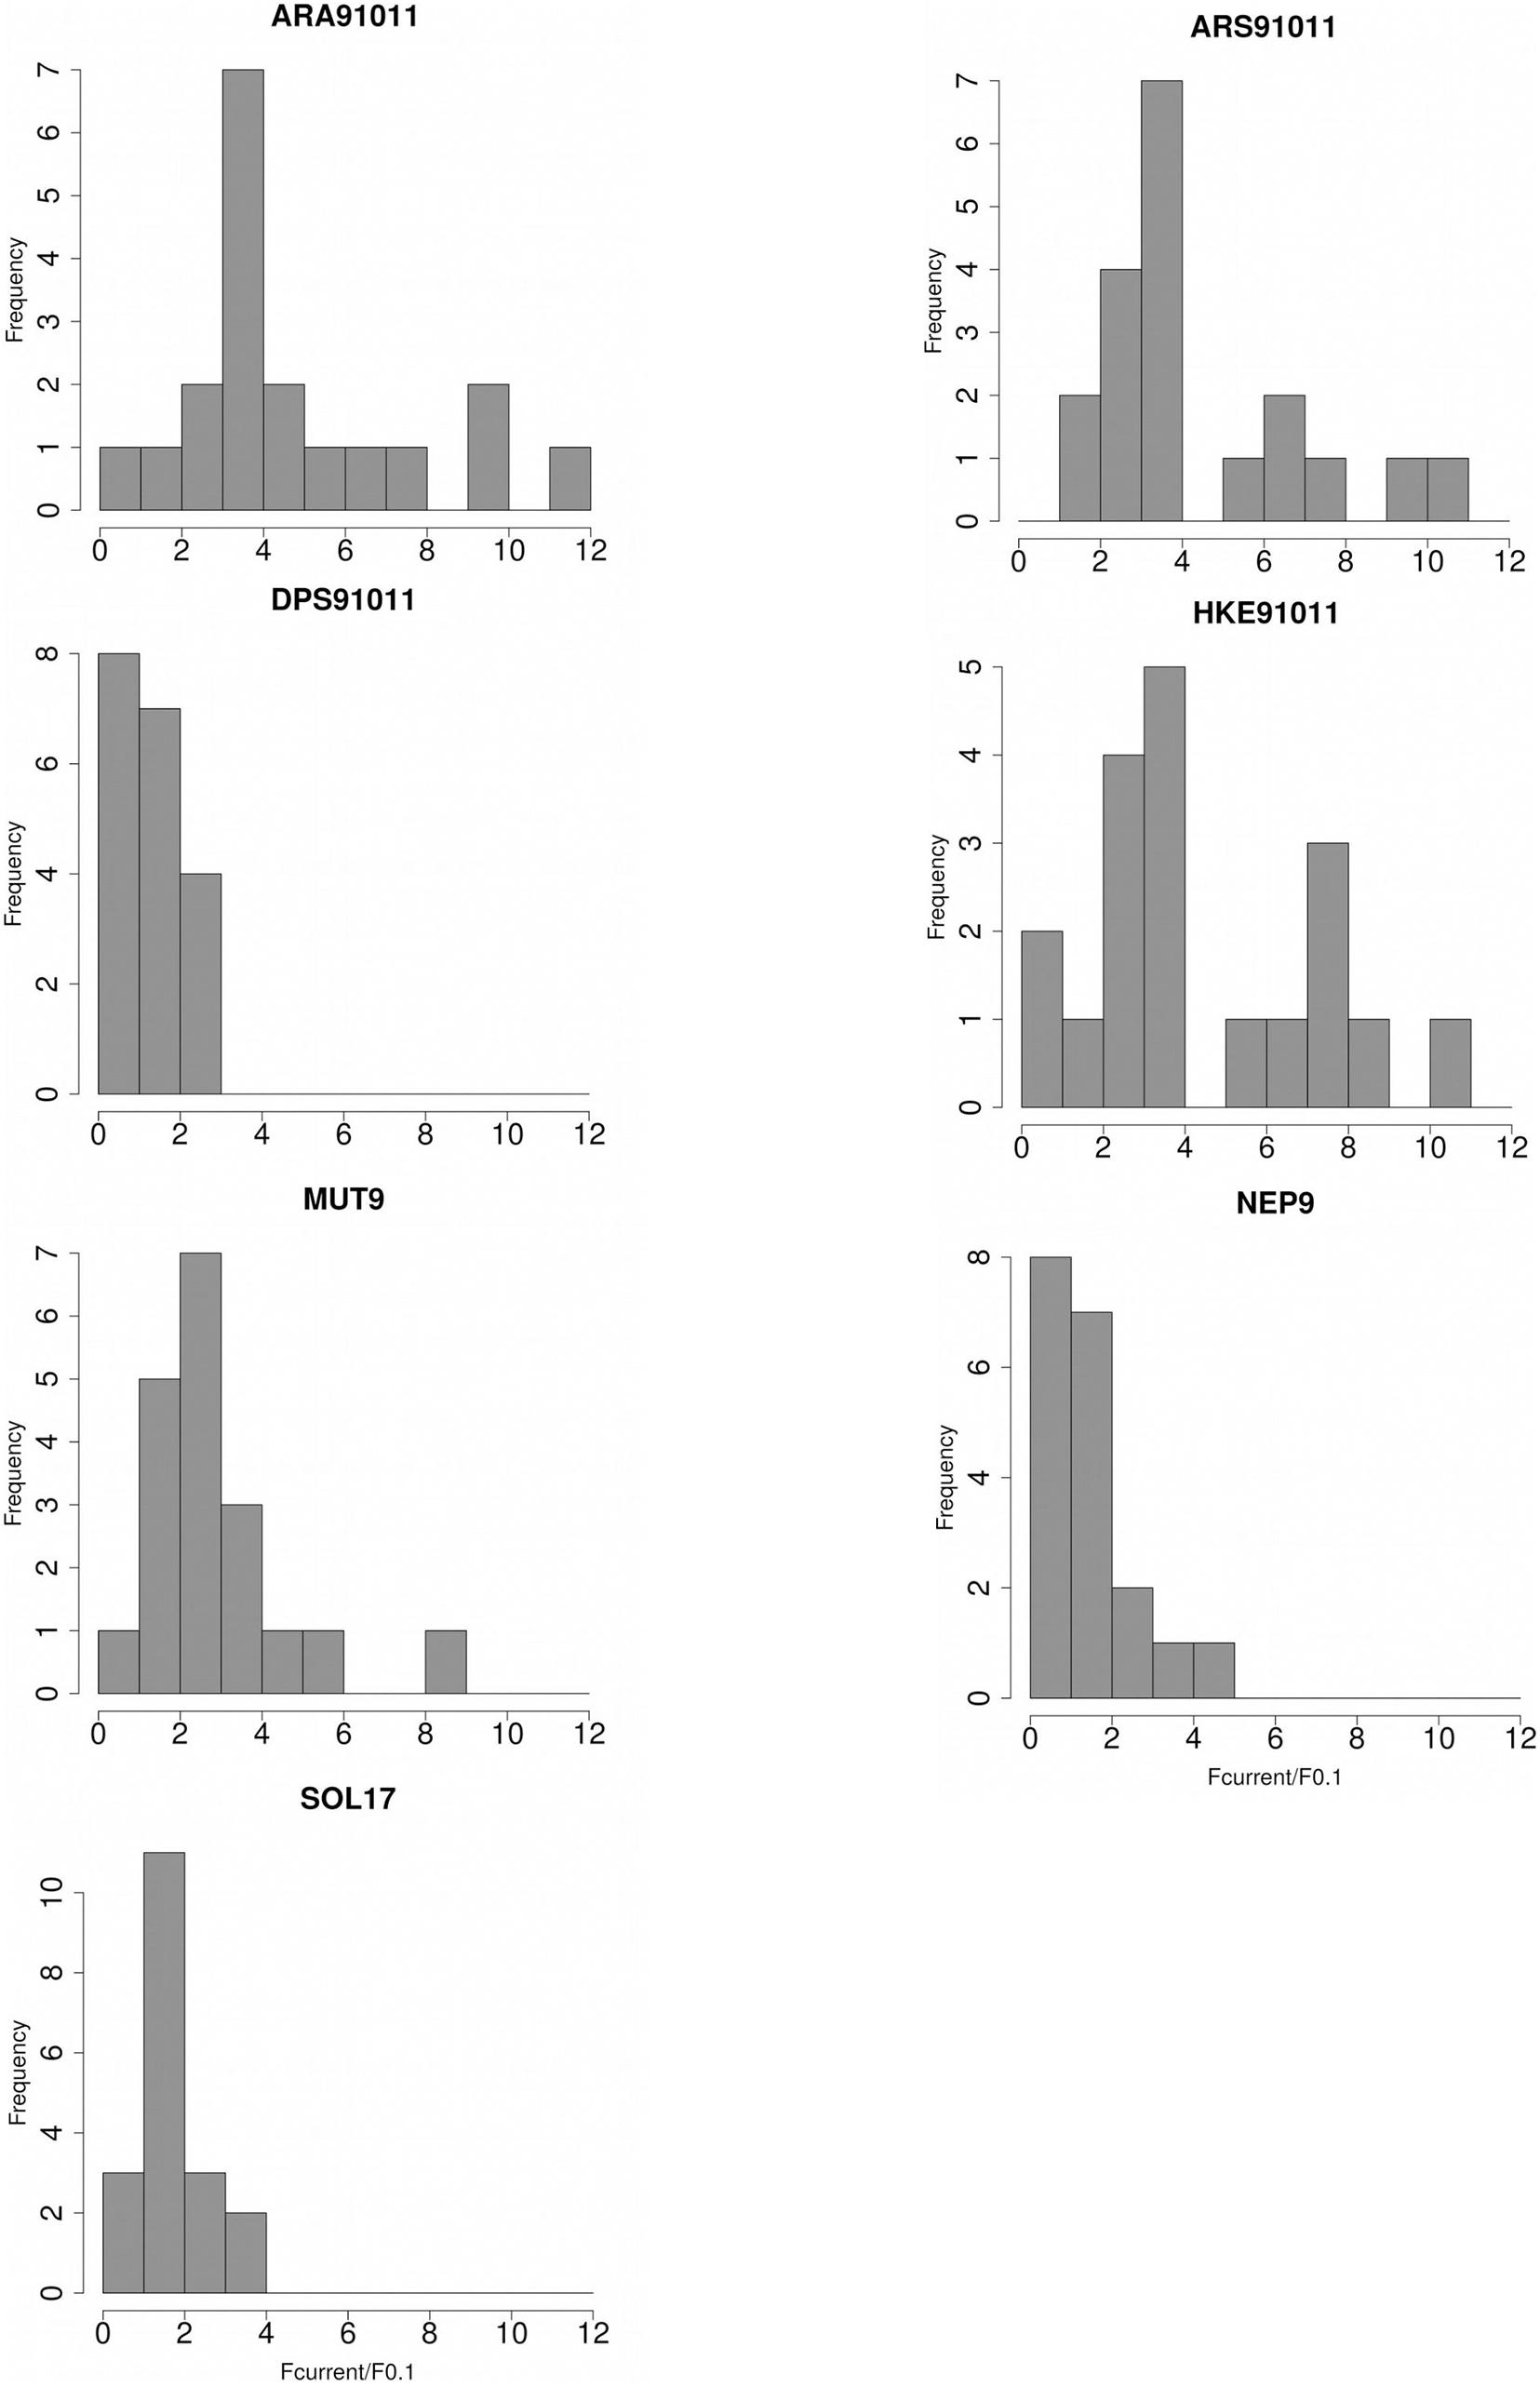
Figure 2 | Distributions of the ratios between Fcurr and F0.1 derived from 18 different natural mortality vectors for the seven stocks analyzed: Blue and red shrimp (ARA), Giant red shrimp (ARS), Deep-water rose shrimp (DPS) and European hake (HKE) in GSAs 9,10, and 11, Red mullet (MUT) and Norway lobster (NEP) in GSA 9 and Common sole (SOL) in GSA 17.
Generally, assessments suggesting severe overfishing scenarios were obtained when applying the Alverson_Carney, Brodziak, Hewitt_Hoenig, and Hoenig methods while more optimistic outcomes were obtained when the Lorenzen and Gulland methods were applied (Table 4 and Figure 3).
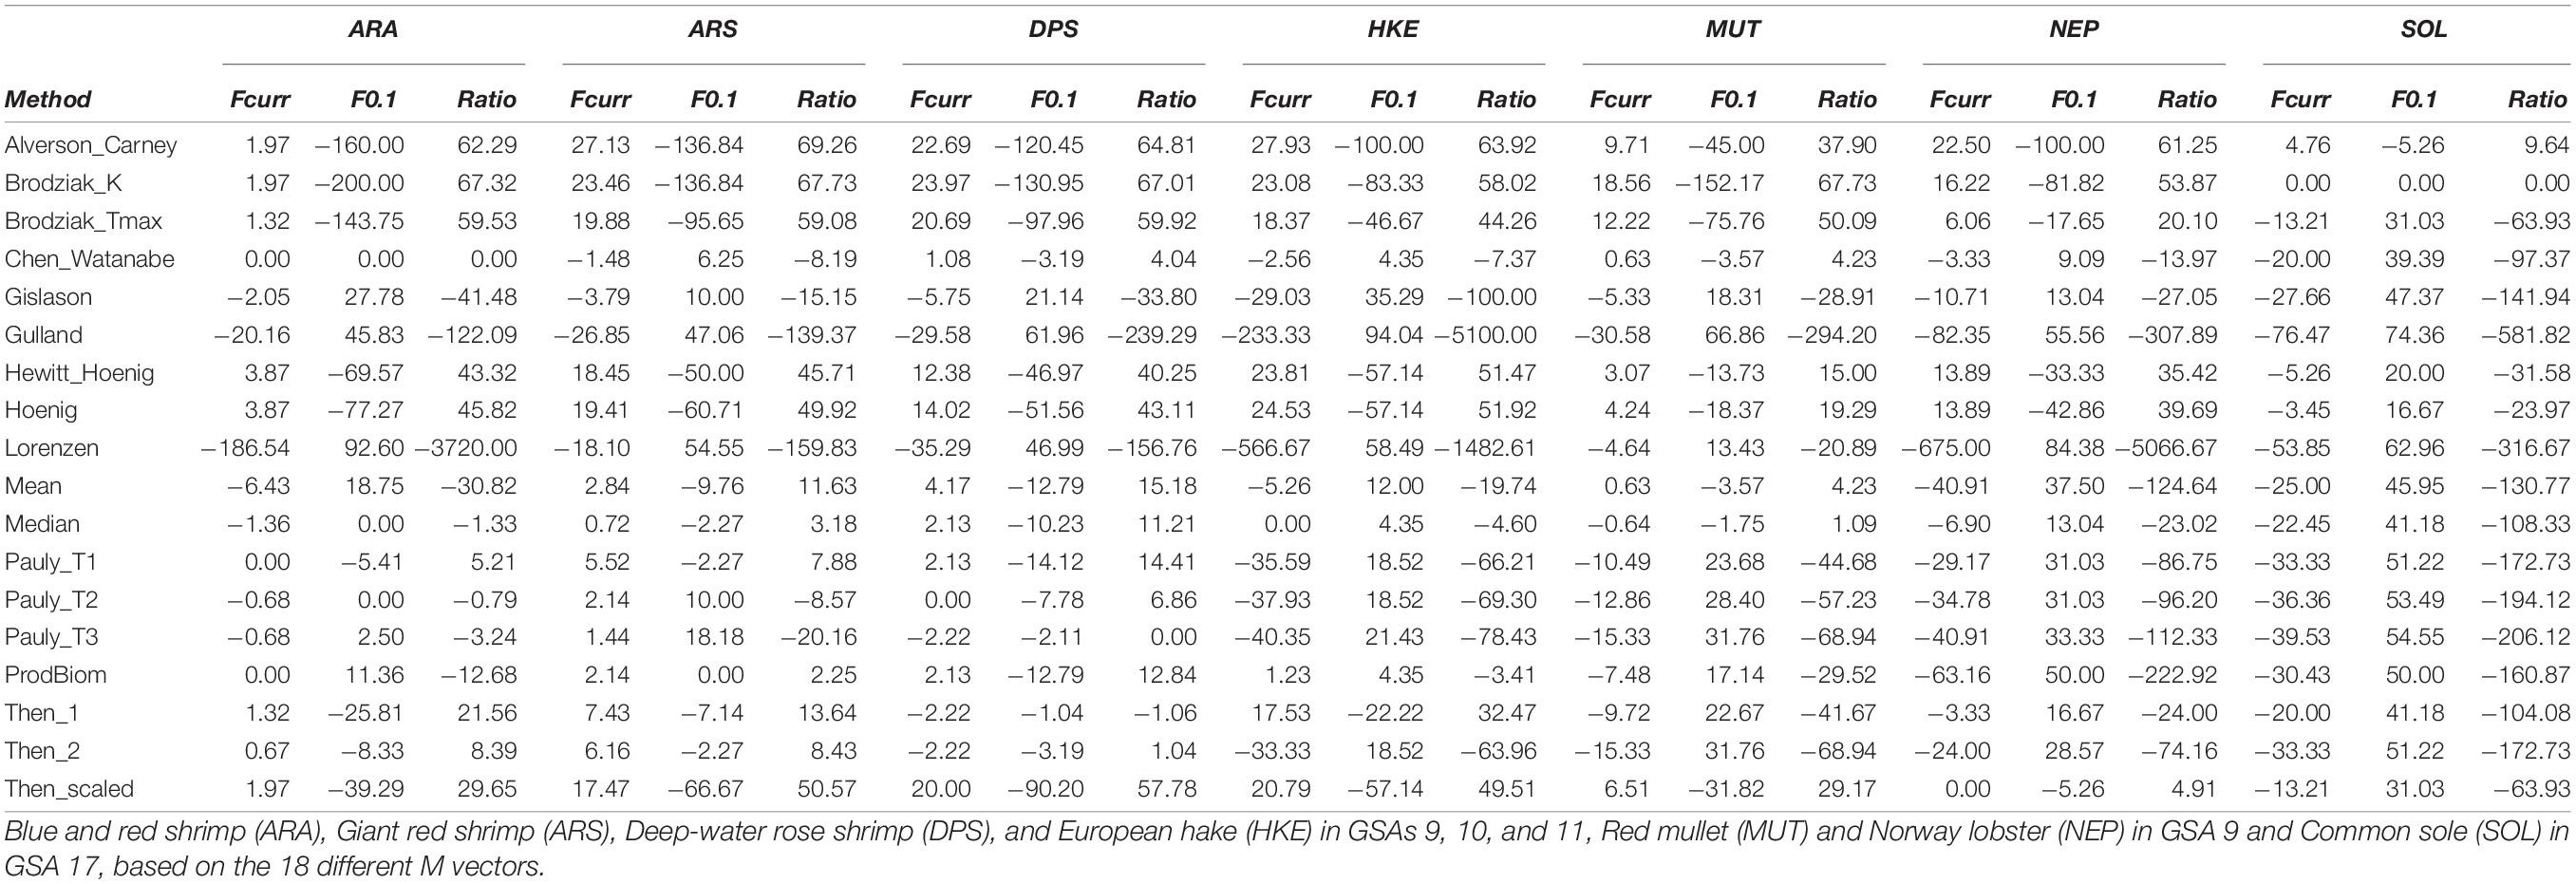
Table 4 | Percentage of variation of the current level of fishing mortality (Fcurr), biological reference level (F0.1) and the ratio (Fcurr/F0.1) compared to the official advice estimated for the seven stocks.
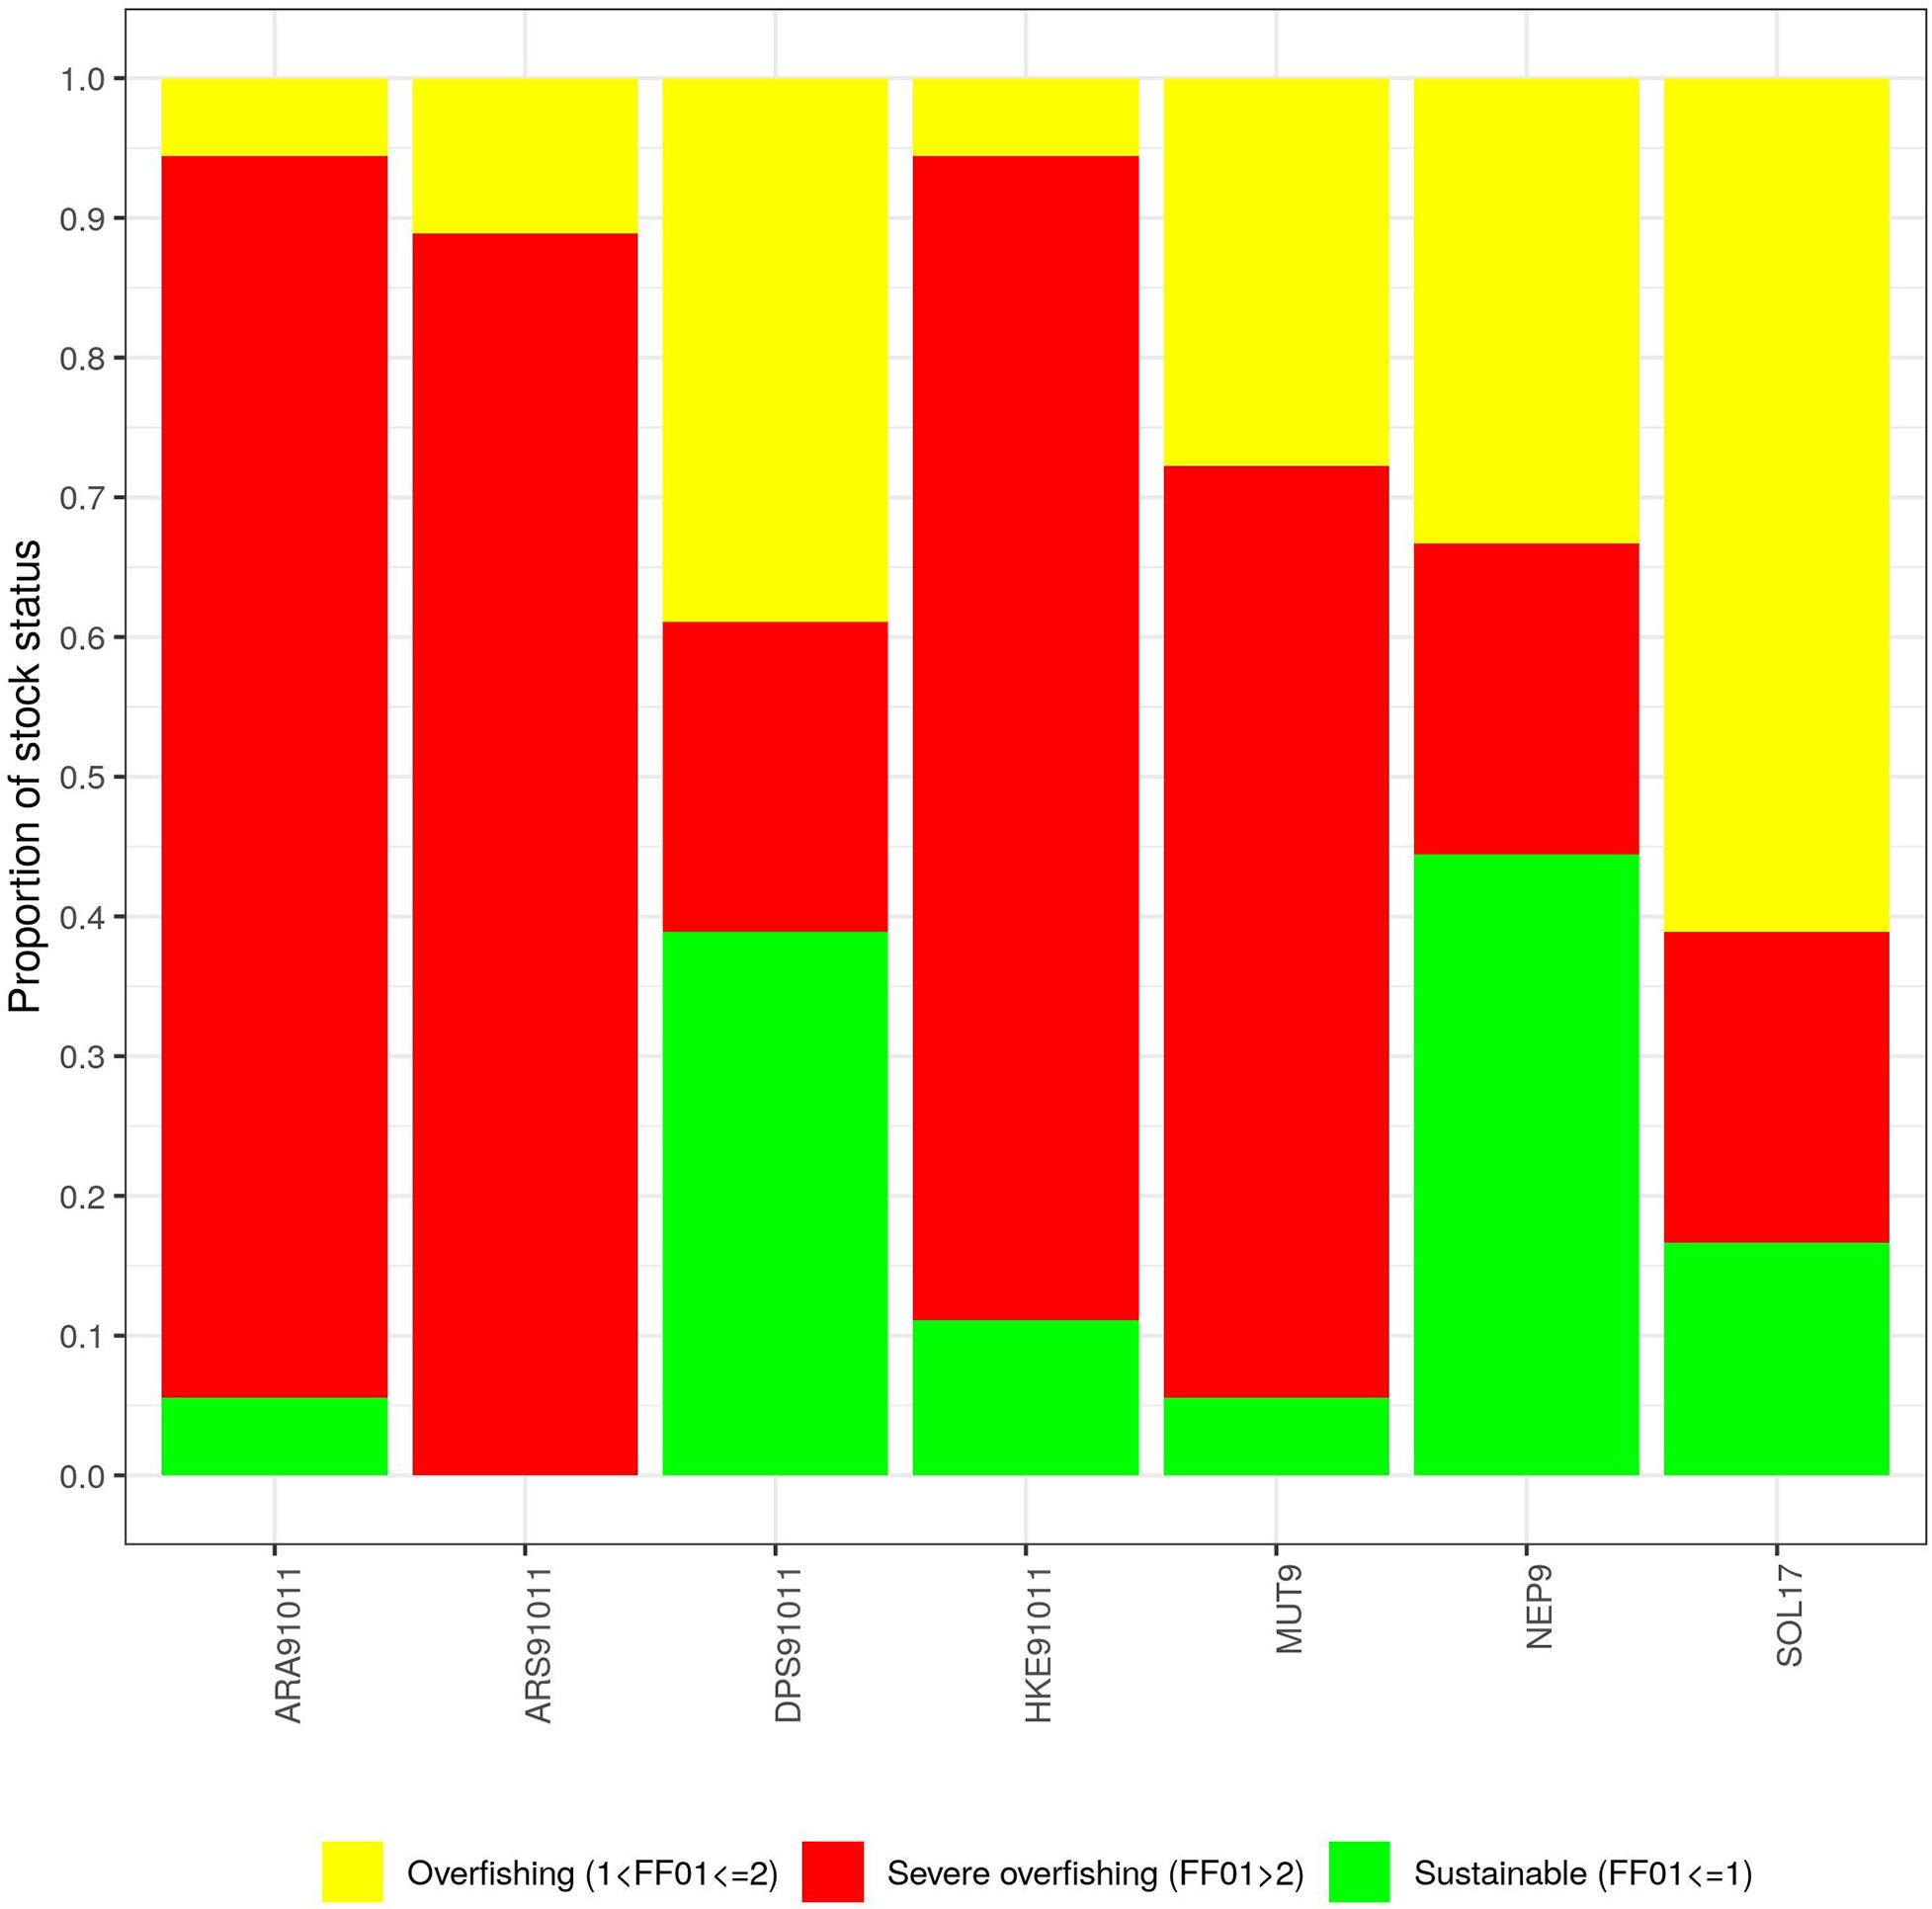
Figure 3 | Distribution of the ratios Fcurr/F0.1 by M estimation method. On the y axis is reported the proportion of stocks for each level of exploitation over the total number of stocks (7).
The comparison between the official assessments and the median values obtained from the 18 different approaches ranged from the official assessment being quite close to the median (e.g., ARA91011; +2.55%), to stocks where that difference increased (e.g., NEP9; −26.02%), to SOL17 exhibiting the highest difference (−118.98%) (Table 3).
Figure 4 shows that irrespective of the M vectors used, in ARS91011 there is always a clear overfishing situation (severe in 90% of the cases). For all other stocks, estimates also included sustainable fishing as a possible outcome. However, HKE91011, ARA91011, and MUT9 mostly exhibited a situation of overfishing, while the patterns in DPS91011, NEP9, and SOL17 describe a more uncertain scenario for which stocks could be either under sustainable or unsustainable fishing pressure. As an example, for SOL17, where the official advice suggested a state of severe overfishing (Fcurr/F0.1 = 3), in 80% of cases a potential scenario of overfishing or sustainable fishing was estimated. The relative error (%) of the ratio Fcurr/F0.1 is shown for each stock by M method with respect to the official assessment (Figure 5). Note, that for all the stocks but SOL17, Chen and Watanabe was the method used in computing the M vector at the STECF meeting (STECF, 2019a, c), which therefore explains the lack of divergence from of the official assessment. It is evident that using the Gislason M vector the perception of the stock status improves, while, using the Alverson and Carney or Broziak methods leads to an impression of severe overfishing. Moreover, these effects seem to be unrelated to M being age-dependent or not. For example, the three Pauly values seem to have no effect on red shrimps and Deep water rose shrimp while they gave the worst signal in terms of exploitation for Norway lobster (another crustacean) and the three teleostean species. At the same time, Then_scaled, even if it is associated with a general pattern of overfishing stock status (except for SOL17) the magnitude of this trend differs a lot by species and phylum.
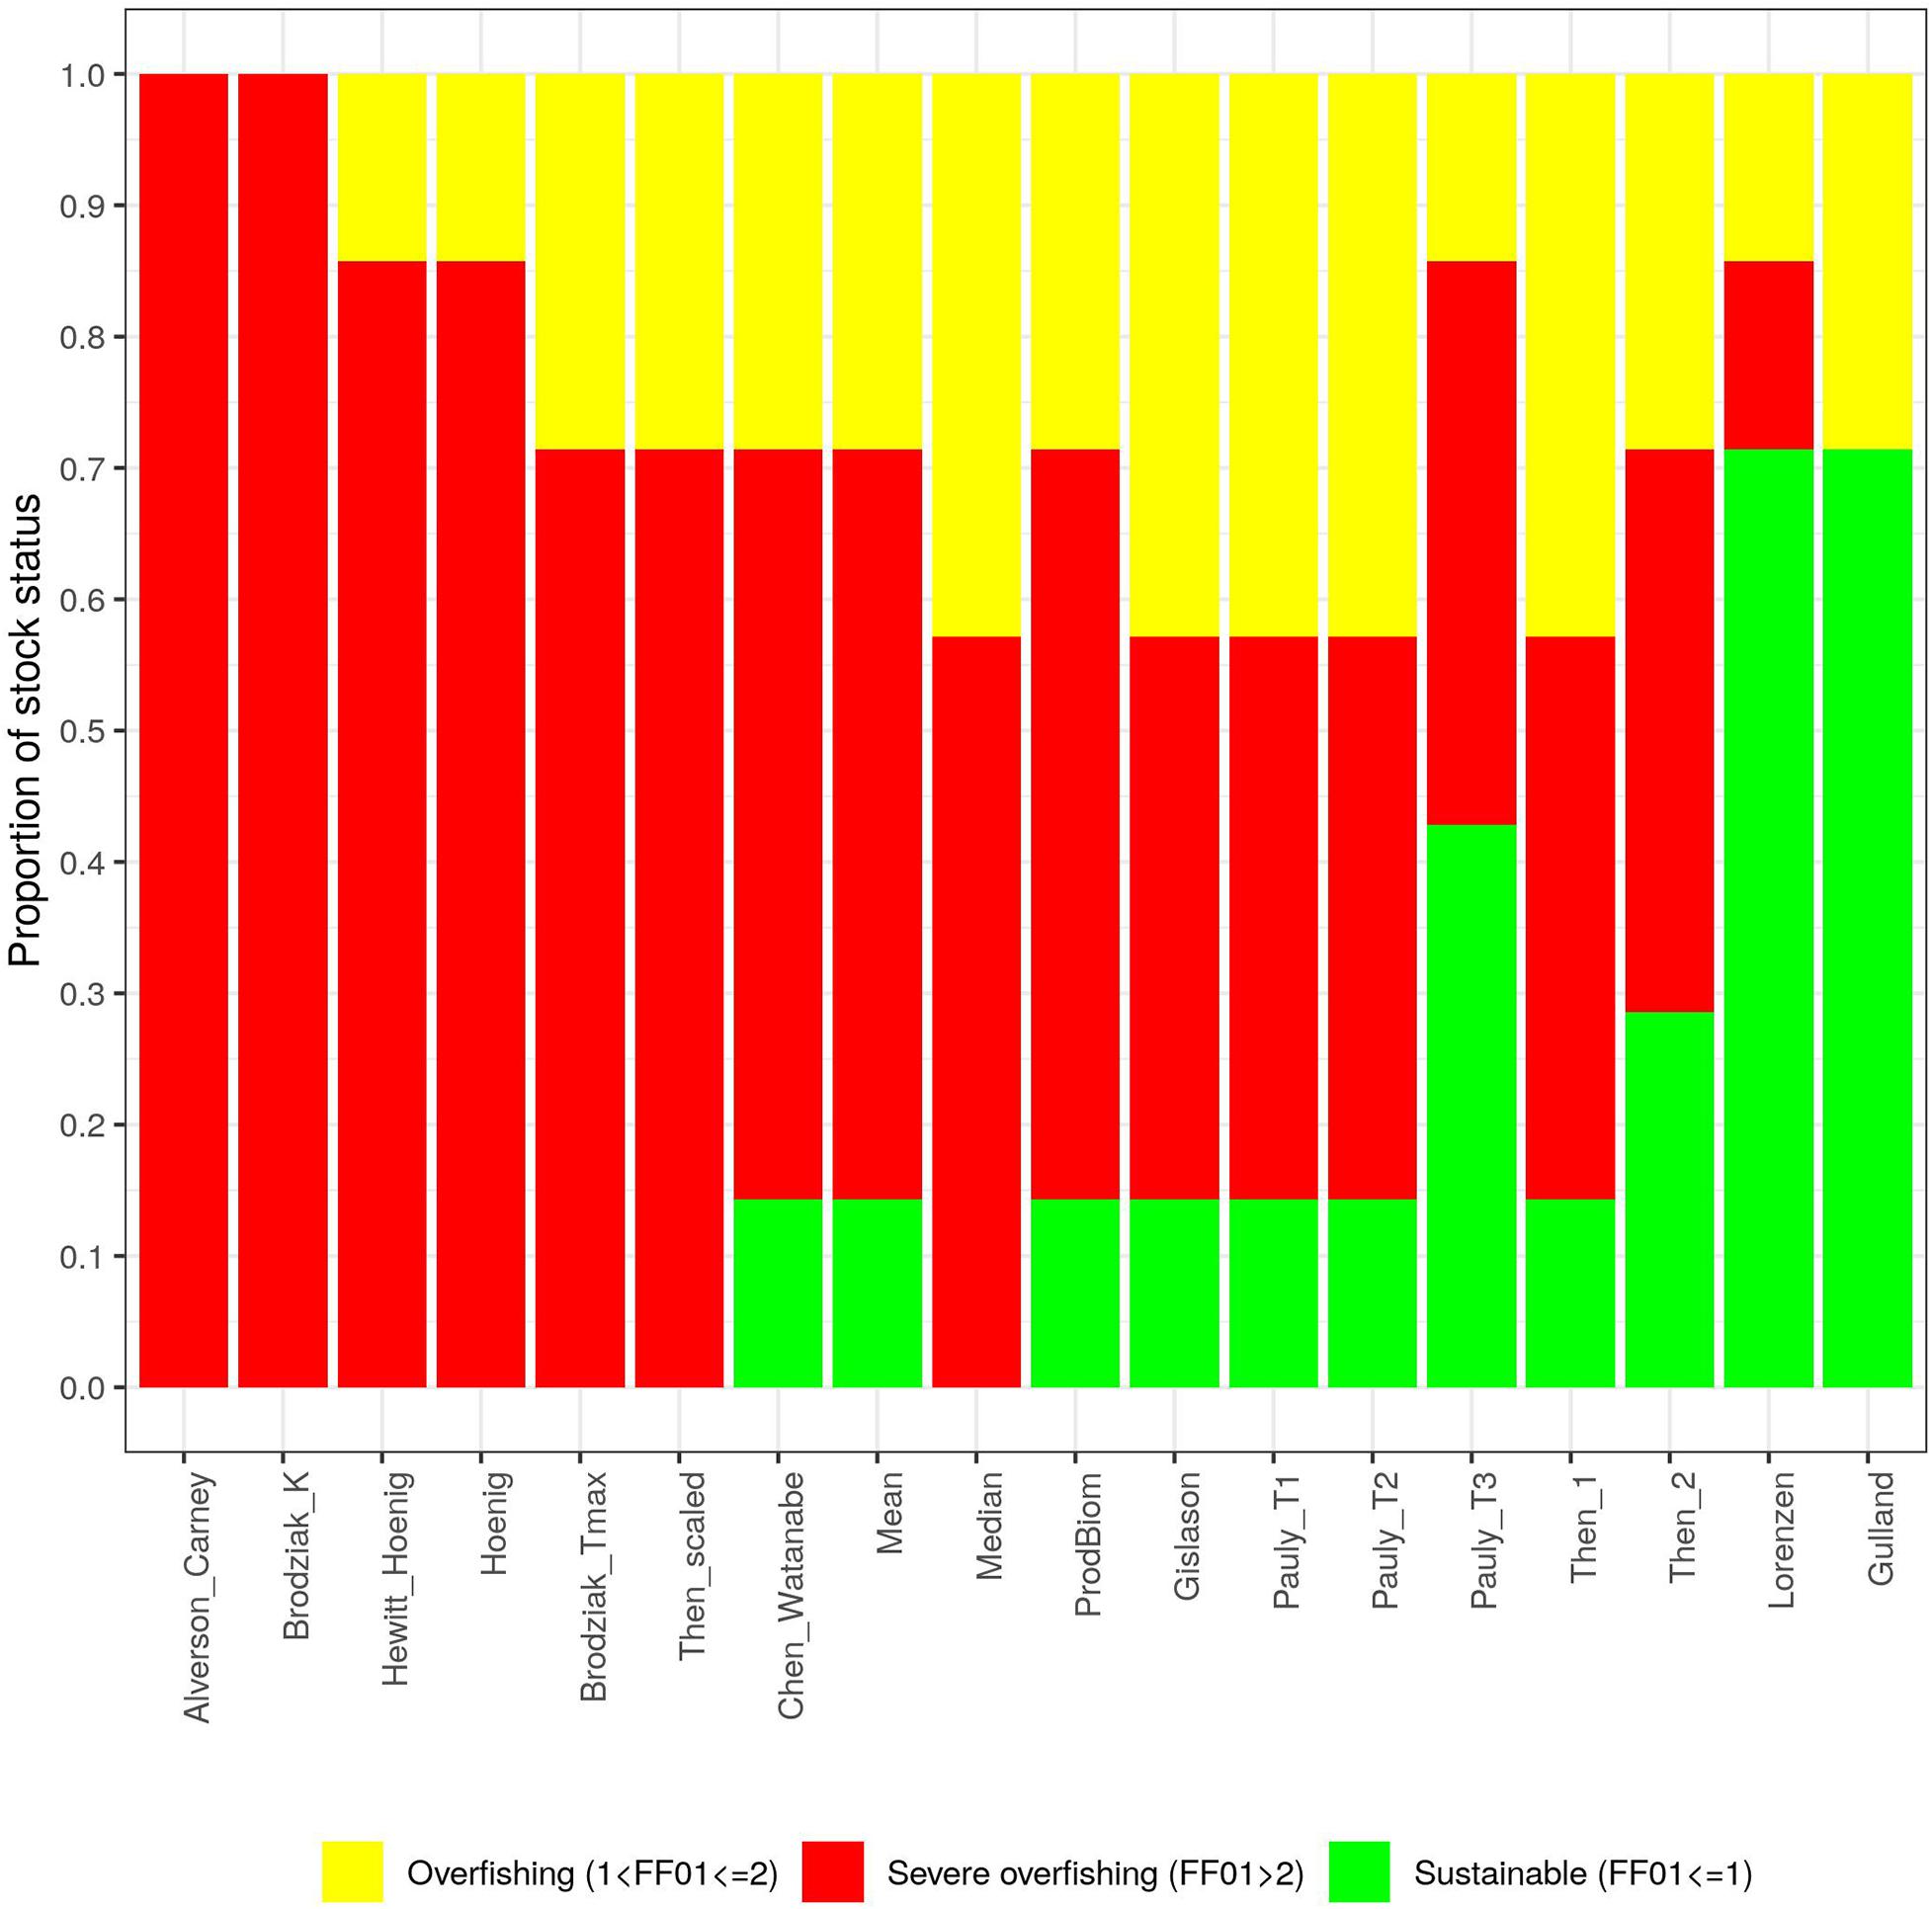
Figure 4 | Distribution of the ratios Fcurr/F0.1 by stock. On the y axis is reported the proportion of stocks for each level of exploitation over the total number of cases (18).
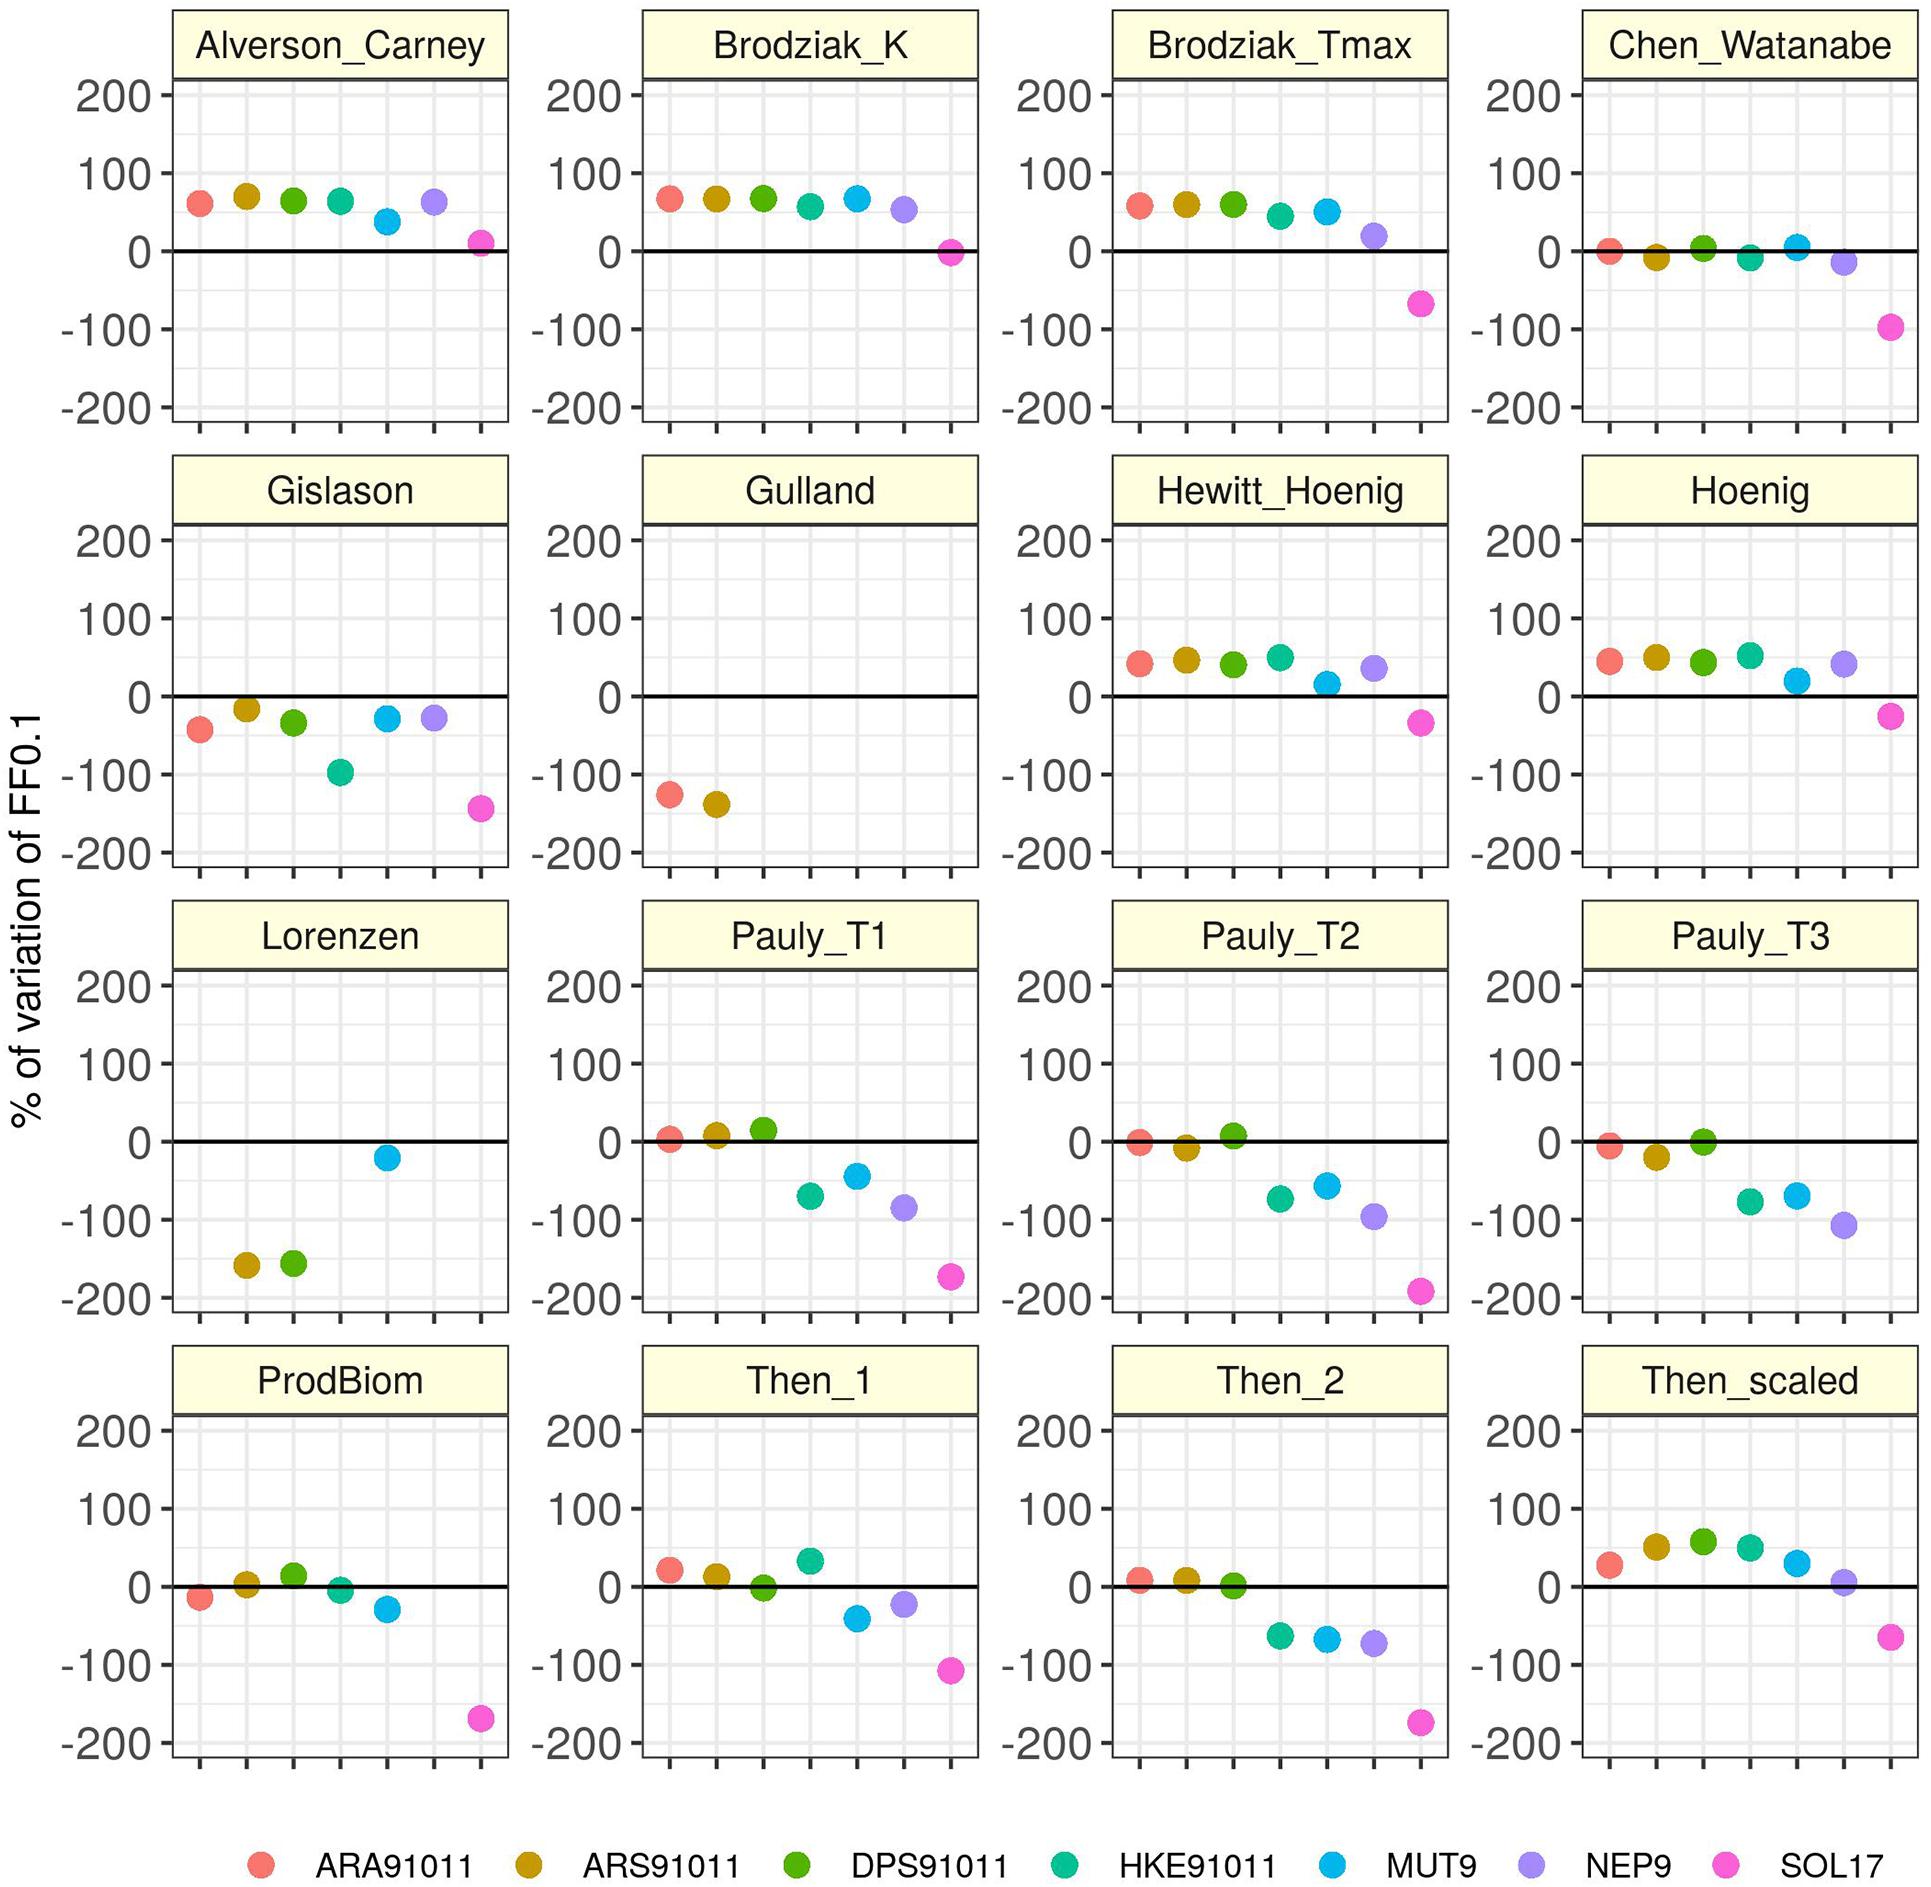
Figure 5 | Relative error (%) of Fcurr/F0.1 respect on the baseline [the official STECF assessment advice (black line)]. Percentages more than 200 and less than –200 are not shown (see Table 4 for values).
Discussion
Our results confirm that the choice of the M vector has a major impact on the output of stock assessment models. In six of the seven stocks examined, stock status classification ranged from sustainable to severe overfishing depending on the choice of the M estimation method. Using the “Alverson_Carney” and the “Brodziak_k” estimators, lead to the most severe overfishing classification of all seven stocks. Using the M estimators by Lorenzen and Gulland, in contrast, produced sustainable stock status estimates for 70% of the assessed stocks. However, when considering the median stock status across all stock assessment outputs based on all 18 M scenarios, none of the stocks would be sustainable, and four out of the seven stocks would be in severe overfishing, suggesting that choosing a single M scenario from the extremities of the spectrum is associated with high risk of misclassifying the stock status.
In the Mediterranean Sea, where data-limited situations go hand in hand with a specific behavior of demersal fishery, typically targeting the first two age classes of most demersal stocks (Colloca et al., 2013; Vasilakopoulos et al., 2014), the effects of the M choice are even more crucial. The targeting of juveniles’ age classes happens for different reasons: species within the Mediterranean do not grow as large and have a shorter lifespan than corresponding species in colder Atlantic waters. Historically, small fish hold an important slice of the market and as most evaluated stocks that are overfished, they are characterized by a relative lack of older fish (Colloca et al., 2013; Vasilakopoulos et al., 2014). As older ages are less represented, right-end selectivity is rare, introducing additional uncertainty and instability within the assessment process (Magnusson and Hilborn, 2007). Additionally, time series of standardized data in the Mediterranean basin are typically short for statistical catch at age model standards (usually between 13 and 17 years). Such short time series do not allow to obtain correct estimates of the stock-recruitment relationship, which precludes the use of Fmsy as a reference point, and F0.1 is used as a surrogate approximation instead (STECF, 2019a, c). Time series of fisheries catches which are typically dominated by juvenile age classes are unstable as they are more sensitive to environmental variations affecting recruitment (Anderson et al., 2008; Stenseth and Rouyer, 2008). For all these reasons, when assessing Mediterranean stocks it becomes fundamental to explore the effect of parameter uncertainty on model outputs and apply methods which account for the introduction of potential bias within the management process.
The analysis carried out on the seven case studies of Mediterranean stocks clearly showed that the variation of stock assessment models’ input parameters, such as the M vector, directly influenced the stock status results. Moreover, the role played by M becomes critical if we think that the perception of the stock status could be driven in one or another direction according to the scope of stakeholders. We recommend that a sensitivity analysis should always be carried out when dealing with stock assessments where uncertainty in the input data is very high. Relevant examples include the Norway lobster in GSA9, the Deep-water rose shrimp in GSA91011 and the Common sole in GSA17, for which our analysis showed that the final perception of the stock status could differ a lot depending on the M estimate used.
Accounting for the uncertainty of M alone may not be enough to improve the estimation’s precision of stock exploitation levels. Another important source of bias is related to misreported catches (Van Beveren et al., 2017; Perretti et al., 2020). Pauly et al. (2014) pointed out that actual catches from four Mediterranean countries (Spain, France, Italy, and Turkey) could be from 1.6 to 2.6 times higher than those submitted to the FAO as official values. Non-reported catches were high in all fishing sectors, including industrial, artisanal and recreational fisheries (Pauly et al., 2014). Although catch numbers at age are typically fitted by admitting random observation error, this cannot account for systematic underreporting or system trends in catch reporting. Reducing the level of misreported catches should be therefore a priority for all data collection programs and related sample designs, specifically for areas characterized by data limitation such as the Mediterranean Sea.
Within the Mediterranean basin, fisheries management is based on fishing effort reduction, which can be obtained through area or time closures and by reducing fishing days. In order to evaluate if stocks are responding to fishing effort control measures, objectives of multiannual management plans (MAPs) are evaluated against stock assessment outputs and, more specifically, Fcurr/F0.1. Not accounting for the effect of uncertainty of key input parameters, such as M, in the stock assessment process means not accounting for potential bias in the evaluation of MAPs’ objectives and therefore in their implementation. The implementation of MAPs in the Mediterranean and Black Sea is a responsibility of national states, however the development of MAPs can occur at different levels: international, within the European Union, and at national as well as regional level (European Commission [EC], 2013). The scientific bodies responsible for advising on the management of fisheries within the Mediterranean and Black Sea are: the GFCM, the European Commission (EC) and national governments. All these bodies rely on scientific analysis provided by working groups of fisheries science experts, specifically, for the EC, such working groups are coordinated and their output evaluated by the STECF.
Hilborn and Walters (1992), when discussing which could be the best model to be used in assessing stocks recalled an adage that “the truth often lies at the intersection of competing lies”. In the context of stock assessment, they explained, this means deliberately comparing a range of alternative models. This statement may well be applied to the results of our analysis: always think that the main input parameters of a stock assessment are not well known, ending up with a range of alternative scenarios for management, which should be scrutinized. To address this, different approaches could be used to improve stock assessment quality and reduce uncertainty in the future. Recent research has been focusing on implementing a more objective model selection approach for experts to reach an agreement on which is the best supported model based on the performance of model diagnostics (Carvalho et al., 2017; Maunder and Piner, 2017; Rudd et al., 2019). Specifically, model ensembles for future stock assessment advice have been proposed as a promising approach to capture structural uncertainty surrounding important biological processes, including M (Scott et al., 2016). Elsewhere, such approaches are already implemented. Maunder et al. (2020), for example, developed a risk-based framework to objectively assign different weights to models in an ensemble, involving the results of several diagnostics tests as well as carefully developed expert criteria to judge the plausibility of each candidate model. The alternative to making benchmarking more risk adverse is by considering a range of alternative stock assessment model scenarios for conditioning of robust harvest control rules within the MSE framework (Punt et al., 2014b, 2016). Such approaches could facilitate expert working groups to reach a transparent and defensible agreement on which could be the best set of candidate models to be used to formulate probabilistic stock advice accounting for uncertainty.
Data Availability Statement
Publicly available datasets were analyzed in this study. This data can be found here: https://stecf.jrc.ec.europa.eu/web/stecf/dd/medbs/sambs.
Author Contributions
AM and CP conceived the study and colleted the data. AM did the analysis. AM, CP, PV, CK, and HW interpreted the results and wrote the manuscript. All authors contributed to the article and approved the submitted version.
Funding
This work was carried out using data provided through European Union’s Scientific, Technical and Economic Committee for Fisheries (STECF) and Food and Agriculture Organization’s General Fisheries Commission for the Mediterranean (GFCM) and reflects information provided by several member states contracting parties. The contents of this article do not necessarily reflect the point of view of STECF or GFCM and in no way anticipate these Commissions’ future policy in this area.
Conflict of Interest
The authors declare that the research was conducted in the absence of any commercial or financial relationships that could be construed as a potential conflict of interest.
The handling editor declared a past co-authorship with one of the authors, HW.
Acknowledgments
The authors would also like to acknowledge two reviewers for their comments and insights that improved the manuscript.
Footnotes
- ^ http://www.fao.org/gfcm/data/maps/gsas
- ^ https://www.flr-project.org/
- ^ http://www.fao.org/gfcm/meetings/info/en/c/1169692/
- ^ http://www.fao.org/gfcm/meetings/info/en/c/1237394/
References
Abella, A. J., Caddy, J. F., and Serena, F. (1997). Do natural mortality and availability decline with age? An alternative yield paradigm for juvenile fisheries, illustrated by the hake Merluccius merluccius fishery in the Mediterranean. Aquat. Living Resour. 10, 257–269. doi: 10.1051/alr:1997029
Alverson, D. L., and Carney, M. J. (1975). A graphic review of the growth and decay of population cohorts. ICES J. Mar. Sci. 36, 133–143. doi: 10.1093/icesjms/36.2.133
Anderson, C. N. K., Hsieh, C.-H., Sandin, S. A., Hewitt, R., Hollowed, A., Beddington, J., et al. (2008). Why fishing magnifies fluctuations in fish abundance. Nature 452, 835–839. doi: 10.1038/nature06851
Beverton, R. J. H., and Holt, S. J. (1956). A review of the methods for estimating mortality rates in fish populations, with special reference to sources of bias in catch sampling. Rapp.P.-V. Réun. Cons. Int. Explor. Mer. 140, 67–83.
Beverton, R. J. H., and Holt, S. J. (1957). On the Dynamics of Exploited Fish Populations. Great Britain: Ministry of Agriculture.
Brodziak, J., Ianelli, J., Lorenzen, K., and Methot, R. D. (2011). Estimating Natural Mortality in Stock Assessment Applications. Department Commerce, NOAA, Technical Memo, NMFS-F/SPO-199. Washington, DC: NOAA.
Caddy, J. F. (1991). Death rates and time intervals: is there an alternative to the constant natural mortality axiom? Rev. Fish Biol. Fish. 1, 109–138. doi: 10.1007/BF00157581
Caddy, J. F., and Mahon, R. (1995). Reference Points for Fisheries Management. FAO Fisheries Technical Paper. Rome: FAO, 347–383.
Cadigan, N. G. (2015). A state-space stock assessment model for northern cod, including under-reported catches and variable natural mortality rates. Can. J. Fish. Aquat. Sci. 73, 296–308. doi: 10.1139/cjfas-2015-0047
Carvalho, F., Punt, A. E., Chang, Y. J., Maunder, M. N., and Piner, K. R. (2017). Can diagnostic tests help identify model misspecification in integrated stock assessments? Fish. Res. 192, 28–40. doi: 10.1016/j.fishres.2016.09.018
Cheilari, A., and Raetz, H.-J. (2009). The effect of natural mortality on the estimation of stock state parameters and derived references for sustainable fisheries management. Proc. ICES Annu. Sci. Conf. 2009, 1–12.
Chen, S., and Watanabe, S. (1989). Age dependence of natural mortality coefficient in fish population dynamics. Nippon Suisan Gakkaishi 55, 205–208. doi: 10.2331/suisan.55.205
Clark, W. G. (1991). Groundfish exploitation rates based on life history parameters. Can. J. Fish. Aquat. Sci. 48, 734–750. doi: 10.1139/f91-088
Clark, W. G. (1999). Effects of an erroneous natural mortality rate on a simple age-structured stock assessment. Can. J. Fish. Aquat. Sci. 56, 1721–1731. doi: 10.1139/f99-085
Colloca, F., Cardinale, M., Maynou, F., Giannoulaki, M., Scarcella, G., Jenko, K., et al. (2013). Rebuilding Mediterranean fisheries: a new paradigm for ecological sustainability. Fish Fish. 14, 89–109. doi: 10.1111/j.1467-2979.2011.00453.x
Csirke, J., and Caddy, J. F. (1983). Production modeling using mortality estimates. Can. J. Fish. Aquat. Sci. 40, 43–51. doi: 10.1139/f83-007
European Commission [EC] (2000). Council Regulation European Commission [EC] No 1543/2000 of 29 June 2000 Establishing a Community Framework for the Collection and Management of the Data Needed to Conduct the Common Fisheries Policy. Brussels: European Commission.
European Commission [EC] (2013). Regulation (EU) No 1380/2013 on the Common Fisheries Policy. Brussels: European Commission.
European Commission [EC] (2017). Council Regulation (EC) No 1004/2017 of 17 May 2017 on the Establishment of a Union Framework for the Collection, Management and Use of Data in the Fisheries Sector and Support for Scientific Advice Regarding the Common Fisheries Policy and Repealing Council Regulation (EC) No 199/2008 (Recast). Brussels: European Commission.
FAO (2019). General Fisheries Commission for the Mediterranean. Report of the Twenty-First Session of the Scientific Advisory Committee on Fisheries, Cairo, Egypt, 24–27 June 2019 / Commission générale des pêches pour la Méditerranée. Rapport de la vingt-et-unième session du Comité scientifique consultative des pêches. Le Caire, Égypte, 24-27 juin 2019. FAO Fisheries and Aquaculture Report/FAO Rapport sur les pêches et l’aquaculture No. 1290. Rome: FAO.
Follesa, M. C., and Carbonara, P. (eds) (2019). Atlas of the Maturity Stages of Mediterranean Fishery Resources. Studies and Reviews. General Fisheries Commission for the Mediterranean. No. 99. Rome: FAO.
Gislason, H., Daan, N., Rice, J. C., and Pope, J. G. (2010). Size, growth, temperature and the natural mortality of marine fish. Fish Fish. 11, 149–158. doi: 10.1111/j.1467-2979.2009.00350.x
Götz, A., Kerwath, S. E., Attwood, C. G., and Sauer, W. H. H. (2008). Effects of fishing on population structure and life history of roman Chrysoblephus laticeps (Sparidae). Mar. Ecol. Prog. Ser. 362, 245–259. doi: 10.3354/meps07410
Gulland, J. A. (1965). Estimation of Mortality Rates. Annex to Arctic Fisheries Working Group Report ICES C. M. Doc 3. Copenhagen: ICES.
Gulland, J. A., and Boerema, L. K. (1973). Scientific advice on catch levels. Fish. Bull. 71, 325–335.
Hewitt, D. A., and Hoenig, J. M. (2005). Comparison of two approaches for estimating natural mortality based on longevity. Fish. Bull. 103, 433–437.
Hilborn, R., and Walters, C. J. (1992). Quantitative Fish Stock Assessment. Choice, Dynamics and Uncertainty. New York: Chapman and Hall, 570.
Hoenig, J. M. (1983). Empirical use of longevity data to estimate mortality rates. Fish. Bull. 82, 898–903.
Jardim, E., Millar, C. P., Mosqueira, I., Scott, F., Osio, G. C., Ferretti, M., et al. (2014). What is stock assessment is as simple as a linear model? The a4a initiative. ICES J. Mar. Sci. 72, 232–236. doi: 10.1093/icesjms/fsu050
Jensen, A. L. (1996). Beverton and Holt life history invariants result from optimal trade-off of reproduction and survival. Can. J. Fish. Aquat. Sci. 53, 820–822. doi: 10.1139/f95-233
Kell, L. T., Mosqueira, I., Grosjean, P., Fromentin, J., Garcia, D., Hillary, R., et al. (2007). FLR: an open-source framework for the evaluation and development of management strategies. ICES J. Mar. Sci. 64, 640–646. doi: 10.1093/icesjms/fsm012
Kenchington, T. J. (2013). Natural mortality estimators for information-limited fisheries. Fish Fish. 15, 533–562. doi: 10.1111/faf.12027
Konrad, C., Brattey, J., and Cadigan, N. G. (2016). Modelling temporal, and spatial variability in tag reporting-rates for Newfoundland cod (Gadus morhua). Environ. Ecol. Stat. 23, 387–.403. doi: 10.1007/s10651-016-0344-0
Lee, H.-H., Maunder, M. N., Piner, K. R., and Methot, R. D. (2011). Estimating natural mortality within a fisheries stock assessment model: an evaluation using simulation analysis based on twelve stock assessments. Fish. Res. 109, 89–94. doi: 10.1016/j.fishres.2011.01.021
Lorenzen, K. (2000). Allometry of natural mortality as a basis for assessing optimal release size in fish-stocking programmes. Can. J. Fish. Aquat. Sci. 57, 2374–2381. doi: 10.1139/f00-215
Magnusson, A., and Hilborn, R. (2007). What makes fisheries data informative? Fish Fish. 8, 337–358. doi: 10.1111/j.1467-2979.2007.00258.x
Mangel, M., MacCall, A. D., Brodziak, J., Dick, E. J., Forrest, R. E., Pourzand, R., et al. (2013). A perspective on steepness, reference points, and stock assessment. Can. J. Fish. Aquat. Sci. 70, 1–11. doi: 10.1139/cjfas-2012-0372
Martiradonna, A. (2012). Modelli di Dinamica Delle Popolazioni Ittiche: Stima dei Fattori di Incremento e Decremento Dello Stock. Bari: Tesi di Laurea Magistrale, Dipartimento di Matematica, Università di Bari.
Maunder, M. N., and Piner, K. R. (2017). Dealing with data conflicts in statistical inference of population assessment models that integrate information from multiple diverse data sets. Fish. Res. 192, 16–27. doi: 10.1016/j.fishres.2016.04.022
Maunder, M. N., Xu, H., Lennert-Cody, C. E., Valero, J. L., Aires-da-Silva, A., and Minte-Vera, C. (2020). Implementing Reference Point-Based Fishery Harvest Control Rules Within a Probabilistic Framework that Considers Multiple Hypotheses (No. SAC-11-INF-F), Scientific Advisory Commitee, Inter-American Tropical Tuna Commission. San Diego, CA: Scientific Advisory Commitee.
Pauly, D. (1980). On the interrelationships between natural mortality, growth parameters, and mean environmental temperature in 175 fish stocks. ICES J. Mar. Sci. 39, 175–192. doi: 10.1093/icesjms/39.2.175
Pauly, D., Ulman, A., Piroddi, C., Bultel, E., and Coll, M. (2014). ‘Reported’ versus ‘likely’ fisheries catches of four Mediterranean countries. Sci. Mar. 78, 11–17. doi: 10.3989/scimar.04020.17a
Perretti, C. T., Deroba, J. J., and Legault, C. M. (2020). Simulation testing methods for estimating misreported catch in a state-space stock assessment model. ICES J. Mar. Sci. 77, 911–920. doi: 10.1093/icesjms/fsaa034
Pope, J. G. (1972). An investigation in the accuracy of the virtual population analysis using cohort analysis. Res. Bull. Int. Comm. NW Atlantic Fish. 9, 65–74.
Punt, A. E., Butterworth, D. S., de Moor, C. L., De Oliveira, J. A. A., and Haddon, M. (2014a). Management strategy evaluation: best practices. Fish Fish. 17, 303–334. doi: 10.1111/faf.12104
Punt, A. E., Butterworth, D. S., de Moor, C. L., De Oliveira, J. A. A., and Haddon, M. (2016). Management strategy evaluation: best practices. Fish Fish. 17, 303–334. doi: 10.1002/9781118835531.ch5
Punt, A. E., Ferro, F. H., and Whitten, A. R. (2014b). Model selection for selectivity in fisheries stock assessments. Fish. Res. 158, 124–134. doi: 10.1016/j.fishres.2013.06.003
Quinn, T. J. II, and Deriso, R. B. (1999). Quantitative Fish Dynamics. Oxford: Oxford University Press.
R Core Team (2020). R: A Language and Environment for Statistical Computing. Vienna: R Foundation for Statistical Computing.
Ricker, W. E. (1975). Computation and Interpretation of Biological Statistics of Fish Populations. Ottawa: Bulletin of the Fisheries Research Board of Canada.
Rudd, M. B., Thorson, J. T., and Sagarese, S. R. (2019). Ensemble models for data-poor assessment: accounting for uncertainty in life-history information. ICES J. Mar. Sci. 76, 870–883. doi: 10.1093/icesjms/fsz012
Scott, F., Jardim, E., Millar, C. P., and Cerviño, S. (2016). An applied framework for incorporating multiple sources of uncertainty in fisheries stock assessments. PLoS One 11:e0154922. doi: 10.1371/journal.pone.0154922
STECF (2019a). Scientific, Technical and Economic Committee for Fisheries (STECF) –Evaluation of Fishing Effort Regime in the Western Mediterranean –part IV (STECF-19-14). Luxembourg: Publications Office of the European Union.
STECF (2019b). Scientific, Technical and Economic Committee for Fisheries (STECF) – Stock Assessments: Demersal stocks in the western Mediterranean Sea (STECF-19-10). Luxembourg: Publications Office of the European Union.
STECF (2019c). Scientific, Technical and Economic Committee for Fisheries (STECF) – 2019. Stock Assessments Part 2: European Fisheries for Demersal Species in the Adriatic Sea (STECF-19-16). Luxembourg: Publications Office of the European Union.
Stenseth, N. C., and Rouyer, T. (2008). Ecology: destabilized fish stocks. Nature 452, 825–826. doi: 10.1038/452825a
Then, A. Y., Hoenig, J. M., Hall, N. G., Hewitt, D. A., and Jardim, H. E. E. (2014). Evaluating the predictive performance of empirical estimators of natural mortality rate using information on over 200 fish species. ICES J. Mar. Sci. 72, 82–92. doi: 10.1093/icesjms/fsu136
Van Beveren, E., Duplise, D., Castonguay, M., Valcroze, T. D., Plourde, S., and Cadigan, N. (2017). How catch underreporting can bias stock assessment of and advice for northwest Atlantic mackerel and a possible resolution using censored catch. Fish. Res. 194, 146–154. doi: 10.1016/j.fishres.2017.05.015
Vasilakopoulos, P., Jardim, E., Konrad, C., Rihan, D., Mannini, A., Pinto, C., et al. (2020). Selectivity metrics for fisheries management an advice. Fish Fish. 21, 621–638. doi: 10.1111/faf.12451
Keywords: data limited stocks, Mediterranean Sea, reference points, stock status advice, stock assessment, natural mortality
Citation: Mannini A, Pinto C, Konrad C, Vasilakopoulos P and Winker H (2020) “The Elephant in the Room”: Exploring Natural Mortality Uncertainty in Statistical Catch at Age Models. Front. Mar. Sci. 7:585654. doi: 10.3389/fmars.2020.585654
Received: 21 July 2020; Accepted: 23 November 2020;
Published: 15 December 2020.
Edited by:
Giuseppe Scarcella, National Research Council (CNR), ItalyReviewed by:
Dimitrios K. Moutopoulos, University of Patras, GreeceErika M. D. Porporato, International Marine Centre Foundation, Italy
Copyright © 2020 Mannini, Pinto, Konrad, Vasilakopoulos and Winker. This is an open-access article distributed under the terms of the Creative Commons Attribution License (CC BY). The use, distribution or reproduction in other forums is permitted, provided the original author(s) and the copyright owner(s) are credited and that the original publication in this journal is cited, in accordance with accepted academic practice. No use, distribution or reproduction is permitted which does not comply with these terms.
*Correspondence: Alessandro Mannini, YWxlc3NhbmRyby5tYW5uaW5pQGVjLmV1cm9wYS5ldQ==
†ORCID: Alessandro Mannini, orcid.org/0000-0002-5910-3413; Christoph Konrad, orcid.org/0000-0002-9975-4704