 Marta Muñoz-Colmenero
 Ana Sánchez
 Begoña Correa
 Francisco G. Figueiras
 Jose L. Garrido
 Carmen G. Sotelo
- Instituto de Investigaciones Marinas (CSIC), Vigo, Spain
The smallest size fractions of plankton, nano- and pico-plankton, have been highlighted due to they accomplish key functions in marine ecosystems. However, the knowledge about some of them is scarce because they are difficult or impossible to be detected and identified with non-DNA-based methodologies. Here we have evaluated five DNA extraction protocols (MT1–MT5) and seven bioinformatic pipelines (P1–P7) to find the best protocol for detecting most of the eukaryotic species of nano- and pico-plankton present in an environmental sample using Ion Torrent technology. The protocol MT3 was the most reproducible methodology, showing less variation among samples, good DNA quality and sufficient quantity to amplify and sequence the eukaryote species, offering the best results after sequencing. For bioinformatic analyses, P1 and P7 resulted in the highest percentage of detection for the difficult-to-detect species in mock communities. However, only P1 avoided the confusion with other closed species during the taxonomic assignment. The final protocols, MT3-P1 (free) and MT3-P7 (private), showed good and consistent results when they were applied to an environmental sample, being a valuable tool to study the eukaryotes present in environmental samples of nano- and pico-plankton, even for the genera that are difficult to be detected by other techniques.
Introduction
The study of biodiversity is essential to understand the dynamics and functions of ecosystems, as well as their sustainability and resilience (Fonseca et al., 2010; Brose and Hillebrand, 2016). However, it is difficult to detect and identify all individuals present in an environmental sample, especially for those taxa with extremely low abundances (Zhan et al., 2013). In the case of marine environments, plankton have a key role as one of the major sources of matter and energy for pelagic food webs and are involved in biogeochemical cycles (Beaugrand, 2005). The study of plankton entails difficulties due to the small size of most of these organisms and the fact that they can be present in very low abundances or as part of small populations (Jerde et al., 2011; Zhan et al., 2013). Traditionally, for marine plankton sampling, fine-mesh nets or methods based on water collection and subsequent concentration have been used depending on the size and nature of the target organisms. Then, morphological and anatomical characteristics have been used to identify the organisms present in the samples (Zhan et al., 2013). These techniques are time consuming and require expert taxonomists for each target group (Abad et al., 2016), and high-resolution images of the organisms to be classified. However, morphological characteristics are not always sufficient for plankton identification and the problems associated with the tiny size of these organisms are even more important in the case of nano- and pico-plankton, some of which are very difficult, if not impossible, to be identified and quantified using flow cytometry, cytological or microscopy techniques (Massana et al., 2015). Likewise, in the case of bacterioplankton, traditional techniques, such as those culture-based methods, might lead to biased results since only cultured prokaryotes can be well characterized (García-Martínez and Rodríguez-Valera, 2000).
With the development of molecular systematics based on DNA markers, some of these drawbacks have been overcome, with organisms in very low abundances in the water now being detectable, independent of their size and even with only body parts available (Zaiko et al., 2018). Furthermore, DNA-based methodologies have become very useful for studying prokaryotes with culture-independent approaches (Lie et al., 2014), being in many cases the only option to identify both the prokaryotes and the smallest eukaryotic (Massana et al., 2015). Universal primers have been used for the molecular characterization of marine community biodiversity allowing the amplification of fragments with enough interspecific variation to discriminate the species present in an ecosystem. 16S rRNA genes for prokaryotes, or 18S rRNA genes or cytochrome c oxidase subunit I genes (COI) for eukaryotes, are the most commonly used (Bik et al., 2012; Lie et al., 2014). In the last decade, next-generation sequencing (NGS) technology has provided a cost-effective and fast tool to monitor biological communities in different environments and even detecting rare species (Borrell et al., 2018). This methodology is able to explore the species present in environmental samples, allowing also the simultaneous analysis of many samples, saving time and offering a substantial reduction in the cost per sample, which means a better and longer monitoring capacity than was achieved before (Rees et al., 2014). Because of these advantages, NGS has been used in several studies of marine plankton communities as a powerful tool for environmental monitoring, specifically in the case of the smallest sized organisms that are more difficult to identify (Kelly et al., 2014; Abad et al., 2017; Bennke et al., 2018). Several studies have been focused on prokaryotic plankton (e.g., Zinger et al., 2012; Massana and Logares, 2013; Aguirre et al., 2017; Lymperopoulou and Dobbs, 2017; Teira et al., 2019; Logares et al., 2020) however, the eukaryotic nano- and pico-plankton, despite being recognized as key components of these ecosystems because of their different ecological roles (Massana, 2011; Ganesh et al., 2014; Ribeiro et al., 2016; Kocum, 2020) are less known than eukaryotic microplankton since its size make it difficult to identify them by other approaches like microscopy.
However, studies using NGS are not exempt from the limitations inherent to DNA-based techniques and PCR amplification in most cases, such as the type of sample, method of DNA extraction, the selection of primers and amplicon targeting, PCR yield, or the limitations related to the sequencing method itself (e.g., Hart et al., 2015; Lee et al., 2017). Furthermore, another important factor that will determine the success of the analysis is the bioinformatic pipeline used, which includes specialized programs, such as those for pre-processing, the adequate database and algorithms for the taxonomic assignment, statistical analysis, evaluation of results, and graphical representation, capable of analyzing large volumes of data (Jünemann et al., 2017). The first objective of the present study is to test and select a DNA extraction method adequate, with the least possible bias, for marine nano- and pico-eukaryotic plankton species, some of which are considerably challenging to identify or have been impossible to identify through methodologies not based on DNA. The second objective is to evaluate the performance of different bioinformatic pipelines using 18S rRNA amplicon-sequencing data obtained with the Ion Torrent personal genome machine (PGM) and to check how the DNA extraction affect the sequencing results.
Materials and Methods
Pure Cultures, Mock Communities and Marine Environmental Samples
Six species that possibly occur in coastal marine environmental samples, including five eukaryotes and one prokaryote (Table 1), were selected to evaluate five DNA extraction methodologies (detailed below). These species were cultured in the laboratory in discontinuous culture without aeration in non-axenic conditions. Non-axenic state was the better way to culture these plankton species due to some bacteria provide them essential vitamins or growth factors (Lorenz et al., 2005). All cultures were grown in L1 enriched seawater medium (Guillard and Hargraves, 1993) and maintained at light irradiances of 100 μmol photons m–2 s–1 (12:12 light-dark cycles) at 15°C. The samples were taken at the mid-exponential phase, and from each pure culture, 5 mL were filtered in triplicate for each DNA extraction method tested, using polycarbonate filters of 47 mm and 0.2 μm pore sizes (Millipore) at 0.2 bar pressure. Then, each filter was placed into the recommended tube for each DNA extraction methodology and frozen at −80°C until their subsequent DNA extraction.
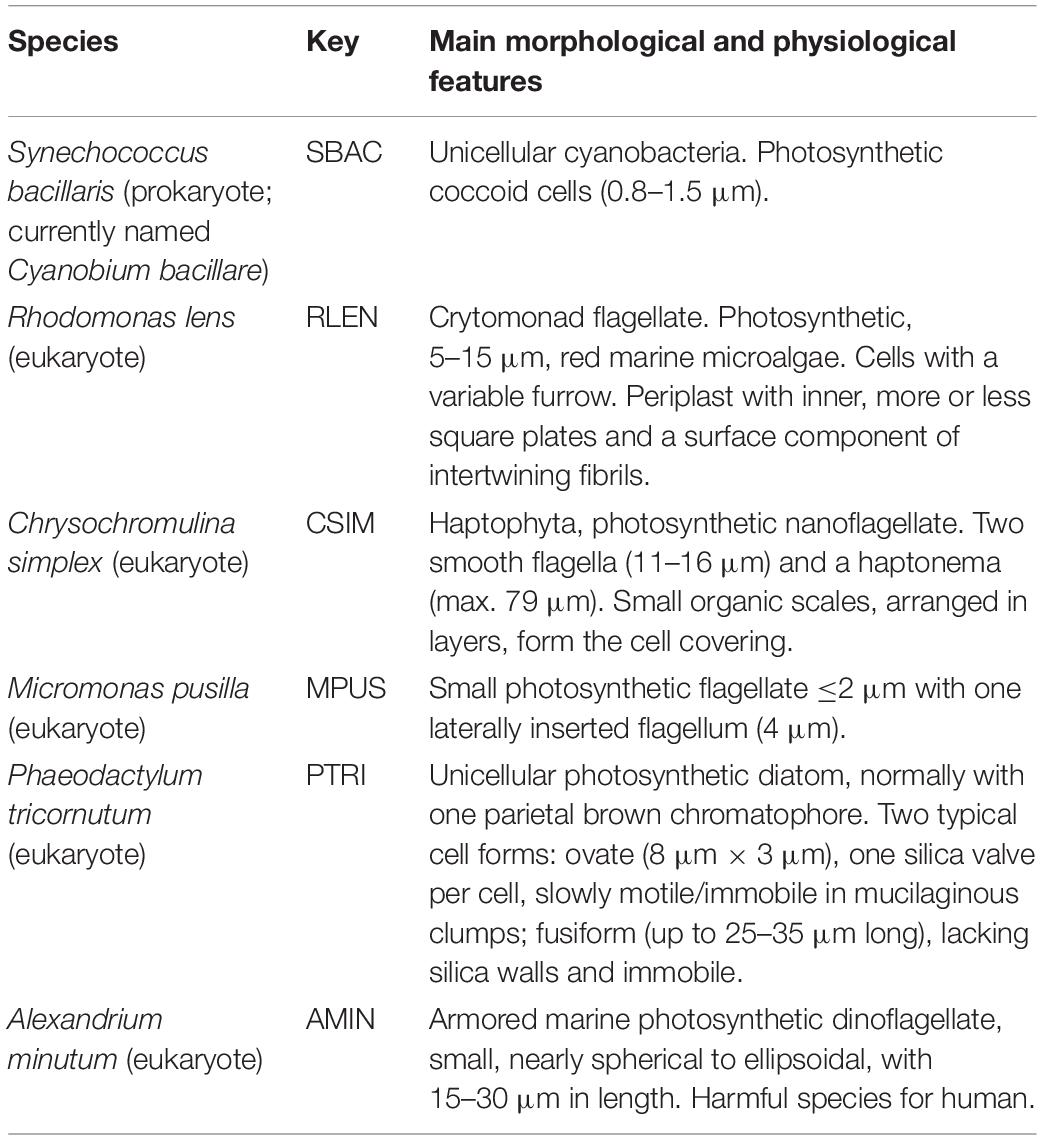
Table 1. Cultured phytoplankton species used for testing DNA extraction methods.
Three of these cultured species were selected to prepare three equal mock communities (technical replicates MK1, MK2, and MK3), including the prokaryote Synechococcus bacillaris (SBAC) and two eukaryotes, Micromonas pusilla (MPUS) and Chrysochromulina simplex (CSIM), with the aim of having species that could cover the differences in structure, size, etc. of the different species that we could find in the environment. The selected species are very different in size, morphology, and physiology (Table 1). Recently, it has been noted that the presence of C. simplex in the natural environment has been underestimated using traditional methods, such as microscopy (Shih et al., 2019); thus, the assessment of molecular methods to obtain an efficient identification of this species is very interesting. On the other hand, M. pusilla is one of the smallest marine eukaryotes known (Simon et al., 2017), offering several problems for its identification in marine samples. Finally, S. bacillaris has been included as a control of the potential influence of common marine prokaryotes on our methodology. Each mock was processed by triplicate.
The cell concentration in each of the three selected cultures was estimated with a FACSCalibur flow cytometer (Becton Dickinson, Franklin Lakes, NJ, United States) equipped with laser emission at 488 nm and located in a constant temperature room at the Institute of Marine Research (CSIC). The volume of each of the three cultures used to prepare the mock communities was calculated to achieve a final solution composed of 33.3% of each individual species, with a total of 1.70 × 10⁶ cells mL–1 (97.25 mL). Three subsamples of each mock community (MK1, MK2, and MK3) were filtered (5 mL) in the same way as the pure cultures (0.2 μm filters).
In addition, one environmental sample was obtained from Ria de Vigo, Spain (42.233003, −8.743599; 2018/11/16). This sample was sequentially filtered through 20, 2, and 0.2 μm pore-size filters, separating the three plankton fractions, micro-plankton, nano-plankton, and pico-plankton, respectively.
DNA Extraction
Five DNA extraction methodologies were selected as follows after a bibliographic review: three commercial DNA extraction kits, one DNA extraction protocol with salt precipitation, and a generic DNA extraction protocol combined with a commercial resin for recovering the DNA. These methods were used to extract DNA from the pure cultures of phytoplankton species. Protocols specified by the manufacturers were followed for the commercial kits. The E.Z.N.A.® Water DNA Kit (Omega Bio-Tek, Norcross, GA, United States) (MT1) is specific for the isolation of microorganisms in water samples and has 50 mL tubes in which to place the completely unfolded filter. This kit uses a combination of mechanical lysis with glass beads, buffer lysis, specific reagents to efficiently remove the potential contaminants, and spin columns with a membrane to retain the DNA. The Metagenomic DNA Isolation Kit for water (EpicentreBio) (MT2) is focused on the isolation of high molecular weight nucleic acids from microbiota present in water samples and has 50 mL tubes in which to place the filter. This methodology involves enzymatic lysis (with proteinase K and lysozyme) and buffer lysis with RNAse to improve the release of bacterial DNA. In this case, precipitation with isopropanol and ethanol is used to recover the DNA. The third commercial kit selected was the DNeasy PowerWater Kit (QIAGEN) (MT3), which is also specific for extracting microorganisms from filtered water samples using a protocol similar to that of MT1, with beads, buffer lysis, and specific reagents to remove contaminants, and spin columns with a membrane to retain the DNA. The fourth method tested (MT4) uses salt precipitation (Aljanabi, 1997; Harding et al., 2011), with additions of lysozyme, proteinase K and SDS. This protocol is not specific for water samples but was used successfully by Dasilva et al. (2014) to extract DNA from water samples. The last protocol tested (MT5) was the same as that used by Sánchez et al. (2014), which consists of a lysis step including the addition of 1.72 mL of lysis buffer (1% SDS, 150 mM NaCl, 2 mM EDTA, 10 mM Tris-HCl pH 8), 200 μL of 5 M guanidine thiocyanate, and 80 μL of proteinase K (≥20 Unit mg–1) and incubation at 56°C overnight (with the addition of an extra 80 μL of proteinase K after 2–3 h). The next day, the sample was centrifuged at 13,000 rpm for 5 min, and the supernatant was recovered; this step was repeated twice. Then, 1 mL of supernatant and 1 mL of Wizard resin (Wizard DNA Clean-Up System, Promega) were mixed (per tube), and hereafter, the resin manufacturer’s guidelines were followed to isolate and recover the DNA.
The extracted DNA was quantified (ng/μL) by fluorimetry using a Qubit v3.0 fluorimeter (Life Technologies) and a Qubit dsDNA HS assay kit (Qubit®; ref: Q32851) and the DNA quality was examined through the ratio A260/A280, determined by a spectrophotometer. An ANOVA test was performed with R (version 3.4.4) to evaluate the effect of the “DNA extraction method” and “species” factors. In addition, the DNA concentration, analysis time, cost per sample, and reproducibility were also evaluated for each DNA extraction method. Finally, the efficiency of the DNA extraction was indirectly estimated. Efficiency is the percentage of DNA extracted out of the total amount present in the sample. Since, knowing that amount is not an easy task in samples of living organisms, in most published works, yield is used as a proxy for estimating the efficiency of one particular DNA extraction method (i.e., Davis et al., 2019).
Amplification and Sequencing of Extracted DNA
DNA extracted from all pure cultures was amplified by PCR using the kit “READY TO GO” (GE Healthcare ref: 407513-SRT), following the manufacturer’s conditions, with the forward (1389F) 5′-TTGTACACACCGCCC-3′ and reverse (1510R) 5′-CCTTCYGCAGGTTCACCTAC-3′ primers described by Amaral-Zettler et al. (2009). These primers amplify a fragment of the hypervariable V9 region of the 18S rRNA gene in eukaryotes, which is appropriate for the main objective of this study; however, the primers are also able to amplify the non-specific 16S rRNA gene in some prokaryotes, producing a variable size amplicon (87–186 pb). PCR was performed in a Veriti Thermal Cycler (Applied Biosystems), and the PCR conditions were as follows: an initial cycle at 95°C for 3 min, followed by 30 cycles of 30 s at 95°C, 30 s at 57°C for annealing and 1 min at 72°C plus 7 min at 72°C for elongation. Positive or negative amplifications were confirmed with agarose gels stained with RedSafe nucleic acid staining solution (20,000×, Intron Biotechnology). Two positive reactions per species were selected, purified and sequenced to verify the species. PCR products were purified with ExoSAP-ITTM PCR Product Cleanup (Thermo Fisher) following the manufacturer’s instructions. The sequencing reaction was performed in an ABI PRISM 310 Genetic Analyser (Applied Biosystems), employing BigDye Terminator Cycle v1.1 sequencing chemistry (Thermo Fisher). The sequences were edited using BioEdit v7.2.5 software (Hall, 1999), and the nucleotide BLAST tool from the NCBI database1 was used to check the species assignment.
DNA extracted from mock communities, and environmental sample filters were amplified using the same primers, reagents, and PCR conditions as those used for pure cultures. The PCR product purification was carried out using “AMPure XP” reagent (Beckman Coulter; ref: A63881)/“MAG-BIND Total Pure NGS” (OMEGA; ref VWR: M1378-00), and all PCR products were quantified by fluorimetry using Qubit 3.0 with dsDNA HS Assay Kits. All samples were barcoded with “Ion Express barcode adapters 1–16” (Thermo Fisher; ref 4471250) to recognize each sample in the downstream analyses. The “ION PLUS FRAGMENT LIBRARY KIT” (Thermo Fisher; ref.: 4471252) was used for binding the barcodes and the adapters for the Ion PGM sequencer and preparing the amplicon libraries. Purification of the libraries was performed with “AMPure XP” reagent. Then, the libraries were double-quantified by Qubit 3.0 and qPCR using the Ion Library TaqMan Quantification Kit (Thermo Fisher; ref: 4468802) in an ABI 7500 Fast Real-time PCR system. The quality of the libraries was also determined with an Agilent 2100 Bioanalyzer. Two equimolar pools of barcoded libraries were prepared at the highest possible concentration (one 55 pM pool with 11 samples and another 50 pM pool with 10 samples). These pools were loaded in two Ion 314TM Chip v2 BC (Life Technologies) chips. The reagents used in this step were those included in the Ion PGM Hi-Q Chef Kit (Life Technologies). Then, the chips were transferred to an Ion PGMTM sequencer (Life Technologies) for sequencing the samples using 650 flows. Low-quality and polyclonal sequences were filtered automatically by the PGM software, and PGM adaptors and barcodes were trimmed. Finally, the PGM software performed demultiplexing, giving one ∗.bam file and one ∗.fastq file per sample.
Evaluation of Different Bioinformatic Pipelines Used in Mock Community Analyses
The sequences obtained by PGM (985,858 total reads) were used as input to evaluate different bioinformatic approaches, and the results were compared for their detection ability for the species present in the mock communities. This was measured as the percentage of detection for each species, which is understood here as the relative abundance of each species in a sample (number of reads for each species), respect to the total of reads obtained for that sample. Four pipelines based on QIIME v1.9 (Caporaso et al., 2010) and QIIME v2-2018.4 (Bolyen et al., 2018) were tested (Figure 1).
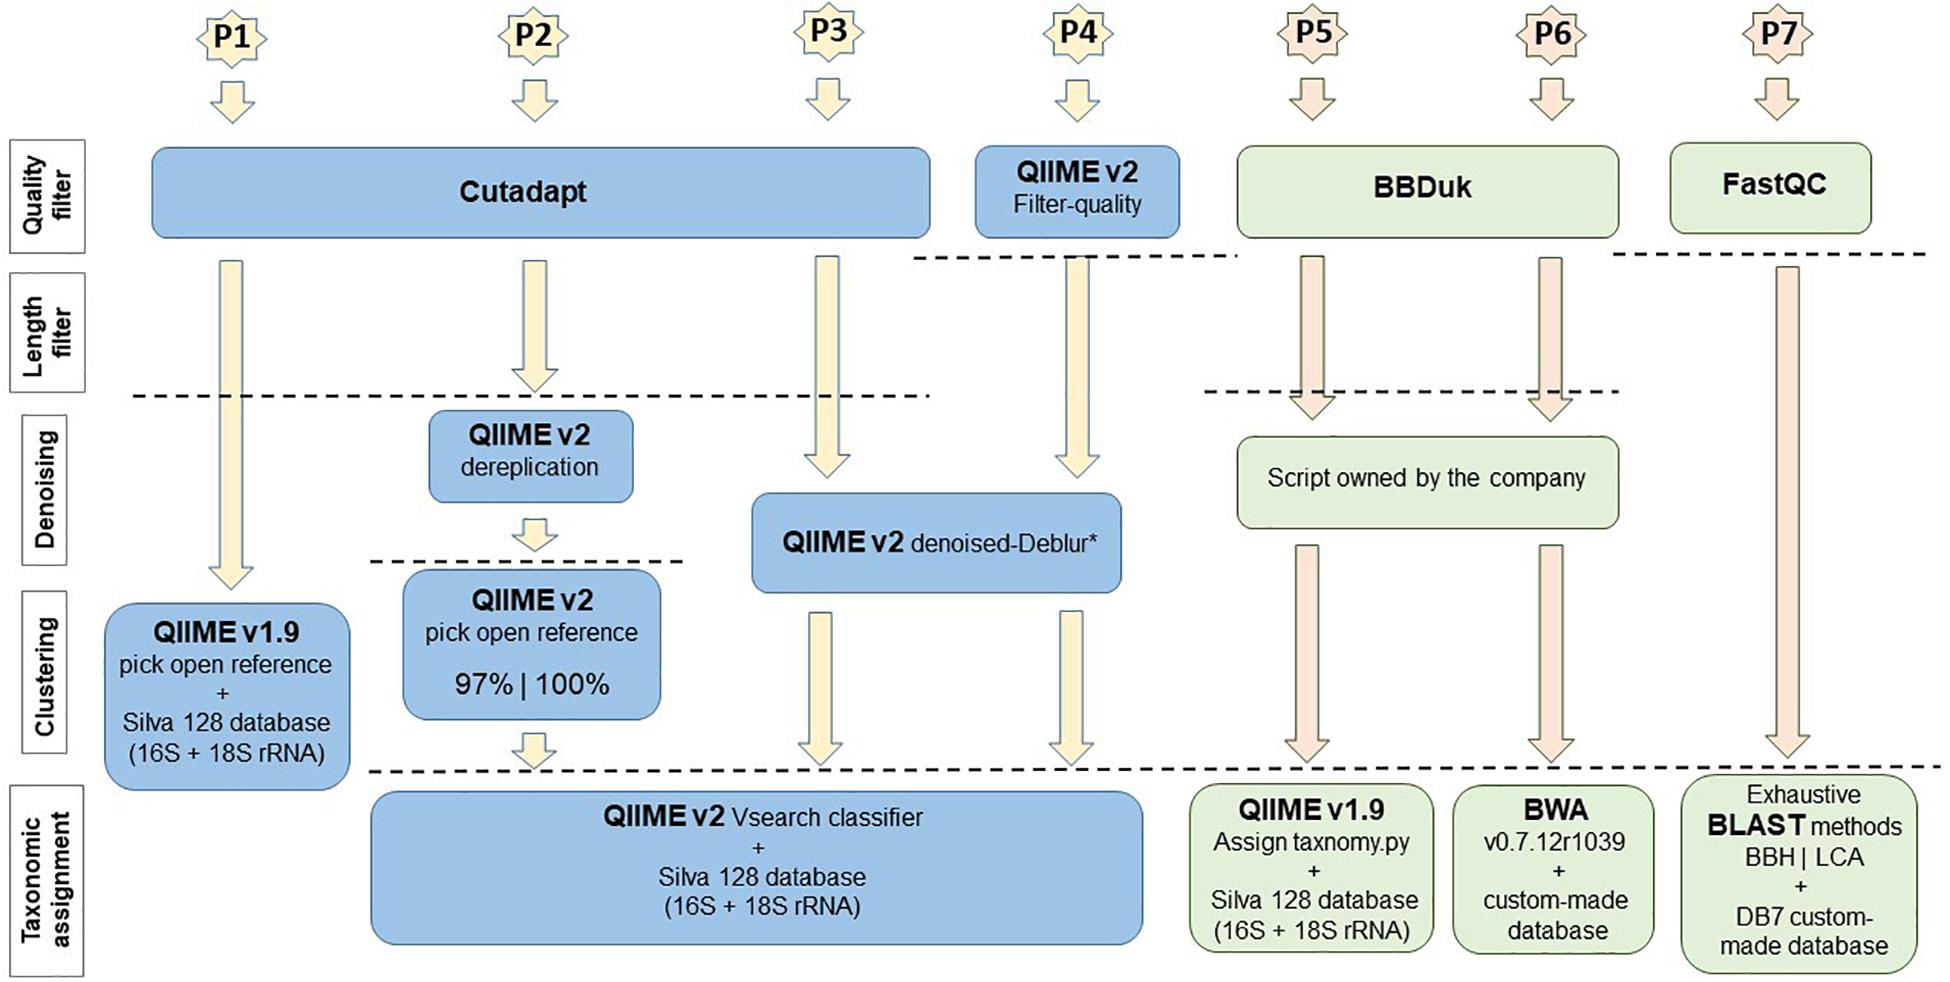
Figure 1. Software and main plugins used in each pipeline (P1–P7) examined in the bioinformatic analyses. Pipelines performed by private companies are in orange and green colors. (*) QIIME v2 denoised-Deblur only works with sequences with similar/equal length, so it is needed to define a length threshold (maximum length) if the amplicons analyzed have high length variability.
Briefly, in the pipeline-1 (P1), the sequences were filtered by quality (Q ≥ 20 as threshold) and by minimum length (l ≥ 75) using Cutadapt software v1.16 (Martin, 2011). Then, QIIME v1.9 platform was used for clustering sequences with 97% similarity into operational taxonomic units (OTUs) and performing the taxonomic assignment through the script pick_open_reference_otus.py, which uses the UCLUST program (Edgar, 2010) by default. The database used for the taxonomic assignment was SILVA version 1282, containing 16S and 18S rRNA genes. All OTUs that were detected less than 10 times in the dataset were removed using the QIIME v1.9 script filter_otus_from_otu_table.py. For pipeline-2 (P2), pipeline-3 (P3), and pipeline-4 (P4), different plugins of the QIIME2 new version were tested. In P2, after quality and length filters by Cutadapt, the OTU-picking and taxonomy assignment were performed by QIIME v2 with the most similar option to the pick_open_reference_otus.py script of QIIME v1.9, named Open-reference clustering of features in QIIME v2 (Rognes et al., 2016). This script uses the Vsearch program instead of UCLUST. Two percentages of similarity were tested, 97 and 100%, for the OTU clustering. The taxonomic assignment was performed with the Vsearch classifier and SILVA v128 database and the OTUs that were detected less than 10 times were also removed using the equivalent script for QIIME v2. In the case of P3, after Cutadapt filters, new options of QIIME v2, independent of OTU clustering, were used for performing denoising and for creating the “feature table” with the variants (frequency table equivalent to OTU-table in QIIME v1.9). These steps were performed with the QIIME v2 script qiime deblur denoise-other (Amir et al., 2017) using a trimming length of 120 bp for denoising. The taxonomic assignment and filtering were performed as in P2. Finally, when P4 was applied, the initial quality filter was performed with the QIIME v2 script qiime quality-filter q-score (Bokulich et al., 2013) instead of Cutadapt, and the rest of the steps were carried out as in P3.
In addition, the sequences were sent to two different companies specializing in bioinformatic analyses, SEQUENTIA biotech [pipeline-5 and pipeline-6 (P5 and P6)] and ERA7 bioinformatics [pipeline-7 (P7)] (Figure 1). In P5 and P6, the sequences were filtered by quality (Q ≥ 20) and minimum length (l ≥ 35) through BBDuk (version 2015/12/10). Then, the OTU-table was created with a script owned by the company and two different approaches were used to map the sequences. In P5 QIIME v1.9 script assign_taxonomy.py was used with default settings and 90% of minimum similarity against the SILVA version 128 database (16S + 18S rRNA). In P6 GAIA (bioinformatics approach from the company SEQUENTIA) was used, which applies BWA v0.7.12r1039 to map the sequences against a custom-made database containing 16S and 18S rRNA genes from the NCBI public database3 (accessed at 2017/05/29). The sequences were classified into the most specific taxonomic level using an in-house lowest common ancestor (LCA) algorithm, applying the thresholds 97, 93, 85, 73, and 70% to classify the species, genus, family, phylum and domain levels, respectively. Finally, in P7, an initial quality evaluation was performed with the FastQC application4. Then, the sequences were assigned to a taxonomic tree node based on their similarity to 16S and 18S rRNA included in the DB7 database (constructed by the company from the RNA central database5). The taxonomic assignment was performed using the MG7 method (Alekhin et al., 2015) based on an exhaustive BLAST search against the database. These taxonomic assignments followed two paradigms: the best BLAST hit assignment (BBH) and LCA.
Microbial Community Analyses of Mock and Environmental Sample Results With Pipeline-1
The mock dataset was normalized using the script single_rarefaction.py (QIIME v1.9). The OTUs were clustered by taxonomic group and data were export to Excel where bar plots showing the abundances of the taxa (%) were created. The phyloseq package included in R (version3.4.4) was utilized to calculate the alpha diversity as “observed_otus” and Chao-1 index. A PCoA based on Bray Curtis metrics was also performed with the same R package and a statistical ANOSIM and Adonis test, employing the script compare_categories.py (QIIME v1.9), were used to evaluate whether the community recovered from mock samples was significantly different according to the DNA extraction method applied (MT2 and MT3 selected in previous steps; see Results). The core community, understood here the taxa that were found in the 90% of the samples, was also calculated for the samples extracted with each method, MT2 and MT3, using the script compute_core_microbiome.py (QIIME v1.9), and a Venn diagram was created online6 (accessed 10th May 2017) to know what OTUs were exclusive for each DNA extraction method. Then, to determine whether the shared OTUs were present in different abundances depending on the DNA extraction method, a Kruskal–Wallis test was carried out using the script group_significance.py (QIIME v1.9).
Regarding the environmental samples, DNA sequences from each of the filters were normalized in the same way as the mock samples. For each filter, the OTUs were also clustered by taxonomic groups and represented in a bar plot.
Results and Discussion
Comparison of DNA Extraction Methods for Pure Cultures of Marine Phytoplankton Species
DNA extraction is one of the critical factors influencing the obtained community profiles in an NGS study (Lekang et al., 2015; Walden et al., 2017; Liu et al., 2019). In the case of the analysis of nano- and pico-plankton communities, with a large variety of species, and even some of them difficult to identify by traditional methods, the challenge is to find DNA extraction methods suitable to most of them. Here, we evaluated five DNA extraction methods for six phytoplankton species, S. bacillaris, Rhodomonas lens, C. simplex, M. pusilla, Phaeodactylum Tricornutum, and Alexandrium minutum, which present different biological features, both in terms of size and the presence of external structures, such as different kind of cell walls and/or silica plaques, and are commonly found in coastal systems as part of the nano- and pico-plankton. The amount of DNA obtained with the different extraction methods was variable among and within species (Figure 2). In fact, significant differences were found for DNA extraction methods (F = 21.18; p < 0.001) and species (F = 41.30; p < 0.001), being also significant their interaction (F = 11.82; p < 0.001). This was expected due to the important differences in structure and size that present the organisms analyzed, which are a reflection of the high variety of morphologies present in these organisms in environmental samples. One surprising finding was the low DNA extraction yield detected for the dinoflagellate AMIN with all methods, considering that the dinoflagellates have large genomes that contain 3–250 pg of DNA per cell (Galluzi et al., 2010). One possibility for this finding is that the fluorescent dye used by the Qubit for DNA quantification may not have bound properly to the double-stranded DNA due to the permanent chromosome condensation observed in these organisms (Hackett et al., 2004). In addition, a low efficiency in DNA extraction could be also due to the presence of thecal plates in this organism.
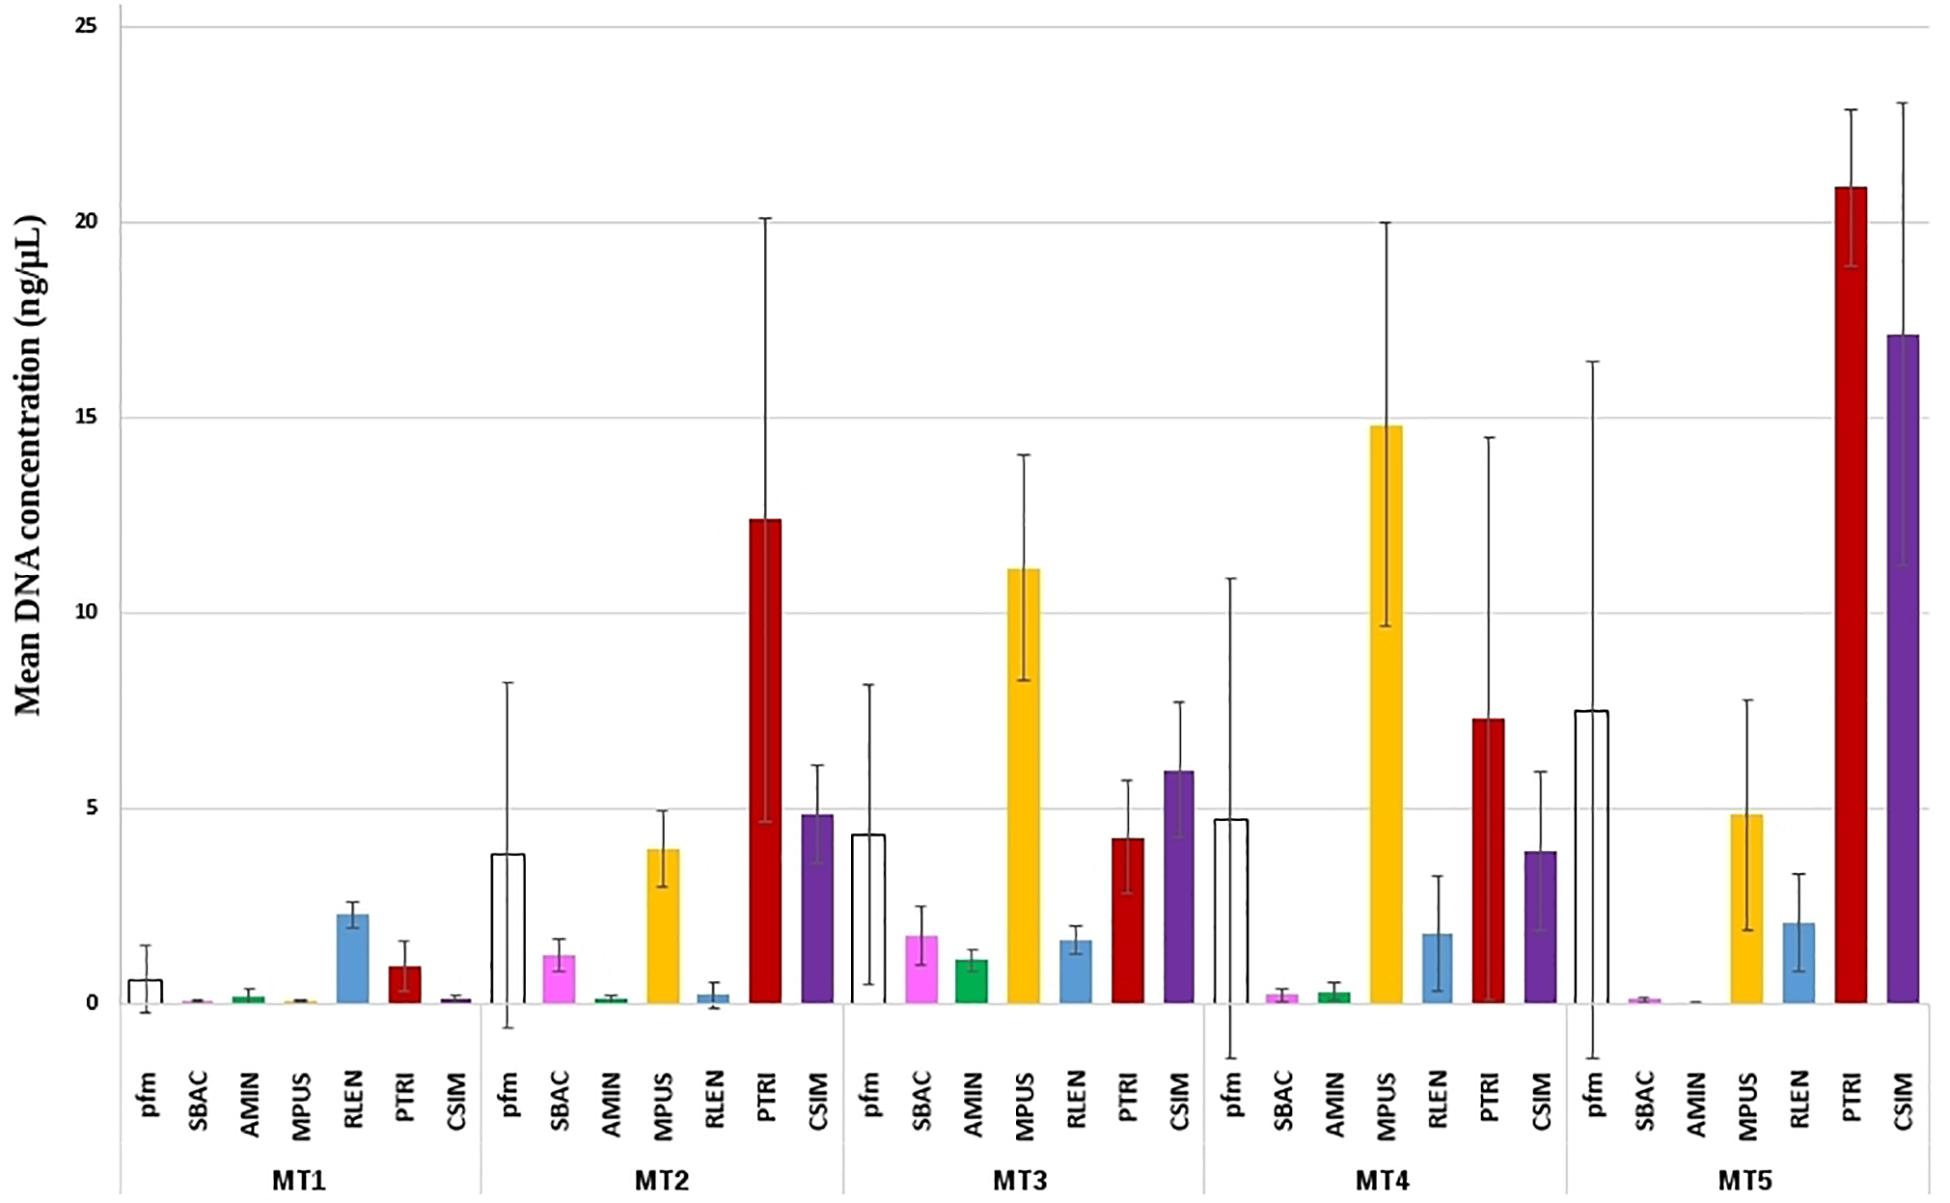
Figure 2. Mean DNA concentration obtained after DNA extractions from pure cultures of phytoplankton species. Mean DNA concentration (ng/μL) obtained from each pure culture of six phytoplankton species with the five DNA extraction methods studied and SD (error bars). MT1, Omega Bio-Tek Kit; MT2, EpicentreBio kit; MT3, QIAGEN Kit; MT4, Salt precipitation; MT5, Wizard resin. pfm, DNA extraction method’s overall performance; SBAC, S. bacillaris; AMIN, A. minutum; MPUS, M. pusilla; RLEN, R. lens; PTRI, P. tricornutum; CSIM, C. simplex.
Regarding DNA extraction method, the absorbance data obtained for the samples extracted with MT1 was too low, as well as the amount of DNA obtained, and was discarded. Other authors (e.g., Chen et al., 2013; Wu et al., 2014) have used this method in environmental samples with success, but the results might be not comparable since they studied bacterial communities in different freshwater environments. DNA yield values obtained by MT4 and MT5 showed very high SD values within species (Figure 2 and Supplementary Figure 1), and non-homogeneous results among the species, so these methods did not seem suitable for a study of environmental samples where these species could appear together.
In DNA-based studies of environmental samples, it is essential to make a particular effort to obtain a realistic representation of DNA from the whole community of target organisms present in the sample, which will guarantee obtaining a DNA library that closely reflects the species composition of the community (Tringe and Rubin, 2005). To this end, the DNA extraction method must exhibit a similar lysis efficacy and DNA recovery for all species and thus cause as little bias as possible during the DNA extraction step (Tringe and Rubin, 2005). Following that requisite, the best results were obtained with MT2 (Metagenomic) and MT3 (MoBio Power Water Kit), because they showed (Figure 2): (1) the lowest DNA extraction yield difference among species, (2) the lowest SD values between replicates, (3) a sufficient DNA amount recovered, and (4) an acceptable DNA quality for a successful PCR with a mean A260/A280 ratio of 1.8 (SD 0.20) for MT2 and of 2 (SD 0.40) for MT3 (Supplementary Table S1). These protocols include additional lysis using enzymes (MT2) or beads (MT3) to ensure the efficient breaking of the cell, which is considered very important in DNA extraction of phytoplankton that usually requires mechanical lysis to break down the cell wall and to release the nucleic acids (Djurhuus et al., 2017; Orsi et al., 2018). Furthermore, these protocols were the shortest of all methods tested, which is an additional advantage due to the time-savings achieved compared with other methods (Table 2).
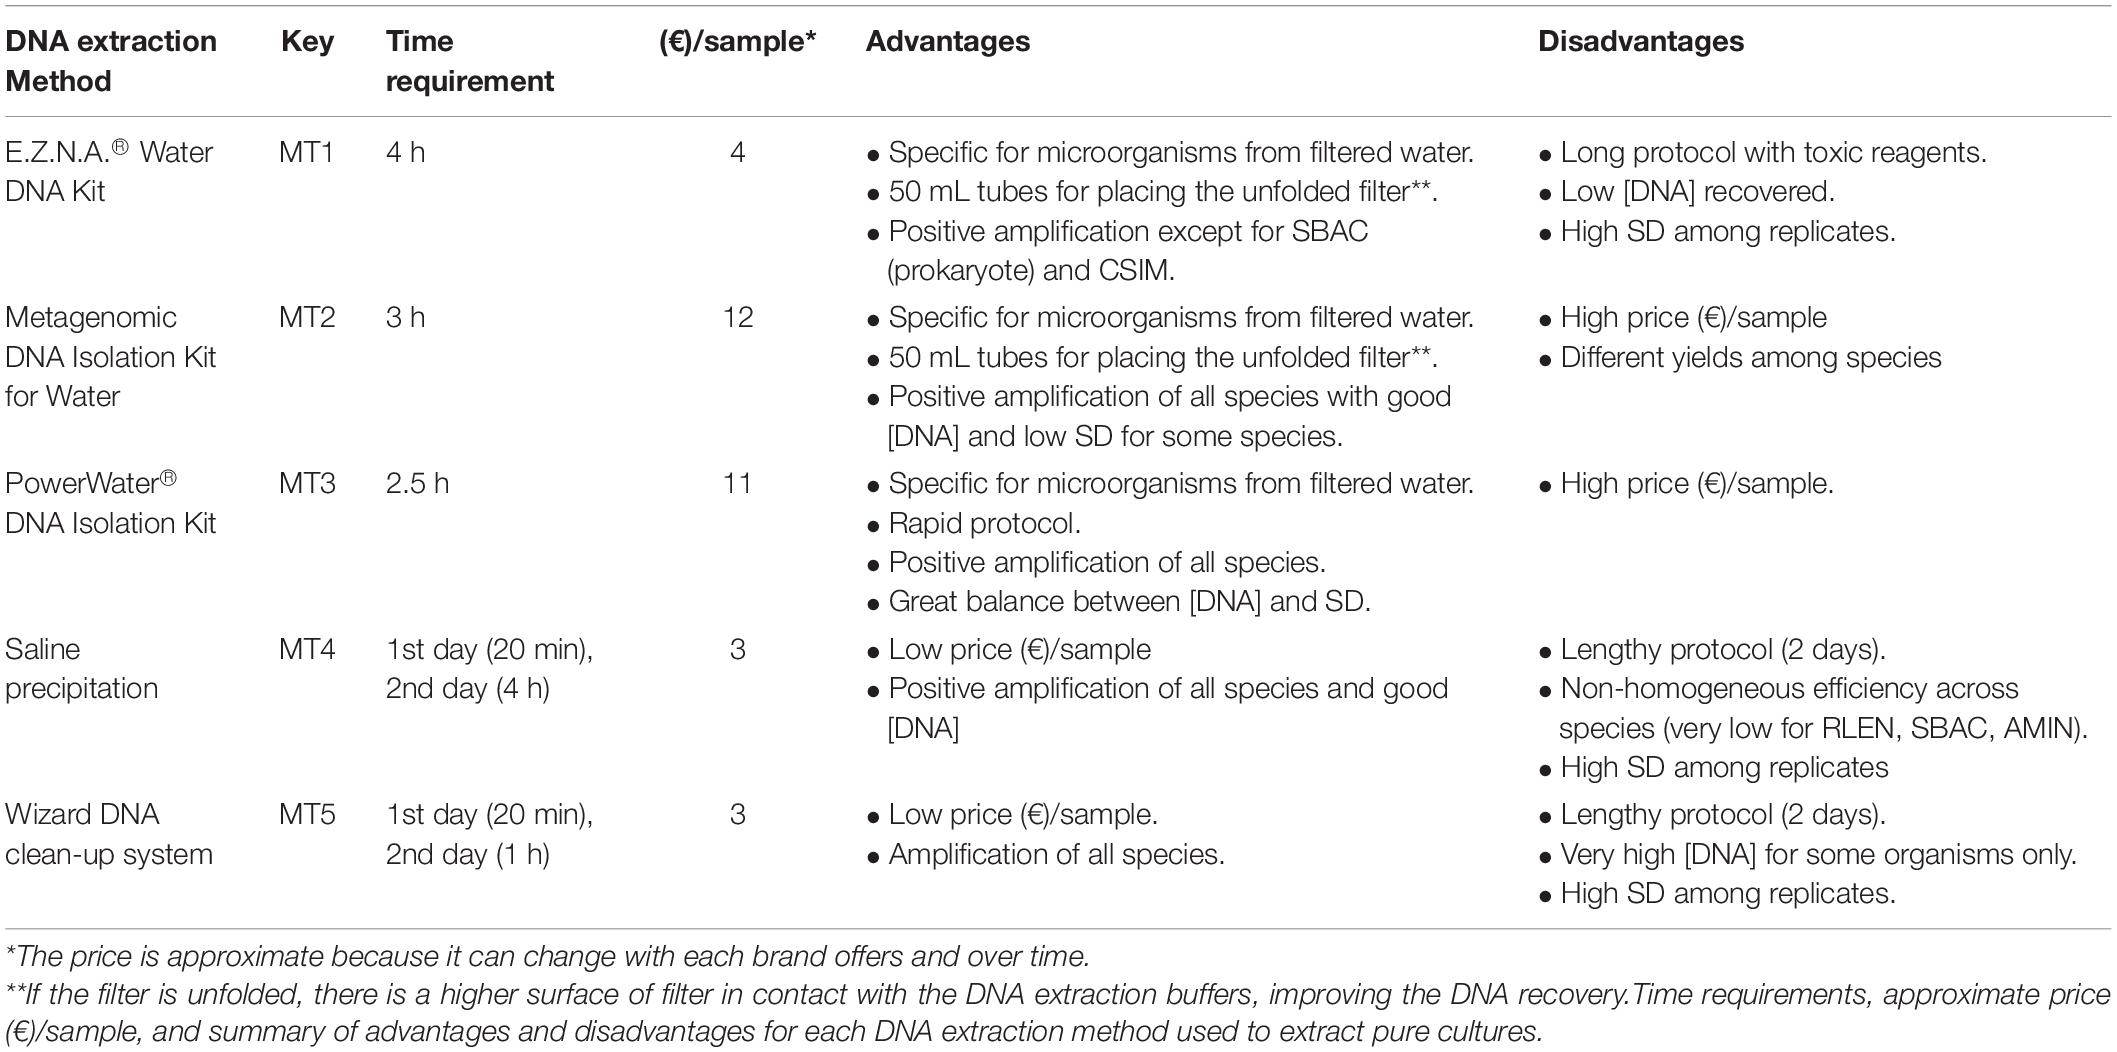
Table 2. Summary of the specifications of DNA extraction kits.
Amplification and Sequencing of 18S rRNA Gene From Non-axenic Pure Cultures
In terms of PCR, it was possible to obtain the expected amplicon using the primers from Amaral-Zettler et al. (2009) in all cases except for CSIM and SBAC extracted with MT1, which did not amplify, probably due to the very low DNA concentration recovered (as mentioned above). In addition, all the negative controls were negative, demonstrating that our reagents from commercial kits were free form contaminants, so we can assume that contamination by reagents is not affecting our DNA extractions. To evaluate the specificity of the primers for these species, some amplicons were sequenced by Sanger methodology. BLAST results showed high percentages of identity (≥97%) with sequences of the target species in the NCBI database for RLEN, PTRI, AMIN, MPUS. In the case of the CSIM sequence, the BLAST result showed a high percentage of identity with C. simplex (93%), as expected, but also presented a very similar percentage (92%) with another species of the same genus, Cryptocoryne parva. C. simplex had lower coverage with the reference sequence than C. parva in the database (54 and 72%, respectively). This is explained by the fact that the C. simplex sequences in the database were not obtained from the same 18S rRNA fragment that we amplified. With these similar values of identity and low coverage of the sequences, the classification of this species would be more conservative at the genus level than at species level, in order to avoid confusion with other species, such as the freshwater species C. parva, when we use this marker and GenBank database. In the case of the prokaryote SBAC, the amplicon obtained resulted in a sequence that was not pure; mixed peaks were observed in the electropherogram, as was expected for a non-axenic culture. It must be noted that, though these 18S rRNA primers target eukaryote DNA, they also amplify 16S rRNA from some prokaryotes (Amaral-Zettler et al., 2009). However, the Synechococcus genus has a high number of mismatches (8) with the reverse primer, and this species could have not amplified or have had low amplification, in favor to other bacteria present in the sample, explaining the mixed peaks in the electropherogram. Nonetheless, using Sanger sequencing it was not possible to determine whether Synechoccous was also amplified among the peaks. NGS methodologies were needed to determine what different bacterial species were amplified.
Comparison of DNA Extraction Methods for Mock Communities
Four DNA extraction methods (MT1 was excluded as mentioned above) were evaluated again with three equal mock communities which included two eukaryotic species, CSIM and MPUS, selected among the pure cultures for being the most difficult to identify and with different size and structures, and the prokaryotic species, SBAC, that was included to check the specificity of the posterior amplification protocol in mixed samples. This controlled community, with only three species, is simple but include species that cover the differences in structure, size, etc. that can be found in the environment and could influence the extraction or subsequent sequencing of its DNA, such as size (Micromonas versus Chrysochromulina), influence of the presence of prokaryotes in the recovery of eukaryotic DNA, and presence of structures such as scales, flagella, or haptonema.
The quality of DNA for the mock samples was more similar among DNA extraction methods, except MT5, which was the methodology that produced the lowest values. Mock community replicates showed high variability in DNA concentrations depending on the DNA extraction method used (Figure 3). According to the previous results for the pure cultures, the greatest variability was observed for MT4 and MT5, within mock samples and among them. MT5 provided the lowest DNA concentration [total mean 7.02 ng/μL (SD 4.33), 4.42 ng/μL (SD 3.29) for MT4 and MT5, respectively] and was the methodology that produced the lowest values of DNA quality (Supplementary Table S1). Although MT4 and MT5 have given good results in the extraction of some marine organisms, for example oyster larvae (Sánchez et al., 2014) or marine pico-plankton (Dasilva et al., 2014), these protocols are not specific for performing DNA extraction from marine water samples and might not be efficient for the extraction from water-filtered samples. In the present work, MT4 and MT5 were the least reproducible methods, not being adequate for DNA extraction of the nano- and pico-plankton species tested. A possible reason for their poor performance can be the absence of mechanical disruption for breaking the cells that are especially rigid, e.g., with beads, which can contribute to lower lysis efficiency and recovery of less DNA with these protocols.
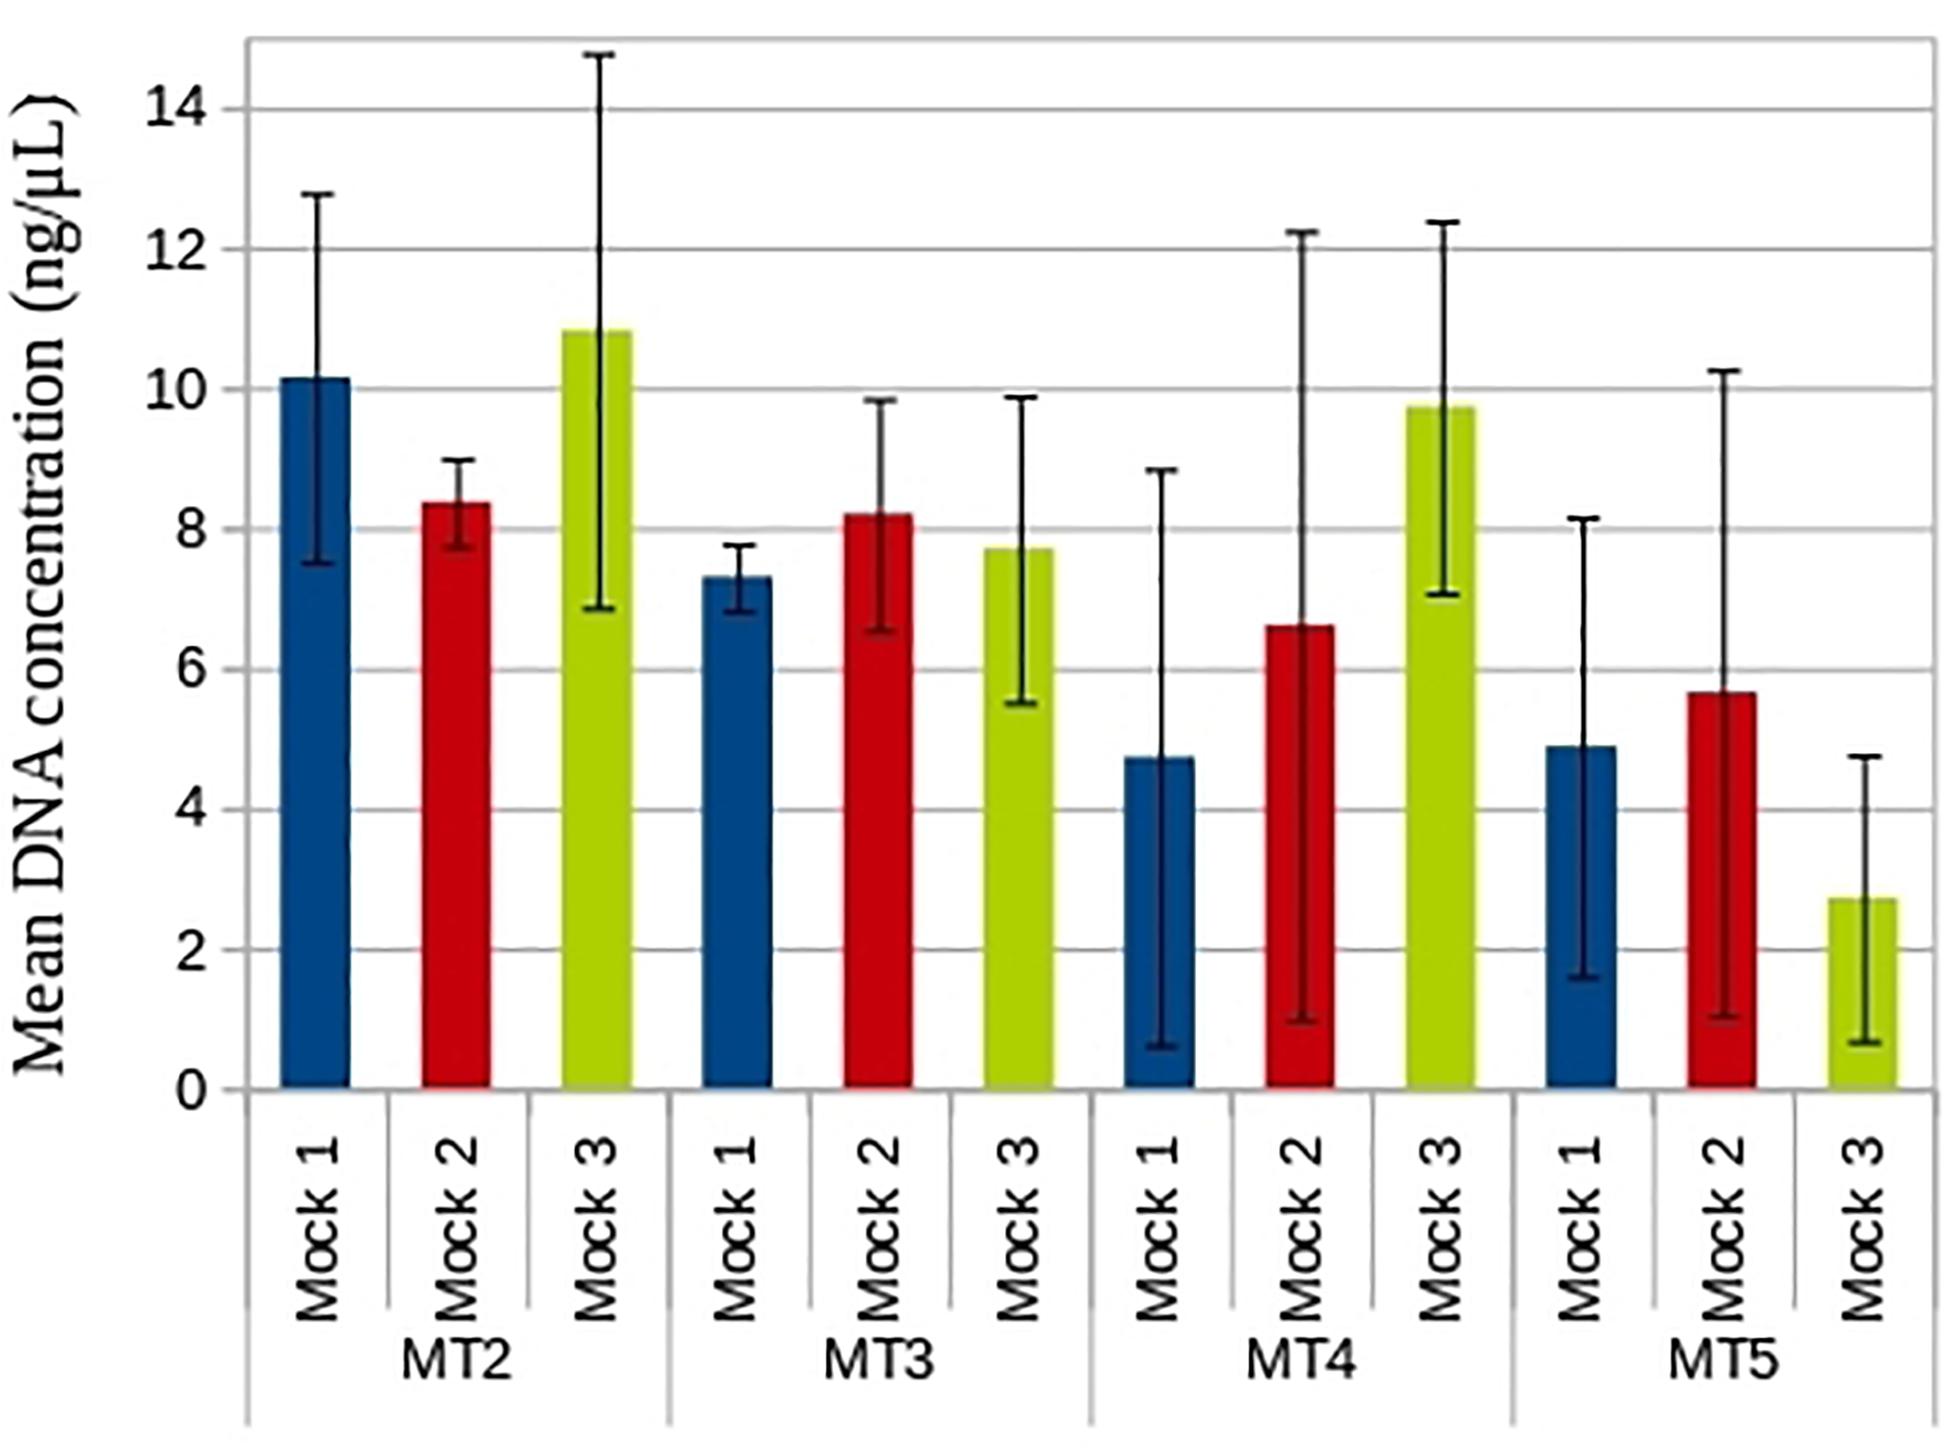
Figure 3. Mean DNA concentration obtained with the different DNA extraction methods used with the mock communities. DNA concentration (ng/μL) was measured by fluorimetry and SD (black line) was calculated.
On the other hand, both MT2 and MT3 showed generally higher yields and better reproducibility, with the lowest SD values across the mock communities tested [total average 9.78 ng/μL (SD 2.64) and 7.73 ng/μL (SD 1.44), respectively]. These results agree with those obtained with the pure cultures. Therefore, MT2 and MT3 can be considered the most suitable, among the tested, for the extraction of samples of small plankton with a mixture of distinct eukaryotic plankton species with very different characteristics and sizes (e.g., Chrysochromulina and Micromonas). When we compare both methods, MT2 was slightly-less accurate (SD value was higher), likely due to the DNA precipitation step using isopropanol and ethanol instead of spin columns, which ultimately contributes to the reproducible recovery of DNA. Furthermore, MT3 uses beads for physical disruption, breaking the cells more efficiently, which has been shown to produce higher yields during the extraction (Orsi et al., 2018), contributing to the better reproducibility of the process. This method has been also praised because its PCR inhibitor removal, improving PCR amplification and data quality (e.g., Shu et al., 2020). In addition, this protocol is one of the most commonly recommended for large biodiversity studies, such as the Earth Microbiome Project and Ocean Sampling Day, and has demonstrated good yields and comparable richness estimates with several genetic markers (Djurhuus et al., 2017). Consequently, at this point of the workflow of the present work, MT3 seems to be the best methodology to extract DNA from water samples of eukaryotic nano- and pico-plankton.
Detection of the Mock Species With Different Bioinformatic Pipelines
DNA extracted from mock samples with MT2 and MT3 protocols, as the two best options, were amplified and sequenced using the Ion Torrent PGM platform. The mean of reads per sample was 45,578 for samples extracted with MT2 and 45,334 for samples extracted with MT3. After quality filters and taxonomy assignment, the results obtained for marine nano- and pico-plankton species used to prepare the mocks were used for the comparative analysis of the pipelines (Supplementary Table S2). Most of the pipelines were based on the QIIME platform following different analysis strategies and the objective was to select the pipeline able to give better detection of the species included in the mock communities, which present big differences in structure, size, etc. During the analysis, two of the replicates, MK3.1.MT2 (Sample 21 in P1) and MK3.1.MT3 (Sample 7 in P1) presented divergent results (Supplementary Table S2), so they were removed from further analyses.
The selected prokaryote Synechococcus, which was included with the purpose of comparing the specificity of the molecular marker used to target eukaryotic species, was not detected with any of the pipelines used, despite the potential of NGS to detect lower amounts of DNA. Thus was already suspected from the analysis of Synechococcus DNA sequences obtained through Sanger sequencing and after NGS analysis we can point out that this particular set of primers is unable to amplify this species efficiently. Due to these primers used were designed to amplify mainly eukaryotes, even though they can amplify DNA from some bacteria, it is not guaranteed that the whole prokaryotic community will be targeted (Amaral-Zettler et al., 2009). Therefore, for studies of prokaryotes, which was not the aim of this work, other more specific primers, should be employed.
Regarding the detection of the two eukaryotes included in the mock communities, the results were different depending on the pipeline used. The theoretical expected results for each species included into the mock community would be 33% for each one, since each species was included as one third of the mock community with the same number of cells. However, since these cultures were non-axenic this expected percentage could be lower than 33%.
The best results for the target eukaryotic species were obtained with pipelines P1 and P7, which gave the highest and closest percentages to the theoretically expected 33% for the Chrysochromulina genus (Figure 4). The average of detection for Chrysochromulina with P1 was 12.99% (samples extracted with MT2) and 22.87% (samples extracted with MT3). For M. pusilla, the average of detection was much lower than those for Chrysochromulina, with a detection of 0.74% (samples extracted with MT2) and 3.95% (samples extracted with MT3) at the genus level. In the case of P7 (private company), for the Chrysochromulina genus, the results were slightly better than those obtained with P1 in the case of samples extracted with MT3. The RNA central database was used in P7, which is connected to several databases, including SILVA. Therefore, the small differences in the detection percentages might come from the availability of more Chrysochromulina sequences from these other databases. However, despite having more available information from the databases, the assignment at the species level from P7 was not improved and C. simplex was misidentified as other species of the same genus, as previously discussed with Sanger sequences and BLAST identification for this species. In this sense, the algorithm applied in P1 is more conservative, i.e., the assignment is performed at the upper taxonomic levels whilst definitive assignments are not produced for the lower taxonomic levels, such as in the case of Chrysochromulina. For M. pusilla species, P7 assigned all sequences to the correct species, but the percentage detected was slightly lower for this genus than the percentage obtained using P1.
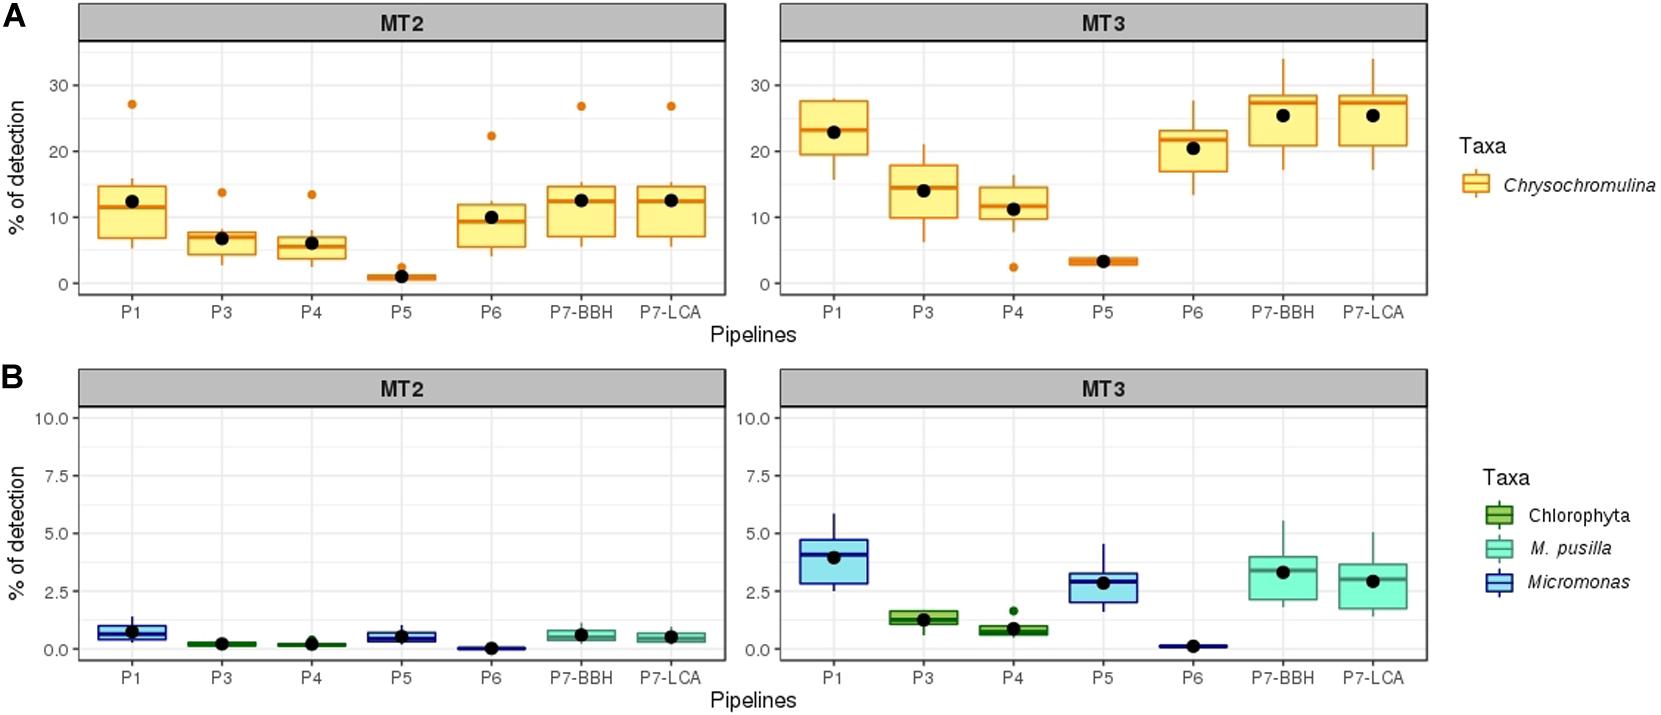
Figure 4. Percentage of detection of the eukaryote species used in mock communities with the pipelines evaluated. The results were separated per each DNA extraction method. The mean is showed as a black point. (A) Percentage of detection for Chrysochromulina genus. (B) Percentage of detection for Micromonas pusilla at different taxonomic levels depending on the pipeline used.
The rest QIIME pipelines tested in our laboratory (P2, P3, and P4) resulted in lower detection percentages for both eukaryotic species. P2 was the only pipeline unable to resolve any of the two species included in the mock communities at the species or genus level. The difference between P2 and P1 was the version of QIIME used. Both applied the open reference OTU-picking process, but the software used for carrying out the OTU-picking script was different for each version. In P1, UCLUST was used (by default), which is no longer available in QIIME v2, whereas in P2 Vsearch was used among one of the possible options of the new QIIME version, because it gave the best results during the taxonomic assignment in the previous test with our data. It must be noted that Vsearch implemented in QIIME v2 was tested in mock communities in which fragments of 16S rRNA and ITS had been sequenced with the Illumina platform, and no tests were performed for 18S rRNA neither with the Ion Torrent PGM7 (accessed April, 2018). Therefore, different settings might be needed for the Ion Torrent PGM sequences analyses, which may explain the poor results obtained with P2. In the case of P3 and P4 both resolved low percentages for the Chrysochromulina genus, with slight differences in favoring selection of P3, and were not able to detect M. pusilla even at the genus level, but only at the phylum level (Chlorophyta), demonstrating low taxonomic power for these sequences and/or Ion Torrent PGM methodology (Figure 4; details per replicate in Supplementary Table S2). QIIME v2 was officially implemented since January 1, 2018, when the support of QIIME v1.9 ended. In this new version, in addition to the aforementioned modifications in the OTU-picking process, two new methodologies for creating the renamed “feature table” have been included (old OTU-tables), dada2 and deblur, being the last one selected for this work because gave better results in previous analysis. These methodologies follow a new algorithm that creates groups based on unique sequences called “variants” (equivalent to OTUs based on 100% similarity). However, these methodologies do not support high length variability among the sequences8 (accessed April, 2018), which was the case in this work, so we had to trim our sequences to the same length. This shortening of the amplicon may cause some losses of information, thus decreasing the taxonomic resolution of the assignment because amplicon length is a limiting factor (Hugerth et al., 2014). In addition, as mentioned above, these new algorithms were tested with Illumina data mainly, so the parameters used may not be suitable for our data obtained with Ion Torrent PGM technology. It is known that each sequencer and sequencing technology have specific characteristics, strengths and weaknesses that may modify the results (D’Amore et al., 2016), so data from different platforms are not considered completely comparable. In new versions of QIIME v2 (the currently released QIIME v2 2020.8 version), the developers have designed new options for analyses, among which there is a new plug-in called “denoise-pyro: Denoise and dereplicate single-end pyrosequences” that is adapted to data from pyrosequencing and Ion Torrent, which was not available in the version used for our analyses. This new plugin could facilitate the use of QIIME v2 with other platforms, such as Ion Torrent PGM, expanding the type of work for which this platform can be used.
Finally, the pipelines P5 and P6, performed by one private company different than P7 showed lower percentages of detection than P1 and P7 for the two eukaryotic species (Figure 4), with a lower number of sequences detected for the Chrysochromulina genus (P5) and even a lower detection percentage for Micromonas (P6). One striking result was the large difference between the results obtained by P5 and P1; both pipelines used QIIME v1.9 against the same database for the taxonomic assignment. The main difference between them was the OTU-table construction process, which was performed through a private algorithm in the case of P5, whereas in P1 the algorithm used was that is included inside the open reference out-picking script.
Size Bias on Detection of Eukaryotic Species
Independent of the pipeline and DNA extraction method used (MT2 or MT3), a considerably higher proportion of Chrysochromulina than Micromonas was detected, and despite the same number of cells was included in the mock communities for each of them. The DNA extraction process did not seem to be the constraint because a higher DNA concentration was obtained for M. pusilla than for C. simplex when they were extracted from pure cultures using the MT3 protocol. This differential amplification and sequencing results could be due to the known correlation between the size of the genome and the ribosomal copy number variation, especially in eukaryotes (Prokopowich et al., 2003). Micromonas is a very small species with reduced organelles (Worden et al., 2009) and therefore a smaller genome. Due to that it is probable that Chrysochromulina presents a higher copy number of ribosomal DNA and/or more accessible DNA compared with Micromonas. The ribosomal copy number variation is one of the issues because this methodology is considered only semi-quantitative (Bik et al., 2012). When interpreting NGS results of environmental samples, species with small nucleus and low gene copy numbers may display minor occurrence in the final NGS results even if having a high total biomass (Mäki et al., 2017). This bias produced by the ribosomal copies (and genome size), which is indirectly correlated with the size of the organisms, can be minimized in marine samples of plankton using filters to separate the different fractions of the plankton, e.g., micro-, nano-, and pico-plankton, thus allowing the separate amplification and sequencing of organisms of similar size (approach implemented here for the environmental sample). On the other hand, other authors suggest to face this bias through bioinformatic analyses. In this line, recently Gong and Marchetti (2019) have proposed a new computational method to estimate the 18S gene copy number in some species of marine eukaryotic phytoplankton, discovering large interspecies differences, and emphasizing the need to apply corrections that can improve the accuracy of quantitative eukaryotic microbial community profiles. However, until those bioinformatic methodologies can be used commonly, it is essential to carry out studies as the current one where different methodologies are tested to find the procedure that resolve the most realistic taxonomic assignment and abundances for the target organisms.
Evaluation of the Effect of the DNA Extraction Methods, MT2 and MT3, on the NGS Results of the Mock Communities
It is known that the method of DNA extraction is a critical step that will determine the community diversity recovered from a sample, which means that the DNA extraction method may have an impact on the sequencing output, over- or under-representing specific organisms from different environments (Hart et al., 2015). Environmental samples contain cells with diverse cell properties, varying in size, firmness of cell walls or additional structures that may favor certain cell types depending on the DNA extraction protocol used (Mäki et al., 2017). Independent of the pipeline used for the bioinformatic analyses, a higher percentage of detection for the two target species was obtained from samples extracted with MT3 than with MT2, so this methodology seems to be more effective for extracting DNA from these challenging planktonic species (Figure 4). As we commented before, MT3 has an additional mechanical lysis step with beads to improve the recovering of DNA from the cells. The protocols with this sort of lysis are considered the most suited to micro-eukaryotes detection than enzymatic non-bead-beating methods, since they break down cell walls or firmer cells more effectively, being able to double the yield of DNA obtained for some phytoplankton species (Yuan et al., 2015; Liu et al., 2019).
For a further evaluation of the effects of these two DNA extraction methods to the recovered community, the NGS results analyzed with P1 were selected, which gave one of the best results with a more conservative taxonomic assignment and without the additional cost of a private company. According to the fact that the cultures used to prepare the mock were non-axenic, other species, besides the three main cultured species, were expected. The richness values for both DNA extraction methods, MT2 and MT3, were very similar (Supplementary Figure 2), as expected for non-axenic mocks formed by only three species. However, the structure of the plankton community recovered from the mock communities was significantly different according to the DNA extraction method used, MT2 or MT3, as a separate grouping was observed in the PCoA (Supplementary Figure 3) and the ANOSIM (R = 0.835; P = 0.001) and Adonis test (R2 = 0.504; P < 0.001) were significant. According to our results, Liu et al. (2019) also found great differences in the structure of the community recovered when they applied different DNA extraction methods to eukaryotic plankton communities, but a similar richness. Like this one, other studies have detected preference for specific taxa depending on the protocol of extraction used (Santos et al., 2017; Velásquez-Mejía et al., 2018). In our case, and focusing only on the taxa detected in 90% of the samples extracted by each DNA extraction method, the most abundant eukaryotic taxa were Chrysochromulina > Micromonas for MT3 and Chrysochromulina > Rhizobiales for MT2 (Supplementary Figure 4). MT3 was the extraction protocol that more closely reflected the target species intentionally included in the mock community. Comparing the composition at the OTU level, 37 OTUs were shared between both DNA extraction methods (Figure 5), whereas 6 OTUs were exclusive for MT3 and 10 OTUs were exclusive for MT2 (Supplementary Table S3). Within the shared OTUs between the two extraction methods, 21 OTUs had significantly different abundances according to the DNA extraction method used (Supplementary Table S4). Interestingly, all OTUs detected in higher abundance in samples extracted with MT2 belonged to the bacterial kingdom, whilst in those extracted with MT3, the majority of the OTUs were eukaryotes (Supplementary Table S4). This is according to the higher amount of bacteria detected in the samples extracted with MT2 protocol. Due to the cultures were non-axenic we expected some other additional organisms in the results, as Rhodobacteraceae bacteria family, which is commonly associated with the marine environment (Pujalte et al., 2014). After sequencing we obtained an unbalanced number of sequences associated with this bacteria family, likely due to its higher DNA sequence similarity with the primers used, together with a possible undetected increase of this bacteria in the samples. The amount of this bacteria was lower for MT3 (mean 71.98%) than MT2 (mean 86.67) (Supplementary Figure 4) confirming again that MT3 is more adequate to analyze eukaryote species.
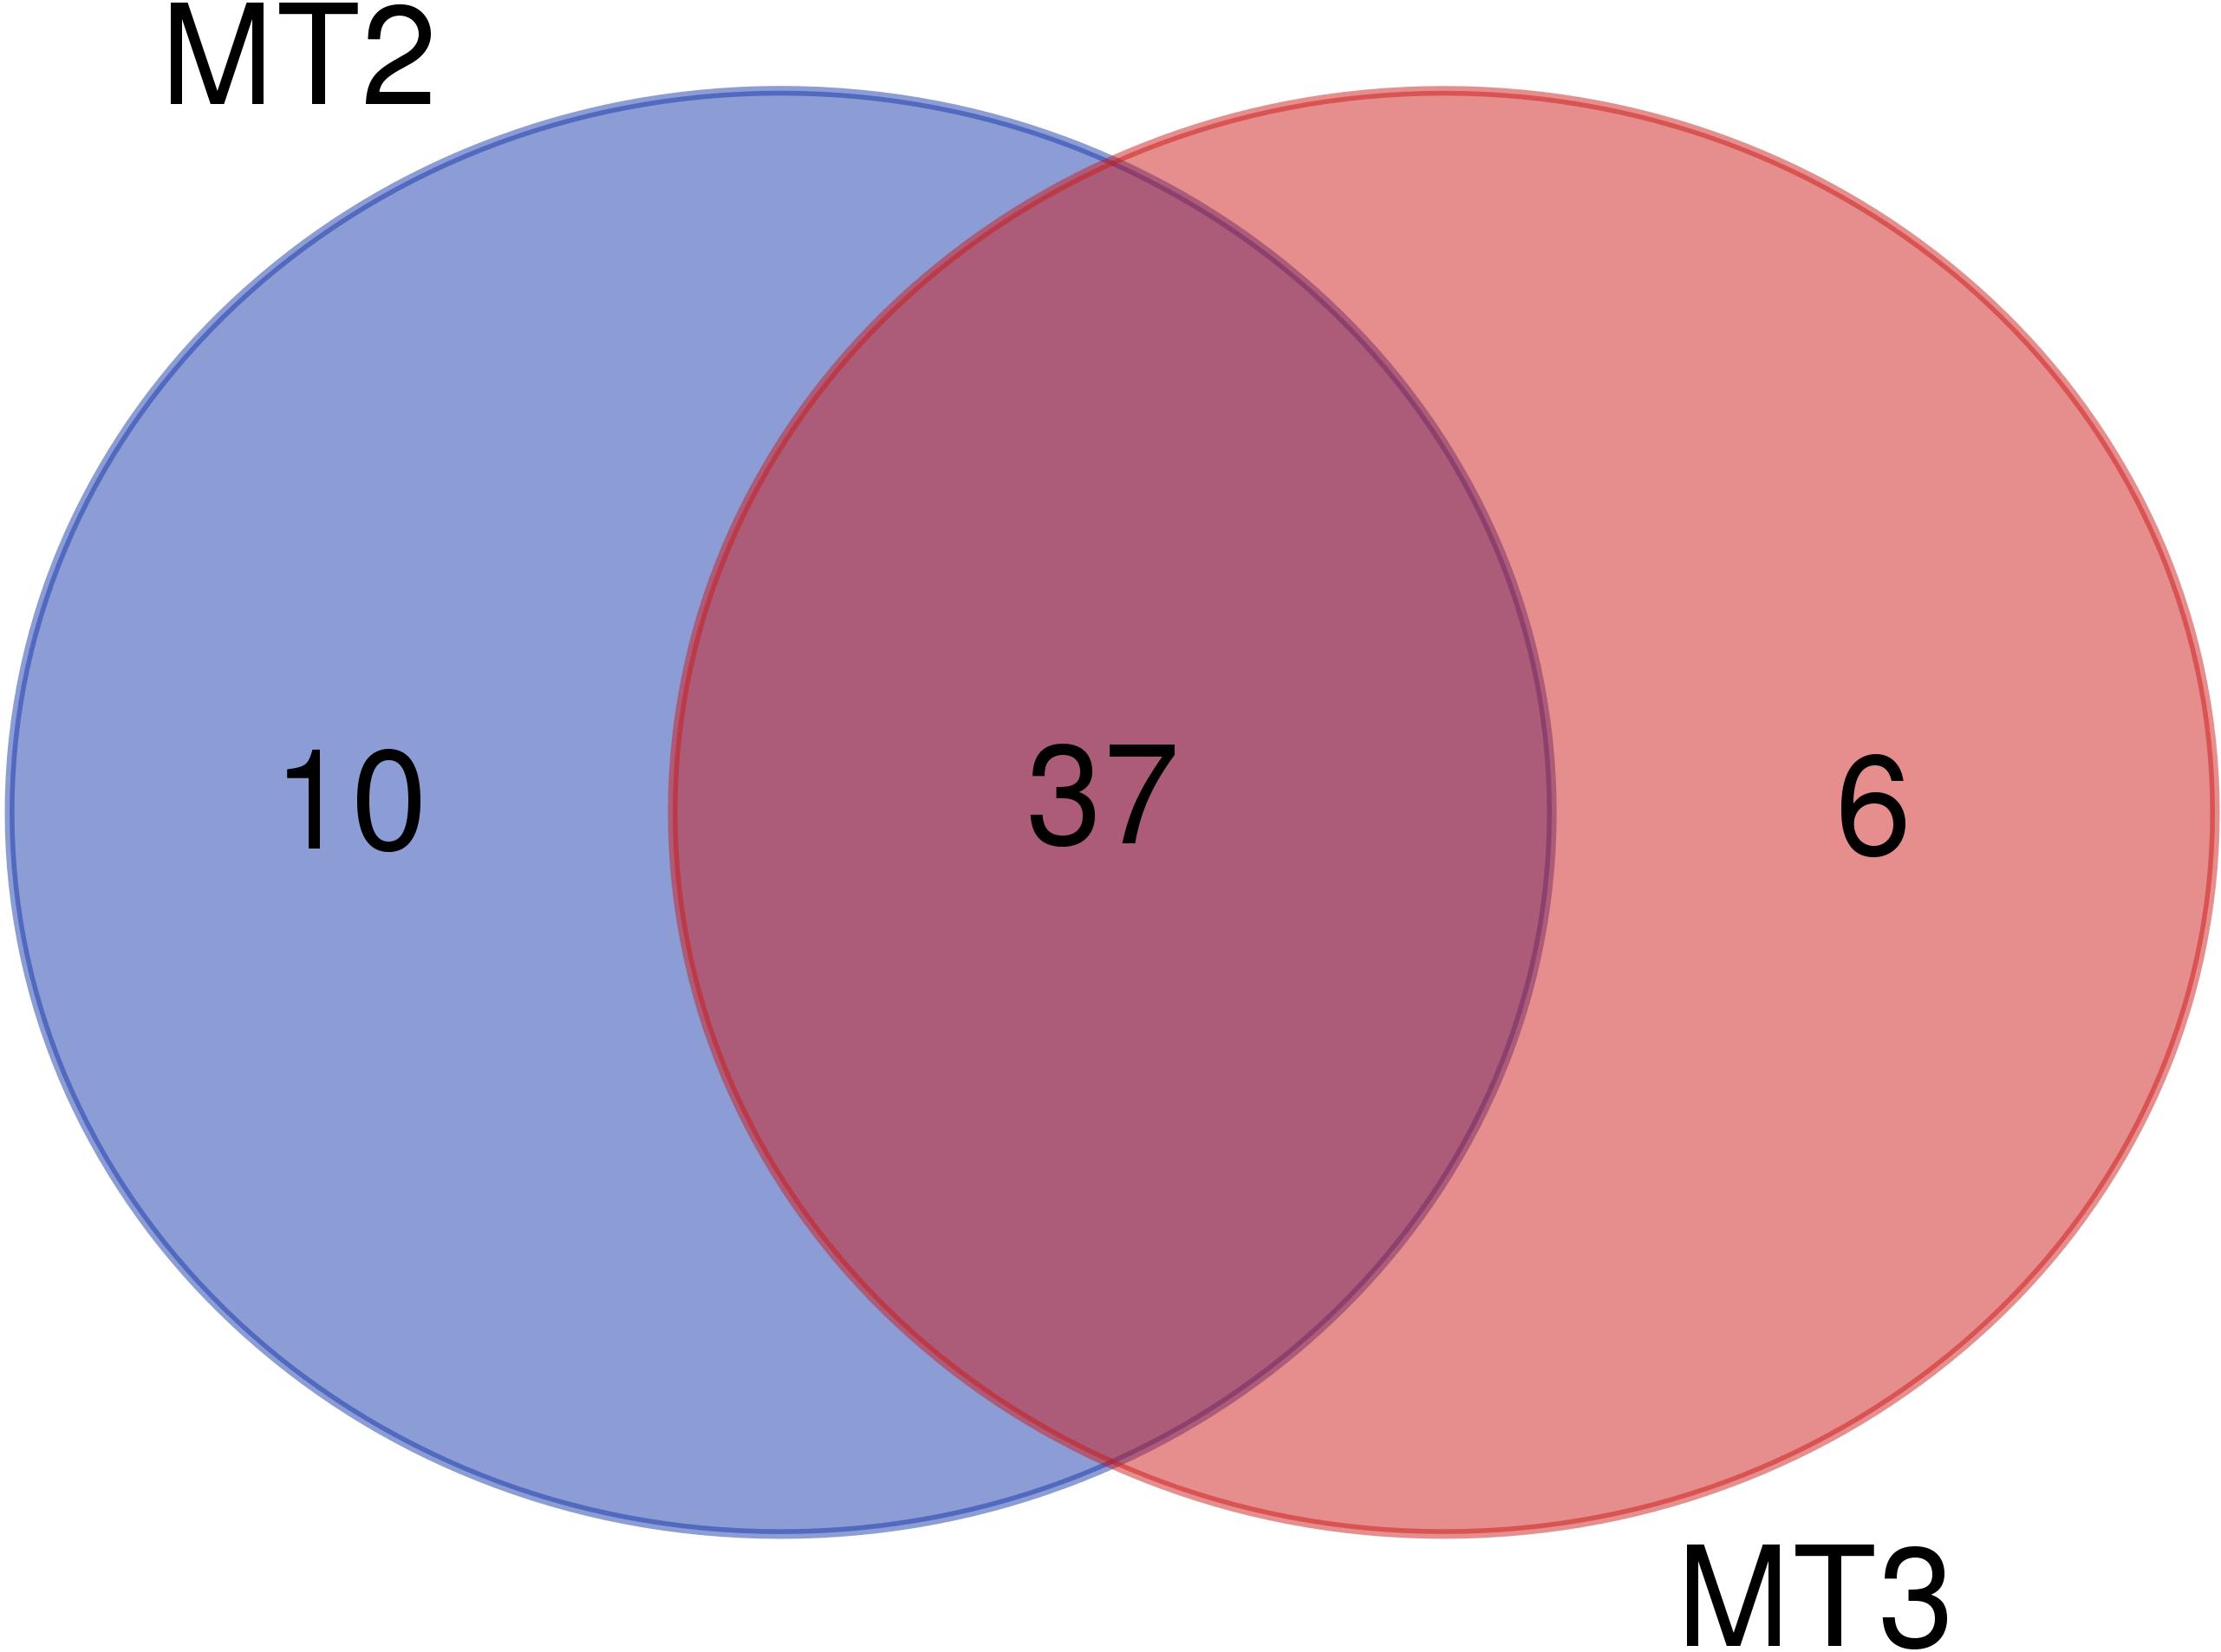
Figure 5. Venn diagram showing the number ot OTUs that are shared and those unique by MT2 and MT3 DNA extraction kits. The purple circle shows the number of unique taxa found in 90% of the samples extracted with MT2, pink circle shows those unique extracted with MT3, while intersection shows the shared taxa.
Summarizing, the DNA extraction method has a considerable influence in the sequencing results (Liu et al., 2019), so a single DNA extraction method should be used when we want to compare different samples. Between the two protocols tested in this section, MT3 showed to be the effective protocol recovering DNA from the eukaryotic nano- and pico-plankton samples, the main goal of this work. DNeasy PowerWater kit has already been recommended to purify DNA from microorganisms in water (Lear et al., 2017) and its use is increasing (e.g., Santi et al., 2019; Shu et al., 2020). With our results we corroborate that this methodology offers the best choice in these cases.
Application of Selected Procedures, MT3-P1 and MT3-P7, in a Marine Plankton Environmental Sample
Once we determined the most adequate protocol for DNA extraction, method MT3, and bioinformatic analysis, pipeline P1 (using public softwares and database) or P7 (private pipeline), for processing the nano- and pico-plankton samples, the same procedures were applied to an environmental sample of filtered seawater. Higher diversity of organisms was expected for natural samples than for mock communities, so this sample was filtered sequentially with 20, 2, and 0.2 μm filters to avoid clogging the smallest filter and, as much as possible, the bias previously detected due to organism size in the subsequent amplification. The DNA concentrations obtained after extraction with MT3 were 1.91, 0.96, and 1.43 ng/μL of eDNA (environmental DNA) for 20, 2, and 0.2 μm pore-size filters, respectively, as measured by fluorimetry. The community recovered from each filter was different, as expected (Figure 6) and the diversity of taxonomic groups increased as the pore size decreased independent of the pipeline used, showing that nano- and pico-plankton fractions are an important part of marine eukaryotic diversity. The unassigned sequences were 22.7, 21.9, and 38.9% for the 0.2, 2, and 20 μm, respectively. In the case of P7, the company did not report the unassigned sequences so, in order to compare its results with P1 results we recalculate the percentages removing the unassigned sequences.
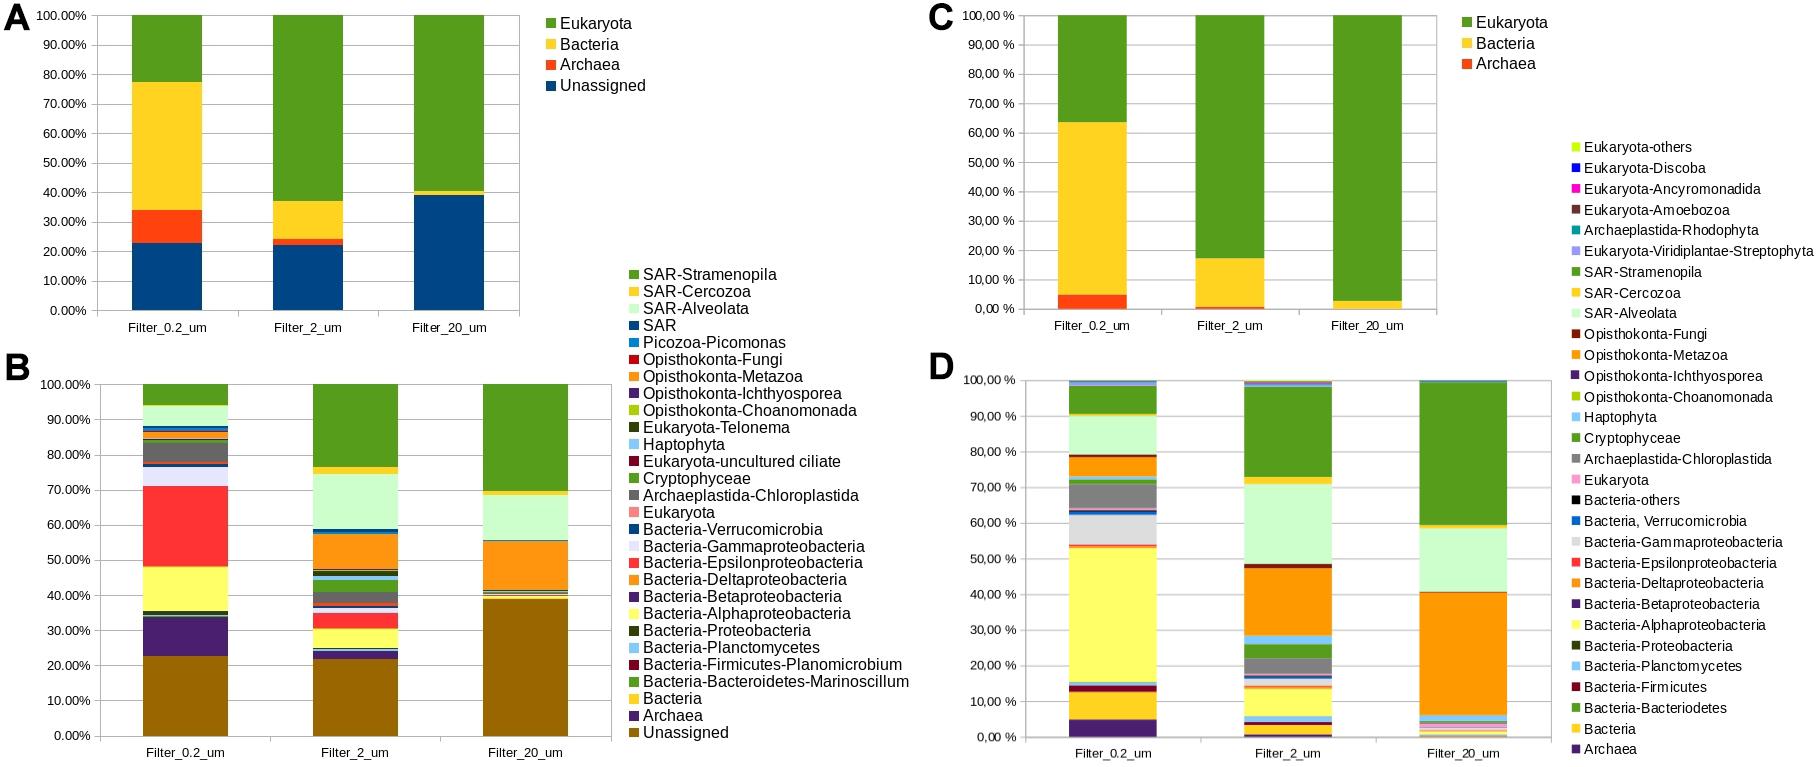
Figure 6. Bar plots showing the taxa detected in the filters from the marine environmental sample. The sample was extracted with MT3, and was analyzed using the pipeline-1, (A) percentage of Archaea, Bacteria, Eukaryotes, and unassigned reads (B) percentage of taxonomic groups detected in the filters; and using the pipeline-7, (C) percentage of Archaea, Bacteria, and Eukaryotes (D) percentage of taxonomic groups detected in the filters. The colors are in the same order in the legend and the bars. More detailed information of the taxa found is disclosed in Supplementary Table S5 (A,B) and Supplementary Table S6 (C,D).
A higher proportion of prokaryotes was obtained with the smallest pore-size filter (>50% bacteria and Archaea) and decreased with the larger pore-size filters. Some bacterial groups showed important differences between pipelines showing that the choice of the pipeline has great influence when analyzing bacteria. Archaea and Epsilonproteobacteria were more abundant when P1 was used (14.4 and 29.5% in P1; 4.8 and 0.5% in P7) whereas Firmicutes and Alphaproteobacteria were higher using P7 (0.06 and 16.4% in P1; 1.8 and 37.6% in P7). Rhodobacteraceae, within alpha-proteobacteria, was found in a much lower proportion in the environmental sample than in the mock communities (0.5, 4.0, and 8.8% for the 20, 2, and 0.2 μm filters, respectively for P1 and 0.5, 1.9, and 5.1% for the 20, 2, and 0.2 μm filters, respectively for P7), demonstrating that in natural samples this bacterial family did not produce the imbalance in diversity shown in the non-axenic mock samples. In eDNA samples, one species may contribute more DNA to the sample than the rest, which may decrease the diversity measures and community similarities (Majaneva et al., 2018). This imbalance in species contribution is a major problem in samples formed by only few species, such as non-axenic mock communities formed by only three pure-cultured species, where the effect of one overly abundant species may cause a strong effect. However, in the environmental sample, with high diversity and filtered by sample size, this effect was not apparent. This support the idea that the use of filters, to separate the different fractions of plankton by size, help to reduce the potential effect of Bacteria when we want study mainly eukaryotes using this general primers.
Regarding the eukaryotic organisms, the focus of this study, the results were consistent across pipelines. The eukaryotes were more abundant in the 20 and 2 μm pore-size filters (>50% eukaryotes in both and for both pipelines), as was expected according to their size. The most abundant group in both cases and with both pipelines was the SAR group (Stramenopiles, Alveolates, and Rhizaria), with 72.8 and 53.7% abundances, respectively, in P1 and 58.6 and 49,7%, respectively, in P7, standing out Stramenopila and Alveolata groups independent of pipeline used. Metazoa was the next group with abundances of 22.8 and 12.8% for the two filters, respectively, in P1 and 34.4 and 18.8%, respectively, in P7. In addition, with the 2 μm pore filter, Cryptophyceae and Chloroplastida, to which the Micromonas genus belongs, were found in an abundance >3% and their abundances were similar for both pipelines in that filter. Finally, with the 0.2 μm filter, eukaryotes were detected in lower proportions 29.2% in P1 and 36.4% in P7, with Alveolata, Stramenopila (5.97.6%) again being predominant, followed by Stramenopila, Alveolata (5.77.4%) and Chloroplastida (7.4%) for P1 and Aveolata (10.8%), Stramenopila (7.9%) and Chloroplastida (6.8%) for P7. Metazoa was less represented in this filter and was one of the eukaryotic group with bigger differences between pipelines, showing 1.7% in P1 and 5.4% in P7. The great abundance of Alveolata in environmental samples has been mentioned in other studies, and the group is commonly observed using NGS, due to its cosmopolitan nature in sea water environments (e.g., Medinger et al., 2010). However, this taxon tends to be overrepresented because it presents a high number of ribosomal RNA copies, so its abundance should always be considered with caution (Medinger et al., 2010). The other major groups such as Stramenopila or Metazoa are also groups commonly found in high abundances in ports and estuaries in the Atlantic coast (e.g., Dasilva et al., 2014; De Vargas et al., 2015; Abad et al., 2017). Only a few eukariotic organisms were detected by just one pipeline, but all of them were found in really low abundances, for example, some ciliates or Picozoa were only detected with P1 and Amoebozoa or Discoba were only found with P7.
Regarding the eukaryote species included in the mocks, Chrysochromulina (Haptophyta phylum) and Micromonas were also detected and identified in the environmental sample. In contrast to what we have obtained in the mock community experiment, where Micromonas was poorly amplified and sequenced with respect to Chrysochromulina, these species had a more balanced amplification in the environmental sample, although their abundances were linked with the type of filter. Micromonas were detected significantly less often than Chrysochromulina in the 20 μm filter (0.053 and 0.35% in P1; 0.04 and 1.25% in P7) likely because the size range recovered with this filter. In the next one (2 μm filter) they were more similarly amplified (0.2431 and 0.87% in P1; 1.0 and 1.1% in P7, respectively) and Micromonas was even more abundant than Chrysochromulina in the smallest filter (0.73 and 0.26%, respectively, in P1; 1.9 and 0.2% in P7). Therefore, although the amplification is always dependent on the natural amount of the target species in the environment, the use of filters, three filters in our case, to separate the different fractions of plankton by size is helpful to partially avoid the bias during the amplification caused by the differences in size and/or ribosomal copy number. Furthermore, although the use of the smallest filter, as in the mock samples, has the advantage of increasing the amount of DNA recovered, it also may be clogged easily by large species or blooming or turbid waters, thus modifying the community composition results (Majaneva et al., 2018). This is an important consideration in samples composed of eukaryotic species with significant size differences, such as the marine environmental samples of plankton.
In view of the results, both protocols (MT3-P1 and MT3-P7) allows the detection and identification of the eukaryotic communities included in the nano- and pico-plankton, even some of the most difficult to detect genera, e.g., those of the species included here in the mock communities. In addition, with both protocols it was found the same more abundant eukaryotic groups in each filter, making the results more robust. Hence, these protocols are suitable to study the eukaryotic diversity present in smaller planktonic fractions using eDNA and Ion Torrent sequencing methodology, one of the most recommended to analyze amplicon-sequencing data (Díaz-Sanchez et al., 2013). In addition, MT3-P1 use softwares that are free and available for anyone, which is an extra-advantage. The organisms included in the plankton are not always easily identifiable, and information about some of them is very scarce despite the highlighted importance and high diversity of this small plankton (e.g., Moreira and López-García, 2002; Worden et al., 2009; De Vargas et al., 2015). Therefore, having taylor-made protocols to study this plankton fraction from environmental samples is a great advance. In addition, even though some studies have evaluated extraction methods (Lekang et al., 2015; Djurhuus et al., 2017; Liu et al., 2019) or gene markers (Wangensteen et al., 2018) for this topic, this is the first, to the best of our knowledge, to investigate DNA extraction protocols, different bioinformatic pipelines and their effects on sequencing results.
Conclusion
Although NGS is still a semi-quantitative technology, this technique allows qualitative analysis, helping to better characterize natural communities, and even the proper study of relative abundances and spatial and temporal patterns of variability in planktonic samples whenever the same technical bias is applied (Medinger et al., 2010; Massana et al., 2015; Bucklin et al., 2016). Deeper characterization of community structure of phytoplankton has advanced through NGS techniques, which are continuously improving, but evaluation of methods is still needed (Mäki et al., 2017). In this work, different protocols were tested for two critical steps of metabarcoding analyses of marine environmental samples, DNA extraction and bioinformatic analyses, focusing on nano- and pico-plankton eukaryotes as target species. MT2 and MT3 were the best among the DNA extraction methods analyzed because of the yield and the reproducibility of the results, but from the samples extracted with MT3 was possible to identify more eukaryotic taxa during the taxonomic assignment. Additionally, two bioinformatic pipelines (P1 and P7) were the best detecting the two eukaryotic species included in the mock communities at the genus level, but only P1offered more conservative taxonomic assignment avoiding the confusion with other closed species. This pipeline has the additional advantage of being free software. Despite the limitations of a mock community formed by only three species (2 eukaryotes and 1 prokaryote), this was sufficient to evaluate the performance of the different extraction methods and to test the influence of the bioinformatic pipeline used in the ability of NGS to resolve the composition of a community of eukaryotic nano/picoplankton. The potential bias produced by size differences and ribosomal copy number could be detected and even with this bias, inevitable for the moment and equal for all samples, was possible to evaluate which was the best protocol, including a combination of bioinformatic pipeline and a DNA extraction method. The complete methodologies (MT3-P1 and MT3-P7) provided good results when applied to the environmental sample, showing results consistent with other works and between them. In addition, the bias related to the organisms’/genome size was reduced by filtering the sample sequentially through filters of different pore sizes prior to DNA extraction, separating the plankton by size fractions. Hence, the final protocols (free or proprietary) are adequate for studying the eukaryotic diversity present in nano- and pico-plankton from environmental samples using Ion Torrent methodologies, even for the genera that are difficult to detect with other techniques, such as microscopy or pigment analyses.
Data Availability Statement
The datasets generated for this study can be found in online repositories. The names of the repository/repositories and accession number(s) can be found below: https://www.ebi.ac.uk/ena, PRJEB32137.
Author Contributions
MM-C performed the statistical and bioinformatic analyses and led the writing. AS led the laboratory experiments with the pure cultures of plankton and mock communities and edited the manuscript. BC performed the NGS experiments in the laboratory. FF and JG assisted with project design and edited the manuscript. CGS supervised the research, assisted with project design and analysis, and edited the manuscript. All authors contributed to the article and approved the submitted version.
Funding
This study was funded by the Spanish Ministry of Science and Innovation, Grant CTM2014-56119-R (i-SMALL project). MM-C holds a “Juan de la Cierva Formación” postdoctoral fellowship from the Spanish Ministry of Education with reference code FJCI-2017-32722.
Conflict of Interest
The authors declare that the research was conducted in the absence of any commercial or financial relationships that could be construed as a potential conflict of interest.
Acknowledgments
The authors are grateful for the assistance of Belen Arbones Fernández for cell quantification by flow cytometry and Lourdes Nieto Leirón for help with filtering plankton samples. CESGA servers were used for running some bioinformatic analyses due to the requirements of considerable computational power of some scripts.
Supplementary Material
The Supplementary Material for this article can be found online at: https://www.frontiersin.org/articles/10.3389/fmars.2020.584253/full#supplementary-material
Footnotes
- ^ https://www.ncbi.nlm.nih.gov/
- ^ https://www.arb-silva.de
- ^ https://www.ncbi.nlm.nih.gov/
- ^ https://www.bioinformatics.babraham.ac.uk/projects/fastqc/
- ^ http://rnacentral.org/
- ^ http://bioinformatics.psb.ugent.be/webtools/Venn/
- ^ https://forum.qiime2.org/t/any-other-option-for-doing-the-feature-table-without-trimming-from-pgm-data
- ^ https://docs.qiime2.org/2018.2
References
Abad, D., Albaina, A., Aguirre, M., and Estonba, A. (2017). 18S V9 metabarcoding correctly depicts plankton estuarine community drivers. Mar. Ecol. Prog. Ser. 584, 31–43. doi: 10.3354/meps12373
Abad, D., Albaina, A., Aguirre, M., Laza-Martínez, A., Uriarte, I., Iriarte, A., et al. (2016). Is metabarcoding suitable for estuarine plankton monitoring? A comparative study with microscopy. Mar. Biol. 163:149.
Aguirre, M., Abad, D., Albaina, A., Cralle, L., Goñi-Urriza, M. S., Estonba, A., et al. (2017). Unraveling the environmental and anthropogenic drivers of bacterial community changes in the Estuary of Bilbao and its tributaries. PLoS One 12:e0178755. doi: 10.1371/journal.pone.0178755
Alekhin, A., Kovach, E., Manrique, M., Pareja-Tobes, P., Pareja, E., Tobes, R., et al. (2015). MG7: configurable and scalable 16S metagenomics data analysis. BioRxiv [Preprint] doi: 10.1101/027714
Aljanabi, S. (1997). Universal and rapid salt-extraction of high quality genomic DNA for PCR- based techniques. Nucleic Acids Res. 25, 4692–4693. doi: 10.1093/nar/25.22.4692
Amaral-Zettler, L. A., McCliment, E. A., Ducklow, H. W., and Huse, S. M. (2009). A method for studying protistan diversity using massively parallel sequencing of V9 hypervariable regions of small-subunit ribosomal RNA genes. PLoS One 4:e6372. doi: 10.1371/journal.pone.0006372
Amir, A., McDonald, D., Navas-Molina, J. A., Kopylova, E., Morton, J. T., Zech Xu, Z., et al. (2017). Deblur rapidly resolves single-nucleotide community sequence patterns. MSystems 2:e00191-16. doi: 10.1128/mSystems.00191-16
Beaugrand, G. (2005). Monitoring pelagic ecosystems using plankton indicators. ICES J. Mar. Sci. 62, 333–338. doi: 10.1016/j.icesjms.2005.01.002
Bennke, C. M., Pollehne, F., Müller, A., Hansen, R., Kreikemeyer, B., and Labrenz, M. (2018). The distribution of phytoplankton in the Baltic Sea assessed by a prokaryotic 16S rRNA gene primer system. J. Plankton Res. 40, 244–254. doi: 10.1093/plankt/fby008
Bik, H. M., Porazinska, D. L., Creer, S., Caporaso, J. G., Knight, R., and Thomas, W. K. (2012). Sequencing our way towards understanding global eukaryotic biodiversity. Trends Ecol. Evol. 27, 233–243. doi: 10.1016/j.tree.2011.11.010
Bokulich, N. A., Subramanian, S., Faith, J. J., Gevers, D., Gordon, J. I., Knight, R., et al. (2013). Quality-filtering vastly improves diversity estimates from Illumina amplicon sequencing. Nat. Methods 10, 57–59. doi: 10.1038/nmeth.2276
Bolyen, E., Rideout, J. R., Dillon, M. R., Bokulich, N. A., Abnet, C., AAl-Ghalith, G., et al. (2018). QIIME 2: reproducible, interactive, scalable, and extensible microbiome data science. PeerJ Prepr. 6:e27295v2. doi: 10.7287/peerj.preprints.27295v2
Borrell, Y. J., Miralles, L., Mártinez-Marqués, A., Semeraro, A., Arias, A., Carleos, C. E., et al. (2018). Metabarcoding and post-sampling strategies to discover non-indigenous species: a case study in the estuaries of the central south Bay of Biscay. J. Nat. Conserv. 42, 67–74. doi: 10.1016/j.jnc.2017.07.002
Brose, U., and Hillebrand, H. (2016). Biodiversity and ecosystem functioning in dynamic landscapes. Philos. Trans. R. Soc. B Biol. Sci. 371:20150267. doi: 10.1098/rstb.2015.0267
Bucklin, A., Lindeque, P. K., Rodríguez-Ezpeleta, N., Albaina, A., and Lehtiniemi, M. (2016). Metabarcoding of marine zooplankton: prospects, progress and pitfalls. J. Plankton Res. 38, 393–400. doi: 10.1093/plankt/fbw023
Caporaso, J. G., Kuczynski, J., Stombaugh, J., Bittinger, K., Bushman, F. D., Costello, E. K., et al. (2010). QIIME allows analysis of high- throughput community sequencing data intensity normalization improves color calling in SOLiD sequencing. Nat. Methods 7, 335–336. doi: 10.1038/nmeth0510-335
Chen, B., Liang, X., Huang, X., Zhang, T., and Li, X. (2013). Differentiating anthropogenic impacts on ARGs in the Pearl River Estuary by using suitable gene indicators. Water Res. 47, 2811–2820. doi: 10.1016/j.watres.2013.02.042
D’Amore, R., Ijaz, U. Z., Schirmer, M., Kenny, J. G., Gregory, R., Darby, A. C., et al. (2016). A comprehensive benchmarking study of protocols and sequencing platforms for 16S rRNA community profiling. BMC Genomics 17:55. doi: 10.1186/s12864-015-2194-9
Dasilva, C. R., Li, W. K. W., and Lovejoy, C. (2014). Phylogenetic diversity of eukaryotic marine microbial plankton on the Scotian Shelf Northwestern Atlantic Ocean. J. Plankton Res. 36, 344–363. doi: 10.1093/plankt/fbt123
Davis, A., Kohler, C., Alsallaq, R., Hayden, R., Maron, G., and Margolis, E. (2019). Improved yield and accuracy for DNA extraction in microbiome studies with variation in microbial biomass. Biotechniques 66, 285–289. doi: 10.2144/btn-2019-0016
De Vargas, C., Audic, S., Henry, N., Decelle, J., Mahé, F., Logares, R., et al. (2015). Eukaryotic plankton diversity in the sunlit ocean. Science 348:1261605. doi: 10.1126/science.1261605
Díaz-Sanchez, S., Hanning, I., Pendleton, S., and D’Souza, D. (2013). Next-generation sequencing: the future of molecular genetics in poultry production and food safety. Poult. Sci. 92, 562–572. doi: 10.3382/ps.2012-02741
Djurhuus, A., Port, J., Closek, C. J., Yamahara, K. M., Romero-Maraccini, O., Walz, K. R., et al. (2017). Evaluation of filtration and DNA extraction methods for environmental DNA biodiversity assessments across multiple trophic levels. Front. Mar. Sci. 4:314. doi: 10.3389/fmars.2017.00314
Edgar, R. C. (2010). Search and clustering orders of magnitude faster than BLAST. Bioinformatics 26, 2460–2461. doi: 10.1093/bioinformatics/btq461
Fonseca, V. G., Carvalho, G. R., Sung, W., Johnson, H. F., Power, D. M., Neill, S. P., et al. (2010). Second-generation environmental sequencing unmasks marine metazoan biodiversity. Nat. Commun. 1:98. doi: 10.1038/ncomms1095
Galluzi, L., Bertozzini, E., Penna, A., Perini, F., Garcés, E., and Magnani, M. (2010). Analysis of rRNA gene content in the Mediterranean dinoflagellate Alexandrium catenella and Alexandrium taylori: implications for the quantitative real-time PCR-based monitoring methods. J. Appl. Phycol. 22, 1–9. doi: 10.1007/s10811-009-9411-3
Ganesh, S., Parris, D. J., De Long, E. F., and Stewart, F. J. (2014). Metagenomic analysis of size-fractionated picoplankton in a marine oxygen minimum zone. ISME J. 8, 187–211. doi: 10.1038/ismej.2013.144
García-Martínez, J., and Rodríguez-Valera, F. (2000). Microdiversity of uncultured marine prokaryotes: the SAR11 cluster and the marine Archaea of Group I. Mol. Ecol. 9, 935–948. doi: 10.1046/j.1365-294X.2000.00953.x
Gong, W., and Marchetti, A. (2019). Estimation of 18S gene copy number in marine eukaryotic plankton using a next-generation sequencing approach. Front. Mar. Sci. 6:219. doi: 10.3389/fmars.2019.00219
Guillard, R. R. L., and Hargraves, P. E. (1993). Stichochrysis immobilis is a diatom, not a chrysophyte. Phycologia 32, 234–236. doi: 10.2216/i0031-8884-32-3-234.1
Hackett, J. D., Anderson, D. M., Erdner, D. L., and Bhattacharya, D. (2004). Dinoflagellates: a remarkable evolutionary experiment. Am. J. Bot. 91, 1523–1534. doi: 10.3732/ajb.91.10.1523
Hall, T. A. (1999). BioEdit: a user-friendly biological sequence alignment editor and analysis program for Windows 95/98/NT. Nucleic Acids Symp. Ser. 41, 95–98.
Harding, T., Jungblut, A. D., Lovejoy, C., and Vincent, W. F. (2011). Microbes in high arctic snow and implications for the cold biosphere. J. Appl. Environ. Microbiol. 77, 3234–3243. doi: 10.1128/AEM.02611-10
Hart, M. L., Meyer, A., Johnson, P. J., and Ericsson, A. C. (2015). Comparative evaluation of DNA extraction methods from feces of multiple host species for downstream next-generation sequencing. PLoS One 10:e0143334. doi: 10.1371/journal.pone.0143334
Hugerth, L. W., Muller, E. E. L., Hu, Y. O. O., Lebrun, L. A. M., Roume, H., Lundin, D., et al. (2014). Systematic design of 18S rRNA gene primers for determining eukaryotic diversity in microbial consortia. PLoS One 9:e95567. doi: 10.1371/journal.pone.0095567
Jerde, C. L., Mahon, A. R., Chadderton, W. L., and Lodge, D. M. (2011). “Sight-unseen” detection of rare aquatic species using environmental DNA. Conserv. Lett. 4, 150–157. doi: 10.1111/j.1755-263X.2010.00158.x
Jünemann, S., Kleinbölting, N., Jaenicke, S., Henke, C., Hassa, J., Nelkner, J., et al. (2017). Bioinformatics for NGS-based metagenomics and the application to biogas research. J. Biotechnol. 261, 10–23. doi: 10.1016/j.jbiotec.2017.08.012
Kelly, R. P., Port, J. A., Yamahara, K. M., and Crowder, L. B. (2014). Using environmental DNA to census marine fishes in a large mesocosm. PLoS One 9:e86175. doi: 10.1371/journal.pone.0086175
Kocum, E. (2020). Autotrophic nanoplankton dynamics is significant on the spatio-temporal variation of phytoplankton biomass size structure along a coastal trophic gradient. Reg. Stud. Mar. Sci. 33:100920. doi: 10.1016/j.rsma.2019.100920
Lear, G., Dickie, I., Banks, J., Boyer, S., Buckley, H. L., Buckley, T. R., et al. (2017). Methods for the extraction, storage, amplification and sequencing of DNA from environmental samples. New Zeal. J. Ecol. 42:10. doi: 10.20417/nzjecol.42.9
Lee, E., Khurana, M. S., Whiteley, A. S., Monis, P. T., Bath, A., Gordon, C., et al. (2017). Novel primer sets for next generation sequencing-based analyses of water quality. PLoS One 12:e0170008. doi: 10.1371/journal.pone.0170008
Lekang, K., Thompson, E. M., and Troedsson, C. (2015). A comparison of DNA extraction methods for biodiversity studies of eukaryotes in marine sediments. Aquat. Microb. Ecol. 75, 15–25. doi: 10.3354/ame01741
Lie, A. A. Y., Liu, Z., Hu, S. K., Jones, A. C., Kim, D. Y., Countway, P. D., et al. (2014). Investigating microbial eukaryotic diversity from a global census: insights from a comparison of pyrotag and full-length sequences of 18S rRNA genes. Appl. Environ. Microb. 80, 4363–4373. doi: 10.1128/AEM.00057-14
Liu, M., Xue, Y., and Yang, J. (2019). Rare plankton subcommunities are far more affected by DNA extraction kits than abundant plankton. Front. Microbiol. 10:454. doi: 10.3389/fmicb.2019.00454
Logares, R., Deutschmann, I. M., Junger, P. C., Giner, R. G., Krabberød, A. K., Schmidt, T. S. B., et al. (2020). Disentangling the mechanisms shaping the surface ocean microbiota. Microbiome 8:55. doi: 10.1186/s40168-020-00827-8
Lorenz, M., Friedl, T., and Day, J. G. (2005). “Perpetual maintenance of actively metabolizing microalgal cultures,” in Algal Culturing Techniques, ed. R. A. Andersen (Burlington, MA: Elsevier Academic Press), 145–156. doi: 10.1016/b978-012088426-1/50011-1
Lymperopoulou, D. S., and Dobbs, F. C. (2017). Bacterial diversity in ships ballast water, ballast-water exchange, and implications for ship-mediated dispersal of microorganisms. Environ. Sci. Technol. 51, 1962–1972. doi: 10.1021/acs.est.6b03108
Majaneva, M., Diserud, O. H., Eagle, S. H. C., Boström, E., Hajibabaei, M., and Ekrem, T. (2018). Environmental DNA filtration techniques affect recovered biodiversity. Sci. Rep. 8:4682. doi: 10.1038/s41598-018-23052-8
Mäki, A., Salmi, P., Mikkonen, A., Kremp, A., and Tiirola, M. (2017). Sample preservation, DNA or RNA extraction and data analysis for high-throughput phytoplankton community sequencing. Front. Microbiol. 8:1848. doi: 10.3389/fmicb.2017.01848
Martin, M. (2011). Cutadapt removes adapter sequences from high-throughput sequencing reads. EMBnet J. 17, 10–12. doi: 10.14806/ej.17.1.200
Massana, R. (2011). Eukaryotic picoplankton in surface oceans. Annu. Rev. Microbiol. 65, 91–110. doi: 10.1146/annurev-micro-090110-102903
Massana, R., Gobet, A., Audic, S., Bass, D., Bittner, L., Boutte, C., et al. (2015). Marine protist diversity in European coastal waters and sediments as revealed by high-throughput sequencing. Environ. Microbiol. 17, 4035–4049. doi: 10.1111/1462-2920.12955
Massana, R., and Logares, R. (2013). Eukaryotic versus prokaryotic marine picoplankton ecology. Environ. Microbiol. 15, 1254–1261. doi: 10.1111/1462-2920.12043
Medinger, R., Nolte, V., Vinay Pandey, R., Jost, S., Ottenwälder, B., Schlötterer, et al. (2010). Diversity in a hidden world: potential and limitation of next-generation sequencing for surveys of molecular diversity of eukaryotic microorganisms. Mol. Ecol. 19, 32–40. doi: 10.1111/j.1365-294X.2009.04478.x
Moreira, D., and López-García, P. (2002). The molecular ecology of microbial eukaryotes unveils a hidden world. Trends Microbiol. 10, 31–38. doi: 10.1016/S0966-842X(01)02257-0
Orsi, W. D., Wilken, S., Del Campo, J., Heger, T., James, E., Richards, T. A., et al. (2018). Identifying protist consumers of photosynthetic picoeukaryotes in the surface ocean using stable isotope probing. Environ. Microbiol. 20, 815–827. doi: 10.1111/1462-2920.14018
Prokopowich, C. D., Gregory, T. R., and Crease, T. J. (2003). The correlation between rDNA copy number and genome size in eukaryotes. Genome 46, 48–50. doi: 10.1139/g02-103
Pujalte, M. J., Lucena, T., Ruvira, M. A., Arahal, D. R., and Macián, M. C. (2014). “The family Rhodobacteraceae,” in The Prokaryotes. Alphaproteobacteria and Betaproteobacteria, eds E. Rosenberg, E. F. DeLong, S. Lory, E. Stackebrandt, and F. Thompson (Berlin: Springer), 439–512. doi: 10.1007/978-3-642-30197-1_377
Rees, H. C., Maddison, B. C., Middleditch, D. J., Patmore, J. R. M., and Gough, K. C. (2014). The detection of aquatic animal species using environmental DNA – a review of eDNA as a survey tool in ecology. J. Appl. Ecol. 51, 1450–1459. doi: 10.1111/1365-2664.12306
Ribeiro, C. G., Lopes dos Santos, A., Marie, D., Pellizari, V. H., Pereira Brandini, F., and Vaulot, D. (2016). Pico and nanoplankton abundance and carbon stocks along the Brazilian Bight. PeerJ 4:e2587. doi: 10.7717/peerj.2587
Rognes, T., Flouri, T., Nichols, B., Quince, C., and Mahé, F. (2016). VSEARCH: a versatile open source tool for metagenomics. PeerJ 4:e2584. doi: 10.7717/peerj.2584
Sánchez, A., Quinteiro, J., Rey-Méndez, M., Perez-Martín, R. I., and Sotelo, C. G. (2014). Identification and quantification of two species of oyster larvae using real-time PCR. Aquat. Living Resour. 27, 135–145. doi: 10.1051/alr/2014012
Santi, I., Tsiola, A., Dimitriou, P. D., Fodelianakis, S., Kasapidis, P., Papageorgiou, etal. (2019). Prokaryotic and eukaryotic microbial community responses to N and P nutrient addition in oligotrophic Mediterranean coastal waters: novel insights from DNA metabarcoding and network analysis. Mar. Environ. Res. 150:104752. doi: 10.1016/j.marenvres.2019.104752
Santos, S. S., Nunes, I., Nielsen, T. K., Jacquiod, S., Hansen, L. H., and Winding, A. (2017). Soil DNA extraction procedure influences protist 18S rRNA gene community profiling outcome. Protist 168, 283–293. doi: 10.1016/j.protis.2017.03.002
Shih, C.-Y., Lu, H.-M., Gong, G.-C., and Kang, L.-K. (2019). High diversity of haptophytes in the East China Sea revealed by next-generation sequencing and scanning electron microscopy. J. Oceanogr. 75, 305–317. doi: 10.1007/s10872-019-00505-w
Shu, L., Lugwig, A., and Peng, A. (2020). Standards for methods utilizing environmental DNA for detection of fish species. Genes 11:296. doi: 10.3390/genes11030296
Simon, N., Foulon, E., Grulois, D., Six, C., Desdevises, Y., Latimier, M., et al. (2017). Revision of the genus Micromonas Manton et Parke (Chlorophyta, Mamiellophyceae), of the type species M. pusilla (Butcher) Manton & Parke and of the species M. commoda van Baren, Bachy and Worden and description of two new species based on the genetic and phenotypic characterization of cultured isolates. Protist 168, 612–635. doi: 10.1016/j.protis.2017.09.002
Teira, E., Logares, R., Gutiérrez-Barral, A., Ferrera, I., Varela, M. M., Morán, X. A., et al. (2019). Impact of grazing, resource availability and light on prokaryotic growth and diversity in the oligotrophic surface global ocean. Environ. Microbiol. 21, 1482–1496. doi: 10.1111/1462-2920.14581
Tringe, S. G., and Rubin, E. M. (2005). Metagenomics: DNA sequencing of environmental samples. Nat. Rev. Genet. 6, 805–814. doi: 10.1038/nrg1709
Velásquez-Mejía, E. P., de la Cuesta-Zuluaga, J., and Escobar, J. S. (2018). Impact of DNA extraction, sample dilution, and reagent contamination on 16S rRNA gene sequencing of human feces. Appl. Microbiol. Biotechnol. 102, 403–411. doi: 10.1007/s00253-017-8583-z
Walden, C., Carbonero, F., and Zhang, W. (2017). Assessing impacts of DNA extraction methods on next generation sequencing of water and wastewater samples. J. Microbiol. Methods 141, 10–16. doi: 10.1016/j.mimet.2017.07.007
Wangensteen, O. S., Palacín, C., Guardiola, M., and Turon, X. (2018). DNA metabarcoding of littoral hard-bottom communities: high diversity and database gaps revealed by two molecular markers. PeerJ 6:e4705. doi: 10.7717/peerj.4705
Worden, A. Z., Lee, J.-H., Mock, T., Rouzé, P., Simmons, M. P., Aerts, A. L., et al. (2009). Green evolution and dynamic adaptations revealed by genomes of the marine picoeukaryotes Micromonas. Science 324, 268–272. doi: 10.1126/science.1167222
Wu, H. T., Mi, Z. L., Zhang, J. X., Chen, C., and Xie, S. G. (2014). Bacterial communities associated with an occurrence of colored water in an urban drinking water distribution system. Biomed. Environ. Sci. 27, 646–650. doi: 10.3967/bes2014.099
Yuan, J., Li, M., and Lin, S. (2015). An improved DNA extraction method for efficient and quantitative recovery of phytoplankton diversity in natural assemblages. PLoS One 10:e0133060. doi: 10.1371/journal.pone.0133060
Zaiko, A., Pochon, X., Garcia-Vazquez, E., Olenin, S., and Wood, S. A. (2018). Advantages and limitations of environmental DNA/RNA tools for marine biosecurity: management and surveillance of non-indigenous species. Front. Mar. Sci. 5:322. doi: 10.3389/fmars.2018.00322
Zhan, A., Hullák, M., Sylvester, F., Huang, X., Adebayo, A. A., Abbott, C. L., et al. (2013). High sensitivity of 454 pyrosequencing for detection of rare species in aquatic communities. Methods Ecol. Evol. 4, 558–565. doi: 10.1111/2041-210X.12037
Keywords: nano-plankton, pico-plankton, marine eukaryotes, DNA extraction, next-generation sequencing, bioinformatic pipelines
Citation: Muñoz-Colmenero M, Sánchez A, Correa B, Figueiras FG, Garrido JL and Sotelo CG (2021) Evaluation of DNA Extraction Methods and Bioinformatic Pipelines for Marine Nano- and Pico-Eukaryotic Plankton Analysis. Front. Mar. Sci. 7:584253. doi: 10.3389/fmars.2020.584253
Received: 16 July 2020; Accepted: 18 December 2020;
Published: 14 January 2021.
Edited by:
Haiwei Luo, The Chinese University of Hong Kong, ChinaReviewed by:
Kevan Yamahara, Monterey Bay Aquarium Research Institute (MBARI), United StatesWenxue Wu, Sun Yat-sen University, China
Copyright © 2021 Muñoz-Colmenero, Sánchez, Correa, Figueiras, Garrido and Sotelo. This is an open-access article distributed under the terms of the Creative Commons Attribution License (CC BY). The use, distribution or reproduction in other forums is permitted, provided the original author(s) and the copyright owner(s) are credited and that the original publication in this journal is cited, in accordance with accepted academic practice. No use, distribution or reproduction is permitted which does not comply with these terms.
*Correspondence: Marta Muñoz-Colmenero, bWNvbG1lbmVyb0BpaW0uY3NpYy5lcw==; YS5tYXJ0YW0uY29sbWVuZXJvQGdtYWlsLmNvbQ==