 Brian R. C. Kennedy1
 Lara Hakam1
 Jan Witting2Regen Milani3Sue Taei4†Tim Smith5
 Erin Taylor3Tooreka Teemari6
 Randi D. Rotjan1*
- 1Department of Biology, Boston University, Boston, MA, United States
- 2Sea Education Association, Falmouth, MA, United States
- 3New England Aquarium, Central Wharf, Boston, MA, United States
- 4Pacific Islands Programme, Conservation International, Aukland, New Zealand
- 5Independent Researcher, Redding, CA, United States
- 6Department of Fisheries, Republic of Kiribati, Tarawa, Kiribati
The Phoenix Archipelago in the Central Pacific is situated in what was once one of the most productive areas for capturing sperm whales (Physeter macrocephalus). These whales were the focal targets of American offshore whalers in the mid-19th century along the equator, an area known as the “on-the-line” whaling grounds. Now, as large-scale Marine Protected Areas (MPAs) have provided protection for marine mammals and their food sources, it is important to have a solid understanding of historical baselines so recovery distributions can be compared with pre-whaling distributions. The Phoenix Islands archipelago contains two large MPAs: the Phoenix Islands Protected Area (PIPA), established by Kiribati in 2008, and the Howland/Baker unit of the Pacific Remote Islands Marine National Monument (PRIMNM), established by the United States in 2009. Using historic whaling records from American whaling vessels operated through the wider Phoenix Archipelago region, we reconstructed information about the presence and distribution of P. microcephalus throughout the 1800s within and around PIPA and the Howland/Baker units of the PRIMNM. Historical data analyzed using ArcGIS showed that sperm whales were present year-round within the study area, which is consistent with 20th century records from the Ocean Biogeographic Information System (OBIS). A Getis Ord Gi∗ hotspot analysis also revealed sighting hotspots within PIPA and near Howland and Baker, suggesting that these two areas may be of long-term ecological importance to sperm whales in the central Pacific. The New England whaling fleet ceased whaling effort in the central Pacific in the late 1800s, and publicly available records since that time are scarce. There has been no modern systematic whale survey ever conducted within the Phoenix Archipelago, though anecdotal accounts and sightings have been compiled over the years. These intermittent accounts suggest that though whale populations have not recovered to pre-whaling baselines, large-scale MPAs may play a role in helping to foster a resurgence of marine mammal populations. As the network of large-scale MPAs continue to grow as part of the commitment to ocean conservation set forth by UNESCO, IUCN, and the UN Decade for Ocean Science, historical baselines will be critical as a “yardstick” to measure population resurgence success for each MPA, and for populations overall.
Introduction
Sperm whales (Physeter macrocephalus) are among the most widely distributed marine mammals in the world (Rice, 1989), feeding primarily in the mesopelagic ocean (Whitehead, 2003) and found often in equatorial waters (Bannister and Mitchell, 1980). The equatorial position of the Phoenix Archipelago makes it a likely habitat for these large active predators (Whitehead, 2018), as these whales likely take advantage of the increased productivity associated with the increased chlorophyll concentrations of the equatorial upwelling zone (Jaquet, 1996; Jaquet et al., 1996). However, sperm whales were severely depleted throughout the Pacific by 19th century whaling efforts, with 20th century whaling further decimating the populations, which remain depressed to date in the Pacific (Whitehead, 2002; Carroll et al., 2014). During the peak of open-boat whaling efforts in the central Pacific (between 1820 and 1870), some estimates suggest that American whaling vessels may have made thousands of trips through the Central Pacific equatorial region, specifically in the Phoenix Archipelago (Smith et al., 2009). During this period, it is thought that the whaling effort reduced the sperm whale population by as much as 80%, though there is a wide range of variation in these estimates (Whitehead, 2002).
American whalers’ logbooks from the height of worldwide open-boat whaling effort have been used as a source of data to study the spatial distribution of whales (Smith et al., 2012). Smith et al. (2012) compiled and digitized logbook data as part of the World Whaling Project, incorporating portions of the Maury (1852) and Townsend (1935) studies as well as newly extracted logbook data under the Census of Marine Life (CoML). Smith et al. (2012) compilation of data from these sources combined represents approximately 10% of American whaling voyages, consisting of daily whale encounters recorded by American whalers between 1780 and 1920. This digitization displays spatial distribution of American whaling and the targeted population and enables the possibility of further analysis of the logbook data.
Post-exploitation, whales became protected in most countries in an effort to help their populations recover. For example in US waters, the Marine Mammal Protection Act has been in place in the United States since 1972 (Roman et al., 2013) and since 1986 when the International Whaling Commission placed a moratorium on whaling by member states globally (Knauss, 1997). Yet, despite the cessation of commercial catches of sperm whales that went into effect, populations have still not fully recovered in the Pacific Ocean (Whitehead, 2002; Carroll et al., 2014). Marine Protected Area (MPA) advocates have suggested that the recent inception of several large-scale MPAs may contribute to a marine mammal resurgence, but whether such marine protected areas are large enough to provide ecosystem-wide recovery for widely dispersed and highly mobile animals such as sperm whales is still an outstanding question (Roff, 2009; Hooker et al., 2011).
The Phoenix Islands make up a 10-island archipelago between the Line Islands to the east and the Gilbert Islands to the west. These islands are a low-lying group of volcanically derived, coral topped atolls and islands with a maximum elevation of 1 m above sea-level, spanning the equator (Rotjan et al., 2014). Of the 10 emergent islands, eight south of the equator are administered by the Republic of Kiribati, while the remaining two are under United States (US) jurisdiction, north of the equator. In 2008, Kiribati established the Phoenix Islands Protected Area (PIPA), which became the world’s largest and deepest UNESCO World Heritage Site. In 2009, the US established The Pacific Remote Islands Marine National Monument (PRIMNM), which is comprised of five subunits across United States waters in the Pacific where commercial fishing is prohibited within the monument boundaries (Pres. Procl. 8,336, Proclamation, 2009). The Howland and Baker unit of the Monument contains the northern- most islands in the Phoenix Islands group. Complementary to United States MPA efforts, in 2015, Kiribati completely closed PIPA to all commercial extractive activities including all fishing activity except for a small subsistence fishing community of approximately 25–50 people living on Kanton Island (Rotjan et al., 2014; McCauley et al., 2016; Hanich et al., 2018). Kiribati and the US have a cooperative agreement to manage the two MPA’s as a “trans-boundary large MPA” to support the protection of ecosystems and biodiversity through cooperation and comparable research and monitoring (US and Kiribati Cooperative Agreement, 2014). The PIPA closure not only nearly eliminated all fishing activity (McCauley et al., 2016; White et al., 2020), but also greatly reduced transiting ship traffic in the area, thereby reducing anthropogenic noise levels from ship engines within protected area boundaries. These MPAs may thus provide a modern safe haven for wildlife from acoustic pollution and increased biomass of fish (Sala and Giakoumi, 2018) and may accelerate the recovery of marine mammal populations. PIPA and the Howland/Baker units of the PRIMNM are two of the largest no-take areas in the ocean; just these two MPAs account for 1.7% of the 7.44% of the total ocean area that is protected globally (Morgan et al., 2018; Kennedy et al., 2019; IUCN, 2020).
The goal of our analysis is to provide a deeper understanding of the historic temporal and spatial distributions of whaling activity and sperm whales in the 19th century within and around MPA boundaries in the Phoenix Archipelago, in the hopes that modern-day research and management activities will be able to better compare population demographics against a historical baseline in the future. We analyzed a subset of the logbook data from Smith et al. (2012), focusing on the area along the equatorial Pacific in and surrounding the Phoenix Islands group to better understand the historical spatial distribution of sperm whales. We also examined modern-day oceanographic conditions that may influence the distribution of sperm whales. Our research seeks to connect available historic sperm whale data to implications for current PIPA/PRIMNM management objectives, which include protecting endangered and threatened species. Even if increased sperm whale abundance is noted within these MPAs in the future, current data would not be sufficient to enable comparisons with historical data to compare whether clusters are in the same historical hotspots, or whether there may be shifts in whale abundance that may be influenced by climate change, prey abundance, habitat quality, or a combination thereof. As such, we compared historical records of American whaling ship activity to the few more recent records of sperm whale sightings that are publicly available, and provide a spatially contextualized baseline to serve for future comparison.
Materials and Methods
Study Area
The PIPA covers an area of 408,250 km2 just south of the equator in the Central Pacific, and the Howland and Baker unit of PRIMNM covers 51,378 km2, which includes the equator (Figure 1). Together, these MPA areas total 459,628 km2. We limited the historical dataset (Smith et al., 2012) to equal distances (900 km) from the equator north and south and between 163.5 and 180 degrees west, which fully encompasses both MPA areas and the surrounding waters. This equidistant, cross-equatorial approach allowed us to examine the detections per unit effort (DPUE) of the whales and perform a Getis Ord Gi∗ hot spot analysis of the whale population inside MPAs and surrounding waters without a concern of statistical anomalies created by edge effects in the focal dataset. Concordantly, figures only highlight the focal areas around the MPAs and do not display the entire dataset used in the analysis. Ocean Biogeographic Information System (OBIS) data were similarly displayed within and around both MPAs, with sighting data captured from the same 900 km north and south of the equator, consistent with the historical dataset.
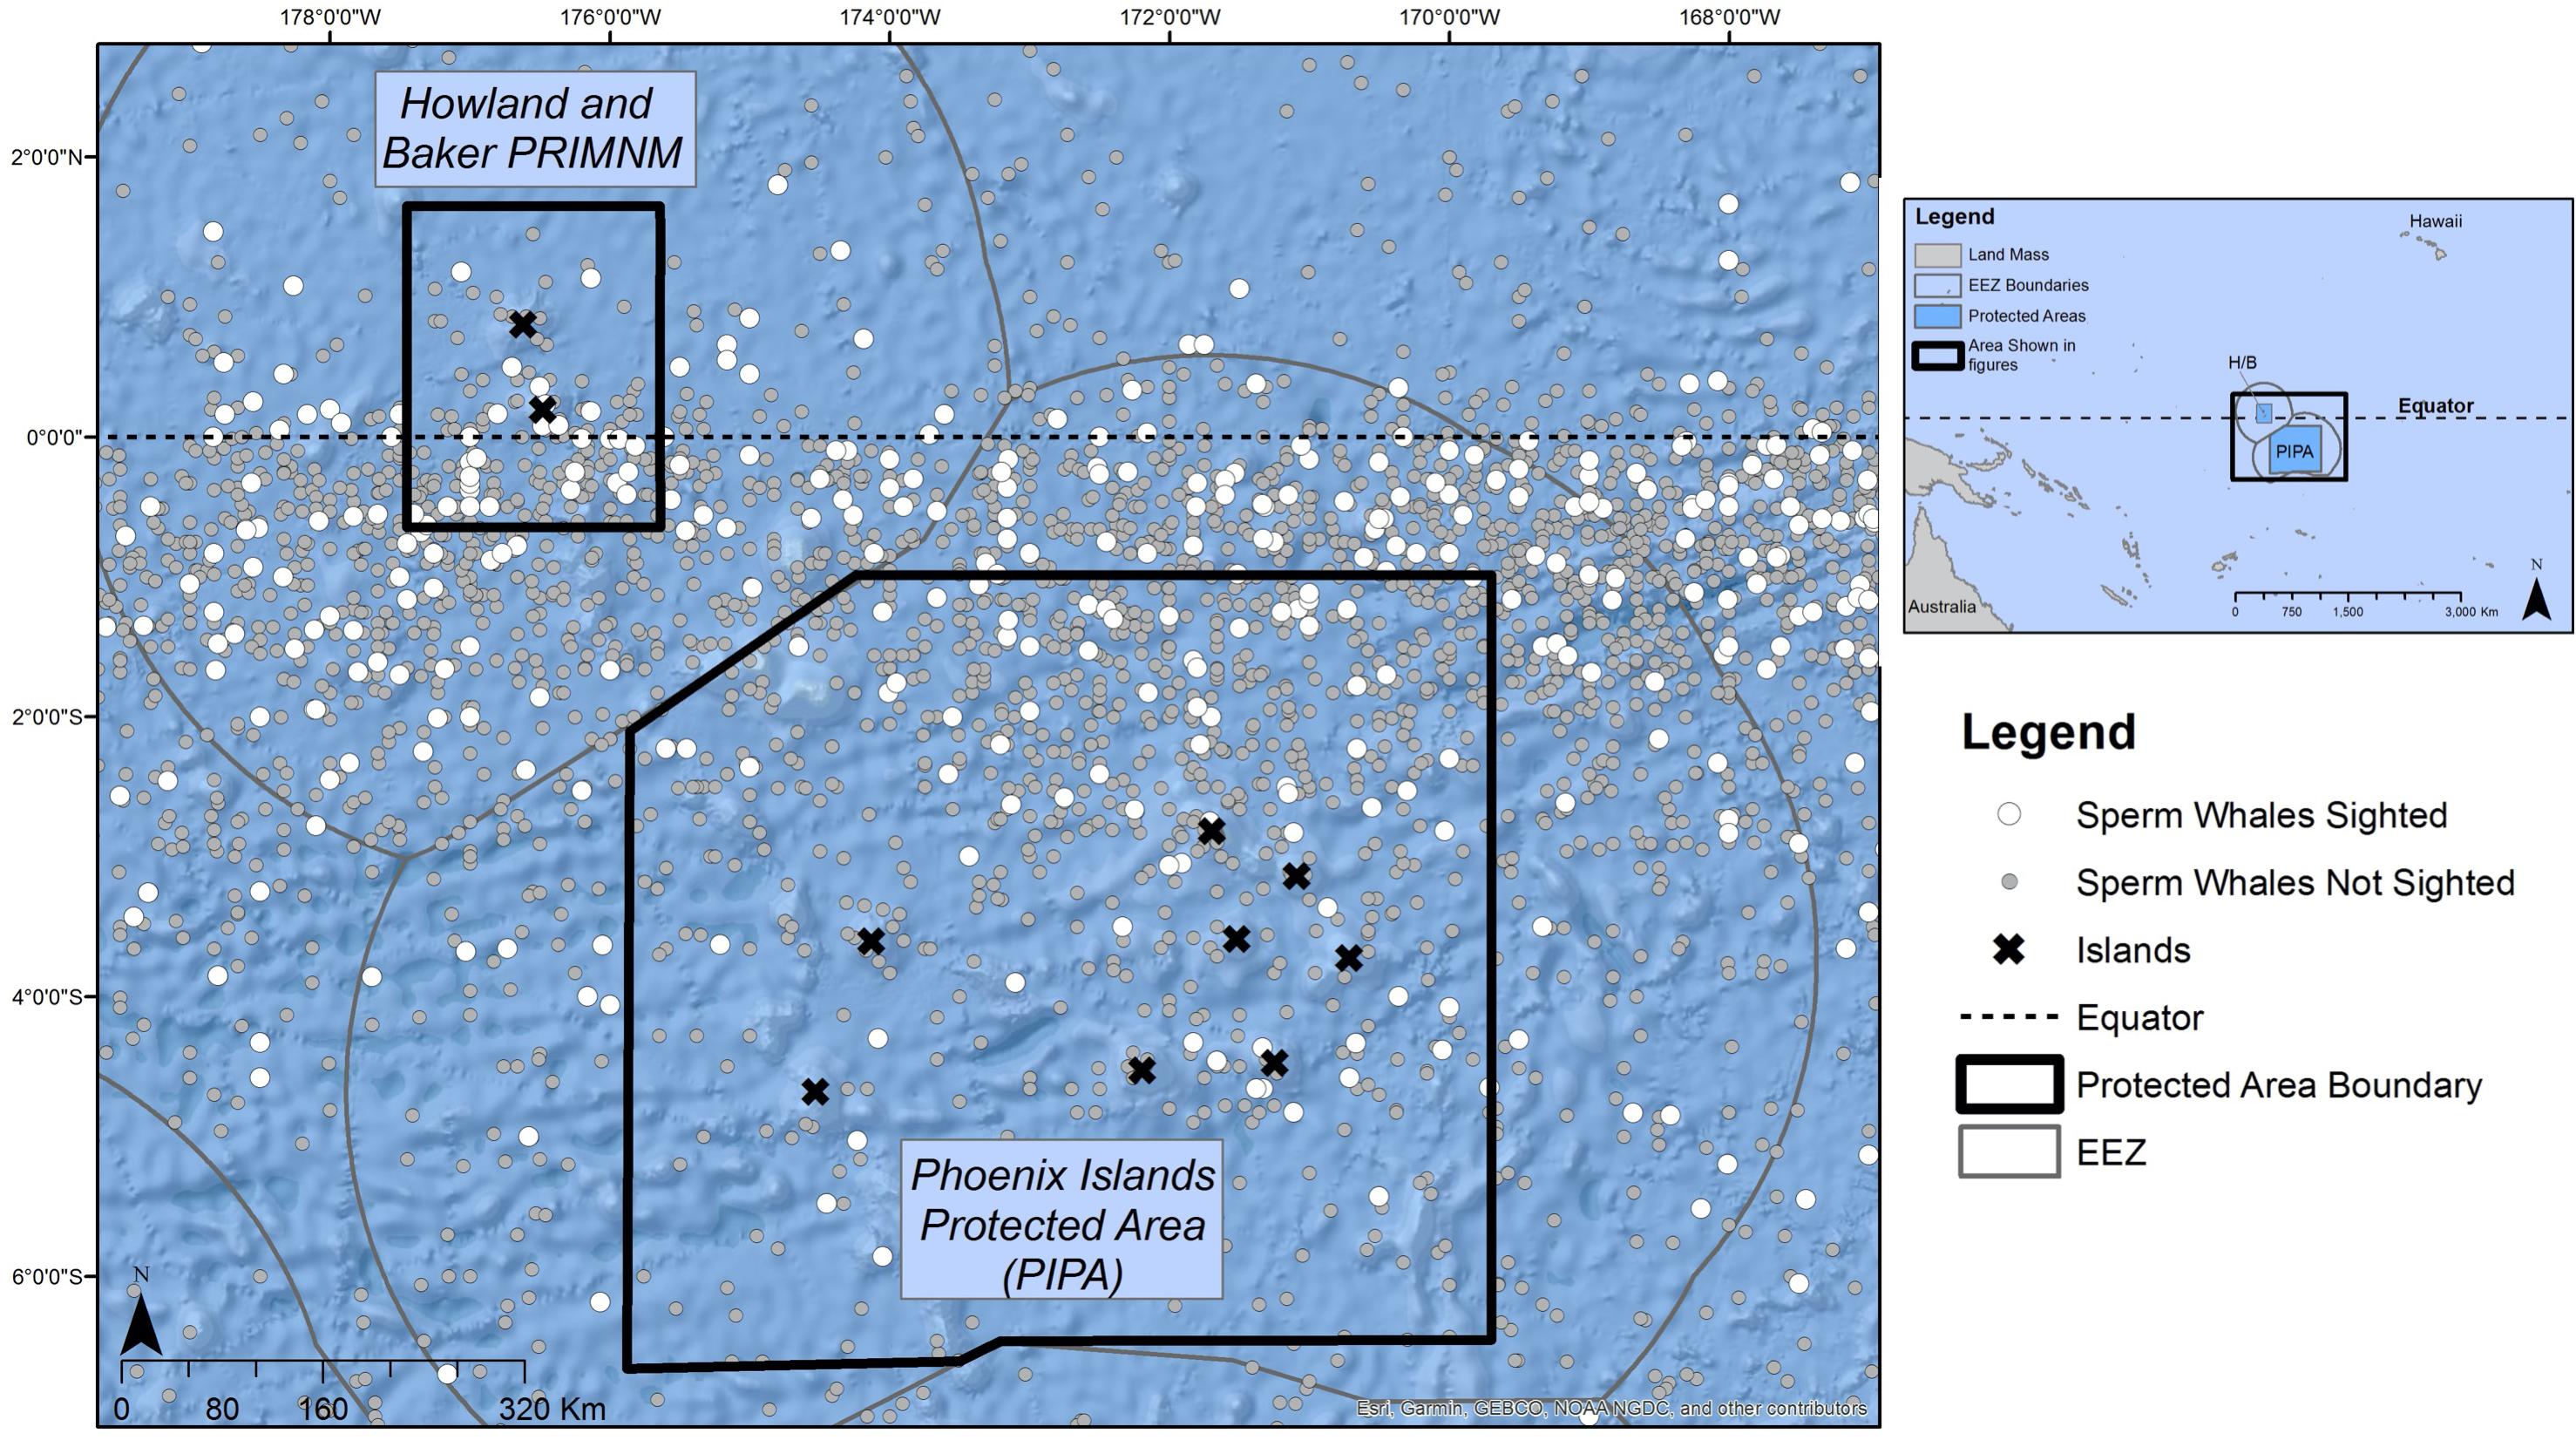
Figure 1. Study area, with marine protected area borders outlined in black and historical whale records plotted with white dots (if whales sighted) and gray dots (no whales seen). Data from Smith et al. (2012).
Historical Records
A subset of the historical American based whaling data from Smith et al. (2012) was used to determine a baseline distribution of sperm whales around these two equatorial Pacific MPAs. This dataset includes 2,989 days of whaling effort between 1825 to 1876, with the vast majority of effort occurring between 1825 and 1850 (Figure 2). Following the established methods of Smith et al. (2012), we used each logbook entry as representation for 1 day of whaling activity. Each daily entry included the date (day, month, and year), the coordinates of the vessel’s position (latitude and longitude), the type of whale encounter (described below), and the species and number of whales encountered. Whaling ship logs from both vessels that were actively hunting and transiting the area were utilized for this study. We sorted these entries into two categories: (1) days when a whaling vessel did not see a sperm whale, and (2) days when a vessel sighted or captured a sperm whale.
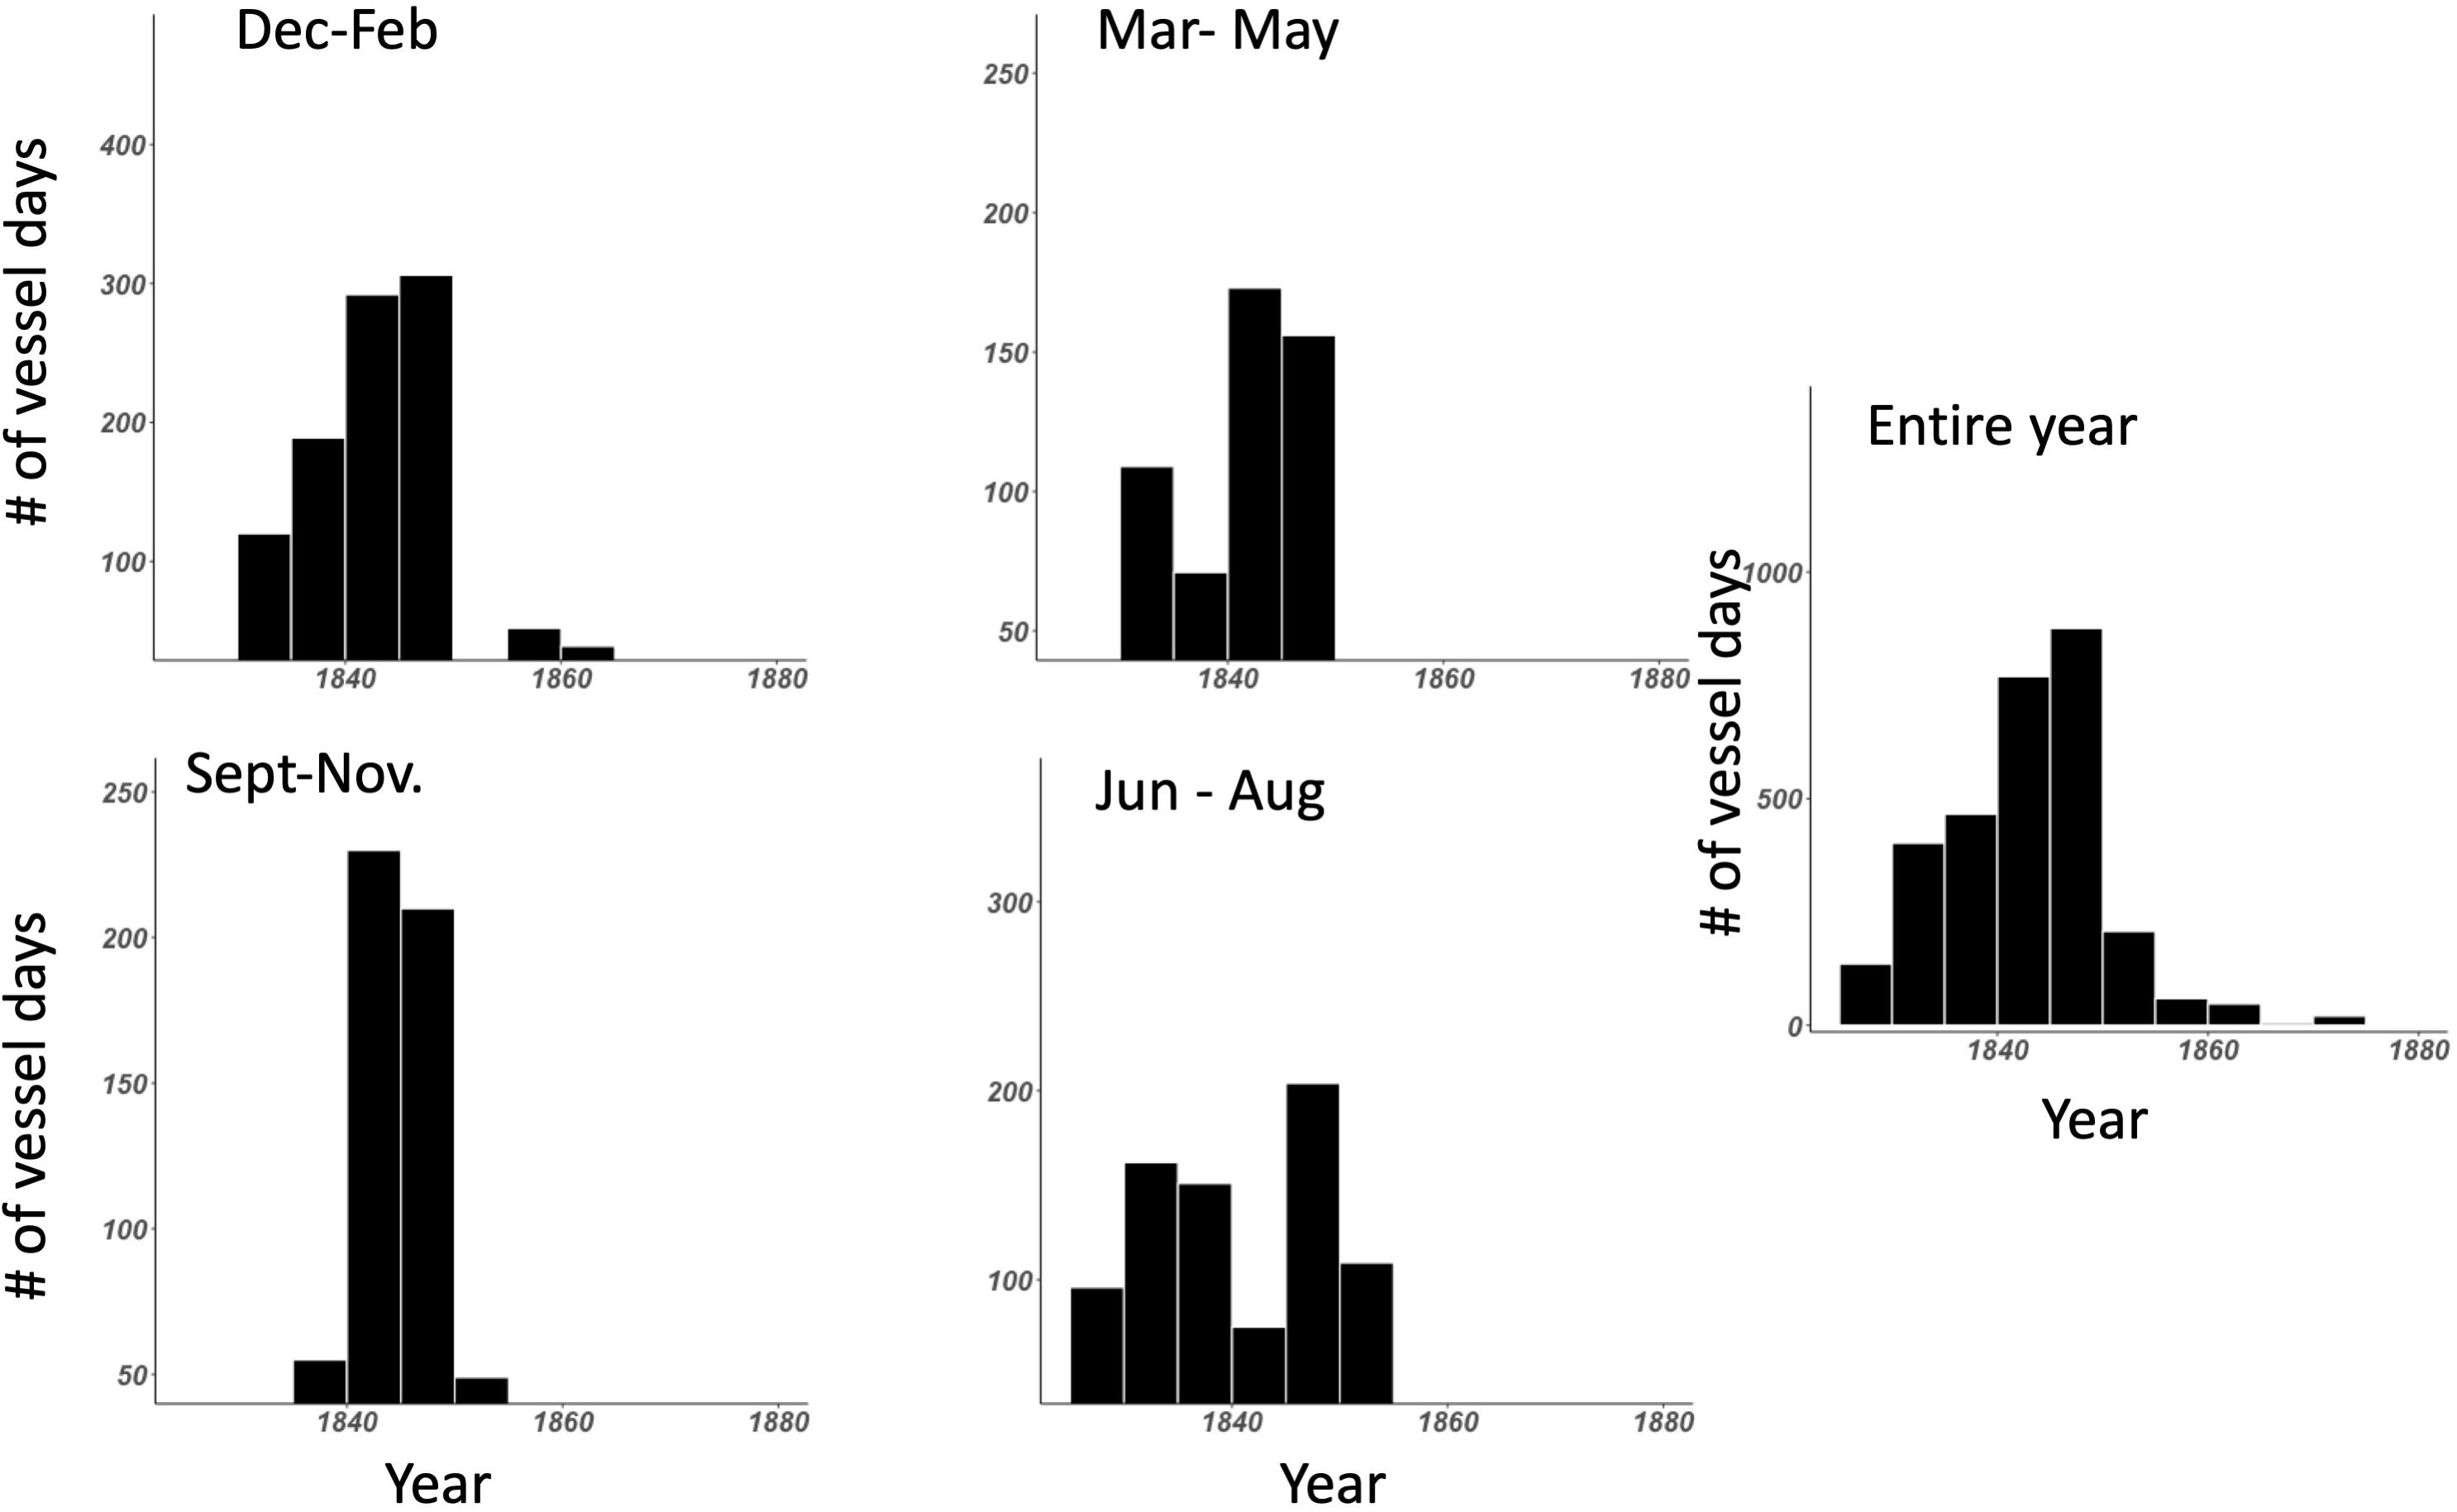
Figure 2. Histograms of the effort in terms of vessel days through the data set broken out quarterly and the total for the entire Smith et al. (2012) dataset.
Geospatial Analysis
We calculated the number of DPUE of sperm whales in the study area, which were in turn used to calculate the a A Getis Ord Gi∗ hot spot analysis. These geospatial analyses were performed using Environmental Systems Research Institute’s (ESRI) ArcMap 10.6 Geographic Information Systems (GIS) software. All shapefiles and rasters used the projected coordinate system WGS 1984 PDC Mercator. Analysis for this study was presence/absence only; we did not attempt to use abundance in any analysis presented here because the ship log data does not have high enough accuracy to depict abundance.
To visualize the total number of sperm whale sightings within both MPAs and surrounding waters, we calculated DPUE, which corrects for uneven distribution of whaling effort across the region. We produced this effort correction by first creating a grid with 50 by 50 km cells generated using the ArcMap 10.6 fishnet tool. This grid size was chosen after exploring the data to determine which grid size would provide adequate spatial coverage without sacrificing spatial resolution. The data were annealed to the grid using the spatial join tool available with the ArcMap spatial analyst extension. A join count column was automatically generated to count the total number of days whaling vessels were present within a grid cell (effort). The days with sperm whales sighted (detected) were also calculated by adding up all entries within a cell using the sperm whale absence (0) or presence (1) column within the datasheet. DPUE, with effort being the total number of vessel days within the cell and detections being any vessel day a sperm whale was sighted or captured in the same cell, were then calculated by dividing sperm whale presence by whaling effort. Due to temporal variation in effort over the 51 years of the data, we were unable to conduct more granular temporal analyses without sacrificing spatial resolution.
A Getis Ord Gi∗ hot spot analysis was conducted on the DPUE data using an inverse distance weighting matrix and False Discovery Rate (FDR) correction in ArcMaps 10.6 in order to analyze the significance of hotspots for whales per unit effort and generate maps of areas where sperm whales (or groups of sperm whales) were significantly more likely to be encountered (Asaad et al., 2018). The inverse distance weighting was chosen because of uncertainty in distance parameters explaining sperm whale distribution (Kelly-Hope et al., 2009). The inverse distance weighting method used assumes that all cells are related, but that cells closer to each other are more related than cells farther away. Cells with no vessel days (no effort) were removed from the analysis to prevent false negatives from affecting the analysis.
The Gi∗ inverse-distance weighting parameter, by default, calculates the distance band for which every feature in the dataset has at least one neighbor (adjoining cell). Conversely, we can also specify a distance band manually within the Getis Ord Gi∗ tool based upon the incremental spatial autocorrelation tool with row standardization in ArcMaps, which calculates the optimum number of neighbors for which spatial autocorrelation is most pronounced (Cleasby et al., 2020). We tested the two peaks (11 neighbors with a distance band of 416 km and 24 neighbors with a distance band of 763 km) along with the Gi∗ bandwidth default assumption to see if hotspot results differed at all spatially or in intensity. We found no difference in hotspot intensity or spatial distribution between the two distance bands and tool default assumptions. Given the lack of variation in the results based on the different distance bands, the analyses presented here use the default parameters.
The FDR correction for the Getis Ord Gi∗ test was applied to correct for seemingly significant hotspots that appear by chance (multiple testing and problems with spatial dependency). The correction works by estimating the number of false positives for a given confidence level and adjusting the critical p-value accordingly. Significant p-values are ranked from smallest (strongest) to largest (weakest), and based on the false positive estimate, the weakest are removed from this list (Caldas de Castro and Singer, 2006). Normally, the Getis Ord Gi∗ test calculates a z-score and p-value for each grid cell. The z-score determines if a cell is a hotspot (attractive) or cold spot (deterrent) while the p-value provides a statistical significance test of the z-score. For this analysis we presented three different significance values (90, 95, and 99%) based on the FDR correction factor instead calculated in ArcMaps (Ord and Getis, 1995).
In addition to analyzing data for the entire historical time period overall, we also generated maps in 3-month intervals. Even though there is no winter or summer at the equator, sperm whales are widely dispersed and highly mobile, and thus may have been influenced by boreal or austral seasonality when moving to and from the study area. These factors may have also influenced the presence of whaling vessels as well, which make determining intra-annual variation in the presence of sperm whales more difficult.
20th Century Records
To document the more recent distribution of sperm whales in the area, we tried to locate 20th century sperm whale sighting data using the OBIS. Unfortunately, all OBIS records in the PIPA and Howland/Baker units of the PRIMNM region were from 1913, and so do not provide truly modern observations (Woolmer, 2013). The 1913 data were accessed from OBIS then ingested into ArcMap using the same process outlined above. There is no information on the number of days with no detections associated with the OBIS records, so we were unable to calculate DPUE; as such, only the distribution of observations was plotted. Sperm whale sightings have been more recently documented by Sea Education Association (SEA) in July 2015 and again in July 2019; these anecdotal summaries are outlined in the results.
Oceanographic Conditions
To highlight the oceanographic conditions that may influence the distribution of sperm whales in the Phoenix Archipelago, part of the equatorial upwelling region, we measured the velocity of the equatorial currents in the area using a ship-mounted 75 kHz OceanSurveyor ADCP (Teledyne RDI, San Diego, CA, United States) on a meridional transit aboard the Sea Education Association (SEA) research vessel SSV Robert C. Seamans from July 11 to August 6, 2016. To examine surface chlorophyll a concentration as a proxy for ocean productivity in the area, we obtained an 18-year record (2002 to 2020) of calculated mean level three AquaMODIS satellite measurement from NASA’s Ocean Data Processing System1.
Results
There were 133 unique voyages with 2,989 individual vessel days spanning from 1825–1876 within our study region within the historical dataset. Out of the 2,989 entries, 2,614 represented days when vessels did not encounter whales of any species (87.5%) within the study area. Whaling effort was most concentrated near the equator and northeast corner of PIPA (white dots in Figure 1). Current velocity measurements (Figure 3) show a pattern of currents typical to the equatorial upwelling region. Currents were dominated by zonal flow, with the Equatorial Undercurrent (EUC), North Equatorial Countercurrent (NEC), and the pair of South and North Deep Countercurrents (SDCC and NDCC, also known as Tsuchiya Jets) being the principal easterly currents (Figure 3). Westerly flow took in the North and South Equatorial Currents (NEC and SEC), the latter being split into two lobes by the strong EUC. The majority of the cells with DPUE values (Figure 4) are associated with areas of relatively high productivity as measured by chlorophyll a (Figure 5). Quarterly DPUE analysis indicates that whales were present throughout the year, with more detections made in the December through February quarter (Figure 6). The highest density of whale detections was concentrated near the equator within our study area, regardless of quarter. Interestingly, the Getis Ord Gi∗ analysis only detected hotspots with 99% confidence in the southern reaches of PIPA below three degrees latitude and above the equator around the Howland/Baker unit of the PRIMNM. Given the low number of hotspots, it was not possible to correlate them with any physical parameters such as oceanography and bathymetry. There were no cold spots detected.
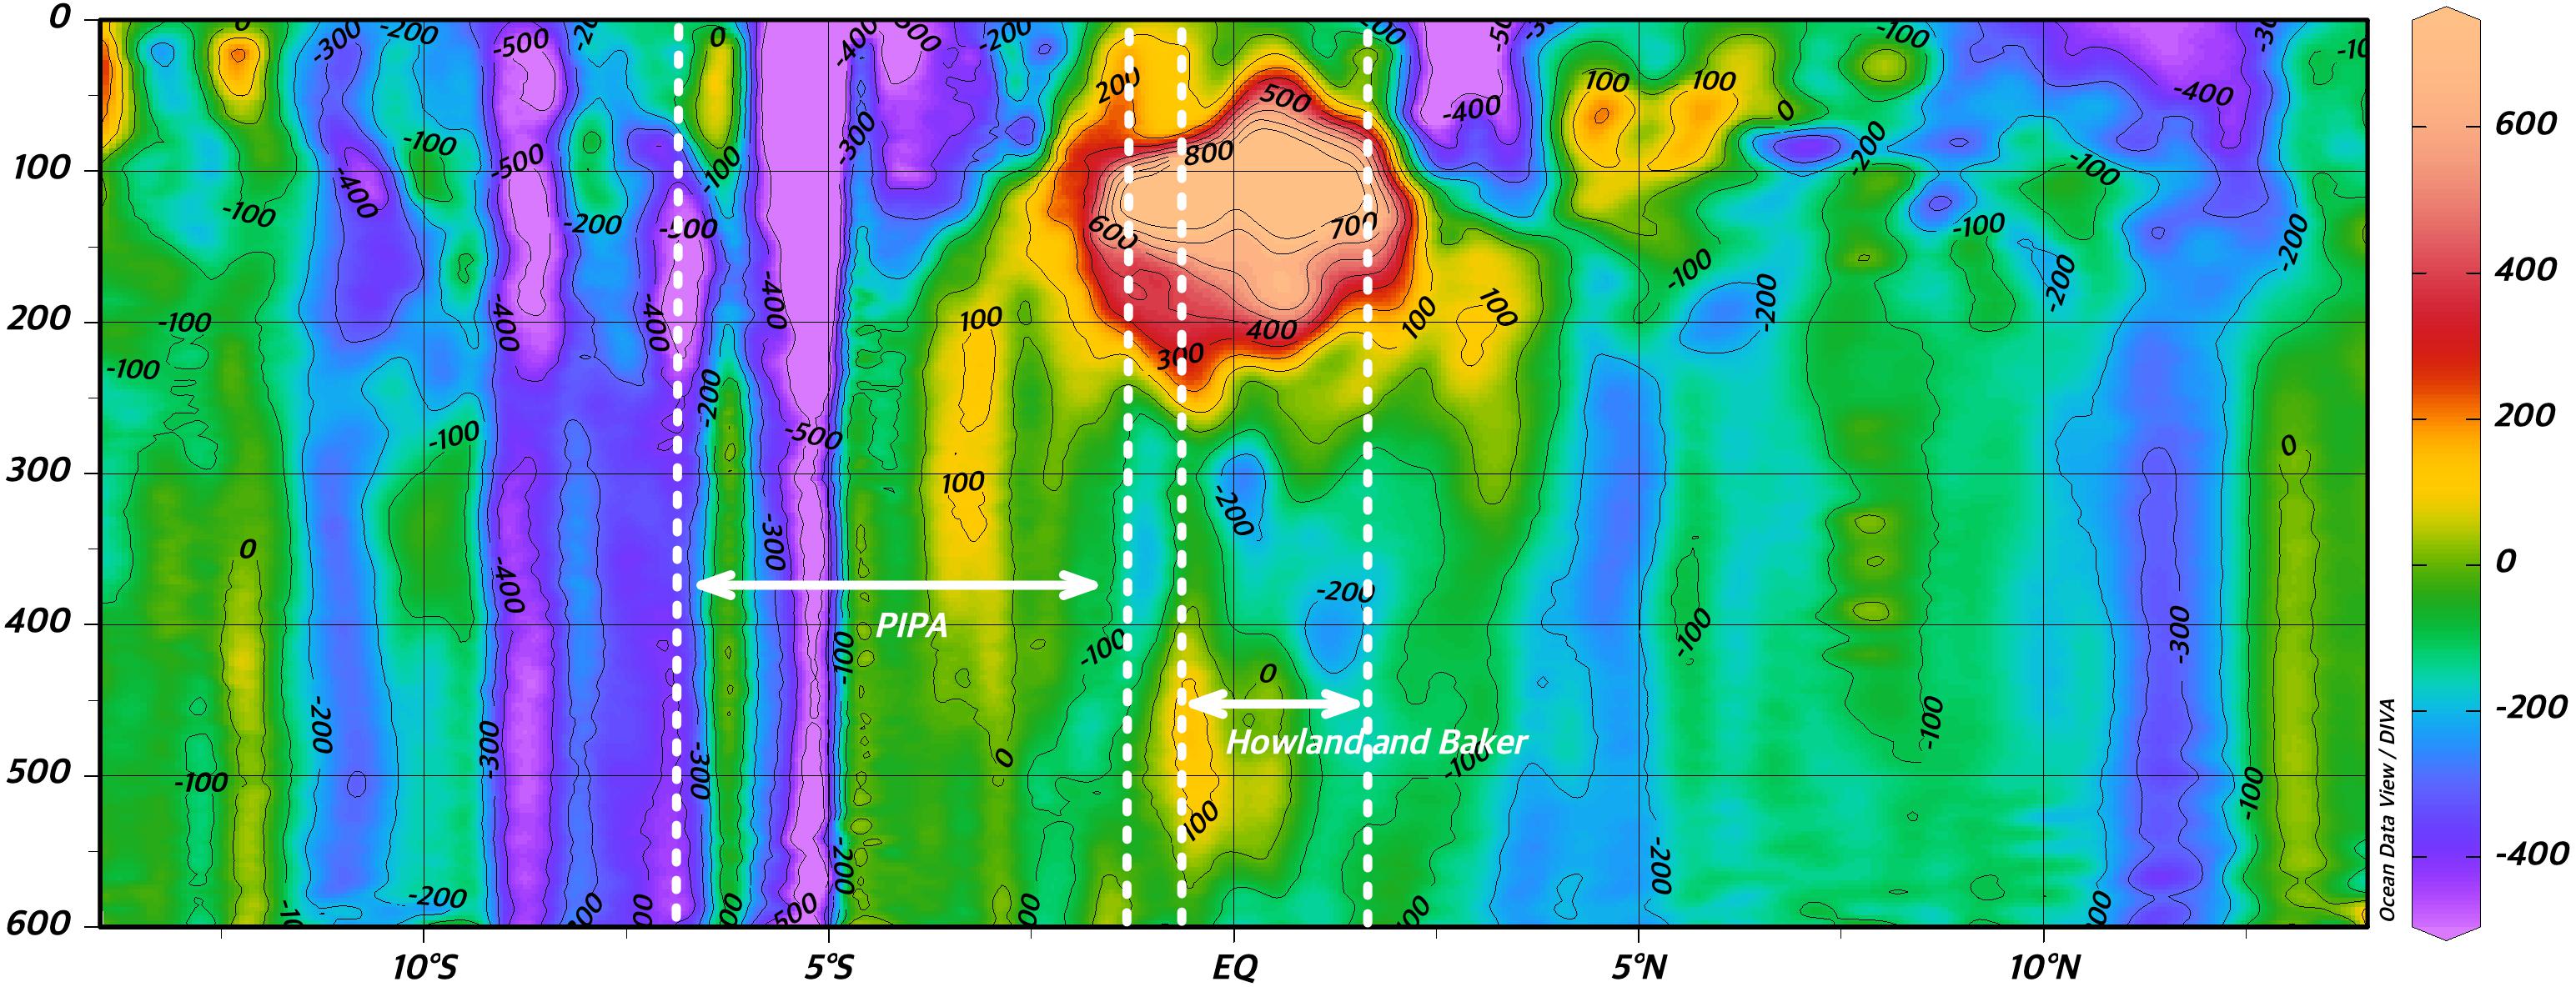
Figure 3. Acoustic Doppler Current Profiler measurement of the east component of equatorial currents at the latitudes of PIPA and Howland and Baker (north/south boundaries indicated with dotted lines). The complex system of east- and west-flowing currents and countercurrents include the Equatorial Undercurrent (EUC), North Equatorial Countercurrent (NECC), North and South Equatorial Currents (NEC, SEC, and respectively), and the North and South Deep Countercurrents (NDCC, SDCC, and respectively). Positive (warm colors) values are east flowing currents, negative (cold colors) denote westerly flow. Data were collected in July/August of 2016 on a north to south transect with mean longitude of –166°E.
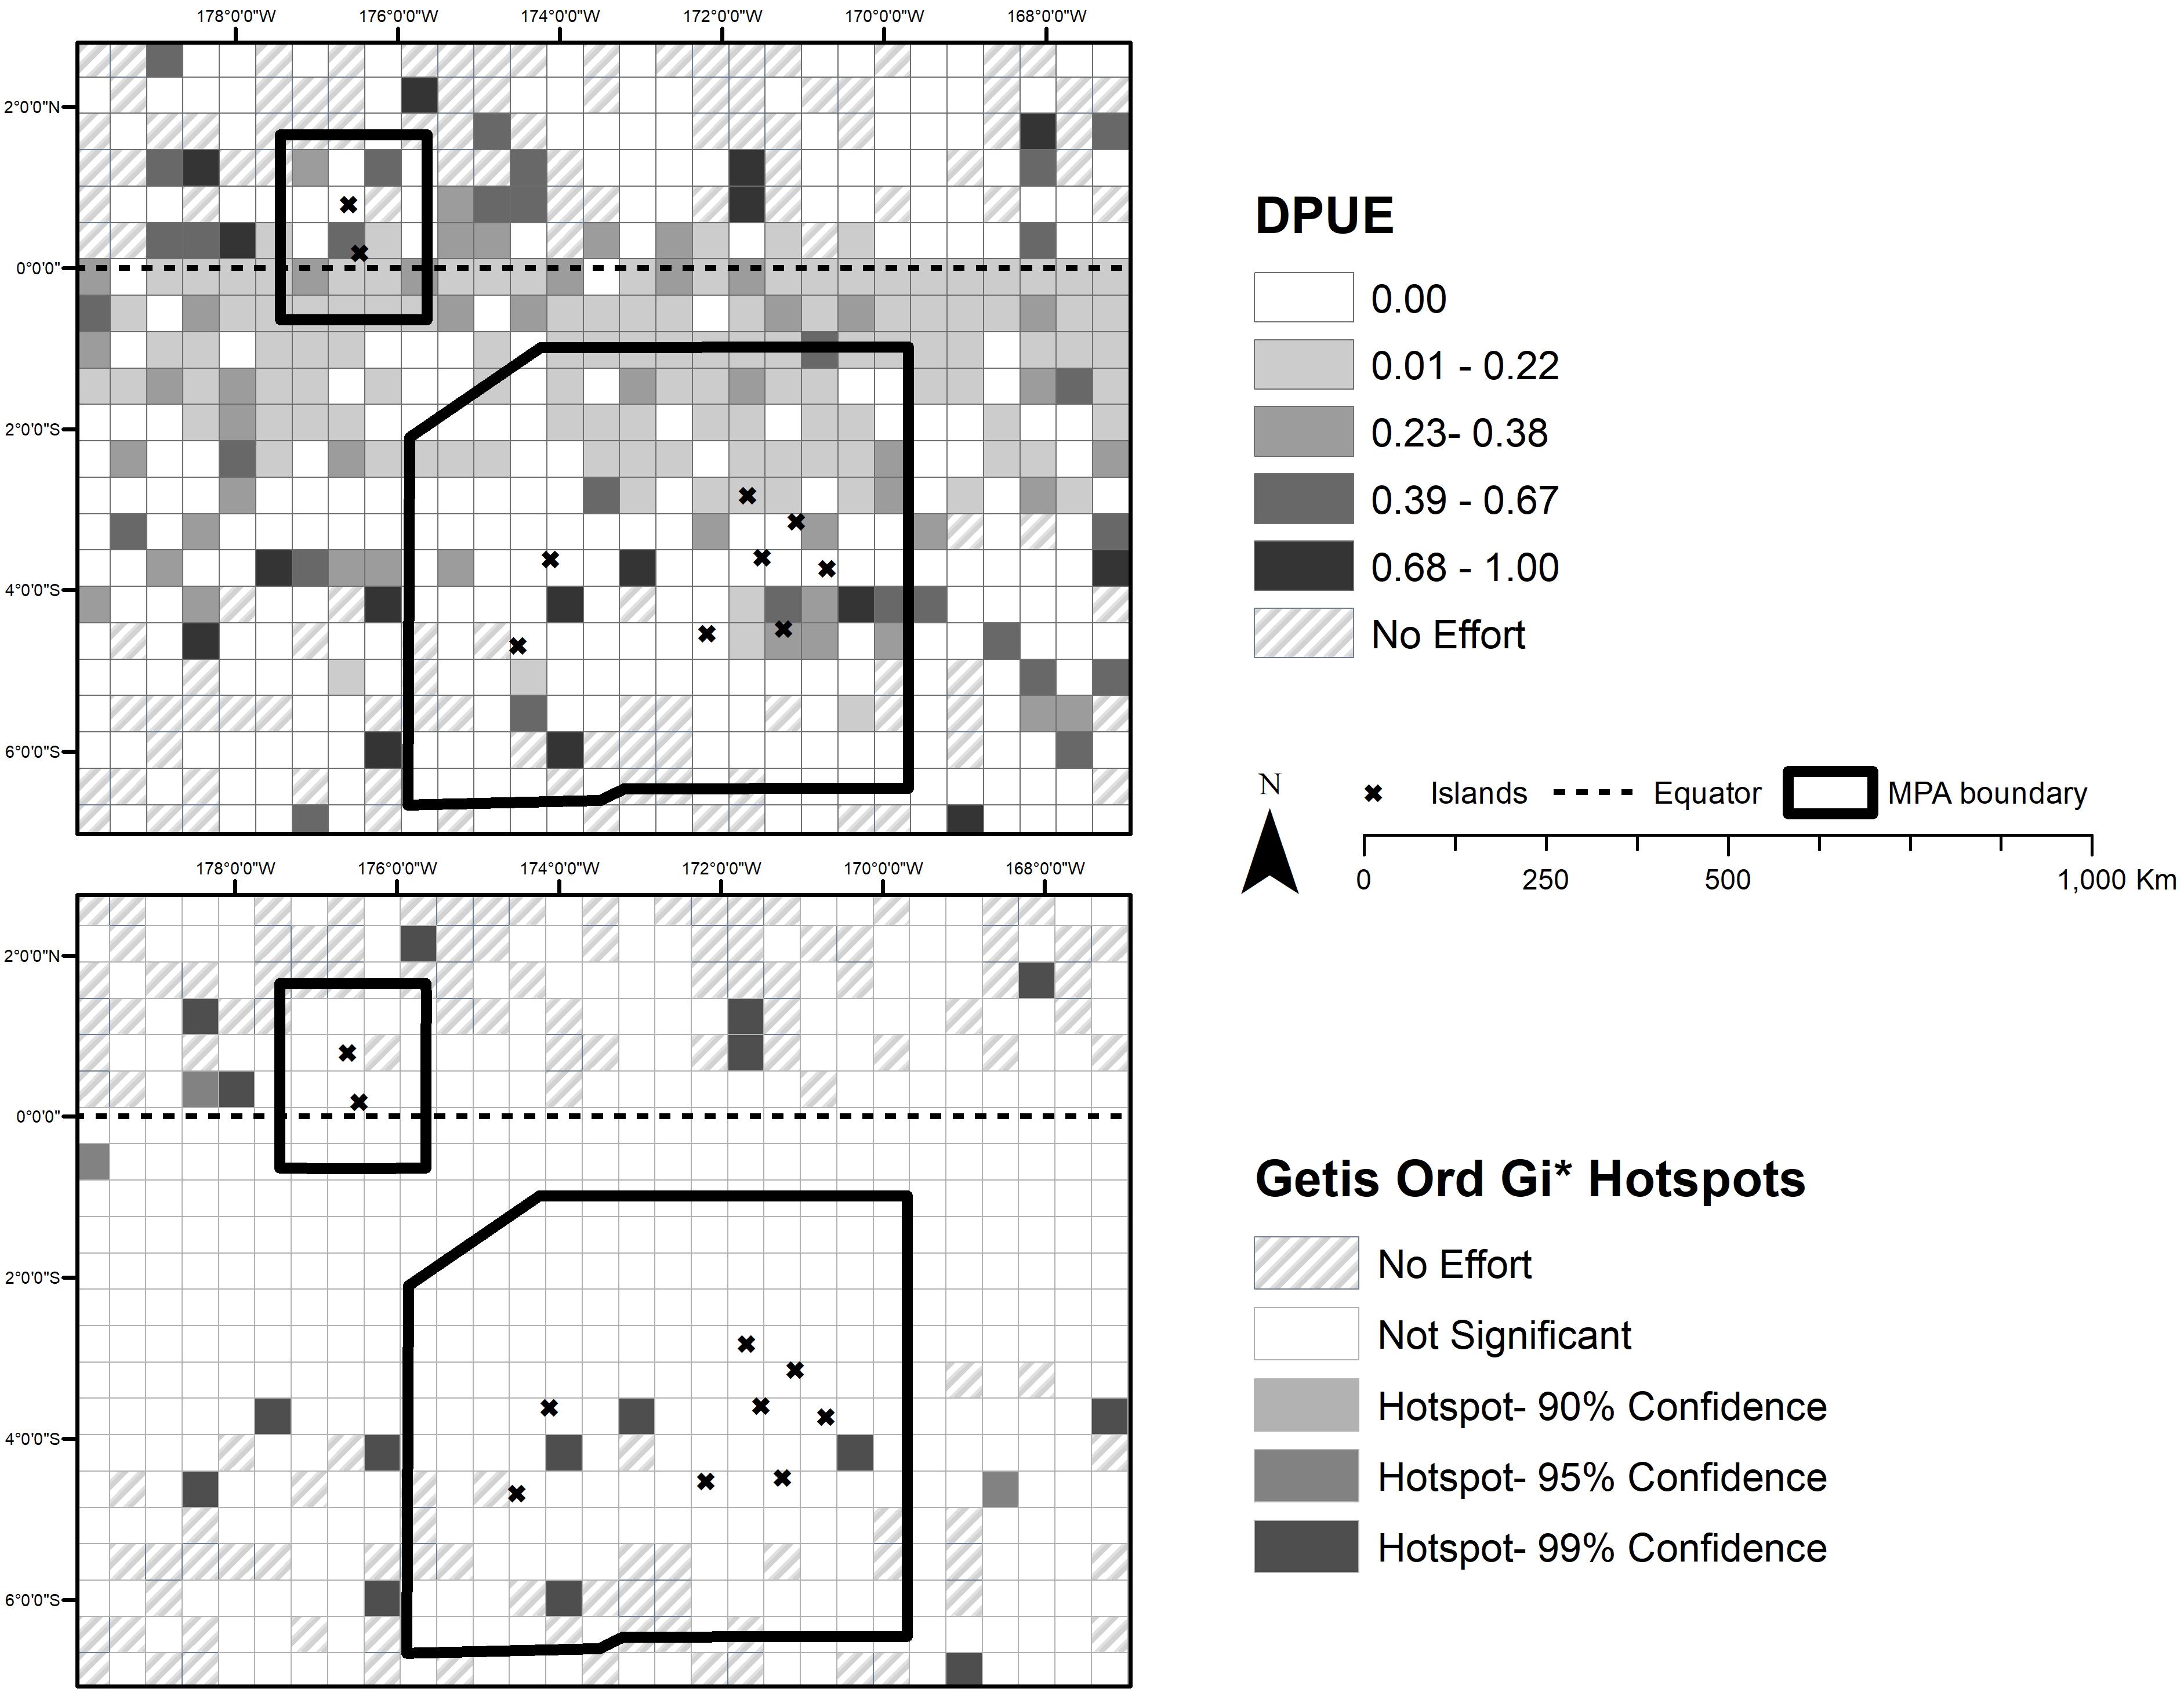
Figure 4. (Top panel) Detections of whales per unit whaling effort (DPUE) for the entire historical data set. (Bottom panel) Getis Ord Gi* hotspot analysis showing areas of particular frequent sperm whale sightings.
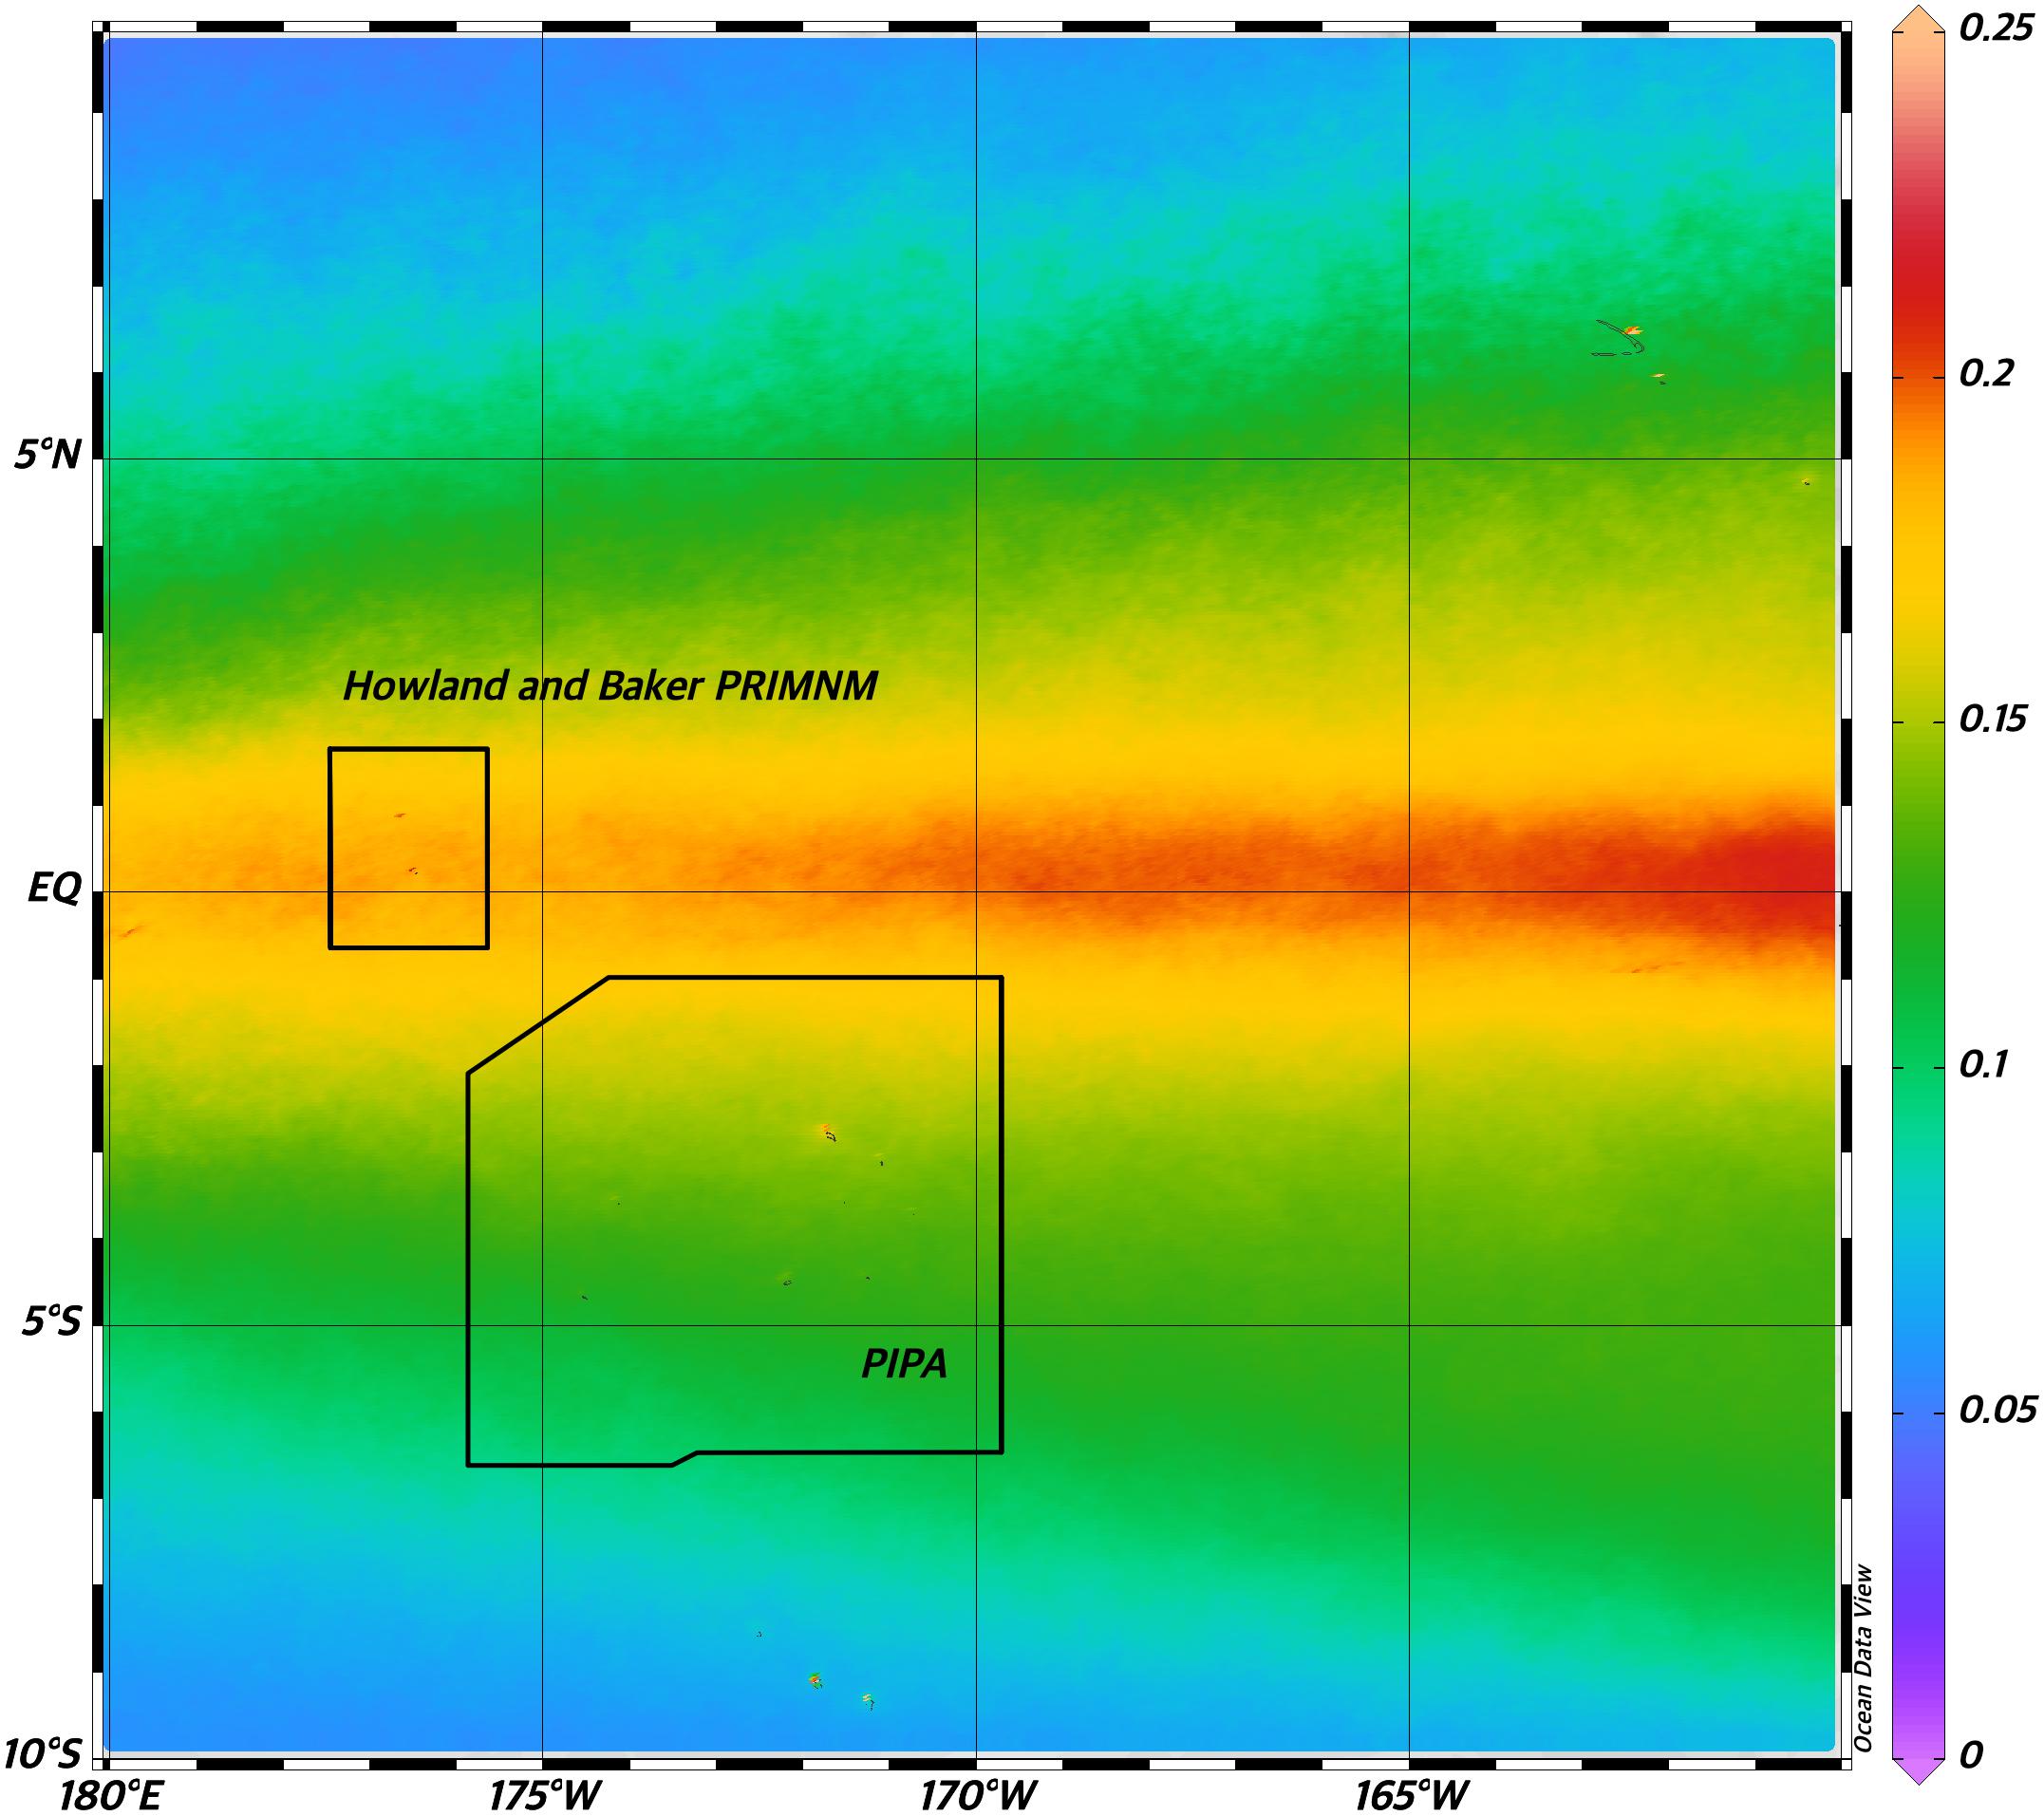
Figure 5. Mean surface chlorophyll concentrations [μg*l–1] from MODIS Aqua satellite mission from 2002 to 2020 showing the spatial overlap between the equatorial upwelling region and both PIPA and Howland and Baker PRIMNM unit (NASA). NASA Goddard Space Flight Center, Ocean Ecology Laboratory, Ocean Biology Processing Group. Moderate-resolution Imaging Spectroradiometer (MODIS) Aqua Chlorophyll Data; 2018 Reprocessing. NASA OB.DAAC, Greenbelt, MD, United States. data/10.5067/AQUA/MODIS/L3B/CHL/2018. Accessed on 06/17/2020.
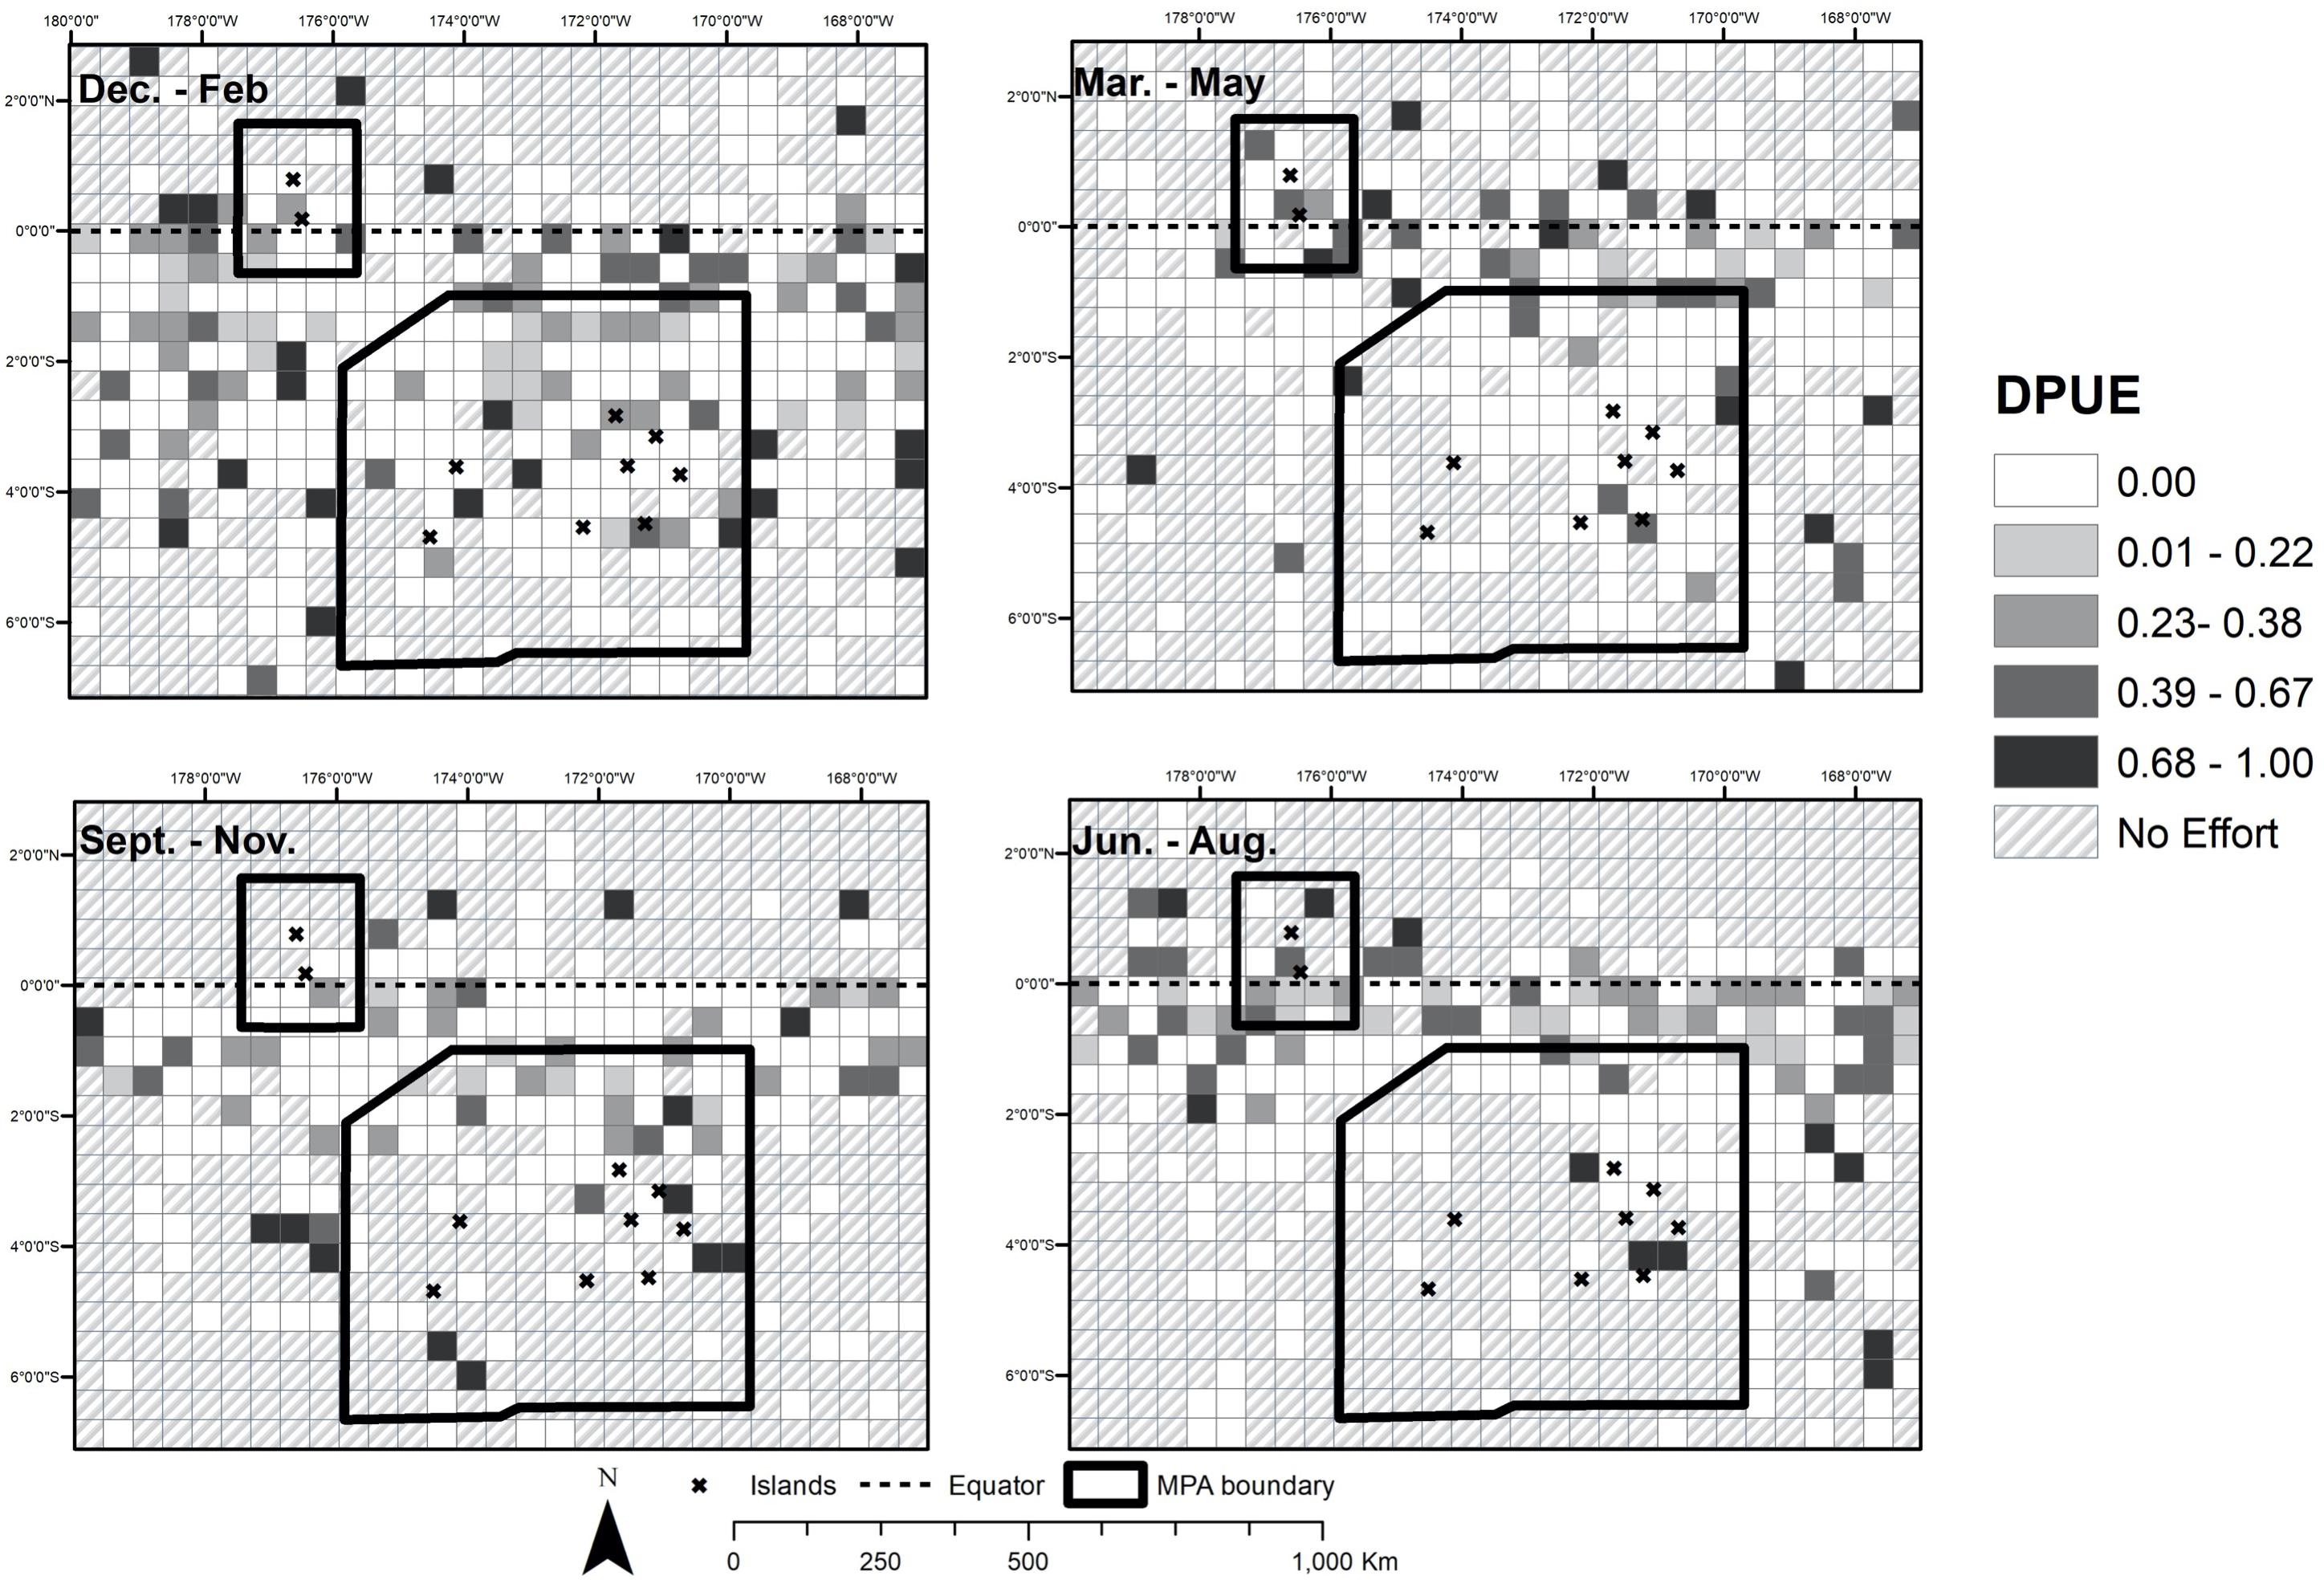
Figure 6. Detections per unit effort of sperm whale sightings in quarterly intervals.
In comparing the 19th century historical whaling data with the 20th century records from OBIS (372 recorded sightings), there was no apparent change in sperm whale distribution between the two date ranges (Figure 7). The whales still seem to be concentrated in equatorial waters, with a higher distribution to the south of the equator, overlapping with what is now PIPA. The only truly modern records of sperm whale presence that could be located were anecdotal sightings by SEA, which photographed six individuals but reported at least thirty individuals within the PIPA boundary in 2015 (Figure 8).
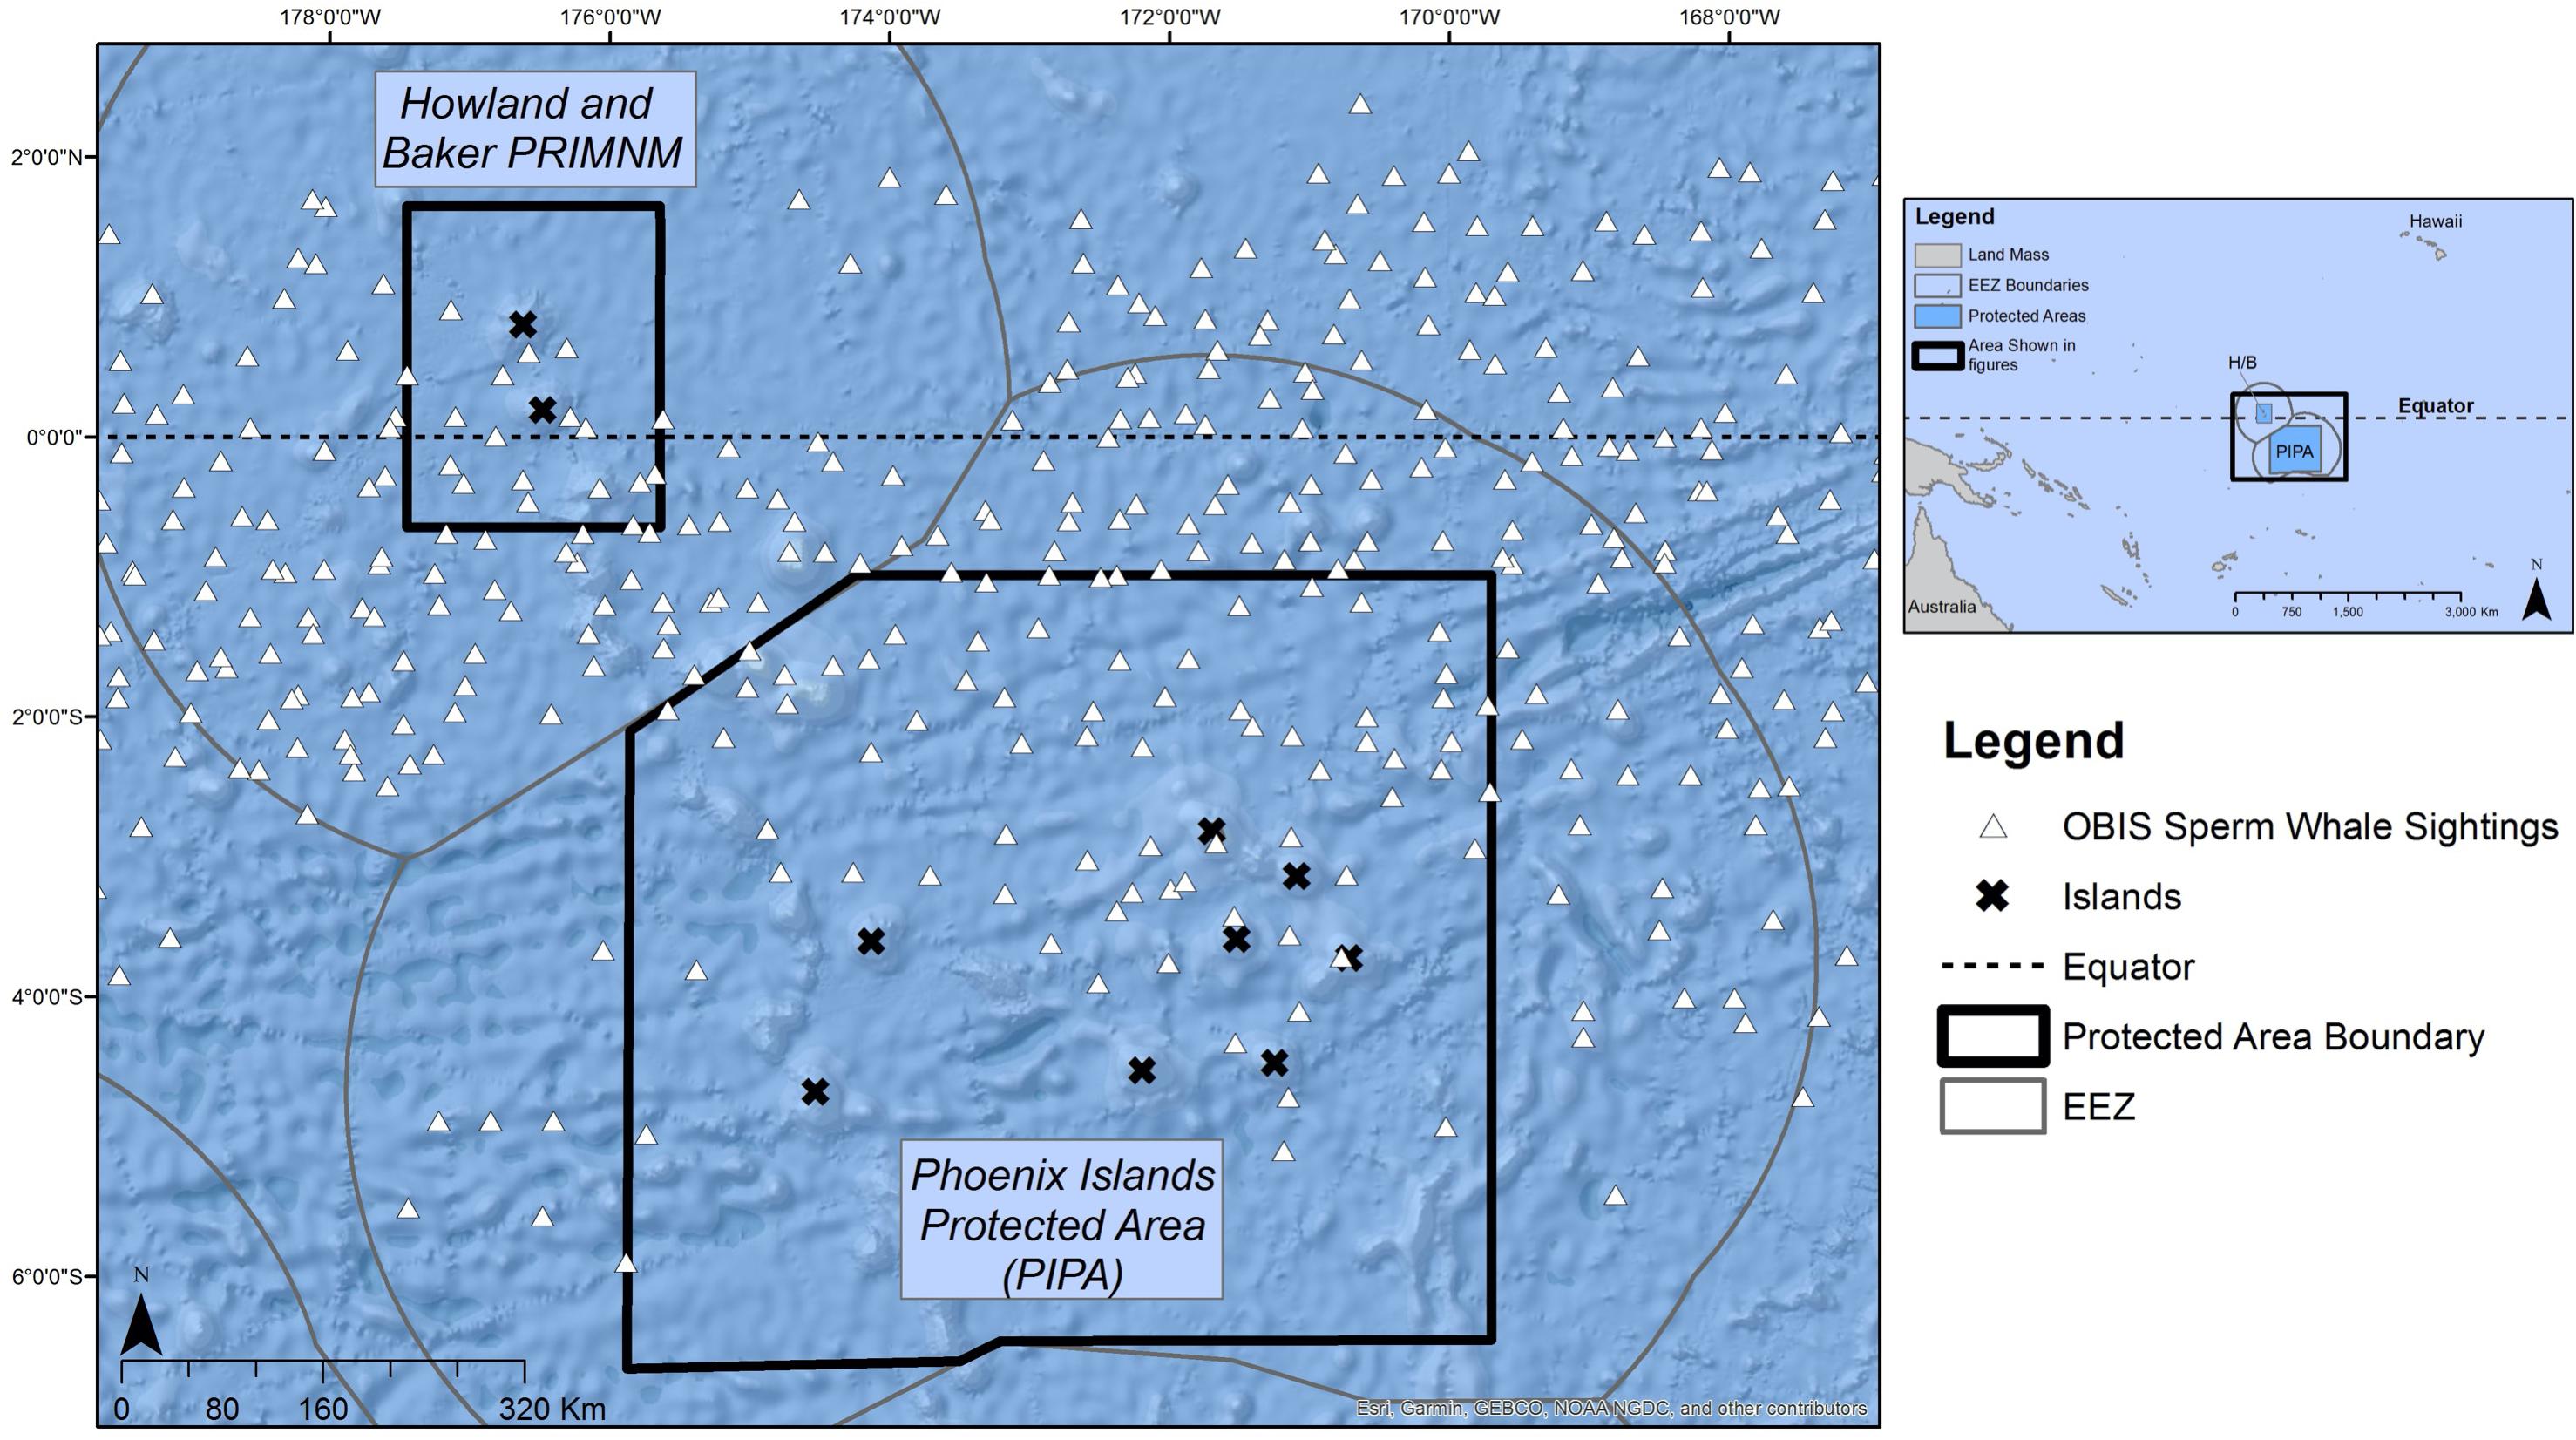
Figure 7. OBIS records of sperm whale sightings in and around the Phoenix Islands and Howland and Baker units of the Pacific Remote Islands Marine National Monument (PRIMNM). All sightings in OBIS come from 1913, which were from the Wildlife Conservation Society Dataset (Woolmer, 2013).
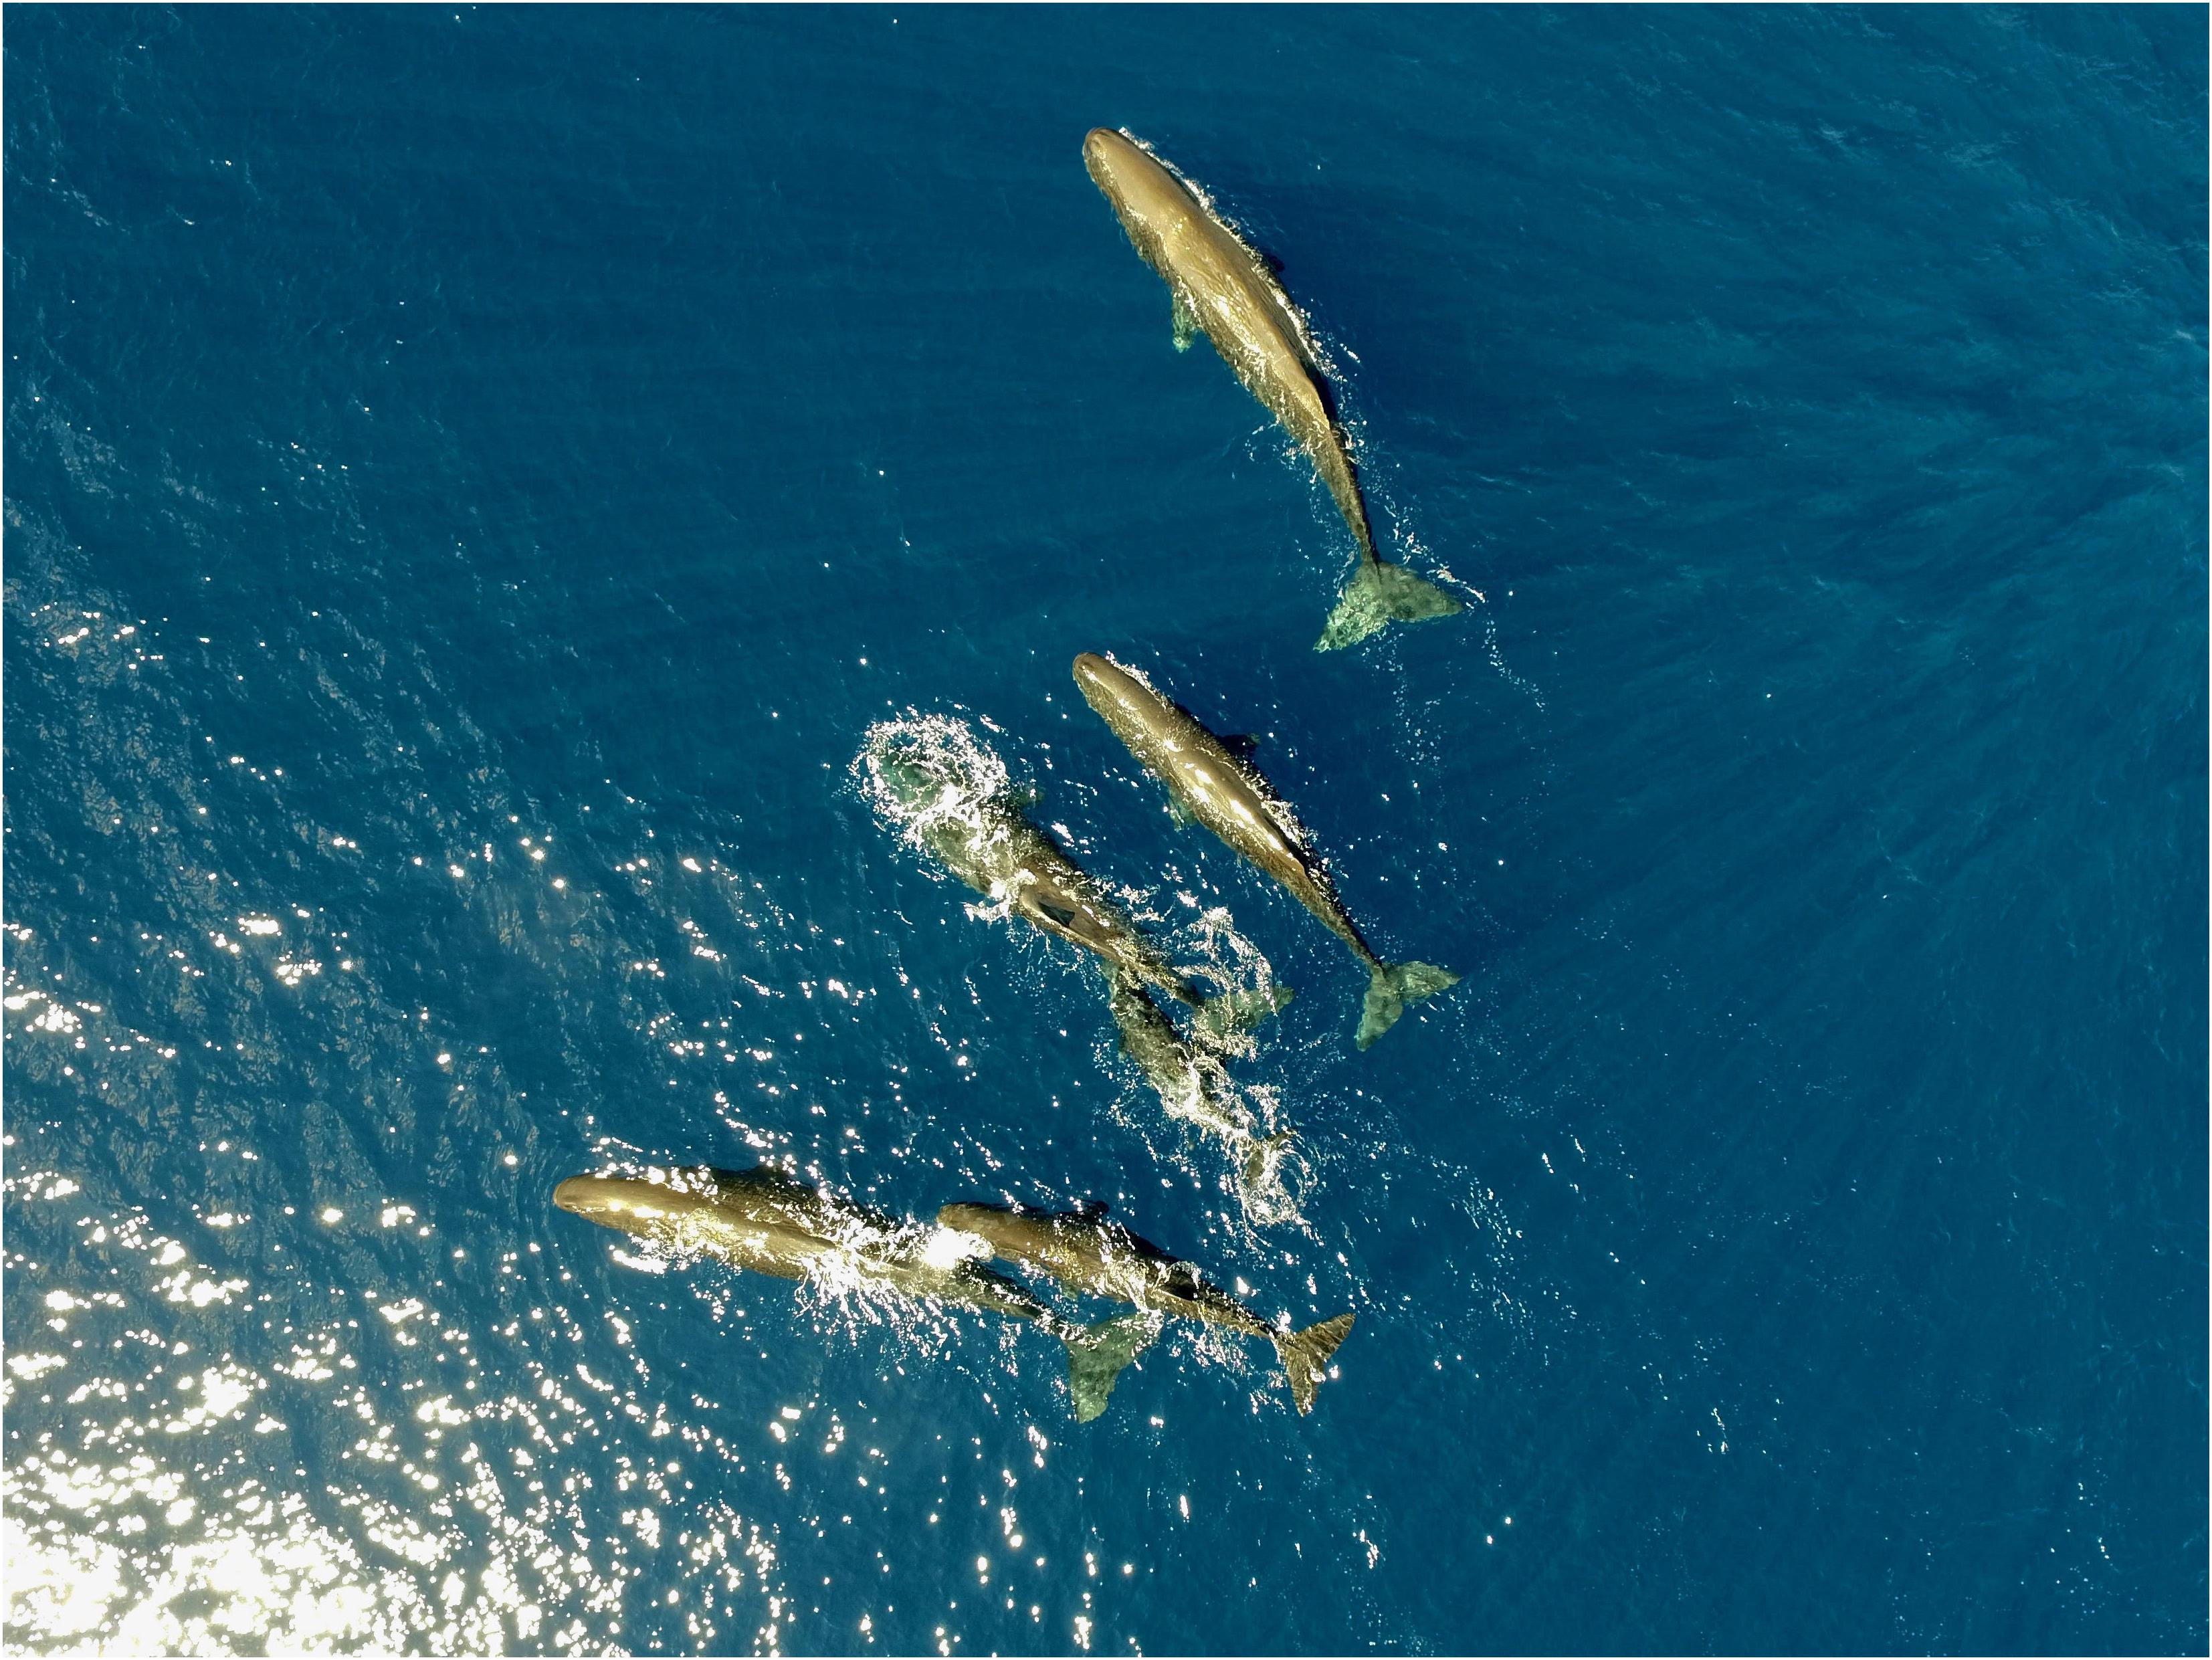
Figure 8. Drone photograph of sperm whales taken inside of PIPA on July 2015 by the SEA vessel SSV Seamans.
Discussion
The Phoenix Archipelago is one of the most protected island chains in the Pacific and thus could be an important region for sperm whale conservation given its remote location, complex and productive oceanographic upwelling, and low vessel traffic given the prohibition on commercial fishing (presumably resulting in low noise pollution). The twinned marine protection efforts of Kiribati and the US across the Archipelago create a large spatial area (4,59,950 km2 combined) with strong protection policies. Though the effects of MPAs on large mammal populations are unclear (Grech and Marsh, 2008), it is thought that large-scale MPAs should attract large mammals (Hoyt, 2012) even though sperm whales may utilize and depend upon waters beyond MPA boundaries. However, the available data to test MPA efficacy for large mammals is not yet available given that the level of effort in studying large marine mammal populations in the central Pacific has been low, and the variability in year-to-year distributions of relatively small modern populations has been comparatively high (Cantor et al., 2017). Therefore, conclusions about MPA effectiveness in the rebuilding of marine mammal populations have not yet been made (Taylor et al., 2007), and the question of whether MPAs – even large, remote, and uninhabited MPAs such as these – are sufficiently large enough to positively impact large mammal populations is still an open question.
Sperm whales are elusive pelagic organisms that are hard to count, meaning that sperm whale populations in open ocean environments are not well documented (Whitehead, 2002; Merkens et al., 2019). However, using the assumption that open-boat whaling success rate is proportional to sperm whale populations (Whitehead and Jaquet, 1996), these whaling log records are one way to approximate prime sperm whale habitat in the 1800s for future comparison. However, we may never be able to fully assess the lasting impact to the social behavior of whales. Equatorial resident whales would be mostly female herds and their young (Gosho et al., 1984; Lyrholm et al., 1999), sometimes chaperoned by an attendant bull. Sperm whalers mainly targeted bulls (Whitehead et al., 1997), which historically have migrated from higher latitudes to the equator to mate (Gosho et al., 1984; Rice, 1989), potentially with site fidelity (migrating to and from specific areas that may have hosted specific female pods). As such, selective whaling on bulls may have led to social disruption, and population recovery may not effectively reinstate the same patterns of migration, mating, or geographic fidelity (Whitehead et al., 2012). Thus, there remain unknown implications of whaling on whale behavior and population structure. However, applying spatially explicit analyses to historical datasets offers the best-possible opportunity to answer these open questions, specifically to assess (a) whether modern whale distribution matches historical distribution, and (b) provide geospatial context for whether or not hotspots might be differently maintained over season or space in a relatively small population of whales in an era of global change, compared to the frequent sightings and wide distribution found in the historical record.
The oceanographic conditions of the northern region of PIPA and the southern Howland/Baker PRIMNM are greatly influenced by persistent equatorial upwelling (Chavez and Barber, 1987; Pennington et al., 2006), which facilitates the elevated productivity and standing stock of phytoplankton and zooplankton (Ryan et al., 2002), and the intensification and shoaling of the associated subsurface oxygen minimum zone (Stramma et al., 2008). The close association of the historical sperm whale distribution and elevated ocean productivity featured in the upwelling zone is unlikely accidental (Jaquet, 1996), though efforts to map out the missing causative links via measuring sperm whale prey dynamics in the deep scattering layer using shipboards acoustic tools are difficult but ongoing (Hazen and Johnston, 2010). The relationship between surface ocean productivity and presence of whales may be even more complicated, as whales foraging at depth and defecating at the surface have been shown to be a locally significant pathway of iron fertilization in iron limited waters such as the Equatorial Pacific (Lavery et al., 2010; Nicol et al., 2010). If this is the case, the role of whales in the ecology and the nutrient dynamics in the protected areas would have to be re-evaluated and future studies of these systems would have to consider that instead of being solely consumers of the carbon produced in the equatorial upwelling, the presence of whales might be contributing to the elevated primary production of the area.
Our comparison of OBIS data suggests that, despite heavy whaling effort in the 1800s, the Phoenix Archipelago continued to support populations of sperm whales into the 1900s that overlapped with the pattern of higher productivity areas both north and south of the equator. Given the more recent observations made in 2015 and 2019, it is clear that some sperm whales are still in the area, though not enough sightings have been reported to determine if modern sighting locations correspond with historical hotspots. Interestingly, however, our hotspot analysis of historical DPUE shows that the majority of hotspots occurred 3–6 degrees south of the equator, while hotspots north of the equator are found between 0–2 degrees rather than clustering directly near the equator. As El Niño events intensify in the region (Brainard et al., 2018), and surface productivity may resultantly shift (Woodworth-Jefcoats et al., 2017), it is unclear whether future hotspots will shift away from the equator. Our analyses provide the baseline to answer that question for the future.
We considered whether hotspots varied intra-annually by considering DPUE data in 3-month intervals. Though whaling activity had some seasonality (Figure 2), general patterns of DPUE did not appear to vary much by quarter. However, hotspots varied over different time intervals (noting that hotspots were few in number and highly dispersed), suggesting that there is no single spatial feature facilitating whale congregation year-round. The literature is mixed about whether sperm whales aggregate around seamounts (Morato et al., 2008; Wong and Whitehead, 2014), but our data do not suggest persistent presence at any single geographic location. Whether recovering sperm whale populations follow a specific distribution based on oceanographic features [e.g., temperature (Virgili et al., 2019; Pirotta et al., 2020), current magnitude (Diogou et al., 2019a,b) and/or productivity (Jaquet, 1996)] will be a natural experiment as populations may recover concurrently in an era of global change. Historical oceanographic features may be amplified or diminished due to increasing global sea surface temperatures and a shift in the frequency and intensity of El Niño-Southern Oscillation events (Yang et al., 2018). At the same time, it is possible that whale distribution will be positively influenced by protected area policies and boundaries. With no-take protections in place throughout PIPA and the Howland/Baker units of the PRIMNM, there are potential opportunities for resurgence of other large pelagic populations, e.g., tuna (Hernández et al., 2019) and sharks (Knip et al., 2012). Though sperm whales predominantly consume cephalopods, sharks and fishes can comprise large parts of their diet (Kawakami, 1980), and thus the MPA may increase populations that serve as prey for sperm whales. In addition to potential increases in prey availability, large-scale MPAs in previously highly fished areas offer the potential for substantial reduction in ship traffic (McCauley et al., 2016; White et al., 2020), presumably with corresponding noise pollution. This reduced traffic and implied improved acoustic environment may be particularly attractive to marine mammals (Williams et al., 2015). In addition, no-take MPAs may cause fewer ship strikes or entanglements with fishing gear (Hooker and Gerber, 2004), though these benefits are more likely to be realized in near-shore or coastal MPAs, which have higher traffic (Jensen et al., 2003) and increased marine debris (Miyake et al., 2011; Amon et al., 2020). Kiribati has been an international leader in marine conservation with their visionary closure of PIPA (Rotjan et al., 2014), and the United States has greatly advanced marine conservation globally with the protection of the PRIMNM (Friedlander et al., 2016; Cantwell et al., 2018). Whether or not these MPAs host marine mammal populations in excess of what might be predicted based on oceanographic conditions remains an open and important question, to be assessed via future marine mammal surveys compared to geospatially accurate historical baselines.
Data Availability Statement
Publicly available datasets were analyzed in this study. This data can be found here: https://whalinghistory.org/. The subset of that data set supporting the conclusions of this article will be made available by the authors, without reservation.
Ethics Statement
Ethical review and approval was not required for the animal study because this study used existing datasets. No experimental interactions with animals occurred in this manuscript.
Author Contributions
RR, ST, ET, and RM conceived of the study. LH and BK conducted the geospatial analysis. BK, RR, and LH were primarily responsible for manuscript preparation. TS provided the historical records and TT provided historical and cultural context. JW provided oceanographic analysis and the recent whale sighting. All authors participated in editing and final preparation of the manuscript.
Funding
The authors thank the Prince Albert of Monaco Foundation II (grant awarded to RR) for support of this work.
Conflict of Interest
RR and TT are the Co-Chief scientists for PIPA.
The remaining authors declare that the research was conducted in the absence of any commercial or financial relationships that could be construed as a potential conflict of interest.
Acknowledgments
We are grateful to Dr. Suchi Gopal for advice on geospatial statistics and to members of the Rotjan Lab for helpful discussions about this work. We would also like to thank the Phoenix Islands Conservation Trust and the PIPA Implementation Office for their continued support of PIPA science. Co-authors are especially grateful to ST; her memory lives on in this (and other) work, and she is much-missed.
Footnotes
References
America G of the U.S. of, and Kiribati G of the R of (2014). A Cooperative Arrangement between the Government of the United States of America, through the Department of the Interior, United States Fish and Wildlife Service, and the National Oceanic and Atmospheric Administration and the Government of the Republic o. Washington D.C. USA. Available online at: https://www.doi.gov/sites/doi.gov/files/uploads/2014_doi_kirabati_agreement.pdf (accessed July 1, 2020).
Amon, D. J., Kennedy, B. R. C., Cantwell, K., Suhre, K., Glickson, D., Shank, T. M., et al. (2020). Deep-sea debris in the central and Western Pacific Ocean. Front. Mar. Sci. 7:369. doi: 10.3389/fmars.2020.00369
Asaad, I., Lundquist, C. J., Erdmann, M. V., and Costello, M. J. (2018). Delineating priority areas for marine biodiversity conservation in the Coral Triangle. Biol. Conserv. 222, 198–211. doi: 10.1016/j.biocon.2018.03.037
Bannister, J., and Mitchell, E. (1980). North Pacific sperm whale stock identity: distributional evidence from Maury and Townsend charts. Reports Int. Whal. Comm. Spec. Issue 2, 219–230.
Brainard, R. E., Oliver, T., McPhaden, M. J., Cohen, A., Venegas, R., Heenan, A., et al. (2018). Ecological impacts of the 2015/16 El Niño in the central equatorial Pacific. Bull. Am. Meteorol. Soc. 99, S21–S26.
Caldas de Castro, M., and Singer, B. H. (2006). Controlling the false discovery rate: a new application to account for multiple and dependent tests in local statistics of spatial association. Geogr. Anal. 38, 180–208. doi: 10.1111/j.0016-7363.2006.00682.x
Cantor, M., Eguiguren, A., Merlen, G., and Whitehead, H. (2017). Galápagos sperm whales (Physeter macrocephalus): waxing and waning over three decades. Can. J. Zool. 95, 645–652. doi: 10.1139/cjz-2016-0266
Cantwell, K., Elliott, K., and Kennedy, B. R. C. (2018). Deepwater exploration of the pacific remote islands marine national monument and Central Pacific Basin. Oceanography 31, 74–75.
Carroll, G., Hedley, S., Bannister, J., Ensor, P., and Harcourt, R. (2014). No evidence for recovery in the population of sperm whale bulls offWestern Australia, 30 years post-whaling. Endanger. Species Res. 24, 33–43. doi: 10.3354/esr00584
Chavez, F. P., and Barber, R. T. (1987). An estimate of new production in the equatorial Pacific. Deep Sea Res. Part A Oceanogr. Res. Pap. 34, 1229–1243. doi: 10.1016/0198-0149(87)90073-2
Cleasby, I. R., Owen, E., Wilson, L., Wakefield, E. D., O’Connell, P., and Bolton, M. (2020). Identifying important at-sea areas for seabirds using species distribution models and hotspot mapping. Biol. Conserv. 241, 1–12. doi: 10.1016/j.biocon.2019.108375
Diogou, N., Palacios, D. M., Nieukirk, S. L., Nystuen, J. A., Papathanassiou, E., Katsanevakis, S., et al. (2019a). Sperm whale (Physeter macrocephalus) acoustic ecology at Ocean Station PAPA in the Gulf of Alaska – Part 1: detectability and seasonality. Deep Res. Part I Oceanogr. Res. Pap. 150:103047. doi: 10.1016/j.dsr.2019.05.007
Diogou, N., Palacios, D. M., Nystuen, J. A., Papathanassiou, E., Katsanevakis, S., and Klinck, H. (2019b). Sperm whale (Physeter macrocephalus) acoustic ecology at Ocean Station PAPA in the Gulf of Alaska – Part 2: oceanographic drivers of interannual variability. Deep Res. Part I Oceanogr. Res. Pap. 150:103044. doi: 10.1016/j.dsr.2019.05.004
Friedlander, A. M., Wagner, D., Gaymer, C. F., Wilhelm, T. A., Lewis, N., Brooke, S., et al. (2016). Co-operation between large-scale MPAs: successful experiences from the Pacific Ocean. Aquat. Conserv. Mar. Freshw. Ecosyst. 26, 126–141. doi: 10.1002/aqc.2645
Gosho, M. E., Rice, D. W., and Breiwick, J. M. (1984). The sperm whale, Physeter macrocephalus. Mar. Fish. Rev. 46, 54–56.
Grech, A., and Marsh, H. (2008). Rapid assessment of risks to a mobile marine mammal in an ecosystem-scale marine protected area. Conserv. Biol. 22, 711–720. doi: 10.1111/j.1523-1739.2008.00923.x
Hanich, Q., Rotjan, R., Aqorau, T., Bailey, M., Campbell, B., Gray, N., et al. (2018). Unraveling the blue paradox: incomplete analysis yields incorrect conclusions about phoenix islands protected area closure. Proc. Natl. Acad. Sci. U.S.A. 115, E12122–E12123. doi: 10.1073/pnas.1815600115
Hazen, E. L., and Johnston, D. W. (2010). Meridional patterns in the deep scattering layers and top predator distribution in the central equatorial Pacific. Fish. Oceanogr. 19, 427–433. doi: 10.1111/j.1365-2419.2010.00561.x
Hernández, C. M., Witting, J., Willis, C., Thorrold, S. R., Llopiz, J. K., and Rotjan, R. D. (2019). Evidence and patterns of tuna spawning inside a large no-take Marine Protected Area. Sci. Rep. 9:10772. doi: 10.1038/s41598-019-47161-0
Hooker, S. K., Cañadas, A., Hyrenbach, K. D., Corrigan, C., Polovina, J. J., and Reeves, R. R. (2011). Making protected area networks effective for marine top predators. Endanger. Species Res. 13, 203–218. doi: 10.3354/esr00322
Hooker, S. K., and Gerber, L. R. (2004). Marine reserves as a tool for ecosystem-based management: the potential importance of Megafauna. Bioscience 54:27. doi: 10.1641/0006-3568(2004)054[0027:mraatf]2.0.co;2
Hoyt, E. (2012). Marine Protected Areas for Whales, Dolphins and Porpoises: A World Handbook for Cetacean Habitat Conservation and Planning. Boca Raton, FL: CRC Press.
IUCN (2020). Protected Planet: The World Database on Protected Areas (WDPA). Available online at: https://www.protectedplanet.net (accessed July 5, 2020).
Jaquet, N. (1996). Distribution and Spatial Organization of Groups of Sperm Whales in Relation to Biological and Environmental Factors in the South Pacific. Ph.D. thesis, Dalhousie University, Halifax.
Jaquet, N., Whitehead, H., and Lewis, M. (1996). Coherence between 19th century sperm whale distributions and satellite- derived pigments in the tropical pacific. Mar. Ecol. Prog. Ser. 145, 1–10. doi: 10.3354/meps145001
Jensen, A. S., Silber, G. K., and Calambokidis, J. (2003). Large Whale Ship Strike Database. US Department of Commerce, NOAA Technical Memorandum, NMFS-OPR. (Washington, DC: US Department of Commerce).
Kelly-Hope, L. A., Hemingway, J., and McKenzie, F. E. (2009). Environmental factors associated with the malaria vectors Anopheles gambiae and Anopheles funestus in Kenya. Malar. J. 8:268. doi: 10.1186/1475-2875-8-268
Kennedy, B. R. C., Cantwell, K., Malik, M., Kelley, C., Potter, J., Elliott, K., et al. (2019). The unknown and the unexplored: insights into the pacific deep-sea following NOAA CAPSTONE expeditions. Front. Mar. Sci. 6:480. doi: 10.3389/fmars.2019.00480
Knauss, J. A. (1997). The International Whaling Commission—its past and possible future. Ocean Dev. Int. Law 28, 79–87. doi: 10.1080/00908329709546096
Knip, D. M., Heupel, M. R., and Simpfendorfer, C. A. (2012). Evaluating marine protected areas for the conservation of tropical coastal sharks. Biol. Conserv. 148, 200–209. doi: 10.1016/j.biocon.2012.01.008
Lavery, T. J., Roudnew, B., Gill, P., Seymour, J., Seuront, L., Johnson, G., et al. (2010). Iron defecation by sperm whales stimulates carbon export in the Southern Ocean. Proc. R. Soc. B Biol. Sci. 277, 3527–3531. doi: 10.1098/rspb.2010.0863
Lyrholm, T., Leimar, O., Johanneson, B., and Gyllensten, U. (1999). Sex-biased dispersal in sperm whales: contrasting mitochondrial and nuclear genetic structure of global populations. Proc. R. Soc. B Biol. Sci. 266, 347–354. doi: 10.1098/rspb.1999.0644
Maury, M. F. (1852). Whale Chart of the World (the Wind and Current Charts), Series F. Washington, DC: United States Naval Observatory.
McCauley, D. J., Woods, P., Sullivan, B., Bergman, B., Jablonicky, C., Roan, A., et al. (2016). Ending hide and seek at sea. Science 351, 1148–1150. doi: 10.1126/science.aad5686
Merkens, K., Simonis, A., and Oleson, E. (2019). Geographic and temporal patterns in the acoustic detection of sperm whales Physeter macrocephalus in the central and western North Pacific Ocean. Endanger. Species Res. 39, 115–133. doi: 10.3354/esr00960
Miyake, H., Shibata, H., and Furushima, Y. (2011). Deep-sea litter study using deep-sea observation tools. Interdiscip. Stud. Environ. Chem. Environ. Model. Anal. Terrapub. 261–269.
Morato, T., Varkey, D. A., Damaso, C., Machete, M., Santos, M., Prieto, R., et al. (2008). Evidence of a seamount effect on aggregating visitors. Mar. Ecol. Prog. Ser. 357, 23–32. doi: 10.3354/meps07269
Morgan, L., Pike, E., and Moffitt, R. (2018). How much of the ocean is protected? Biodiversity 19, 148–151. doi: 10.1080/14888386.2018.1469432
Nicol, S., Bowie, A., Jarman, S., Lannuzel, D., Meiners, K. M., and van der Merwe, P. (2010). Southern Ocean iron fertilization by baleen whales and Antarctic krill. Fish Fish. 11, 203–209. doi: 10.1111/j.1467-2979.2010.00356.x
Ord, J. K., and Getis, A. (1995). Local spatial autocorrelation statistics: distributional issues and an application. Geogr. Anal. 27, 286–306. doi: 10.1111/j.1538-4632.1995.tb00912.x
Pennington, J. T., Mahoney, K. L., Kuwahara, V. S., Kolber, D. D., Calienes, R., and Chavez, F. P. (2006). Primary production in the eastern tropical Pacific: a review. Prog. Oceanogr. 69, 285–317. doi: 10.1016/j.pocean.2006.03.012
Pirotta, E., Brotons, J. M., Cerdà, M., Bakkers, S., and Rendell, L. E. (2020). Multi-scale analysis reveals changing distribution patterns and the influence of social structure on the habitat use of an endangered marine predator, the sperm whale Physeter macrocephalus in the Western Mediterranean Sea. Deep Res. Part I Oceanogr. Res. Pap. 155:103169. doi: 10.1016/j.dsr.2019.103169
Proclamation, A. (2009). Establishment of the Pacific Remote Islands Marine National Monument. (College Park, MD: National Archives and Records Administration), 22–33.
Rice, D. (1989). “Sperm whales (Physeter macrocephalus),” in Handbook of Marine Mammals, eds S. H. Rideway and R. Harrison (London: Academic Press), 177–233.
Roff, J. C. (2009). Conservation of marine biodiversity – how much is enough? Aquat. Conserv. Mar. Freshw. Ecosyst. 19, 249–251. doi: 10.1002/aqc.1036
Roman, J., Altman, I., Dunphy-Daly, M. M., Campbell, C., Jasny, M., and Read, A. J. (2013). The Marine Mammal Protection Act at 40: status, recovery, and future of U.S. marine mammals. Ann. N. Y. Acad. Sci. 1286, 29–49. doi: 10.1111/nyas.12040
Rotjan, R., Jamieson, R., Carr, B., Kaufman, L., Mangubhai, S., Obura, D., et al. (2014). Establishment, management, and maintenance of the phoenix islands protected area. Adv Mar Biol. 69, 289–324. doi: 10.1016/B978-0-12-800214-8.00008-6
Ryan, J. P., Polito, P. S., Strutton, P. G., and Chavez, F. P. (2002). Unusual large-scale phytoplankton blooms in the equatorial Pacific. Prog. Oceanogr. 55, 263–285. doi: 10.1016/s0079-6611(02)00137-4
Sala, E., and Giakoumi, S. (2018). No-take marine reserves are the most effective protected areas in the ocean. ICES J. Mar. Sci. 75, 1166–1168. doi: 10.1093/icesjms/fsx059
Smith, T. D., Lund, J. N., Josephson, E. A., and Reeves, R. R. (2009). Spatial dynamics of American offshore whaling in the 19th Century: Were sperm whales depleted. Paper Presented at the Symposium on Whaling and History III, Sandefjord, 85–91.
Smith, T. D., Reeves, R. R., Josephson, E. A., and Lund, J. N. (2012). Spatial and seasonal distribution of American whaling and whales in the age of sail. PLoS One 7:e34905. doi: 10.1371/journal.pone.0034905
Stramma, L., Johnson, G. C., Sprintall, J., and Mohrholz, V. (2008). Expanding oxygen-minimum zones in the tropical oceans. Science 320, 655–658. doi: 10.1126/science.1153847
Taylor, B. L., Martinez, M., Gerrodette, T., Barlow, J., and Hrovat, Y. N. (2007). Lessons from monitoring trends in abundance of marine mammals. Mar. Mammal Sci. 23, 157–175. doi: 10.1111/j.1748-7692.2006.00092.x
Townsend, C. H. (1935). The Distribution of Certain Whales as Shown by Logbook Records of American Whaleships. New York, NY: New York Zoological Society.
Virgili, A., Authier, M., Boisseau, O., Cañadas, A., Claridge, D., Cole, T., et al. (2019). Combining multiple visual surveys to model the habitat of deep-diving cetaceans at the basin scale: large-scale modelling of deep-diving cetacean habitats. Glob. Ecol. Biogeogr. 28, 300–314. doi: 10.1111/geb.12850
White, T. D., Ong, T., Ferretti, F., Block, B. A., McCauley, D. J., Micheli, F., et al. (2020). Tracking the response of industrial fishing fleets to large marine protected areas in the Pacific Ocean. Conserv. Biol. 34, 1571–1578. doi: 10.1111/cobi.13584
Whitehead, H. (2002). Estimates of the current global population size and historical trajectory for sperm whales. Mar. Ecol. Prog. Ser. 242, 295–304. doi: 10.3354/meps242295
Whitehead, H. (2003). Sperm Whales: Social Evolution in the Ocean. Chicago, IL: University of Chicago Press.
Whitehead, H. (2018). “Sperm whale: Physeter macrocephalus,” in Encyclopedia of Marine Mammals, eds B. Würsig, J. G. M. Thewissen, and K. M. Kovacs (London: Academic Press), 919–925.
Whitehead, H., Antunes, R., Gero, S., Wong, S. N. P., Engelhaupt, D., and Rendell, L. (2012). Multilevel societies of female sperm whales (Physeter macrocephalus) in the Atlantic and Pacific: Why are they so different? Int. J. Primatol. 33, 1142–1164. doi: 10.1007/s10764-012-9598-z
Whitehead, H., Christal, J., and Dufault, S. (1997). Past and distant whaling and the rapid decline of sperm whales off the Galapagos Islands. Conserv. Biol. 11, 1387–1396. doi: 10.1046/j.1523-1739.1997.96246.x
Whitehead, H., and Jaquet, N. (1996). “Are the charts of Maury and Townsend good indicators of sperm whale distribution and seasonality?,” in Forty-Sixth Report of the International Whaling Commission, Dublin.
Williams, R., Erbe, C., Ashe, E., and Clark, C. W. (2015). Quiet(er) marine protected areas. Mar. Pollut. Bull. 100, 154–161. doi: 10.1016/j.marpolbul.2015.09.012
Wong, S. N. P., and Whitehead, H. (2014). Seasonal occurrence of sperm whales (Physeter macrocephalus) around Kelvin Seamount in the Sargasso Sea in relation to oceanographic processes. Deep Res. Part I Oceanogr. Res. Pap. 91, 10–16. doi: 10.1016/j.dsr.2014.05.001
Woodworth-Jefcoats, P. A., Polovina, J. J., and Drazen, J. C. (2017). Climate change is projected to reduce carrying capacity and redistribute species richness in North Pacific pelagic marine ecosystems. Glob. Chang. Biol. 23, 1000–1008. doi: 10.1111/gcb.13471
Woolmer, G. (2013). Historical Distribution of Whales Shown by Logbook Records 1785-1913. OBIS-SEAMAP. Available online at: http://seamap.env.duke.edu/dataset/885 (accessed May 12, 2020).
Keywords: marine protected areas, Physeter macrocephalus, historical whaling data, Phoenix Islands Protected Area, Pacific Remote Islands Marine National Monument
Citation: Kennedy BRC, Hakam L, Witting J, Milani R, Taei S, Smith T, Taylor E, Teemari T and Rotjan RD (2021) Historical Trends of Sperm Whale (Physeter macrocephalus) Distribution in the Phoenix Archipelago. Front. Mar. Sci. 7:583326. doi: 10.3389/fmars.2020.583326
Received: 14 July 2020; Accepted: 09 December 2020;
Published: 12 January 2021.
Edited by:
Rob Harcourt, Macquarie University, AustraliaReviewed by:
Robert McCauley, Curtin University, AustraliaJo Day, Taronga Conservation Society Australia, Australia
Copyright © 2021 Kennedy, Hakam, Witting, Milani, Taei, Smith, Taylor, Teemari and Rotjan. This is an open-access article distributed under the terms of the Creative Commons Attribution License (CC BY). The use, distribution or reproduction in other forums is permitted, provided the original author(s) and the copyright owner(s) are credited and that the original publication in this journal is cited, in accordance with accepted academic practice. No use, distribution or reproduction is permitted which does not comply with these terms.
*Correspondence: Randi D. Rotjan, rrotjan@bu.edu
†Deceased