 Andrew N. Saulter
 Christopher Bunney
 Robert R. King
 Jennifer Waters
- Met Office, Exeter, United Kingdom
The benefits of applying data assimilation to a regional wave model for the northwest European continental shelf have been assessed. The assimilation method uses a 3D variational scheme commonly used in ocean model data assimilation, NEMOVAR, coupled to a regional configuration of WAVEWATCH III deployed on a Spherical Multiple-Cell grid with rotated pole. Significant wave height forecast skill was positively impacted over lead times of up to 12 h, in both offshore and coastal areas of the model. Assimilation experiments tested the impacts of applying both satellite altimeter and in situ platform observations of significant wave height as the state variable. Addition of in situ data introduced an improvement in model skill versus assimilating altimeter measurements only, but these improvements were relatively short-lived in lead time (on the order of a few hours). Extending observation coverage into the coastal zone introduced a benefit for only the first 1–2 h of forecast lead time at coastal sites. Although impacts on significant wave height forecasts were substantial at short lead times, the relatively short ‘system memory’ of the assimilation suggests that, in the case of the northwest European shelf region, the best application of wave data assimilation is in a rapidly cycling short range forecast system used to generate nowcasts, or for a reanalysis product.
Introduction
For the Numerical Weather Prediction and Ocean Modeling communities, assimilation of observations, used to derive the most accurate possible initial conditions for the model forward run, is an essential component in both forecast and re-analysis systems (Bannister, 2017; Kwon et al., 2018; Moore et al., 2019). In operational wave modeling and forecasting, however, assimilation is less common. For example, a review of models contributing to an international wave forecast verification exchange, run on behalf of the World Meteorological Organization (WMO) by the European Centre for Medium-range Weather Forecasts (ECMWF) Lead Centre for Wave Forecast Verification (LC-WFV1; Bidlot, 2016) finds that only 4 of the 14 systems regularly contributing data are run with data assimilation (J. Bidlot, ECMWF, pers. comm.). This variation in usage of assimilation reflects both the relative importance of boundary versus initial conditions in wave models, for which effects of uncertainty in wind forcing strongly affect accuracy of wave development (Cavaleri and Bertotti, 2006; Janssen, 2008; Cavaleri et al., 2018), and the comparative scarcity of observations available to existing assimilation schemes. In some cases, observations may be too spread out either in space or time, relative to local correlation lengthscales, to achieve an initial wave condition where all grid points in the model have been significantly influenced by the observations.
Advances in the quality and availability of satellite observations from polar orbiting platforms (conventional and synthetic aperture radar altimeters; Ardhuin et al., 2019) and the quantity of information that can be provided in the open ocean has led to operational wave assimilation being mainly associated with global applications (e.g., systems run at ECMWF, Meteo France, Deutsche Wetterdienst and Japan Meteorlogical Agency). In a global model the potential for ‘system memory’ of corrections, made in either the storms that generate swells crossing global ocean basins or the swell data themselves (Breivik et al., 1998; Aouf et al., 2006), to persist in regions where forcing and wave conditions become more disconnected (e.g., in the tropics) is reasonably high. Assimilation of wave data in the setting of regional seas may be more challenging for several reasons. First, localized wind-sea development and dissipation is likely to be less long-lived in seas where fetches are short, when compared to the open ocean. Second, the relative footprint and recurrence frequency of satellite overpasses may lead to a less regular and impactful observation of wave conditions within the model domain than occurs for open ocean applications. Finally, for coastal seas, effects of the land-sea interface and strong gradients in the wave field introduced by shallow water processes can restrict both the coverage of observations that can be used in an assimilation scheme (e.g., Cavaleri et al., 2019) and the lengthscales over which observational information can be applied to correct the model.
Despite these difficulties, it is important to regularly re-assess the benefits that data assimilation can bring to regional wave modeling, as availability of wave observations and the state of the art in models and assimilation methods change. This study represents one such assessment, set in the context of the regional seas of the northwest European continental shelf (NWS, Figure 1). This domain covers the continental shelf seas of the North Sea, English Channel and Irish Sea, and is bounded by deep open waters of the North Atlantic (to the north and west) and the Skagerrak shelf sea region in the eastern part of the North Sea. Overall, the region presents modeling challenges across multiple scales, since it comprises areas of very deep (Atlantic) and very shallow water (southern North Sea); long and constrained fetches; and includes locations subject to high tidal ranges (Bristol Channel) and strongly structured current regimes (e.g., to the west of the continental shelf break and in the English Channel). Figure 1, which shows a domain wide snapshot of significant wave height (SWH) from the high-resolution model assessed in this study, illustrates a number of these effects. For example, the SWH field is structured west of the continental shelf break, due to the effect of current fields on the waves (e.g., Ardhuin et al., 2017); SWH is dissipated in the southern North Sea; and significant sheltering occurs downstream of islands and coastal headlands within the model domain.
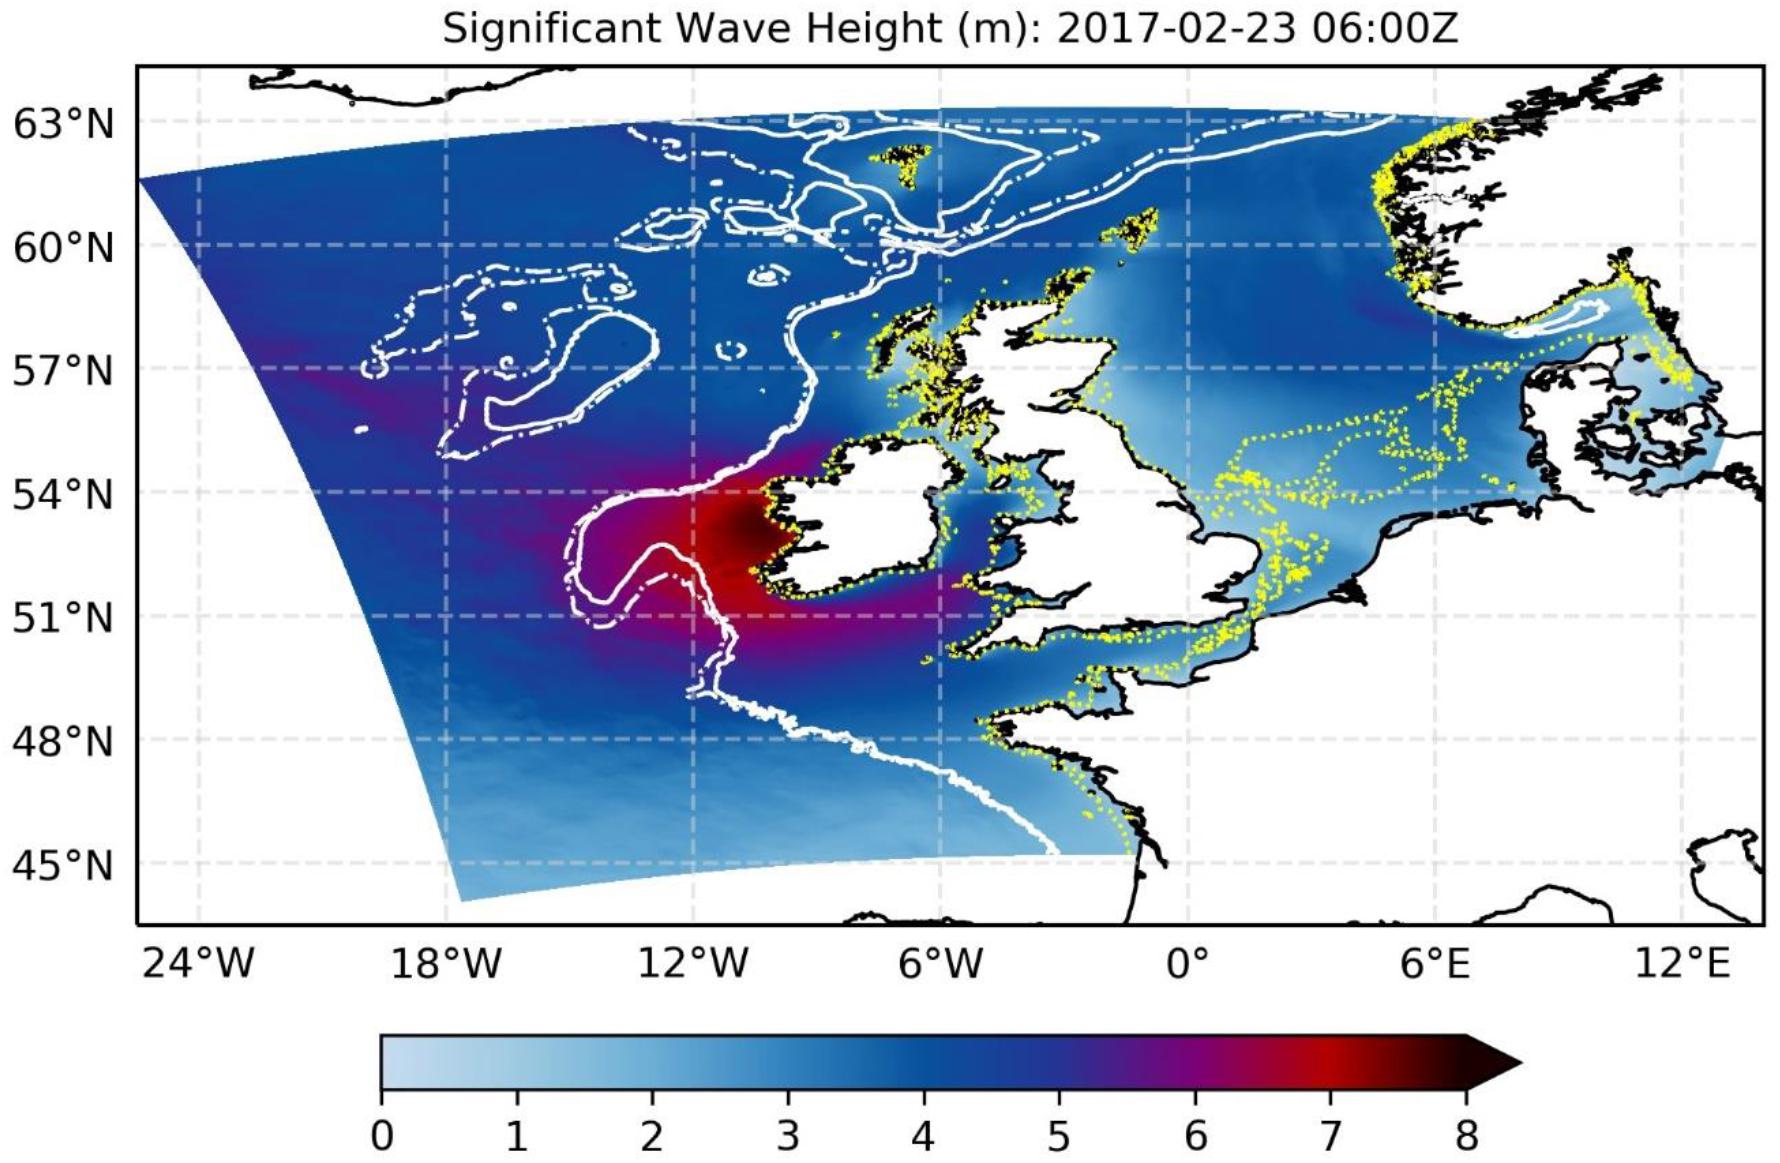
Figure 1. Example significant wave height field (in meters) from the AMM15S (3–1.5 km grid scale) wave model (control run without assimilation). The contours on the chart denote 1,000 m (dash-dot white) and 500 m (solid white) isobaths demarking the shelf break and activation of shallow water effects for the lowest wave frequencies, whilst the 40 m contour (dotted yellow) marks the extent of the region in which gird cells are refined to the 1.5 km scale.
The state of the art in operational systems is represented by the various components used in the assimilating wave model. Here the focus is on the third-generation community wave model WAVEWATCH III®, which was been configured for these experiments using a Spherical Multiple Cell grid (SMC grid; Li, 2011, 2012) to enable refinement of coastal cells; the NEMOVAR assimilation scheme used in operational ocean forecasting by numerous European operational centers; and the latest generation of satellite altimetry missions including JASON-3 and Sentinel-3. The majority of large area operational wave models including an assimilation component are based around the WAM model and assimilate based on an Optimal Interpolation (OI) scheme (e.g., Aouf and Lefèvre, 2015; European Centre for Medium-range Weather Forecasts [ECMWF], 2020). OI is also used for assimilation the JMA wave model (Kohno et al., 2011). Work with other assimilation techniques, including Ensemble Kalman Filter (EnKF; Siddons et al., 2009; Almeida et al., 2016; Fujiwara et al., 2019), Ensemble OI and 3DVAR (Siddons et al., 2009) and 4DVAR (Orzech et al., 2013; Song and Mayerle, 2017) have mostly been linked to the Simulating WAves Nearshore model (SWAN; Booij et al., 1999). Although WAVEWATCH III® has been run with data assimilation in research studies (e.g., Li and Zhang, 2020, using an OI scheme) the application in this study builds on the relatively recent addition of a spectral update module in the model’s public release, which enables community development of an assimilation capability for the model.
NEMOVAR is an incremental first guess at appropriate time three-dimensional variational (3DVAR-FGAT) scheme co-developed by ECMWF (Mogensen et al., 2009, 2012), Met Office (Waters et al., 2015), Centre Européen de Recherche et de Formation Avancée en Calcul Scientifique (CERFACS) and Inria. Primarily its operational use has been for data assimilation in ocean models. Therefore, successfully demonstrating the use of NEMOVAR for wave assimilation would not only further evidence 3DVAR as a valid alternative method to the more well documented OI and EnKF methods, but would also enable a unified approach to assimilation to be adopted in operational coupled wave-ocean models using a single code base.
In addition to assessing the forecast benefits of assimilating satellite altimeter observations, the study also seeks to evaluate the potential advantage of including in situ observations in the process. The hypothesis is that for the NWS region in situ observations may be particularly influential, since coverage of regions such as the North Sea is substantial (if not complete) and these data provide a consistent source of observations to complement satellite altimetry’s wider areal coverage.
The remainder of this paper is set out as follows: Section “Model, Observations and Assimilation Scheme” documents the modeling, assimilation, observations and processing schemes used in the assimilating model; Section “Assessments” describes the experiments run and verification methodology; results are presented in Section “Results” and discussed further in Section “Discussion”; a summary and conclusions are given in Section “Conclusion.”
Model, Observations and Assimilation Scheme
Wave Model and Boundary Conditions
The modeling set-up focuses on a regional configuration of the wave model WAVEWATCH III® at version 6.07 (Wavewatch III® Development Group, 2019), which was run forced by winds from a global configuration of the Unified Model (UM; Brown et al., 2012) and a regional configuration of NEMO (Nucleus for European Modeling of the Ocean; Madec, 2008). The NWS regional wave configuration (termed AMM15S) has been designed to provide skillful predictions of wave conditions for both inshore waters, designated in the United Kingdom as within a 12 mile limit of the coastline, and open waters further offshore. The model uses a SMC grid based on a rotated north pole at 177.50°E, 37.50°N, in order to achieve an evenly spaced mesh around United Kingdom. Two levels of grid cell refinement are applied, at approximately 3 and 1.5 km, using refinement criteria based on both proximity to the coast and water depth. 1.5 km cells are used for all locations where averaged depths are less than 40 m (Figure 1). The grid covers a region from approximately 45°N, 20°W to 63°N, 12°E and uses bathymetry and coastal masking derived from a 1.5 km NEMO configuration (Graham et al., 2018) and based on European Marine Observation and Data net2) Phase I data corrected to mean sea level.
In common with the most recent wave configurations developed at the Met Office, wave source terms are based on the ST4 package following Ardhuin et al. (2010), whilst non-linear terms use the Discrete Interaction Approximation (DIA) package following Hasselmann et al. (1985). Trials with this configuration led to setting the ST4 BETAMAX parameter to 1.36 in order to optimize results when forced by Met Office wind data. Shallow water physics are applied, parameterizing bottom friction using a JONSWAP formulation (Hasselmann et al., 1973), with gamma set to 0.038; and depth induced wave breaking based on the Battjes and Janssen (1978) scheme, with a coefficient set to 0.2 in order to mitigate a previously observed limiting of significant wave heights during high energy storms. The propagation scheme associated with the SMC wave model grid is based on a 2nd order upstream non-oscillatory scheme (Li, 2008) with Garden Sprinkler Effect (GSE) alleviation based on a hybrid swell age diffusion and averaging scheme (Wavewatch III® Development Group, 2019). Further details of the model are given in Saulter et al. (2017).
Lateral boundary conditions are provided by (one-way) nesting the regional wave model configuration to a global model (Saulter et al., 2016) resolved at approximately 25 km along the regional model’s western boundaries. In this study, forcing at the atmospheric (sea-surface) boundary used 10 m wind data from the Met Office global configuration of the UM run for Operational Suite 383. This model provided wind fields with a temporal resolution of 1 h and a horizontal spatial resolution over the NWS domain of approximately 17 km. At the ocean surface boundary, hourly surface current data were retrieved from the 1.5 km resolution NWS regional configuration of the NEMO ocean model (AMM15; Graham et al., 2018) run operationally at the Met Office to provide physical ocean forecasts for the Copernicus Marine Environment Monitoring Service (CMEMS4). For the regional ocean, lateral boundary conditions are taken from a NEMO global Forecast Ocean Assimilation Model (FOAM; O’Dea et al., 2012), with tidal forcing on the open boundary generated via a Flather radiation boundary condition (Flather, 1976). Ocean surface forcing (heat, moisture, wind speed, and surface pressure data) came from the same global atmospheric model used to force the waves. Both wind and surface currents are interpolated to the 3 km cell scale for compatibility with the base resolution SMC grid cells. In this form, the overall system mirrors the operational wave model used, since November 2018, to deliver NWS wave forecast products to CMEMS; except for using forcing from the Met Office global atmosphere model rather than ECMWF’s Integrated Forecasting System.
Assimilation Method
For the wave data assimilation, the NEMOVAR 3DVAR-FGAT scheme is used to assimilate measurements of significant wave height as a scalar variable representing ocean surface wave energy. NEMOVAR generates model increments for this state variable based on minimizing the 3DVAR cost function. The NEMOVAR set-up for the regional wave model has been established based on a number of configuration experiments and comprises the following elements, which have been adapted from the approach used for NEMOVAR in the Met Office Forecasting Ocean Assimilation Model (FOAM; Waters et al., 2015) to emphasize the high degree of spatial variability in wave fields over the NWS domain:
(1) Background error correlations are modeled using a diffusion equation. Successive applications of the diffusion operator are used to simulate the matrix multiplication of a Gaussian correlation matrix (Mirouze and Weaver, 2010). This is applied using lengthscales derived from a fit to covariances established using the Canadian Quick Covariance method (Polavarapu et al., 2005) based on a 1-h lag between SWH fields. Generic homogeneity and isotropic assumptions, i.e., that the lengthscales are universal in direction for a given location and will be similar across the domain, are not physically realistic (Greenslade and Young, 2004) and are particularly unlikely to hold within a regional sea, due to variations in fetch and gradients in bathymetry. In this case a domain variant isotropic lengthscale scheme is applied instead, using correlation lengthscales that vary within the domain from approximately 60 km in coastal regions and the eastern English Channel and Irish Sea, to 150–200 km in the North Sea and western part of the northwest European continental shelf, and to 250–300 km in deeper waters of the North Atlantic (Figure 2). This contrasts with the two lengthscale approach (1 constant, 1 spatially variable) used for FOAM and emphasizes the role played by the spatial variability component in the wave model scheme (Mirouze et al., 2016).
(2) Background and observation errors can be quantified based on estimates made in triple collocation studies (Janssen et al., 2007). Palmer and Saulter (2013) found consistent error standard deviations of 8, 12, and 15% of climatological background significant wave height, respectively, for satellite altimeter, in situ data and model in the vicinity of the northwest European shelf. The assimilation set-up applies these error factors as scaling to the background wave field from cycle to cycle, such that the error standard deviation for model and observations varies in magnitude with each analysis cycle whilst the linear relationship between these values remains constant. To simplify observations processing a standard error factor of 10% was used for both in situ and altimeter data in these experiments, with background errors based on the 15% factor. This differs from the approach used for FOAM which uses absolute error values, but better represents an increase in errors generally found in association with more energetic wave conditions.
(3) A 6-hourly analysis cycle is chosen, and increments generated by NEMOVAR are applied to the wave model via direct initialization; i.e., the full increment is applied to initialize wave conditions at the start of the subsequent forecast cycle. This again contrasts with the approach in FOAM, where 3D adjustments to the model are introduced incrementally over the assimilation window (Incremental Analysis Update, Bloom et al., 1996). However, given the high propagation speeds for both the most energetic frequencies of the wave field and the synoptic scale atmosphere systems that primarily influence the wave conditions relative to the size of the model domain, a high update frequency and direct initialization was anticipated to be suitable for this initial implementation. The approach also enables a simple practical fit of the assimilation scheme to the standard method of initializing WAVEWATCH III® from a restart file, along with a separation of model and assimilation tasks in the modeling cycle’s workflow.
(4) Due to the nature of the available observations only a single state variable, SWH, is incremented by NEMOVAR. For the SWH increments to be used by the wave model, they must then be applied over the two-dimensional (frequency-direction) spectral energy density grid used to describe wave field statistics at each spatial grid cell in the model. Prior to the spectral update, the significant wave height increments are quality controlled in order to ensure consistency in the resulting wave field, e.g., by checking that the increments will not result in zero or negative wave energy. In addition to the model’s parameterizations, sources of error in the wave spectrum will include varying contributions from wind and current forcing fields and the water depth. However, the principle source of uncertainty is the forcing wind and associated wind-sea growth. One option for distributing the significant wave height correction is across the spectral domain is to use a simple rescaling of the wave energy in each bin. This adjusts energy and conserves the spectral bin in which peak energy frequency resides, but does not explicitly recognize wind sea or conserve overall wave steepness. More sophisticated methods, such as Lionello et al. (1992) and Kohno et al. (2011) adjust both energy and peak frequency in line with predicted wave growth relationships and apply the corrections to a targeted subset of spectral bins dependent on the dominance or otherwise of wind-sea. In these experiments a flavor of the Lionello et al. (1992) method for targeted wind-sea and swell component correction has been adopted. Prior to correction, wave spectra are tested for wind-sea or swell dominance by calculating the relative contribution to wave energy by spectral bins for which the speed of wave propagation is less than that of the (direction relative) wind speed. For spectra where the wind-sea contribution to overall energy is 70% or greater only the wind-sea energy bins are adjusted. The wind-sea adjustment includes the use of Toba (1972)’s relationship to calculate a balance between significant wave height and peak period for growing wind-seas. For example, where wind-sea energy increases so will peak period, which leads to a redistribution of energy across the wind-sea part of the spectrum’s frequency domain. For cases where the wind-sea is not dominant, the correction of energy is evenly distributed throughout the wave spectrum and without any redistribution in frequency space. Associated with the change in wind-sea energy, Lionello et al. (1992) balance the forcing wind-speeds based on a predetermined wind speed-wave growth relationship. In the case here, where there is no direct coupling between the wave model and atmosphere model, any change in wind speed at initialization of the wave model is almost immediately overwritten by the development of the atmosphere model winds. The result is that some inconsistency will be introduced, either in the first step between initialized and free-running wind fields when the wind balance is applied, or between the initialized wave and wind fields when the balance is not applied. For these experiments the simpler option of neglecting the wind balancing was taken.
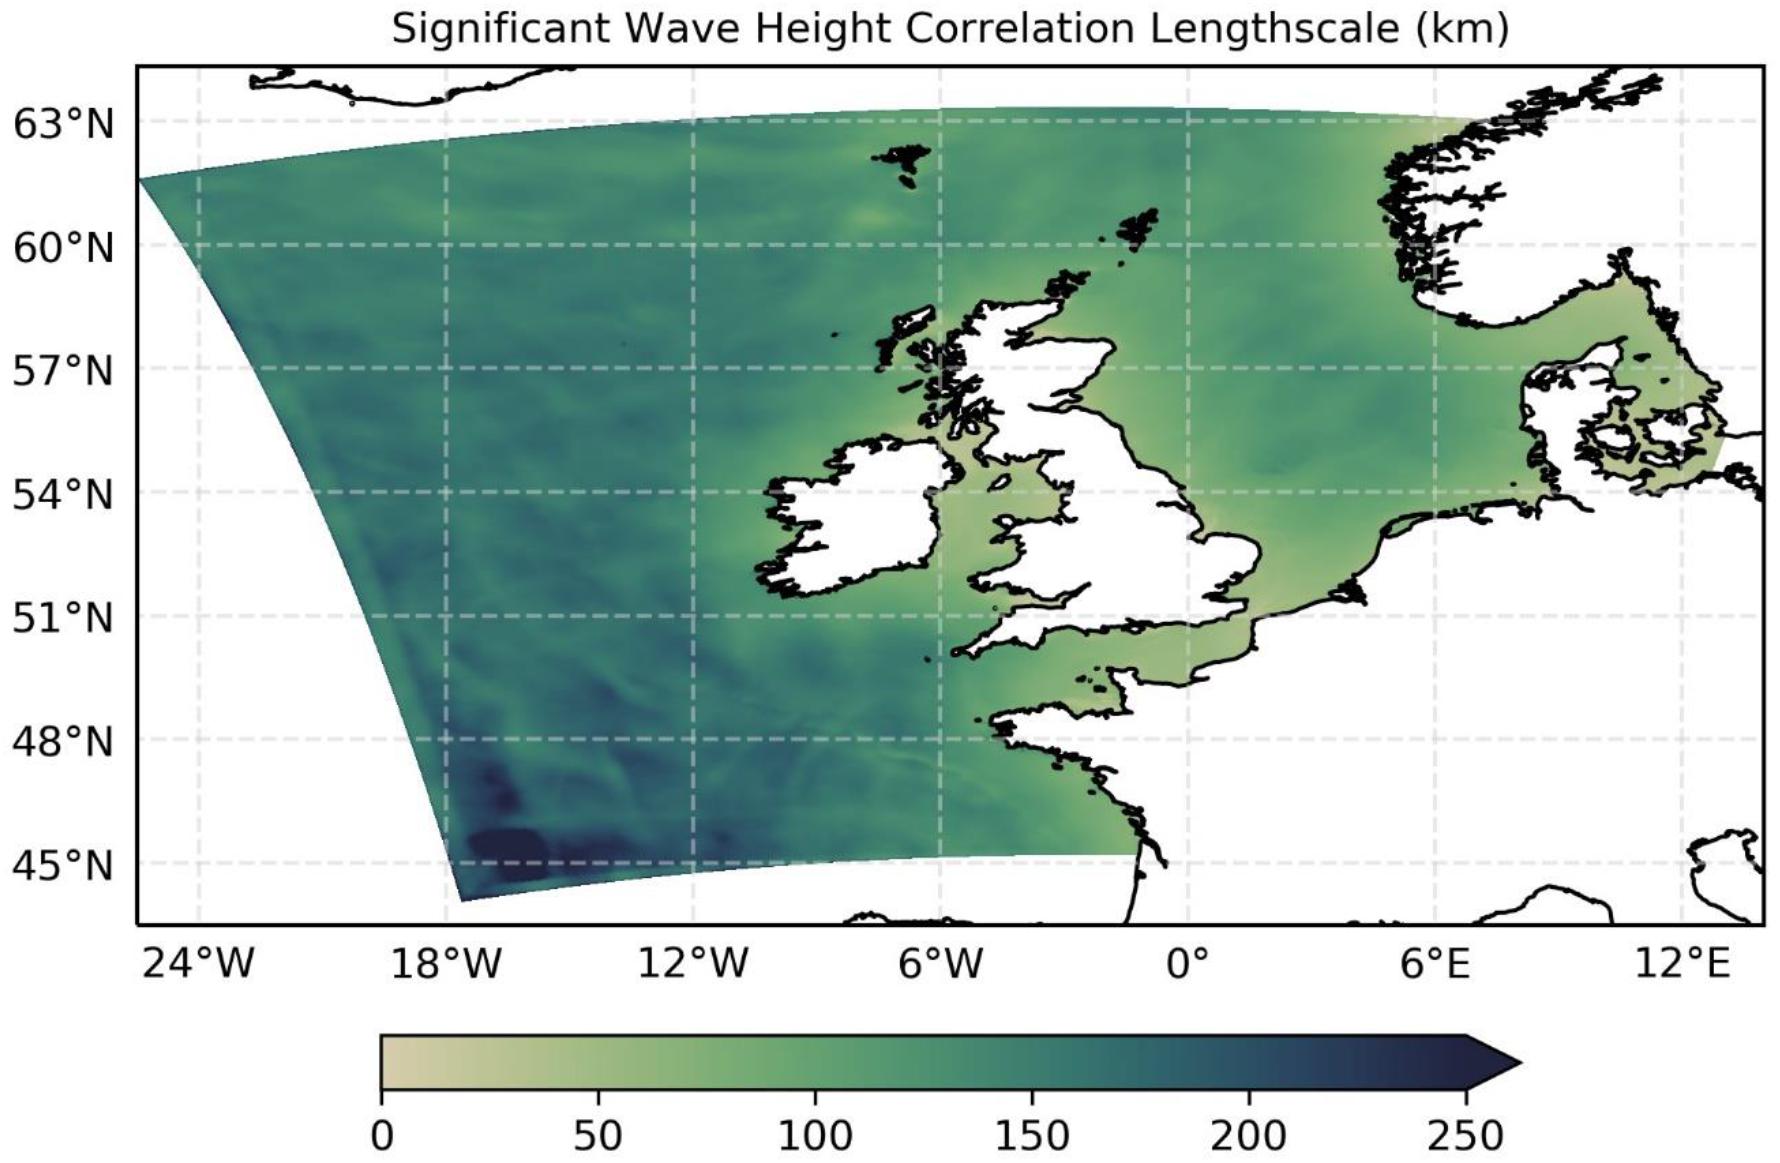
Figure 2. Domain variation of correlation lengthscales used for significant wave height assimilation.
In its native form, the SMC grid model is both unstructured (i.e., uses a one-dimensional cell array in which adjacent cells are freely distributed) and, for this configuration, specified relative to a rotated pole. However, a virtue of the grid is that it can be very efficiently mapped from its native form to a regular grid, due to being based on regular latitude-longitude cell types. At the same time, NEMOVAR is readily configured to be run using a regular grid within a rotated pole reference frame. As a result, the model was interfaced with the assimilation scheme in a comparatively straightforward manner, by first converting model outputs of SWH to a regular latitude-longitude form keeping the rotated pole, running the NEMOVAR step, and then mapping back to the SMC grid cell array for the spectral update step. For the NEMOVAR step, model background fields, covariance lengthscale arrays and the resulting increment fields were re-gridded into the rotated pole regular latitude-longitude form at the SMC grid’s highest cell resolution (approximately 1.5 km). In terms of computing time, component task costs were distributed almost equally between the (6-h) forward wave model run, generation of innovations, the NEMOVAR step and subsequent update of the wave initial conditions. However, it should be noted that little specific work was undertaken to optimize the computational efficiency of the set-up in these experiments; for example a set number of 30 iterations was used to reach convergence of the cost function in NEMOVAR, whilst the existing code for updating the wave initial conditions presently runs on a single processor.
Observations
In situ Data
In situ data are based on collections in the Met Office meteorological observations database. Significant wave height, period and (where available) direction data are sourced from three key collections. The majority of open waters data are sourced from datasets transmitted over Global Telecommunications System (GTS). These comprise measurements from a variety of wave buoys, and fixed platforms that use downward facing laser altimeters or radar. Coastal wave data are sourced from two coastal observatory programs running networks of spectral wave buoys around the United Kingdom; the Channel Coast Observatory5 and Wavenet6. A number of the Channel Coast Observatory buoys are sited particularly close to the coastline, in water depths of 10 m relative to Admiralty Chart Datum (datum at Lowest Astronomical Tide). An overview of the geographic distribution of in situ data is given in Figure 3.
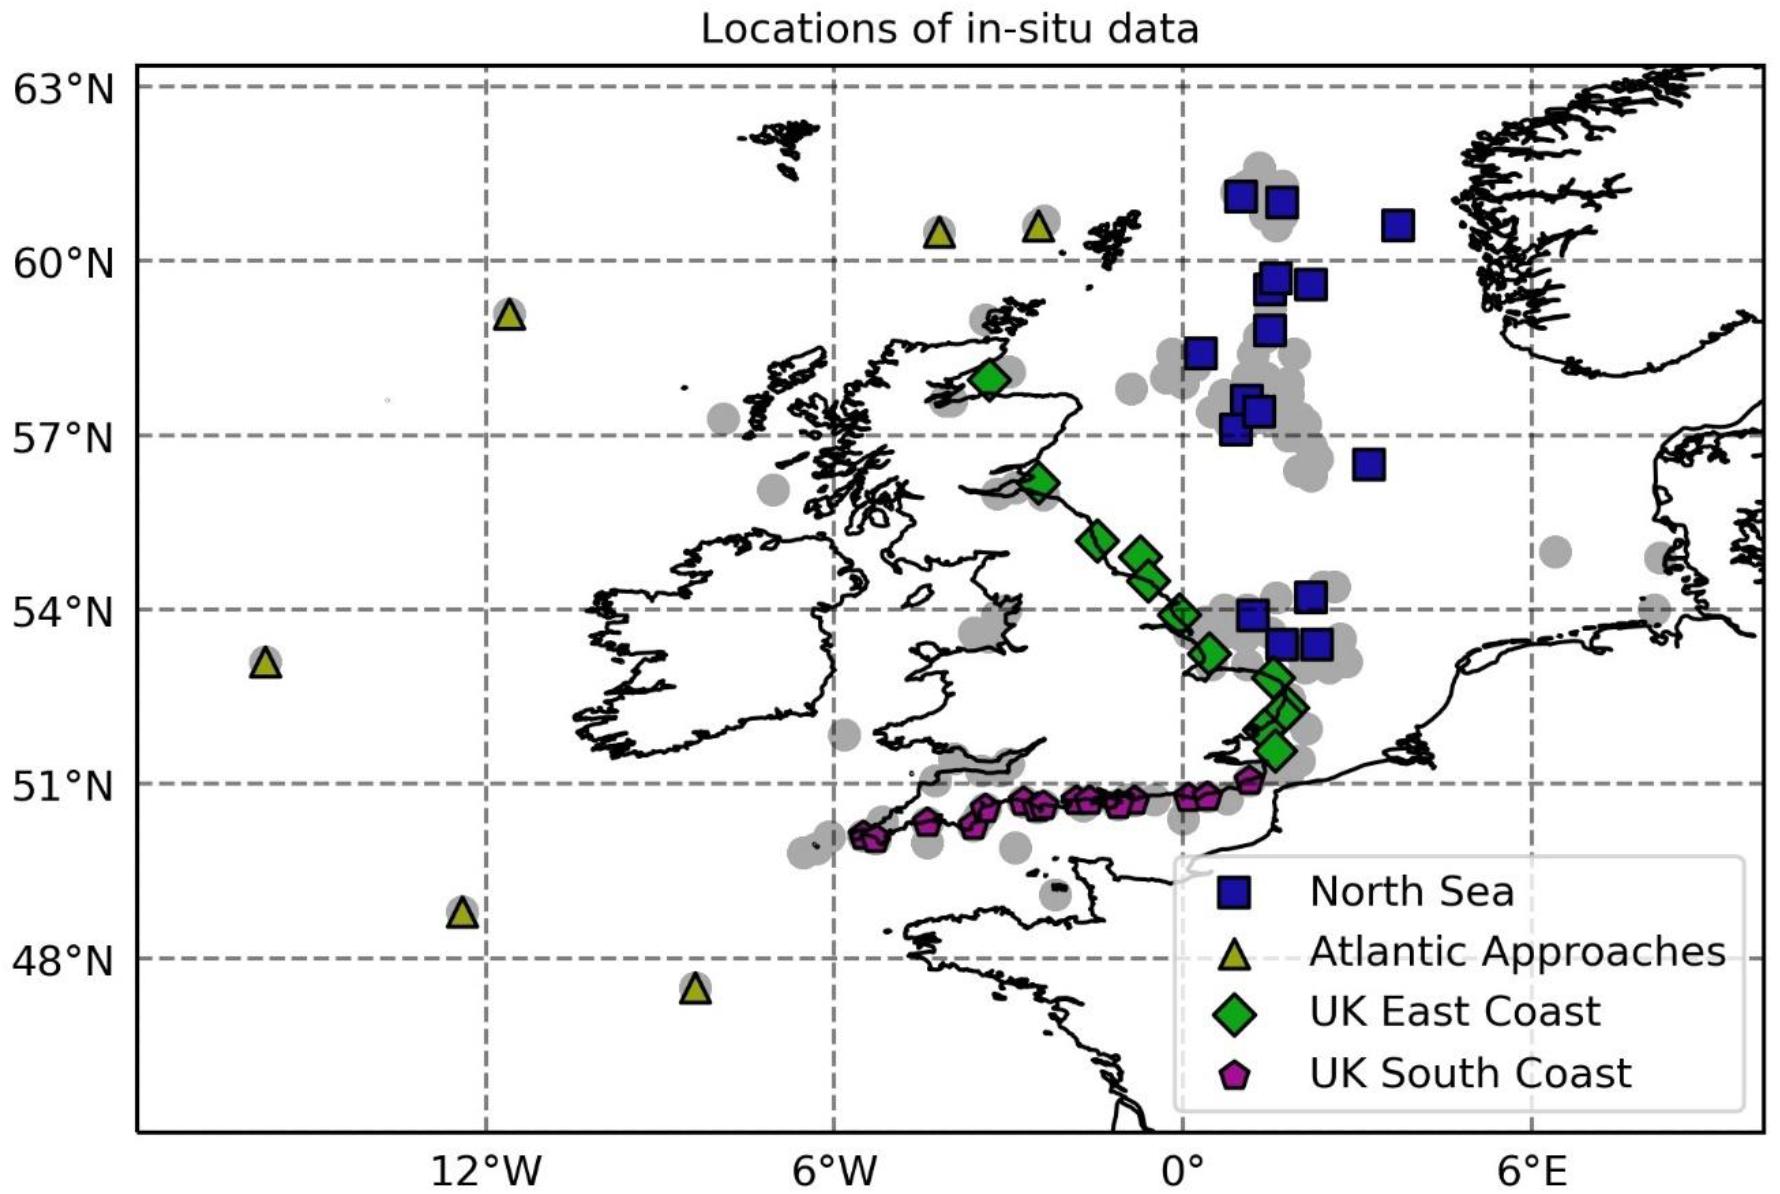
Figure 3. Locations of in situ observations incorporated into the assimilation scheme (gray circles) and used in verification (colored symbols).
Satellite Altimeter Data
Satellite altimeter observations of significant wave height were sourced from the Centre ERS d’Archivage et de Traitement (CERSAT) merged altimeter dataset (Queffeulou, 2013) and CMEMS7. The former data collection includes, for the period assessed, data from Jason-2, Cryosat and SARAL-Altika missions. CMEMS provided data from newer missions, namely Sentinel-3A and Jason-3. Of particular interest are altimetry data from the Sentinel-3 mission8. One expectation is that these new observations enable significant wave heights to be retrieved from closer to the coastal zone than is traditionally accepted for altimeter data (Cavaleri et al., 2019), enabling an improved coverage for coastal assimilation.
Application in Assimilation Scheme
In order to ensure a similar representation scaling in the different observation types (e.g., Janssen et al., 2007) altimeter data were super-observed to an approximately 20 km lengthscale as part of the assimilation pre-processing. This is equivalent to three 1 Hz soundings and is anticipated to be broadly representative of a 20–30 min sample of waves measured by an in situ instrument. Innovations (observation minus background values) provided to NEMOVAR were derived using a nearest-neighbor approach as the observation operator. For collocation, the wave model background field was defined every half hour and at a horizontal resolution of 1.5 km. At these resolutions it is expected that the model and observations are sufficiently collocated to enable a direct match. The match-up method is also consistent with the triple-collocation method used by Palmer and Saulter (2013) to determine observation and model error standard deviations.
Quality control rejected observations with very low significant wave height (order of centimeters) or low altimetry signal to noise (measured by root mean square of high frequency ku-band wave heights). The match-up process also included site blacklisting for in situ observations and, for altimeter data, applying a coastal mask to the background field at match-up time in order to remove any observations within a given distance of the coastline.
In addition to blacklisting bad observations, in situ observation processing included the option of a ‘greylisting’ procedure, which was used to vary the amount of data applied to the assimilation. Greylisted observations were accepted by the assimilation system, but only after sub-sampling using a random draw of observations from the in situ dataset. The intention of adopting this sub-sampling approach was to increase the levels of independence between data used in the assimilation and in subsequent verification of the model. In these experiments a simple sub-sampling scheme was employed where data were randomly drawn from the full (offshore or coastal) collection of available in situ observations available from each 6-h matchup dataset. Results of preliminary greylisting experiments indicated that using 50% of in situ observations enabled a reduction in assimilated observations without significantly affecting the assimilation’s impact on model skill.
Assessments
Forecast impact experiments using the high-resolution regional wave model were conducted for a 2-month run period covering February–March 2017. The model run cycles comprised four 6-h assimilating update cycles per day, with the 00Z cycle on each day triggering a 24-h forecast run. For each experiment a different observational set-up was used, as described in Table 1. The variation in data assimilated for each experiment, measured in terms of unique locations used in generating the innovations, is shown in Figure 4. Samples of data from altimeter, offshore in situ platforms and coastal platforms are similar overall. However, variability in sampling between individual update cycles, introduced by the number of altimeter passes within a given update cycle window, is of the same order as the sample size. This is due to the relatively infrequent repeat cycle for the altimeter instruments (e.g., 10 days for Jason-3, 27 days for Sentinel-3A, 35 days for SARAL-Altika) and limited size of the regional model domain.
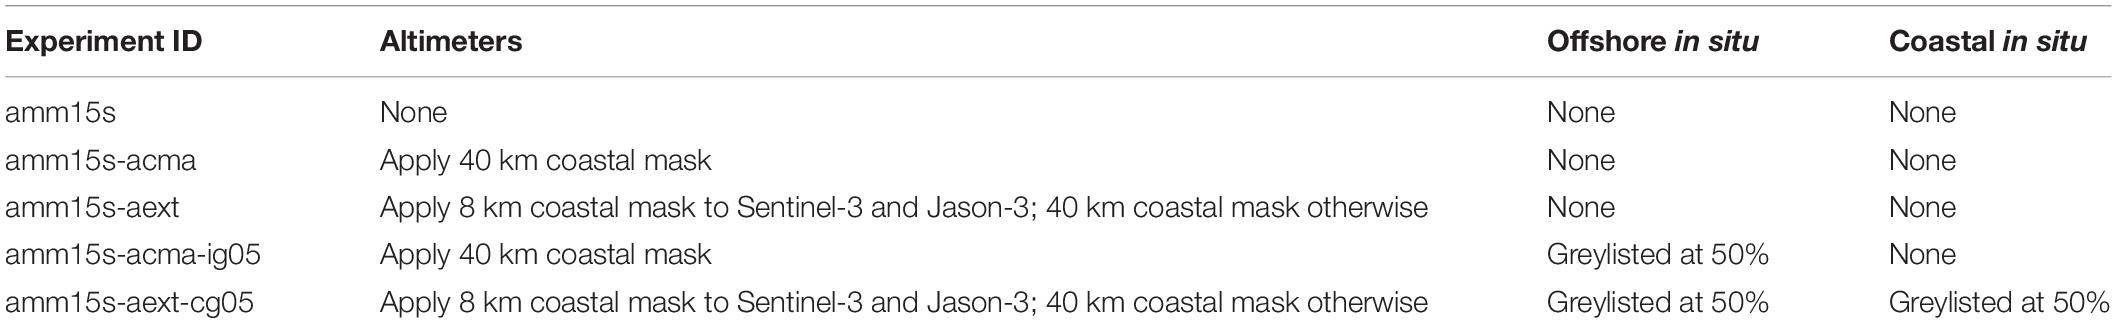
Table 1. Experiment identifiers and use of observations.
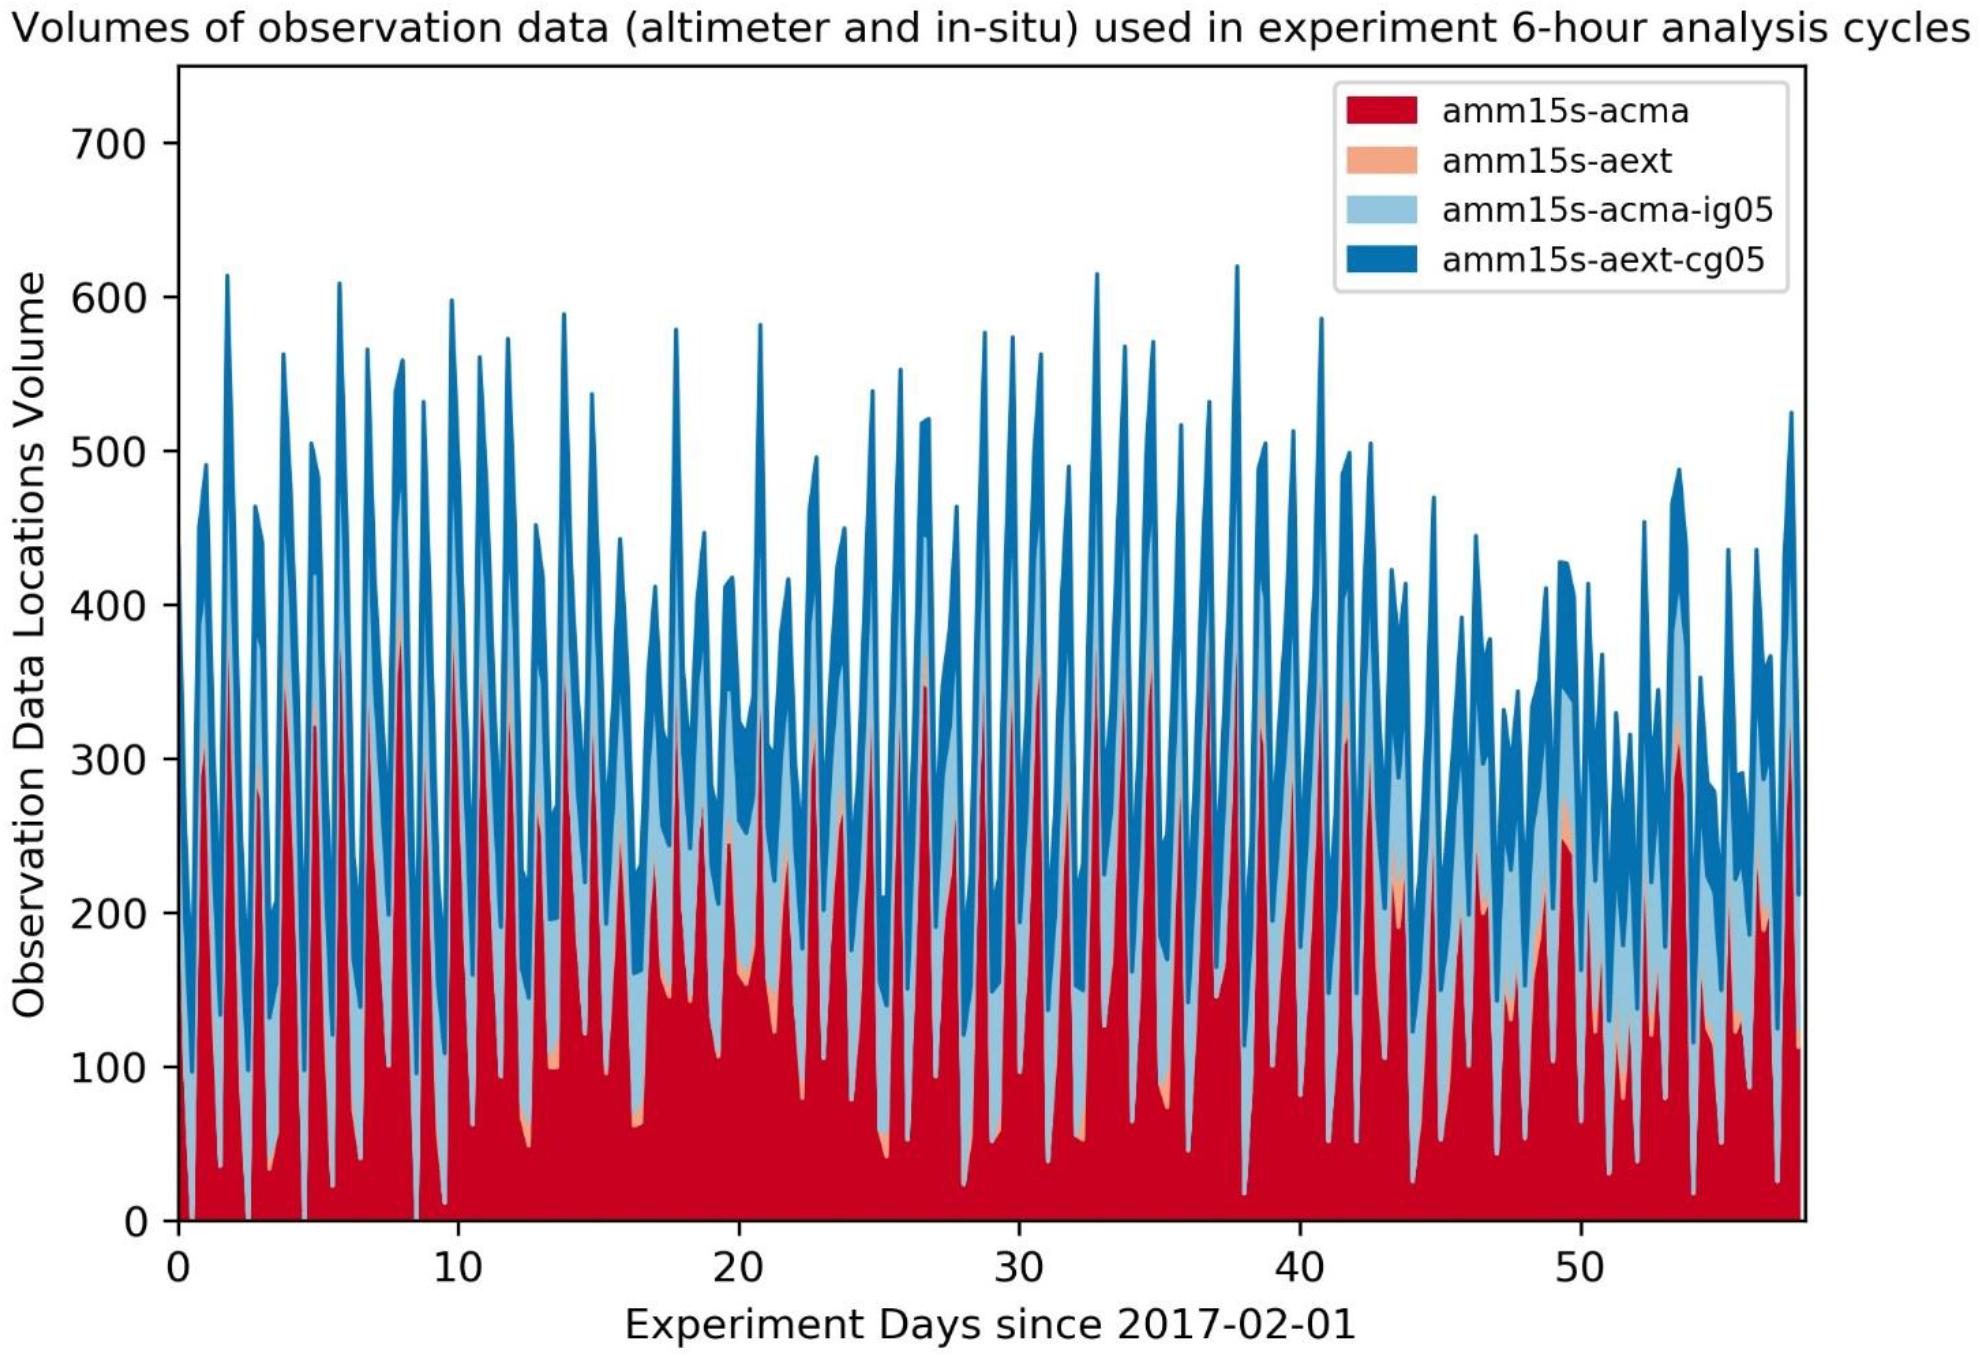
Figure 4. Total number of unique geographic data locations used for significant wave height (SWH) innovations: experiment amm15s-acma (offshore altimeter only, red); amm15s-aext (coastal extension to altimeter, pink); amm15s-acma-ig05 (offshore altimeter plus offshore in situ, light blue); amm15s-aext-cg05 (coastal extension for altimeter and in situ; blue).
Assimilation impact is assessed by measuring the change in predictive skill between forecast runs from the assimilating model experiments versus a free-running (non-assimilating) control. The control run is constrained, as per the present Met Office operational models, purely due to the quality of analyzed wind fields generated in the Met Office atmospheric Numerical Weather Prediction (NWP) analysis cycles. The observed truth dataset used to verify the data comprised a subset of in situ observations representing different regions of the domain; not only geographically, but also in terms of physical processes contributing to wave field development and density of in situ observations (Figure 3):
(1) Offshore Atlantic Approaches; open waters with long fetch (from west) and low density of in situ observations.
(2) Offshore North Sea; open waters fetch limited region with high density of in situ observations.
(3) United Kingdom East Coast; coastal, shallow water fetch limited region with high density of observations further offshore.
(4) United Kingdom South Coast; coastal, shallow water fetch limited region with low density of observations further offshore.
For the Atlantic Approaches, United Kingdom East and South Coasts, the limited availability of in situ measurements necessitated that experiments where in situ data were used in the assimilation included sites used in the verification. Although observations were greylisted, this clearly reduces the levels of independence between the assimilating model and the verifying observations. This will be discussed further in Section “Discussion.”
Due to the variations in fetch and physical processes in different parts of the model domain, wave climate varies significantly between each of the regions verified. Therefore, in order to reduce the influence of background variability in wave conditions on metrics and allow a comparison across the verified regions, the assimilation impact on SWH is measured in a relative sense via a skill score based on the Mean Squared Error (MSE) and using the observed mean as a reference:
SkillMSE takes a range of 0, where the model perfectly replicates the observations, to infinity. A value of 1 is used as a no-skill threshold for the model, since this indicates that the model predictions have the same skill as the observed (climatological) average. The choice of MSE as the skill measure in this instance also allows a simple decomposition of the score into parts representing the contributions of squared bias and error variance, i.e.,:
This decomposition enables the changes in both systematic and random aspects of model performance to be evaluated. Results referencing the SkillMSE change between assimilating runs and control adopt the convention of ‘assimilation experiment minus control.’ In these cases negative values indicate that the assimilating model has improved forecast skill versus the non-assimilating control and, for the bias and variance components, that the systematic and random contributions to overall errors have been reduced.
Results
Impact of Altimeter Assimilation
Figure 5 shows the assimilation impact, for each of the four regions verified and over forecast lead times from 0 to 23 h, for two experiments where only altimeter data were assimilated. The experiment identified as amm15s-acma applies the altimeter data using an operationally typical land-sea mask, which excludes observed values within approximately 40 km of the coast in order to eliminate any chance of land contamination in the data. Experiment amm15s-aext makes use of anticipated improvements in the proximity to the coast from which Sentinel-3 and JASON-3 data can be retrieved by reducing the land-sea mask for these instruments to 8 km.
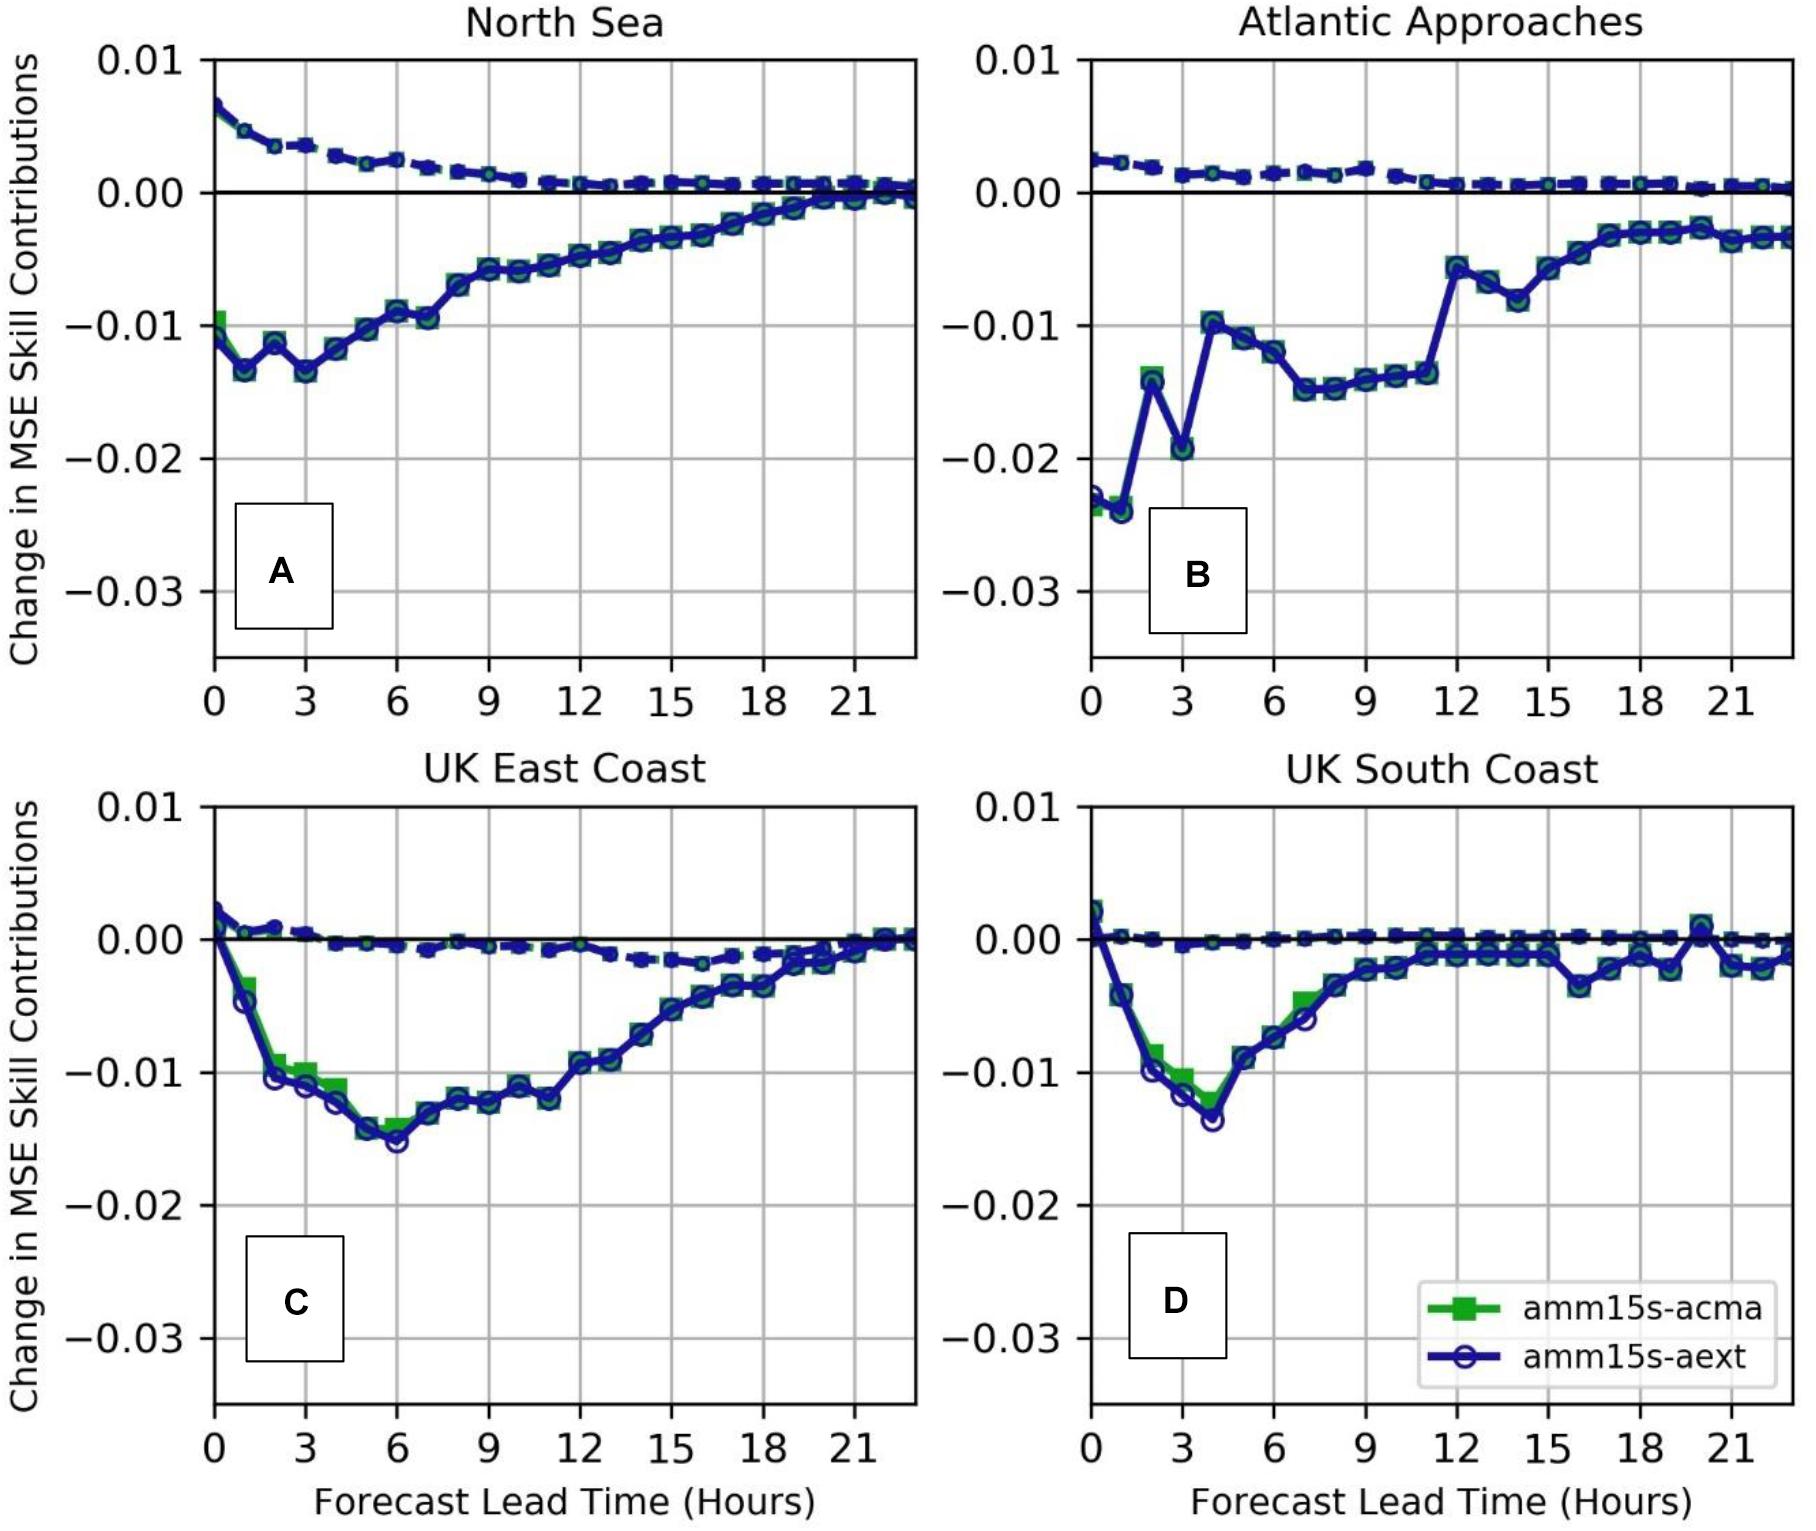
Figure 5. Changes in Squared Bias (dashed line) and Error Variance (solid line) contributions to SWH SkillMSE, versus the control experiment, for assimilation experiments using altimeter observations only (amm15s-acma), and extension of Sentinel-3 and Jason-3 data into the near-coastal zone (amm15s-aext). In these figures a negative value demonstrates a reduced contribution from the error components, leading to an improvement in skill due to the assimilation. (A) Comparison against North Sea in situ data; (B) Atlantic Approaches; (C) United Kingdom East Coast; (D) United Kingdom South Coast.
For both experiments, the assimilation has an overall positive impact for the first 12 h of forecast but forecast skill tends rapidly toward that of the control thereafter. Generally, the change to the (squared) bias contribution is neutral, although the North Sea verification, and to a lesser extent the Atlantic Approaches, indicates an increase in bias versus the control in the first 6 forecast hours (Figure 5A). This effect is most likely due to inconsistencies in the calibration between altimeter and the verifying in situ data, particularly in the North Sea where the in situ data include a variety of measurement platforms and instruments, potentially with differing error characteristics (Schulz-Stellenfleth and Staneva, 2019). For the United Kingdom East and South Coast regions (Figures 5C,D), the variance component of the skill difference between the control and assimilating runs is most improved at approximately 3–4 h into the forecast. This likely reflects the time taken for wave energy corrected further offshore to travel to the coast and implies some degree of system memory.
The effect of extending the coverage of Sentinel-3 and JASON-3 on the verification was found to be almost negligible both for offshore and coastal regions. The result is not that surprising when short correlation lengthscales in the coastal zone are considered, since these mean that corrections will be highly localized. Under these circumstances, impacts would only be found if there were regular passes of the altimeters near to a verifying buoy. Furthermore, the extension to altimeter coverage in experiment amm15s-aext provides only a small and irregular increase in observed data volumes versus the amounts already being used to increment wave energy further offshore in experiment amm15s-acma (Figure 4). This is illustrated further in Figure 6, which compares the mean and standard deviation of increments applied at analysis time during the two experiments. The mean values measure any systematic biases between the model and assimilated observations, whilst standard deviation measures the ‘work done’ by the assimilation scheme. Across the domain these values will be a function not only of the magnitude of increments being applied, but also the levels of coverage provided by the assimilated observations. As would be expected in this case, differentials in the increment statistics are found around coastal areas throughout the domain, due to the increased altimeter coverage in the amm15s-aext experiment. However, the effects are constrained spatially due to the short correlation lengthscales found near the coast. Figure 6B shows that changes in the mean increment are consistent with a small (less than 5 cm) increase in wave height introduced generally across the shelf sea part of the region by the altimeter assimilation (Figure 6A). However, the standard deviation of increments near the coast in experiment amm15s-aext only increases by a few centimeters (Figure 6D), versus a standard deviation on the wider shelf of order 10 s of centimeters (Figure 6C). This indicates that either increments are not particularly large close to the coast or, more likely, that the irregular over-pass of the altimeter leads to these having a limited influence when considered over the entirety of the 2-month evaluation period. Comparing Figures 3, 6, the main regions where coastal increments are significantly changed are upstream and closely located to only 2 (of 12) buoys used in the East Coast verification and 4 (of 16) buoys used for the South Coast. As a result, the overall impact of the coastal assimilation may not be properly sampled in the verification in Figure 5.
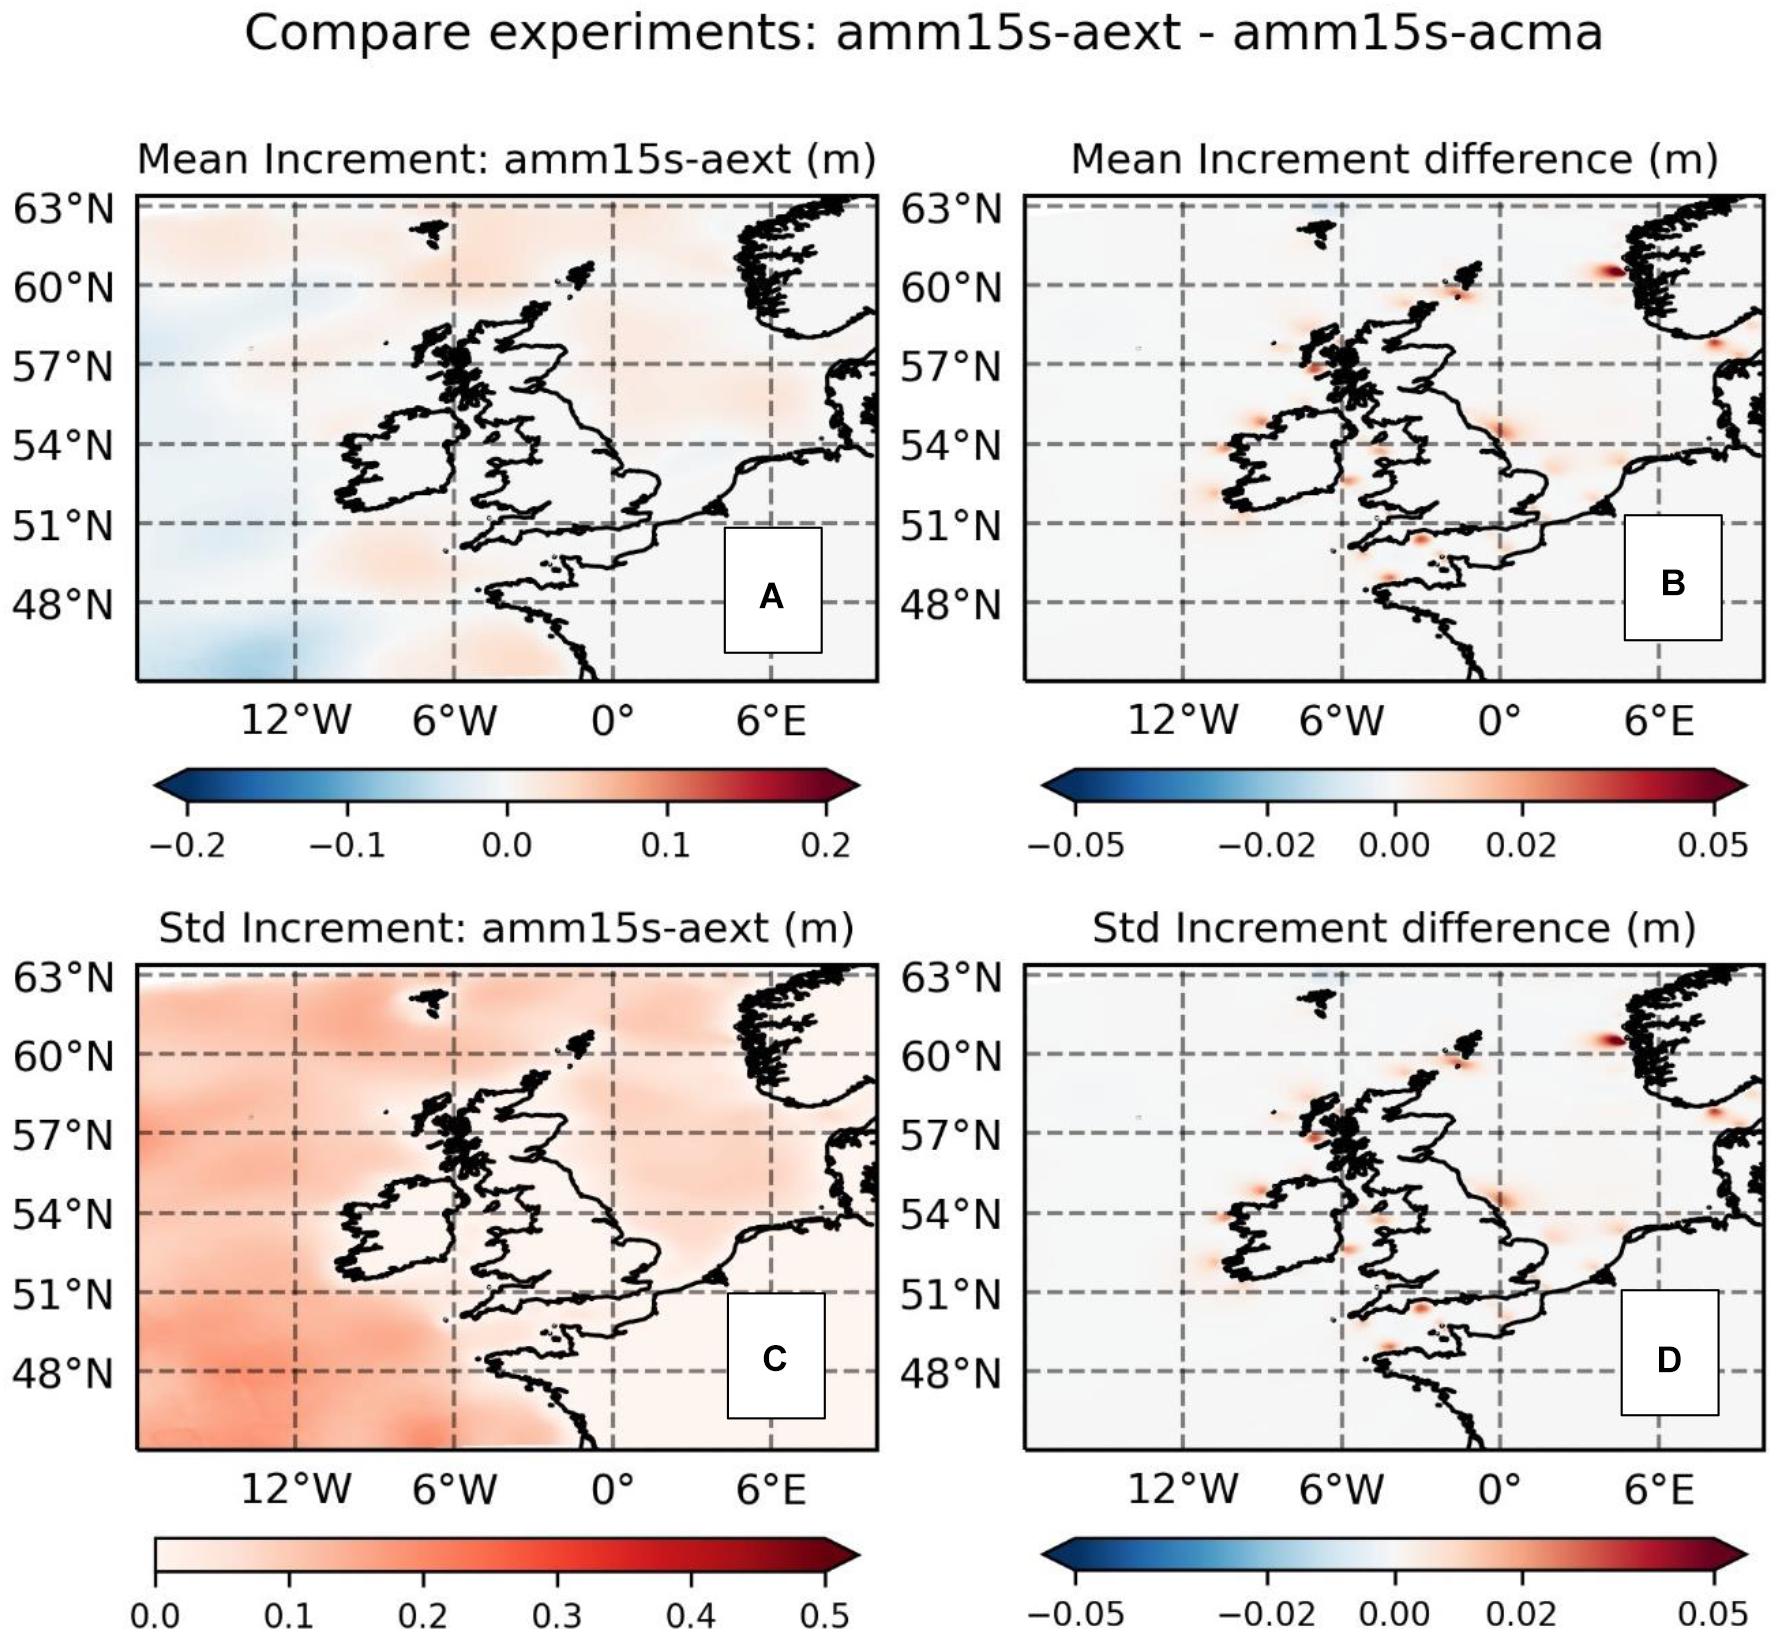
Figure 6. Significant wave height increment statistics and differences between the experiment assimilating offshore altimeter with coastal extension (amm15s-aext) versus assimilation of offshore altimeter only (amm15s-acma). (A) Mean increments for experiment amm15s-aext; (B) difference in mean increments (amm15s-aext minus amm15s-acma); (C) Standard deviation of increments for experiment amm15s-aext; (D) difference in standard deviations of increments (amm15s-aext minus amm15s-acma).
Addition of Offshore in situ Observations
Figure 7 evaluates the impact of assimilation on model skill when adding the greylisted offshore in situ observations (experiment amm15s-acma-ig05) to the open waters altimeter data (experiment amm15s-acma). Overall, the model forecast skill is improved through the addition of the offshore in situ observation for all the verifying regions, both at analysis time (T + 0) and for the first few hours. Inspection of the change in the mean and standard deviation of increments generated in the two experiments (Figures 8B,D) demonstrates that with the inclusion of in situ observations the assimilation system makes larger, or more regular, adjustments to the analysis field. The increase in increment standard deviation in amm15s-acma-ig05 is of a similar order to the overall standard deviation of increments around the in situ observation locations (Figure 8C). These increments should be expected to have an additional positive impact on short-range forecast skill in those regions where offshore verifying observations are included in the assimilation. The improved local corrections are visible in changes to both the squared bias and error variance in Figure 7. For the North Sea and Atlantic Approaches, the increased bias introduced by the altimeter-only assimilation is removed when using combined altimeter and in situ based increments are applied (Figures 7A,B). This lends weight to the suggestion made in Section “Impact of Altimeter Assimilation” that increments derived from the altimeter assimilation may not be well calibrated relative to a number of the verifying in situ observations, particularly in the North Sea. The impact of including the in situ observations is confirmed by contrasting the mean increments in Figure 8A with those in Figure 6A. Adding the offshore in situ observations has the effect of reducing significant wave heights at analysis time in the North Sea and western part of the English Channel (Figure 8A), whereas assimilation of altimeters only reinforces the positive bias between model and the in situ observations (Figure 6A).
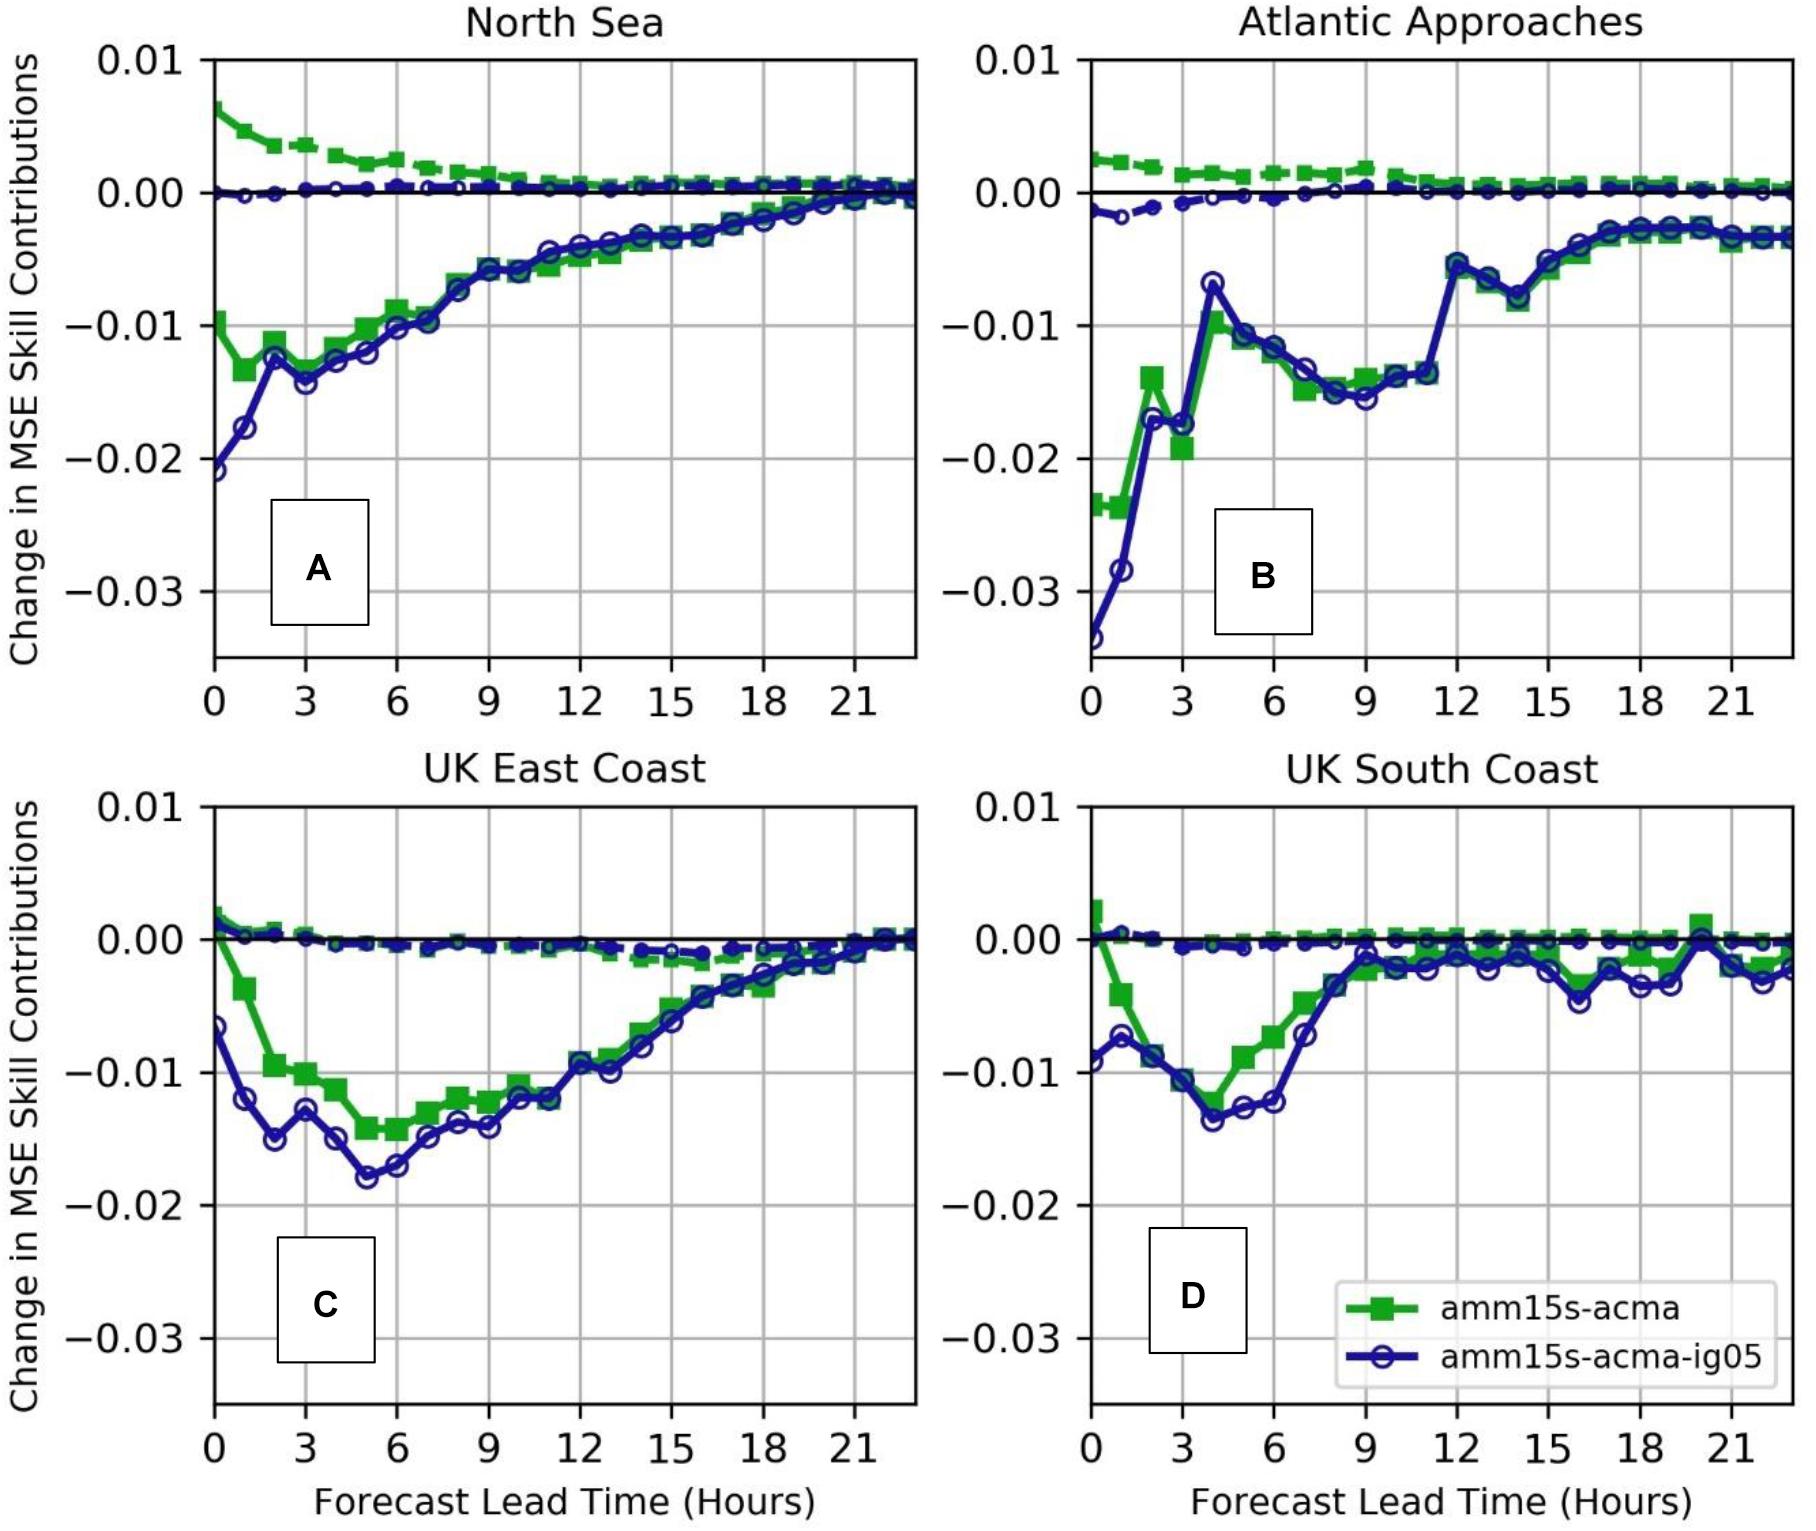
Figure 7. Changes in Squared Bias (dashed line) and Error Variance (solid line) contributions to SWH SkillMSE, versus the control experiment, for assimilation experiments using altimeter observations only (amm15s-acma), and altimeter plus offshore in situ observations (amm15s-acma-ig05). In these figures a negative value demonstrates a reduced contribution from the error components, leading to an improvement in skill due to the assimilation. (A) Comparison against North Sea in situ data; (B) Atlantic Approaches; (C) United Kingdom East Coast; (D) United Kingdom South Coast.
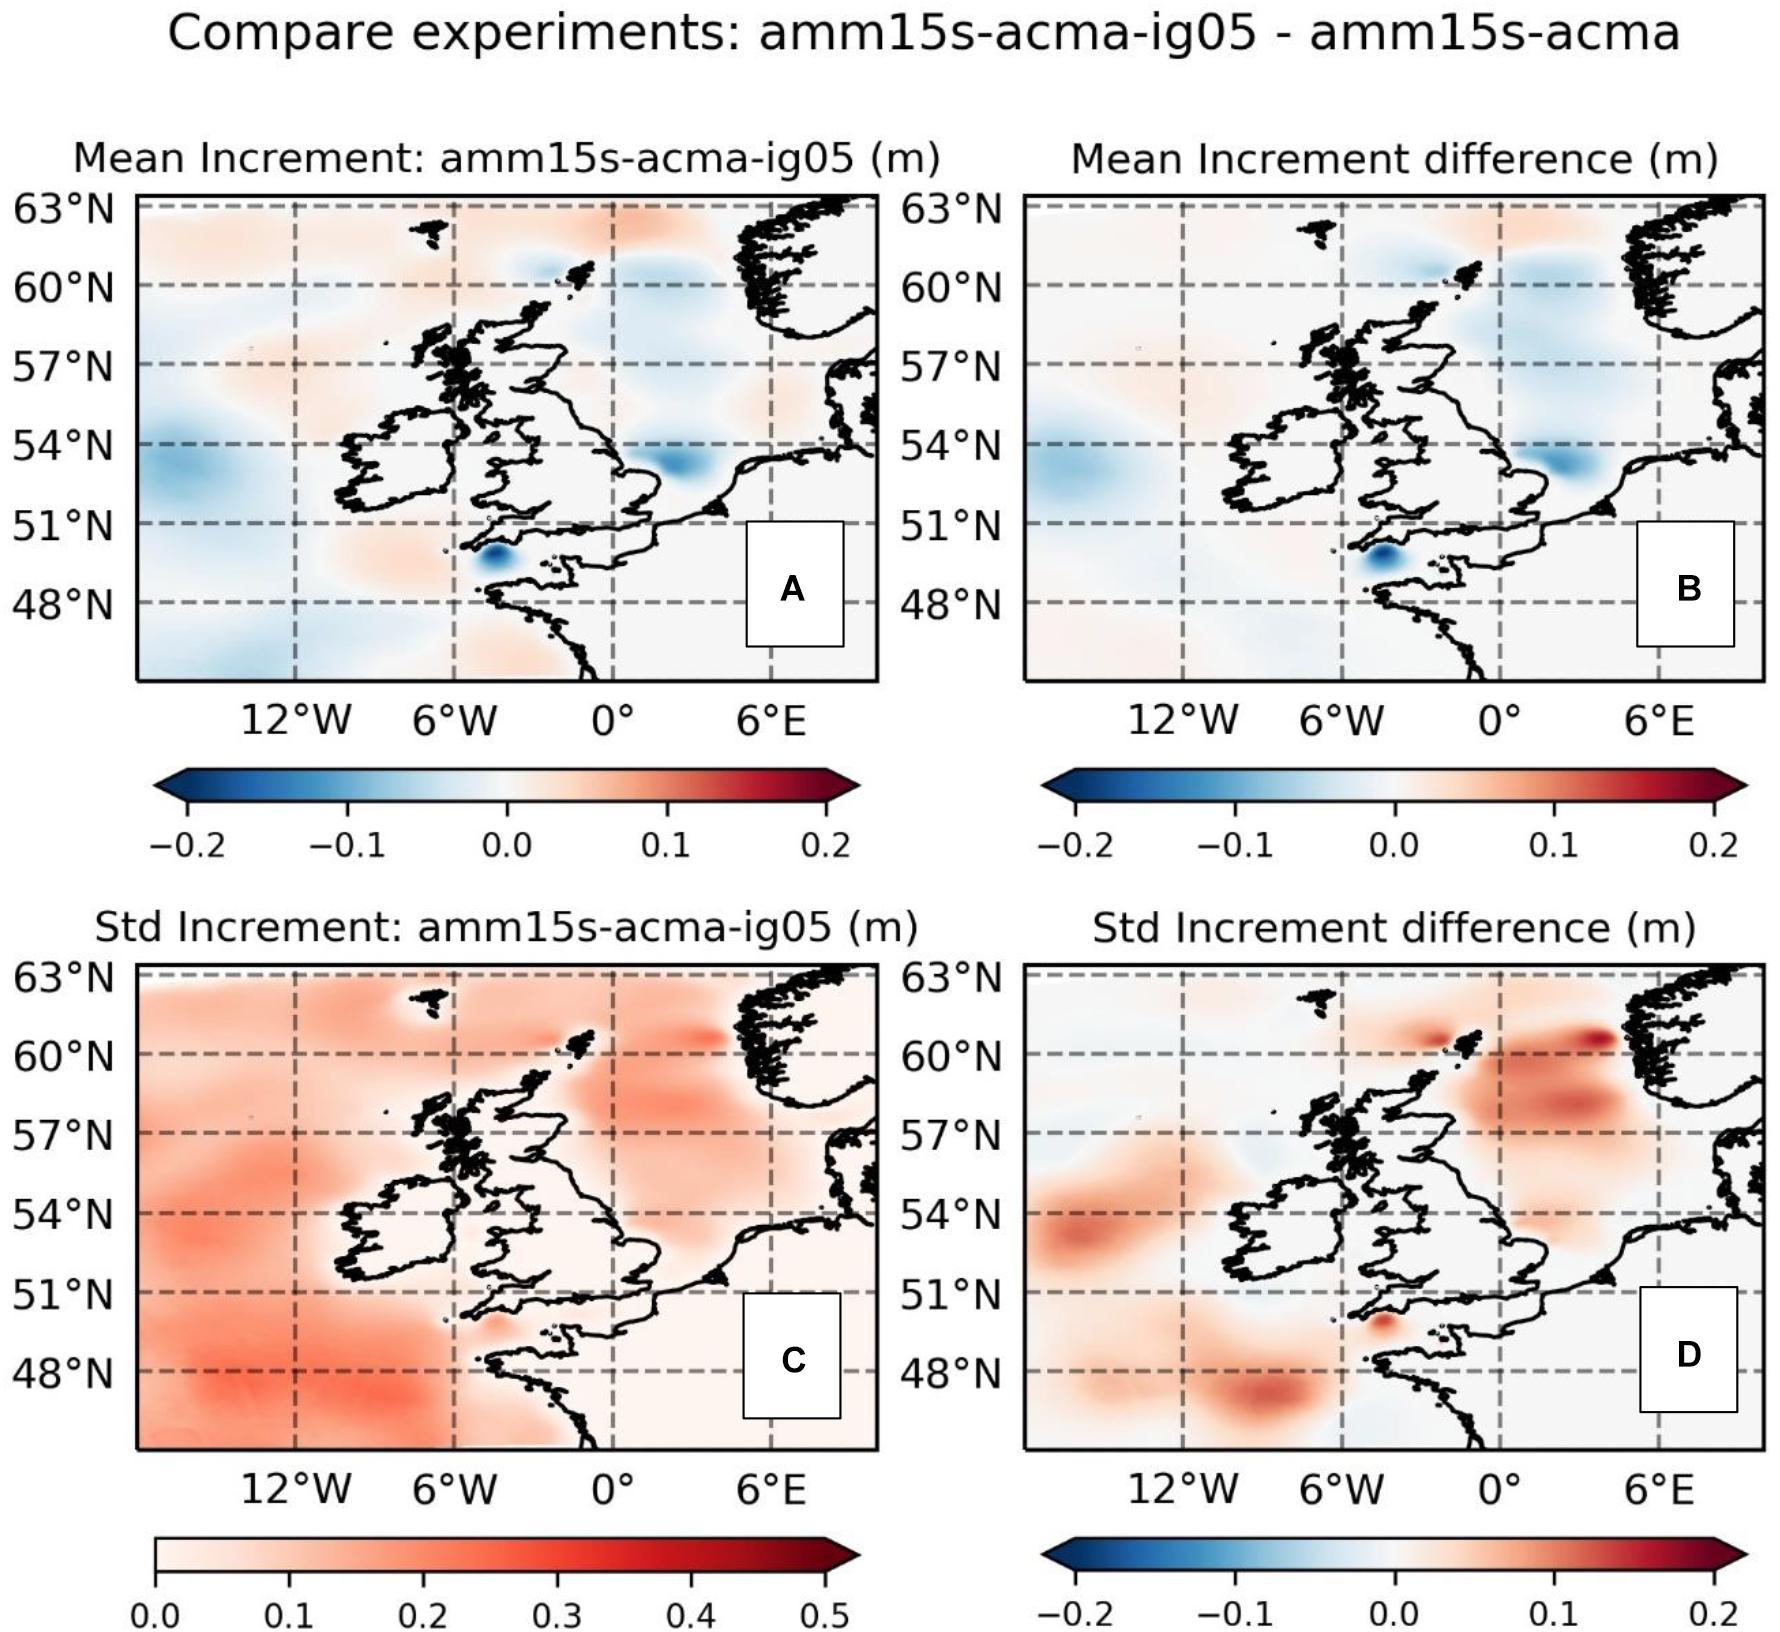
Figure 8. Significant wave height increment statistics and differences between the experiment assimilating offshore altimeter and in situ data (amm15s-acma-ig05) versus assimilation of offshore altimeter only (amm15s-acma). (A) Mean increments for experiment amm15s-acma-ig05; (B) difference in mean increments (amm15s-acma-ig05 minus amm15s-acma); (C) standard deviation of increments for experiment amm15s-acma-ig05; (D) difference in standard deviations of increments (amm15s-acma-ig05 minus amm15s-acma).
Figure 7 also shows regional variations in the timescales over which the additional assimilation of the offshore in situ observations improves the forecasts. For the regions where the verifying data is taken from the same offshore locations used in the assimilation (Atlantic Approaches and North Sea), the additional impact is concentrated in the first 3 h of the forecast (Figures 7A,B). This is consistent with the benefits of a highly localized correction. However, the reduction in impact after 3 h indicates that these corrections add little system memory over and above that achieved via the broader geographic assimilation provided by the altimeter data. In the coastal regions (United Kingdom East and South Coast; Figures 7C,D) no local corrections are made in either of these experiments and the squared bias contributions to model skill are largely unchanged. However, the variance contributions are not only reduced, but are retained for slightly longer (up to 6 h). This is anticipated to be an effect of the time taken for the wave energy corrected further offshore by the assimilation to propagate from offshore to the coastal zone.
Assimilation of Coastal in situ Observations
Figure 9 assesses the skill impact of including both coastal in situ observations and extending the altimeter coverage toward the coastal zone (experiment amm15s-aext-cg05), versus using open waters altimeter and in situ observations only (experiment amm15s-acma-ig05). As might be expected when considering the relatively short correlation lengthscales in this region, the impact of including coastal data is close to negligible for the verification at offshore sites (North Sea and Atlantic Approaches; Figures 9A,B). This is consistent with a relatively limited change in increment standard deviation in much of the offshore part of the model domain (Figure 10D).
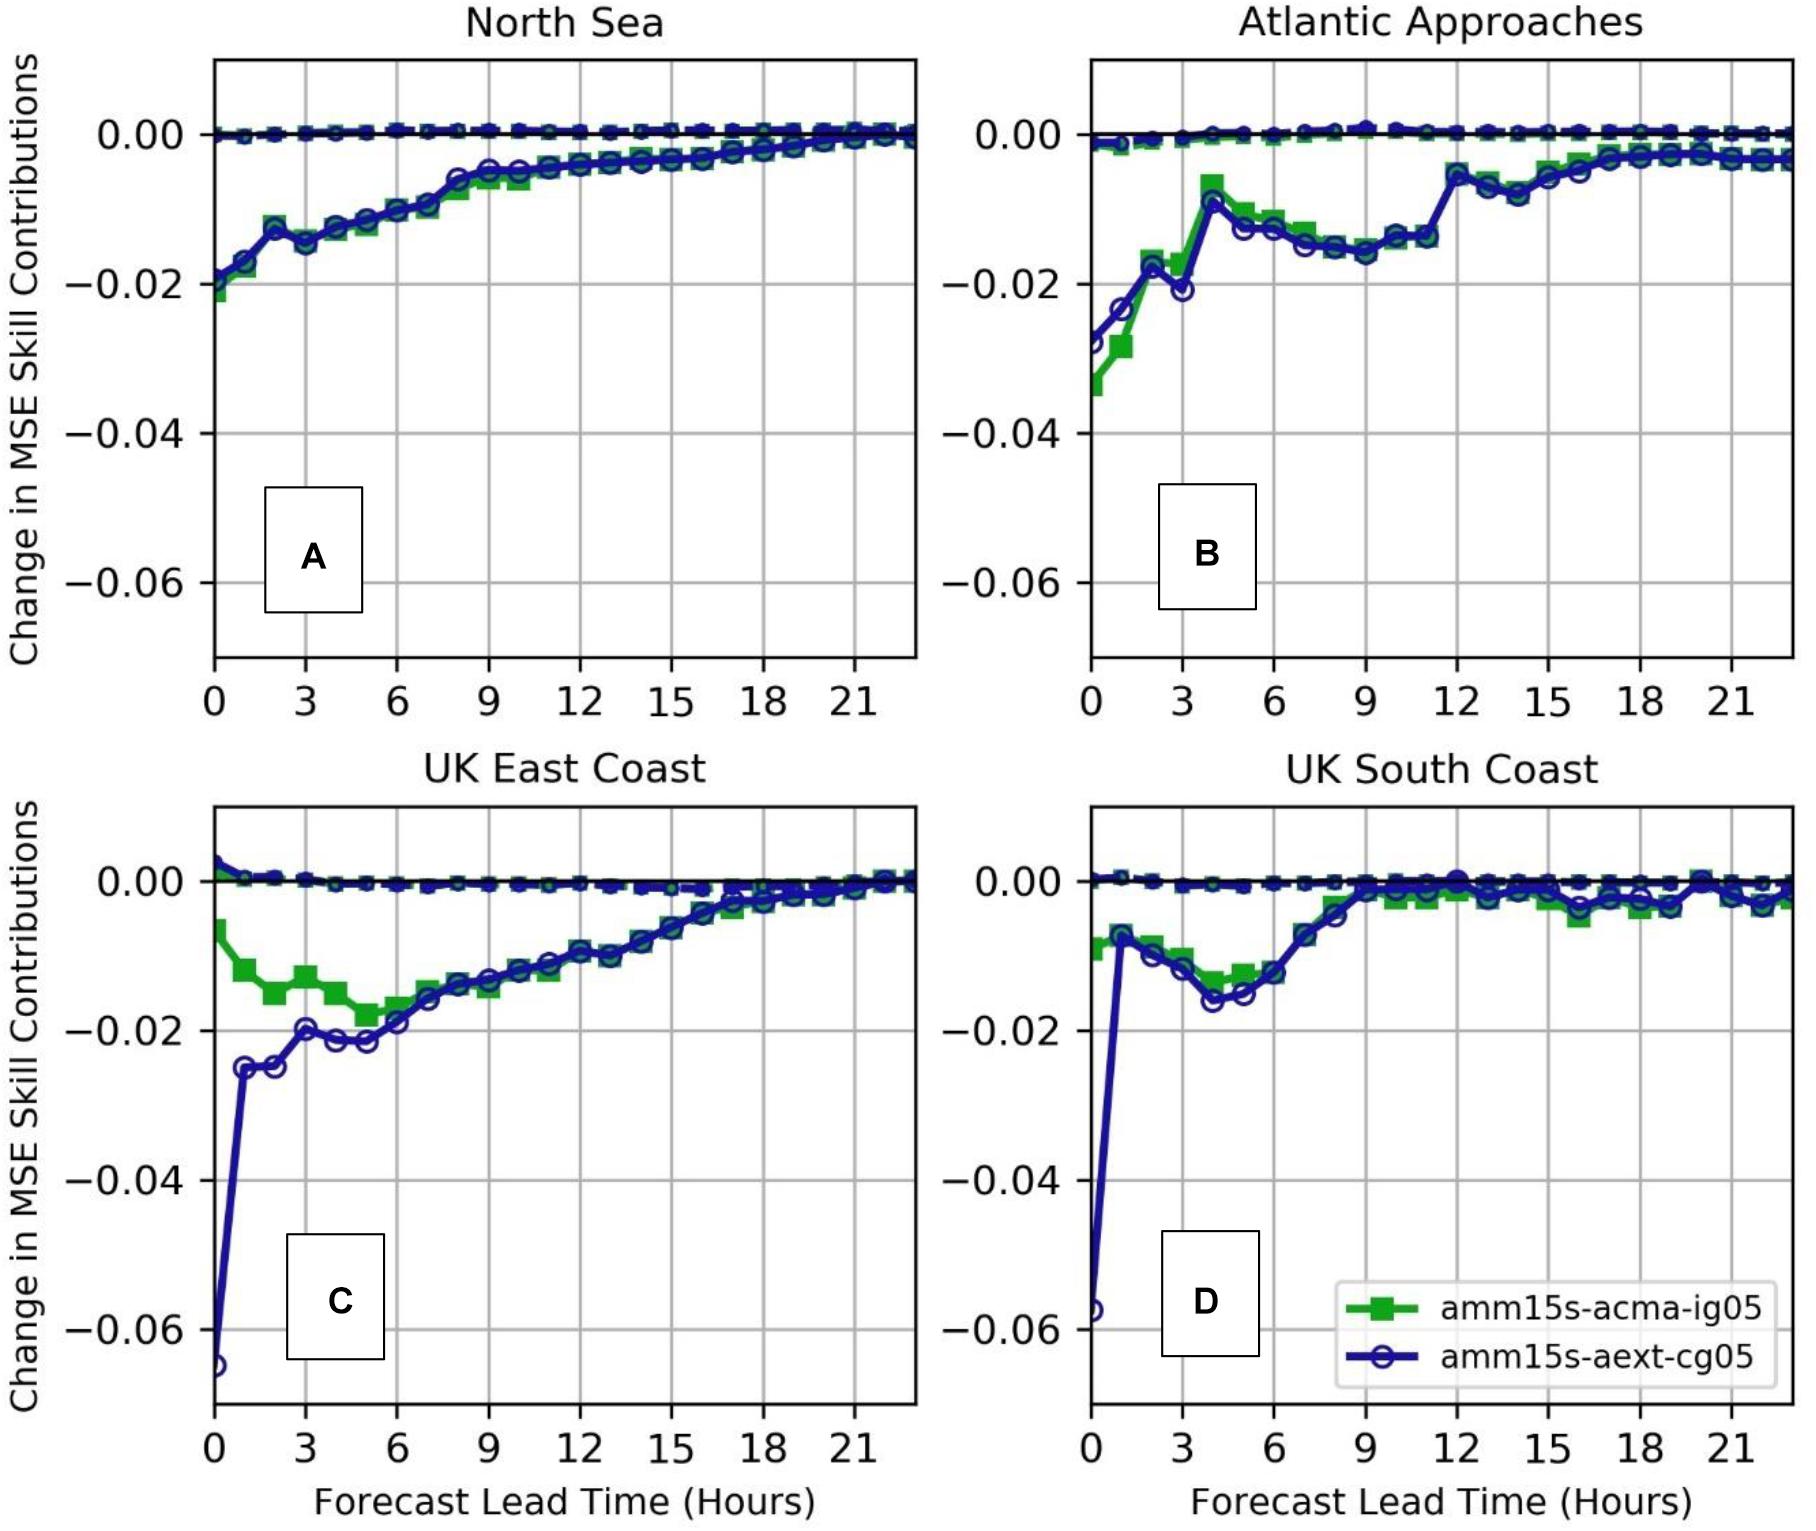
Figure 9. Changes in Squared Bias (dashed line) and Error Variance (solid line) contributions to SWH SkillMSE, versus the control experiment, for assimilation experiments using altimeter observations plus offshore in situ observations (amm15s-acma-ig05); and extension of Sentinel-3 and Jason-3 data into the near-coastal zone plus offshore and coastal in situ observations (amm15s-aext-cg05). In these figures a negative value demonstrates a reduced contribution from the error components, leading to an improvement in skill due to the assimilation. (A) Comparison against North Sea in situ data; (B) Atlantic Approaches; (C) United Kingdom East Coast; (D) United Kingdom South Coast.
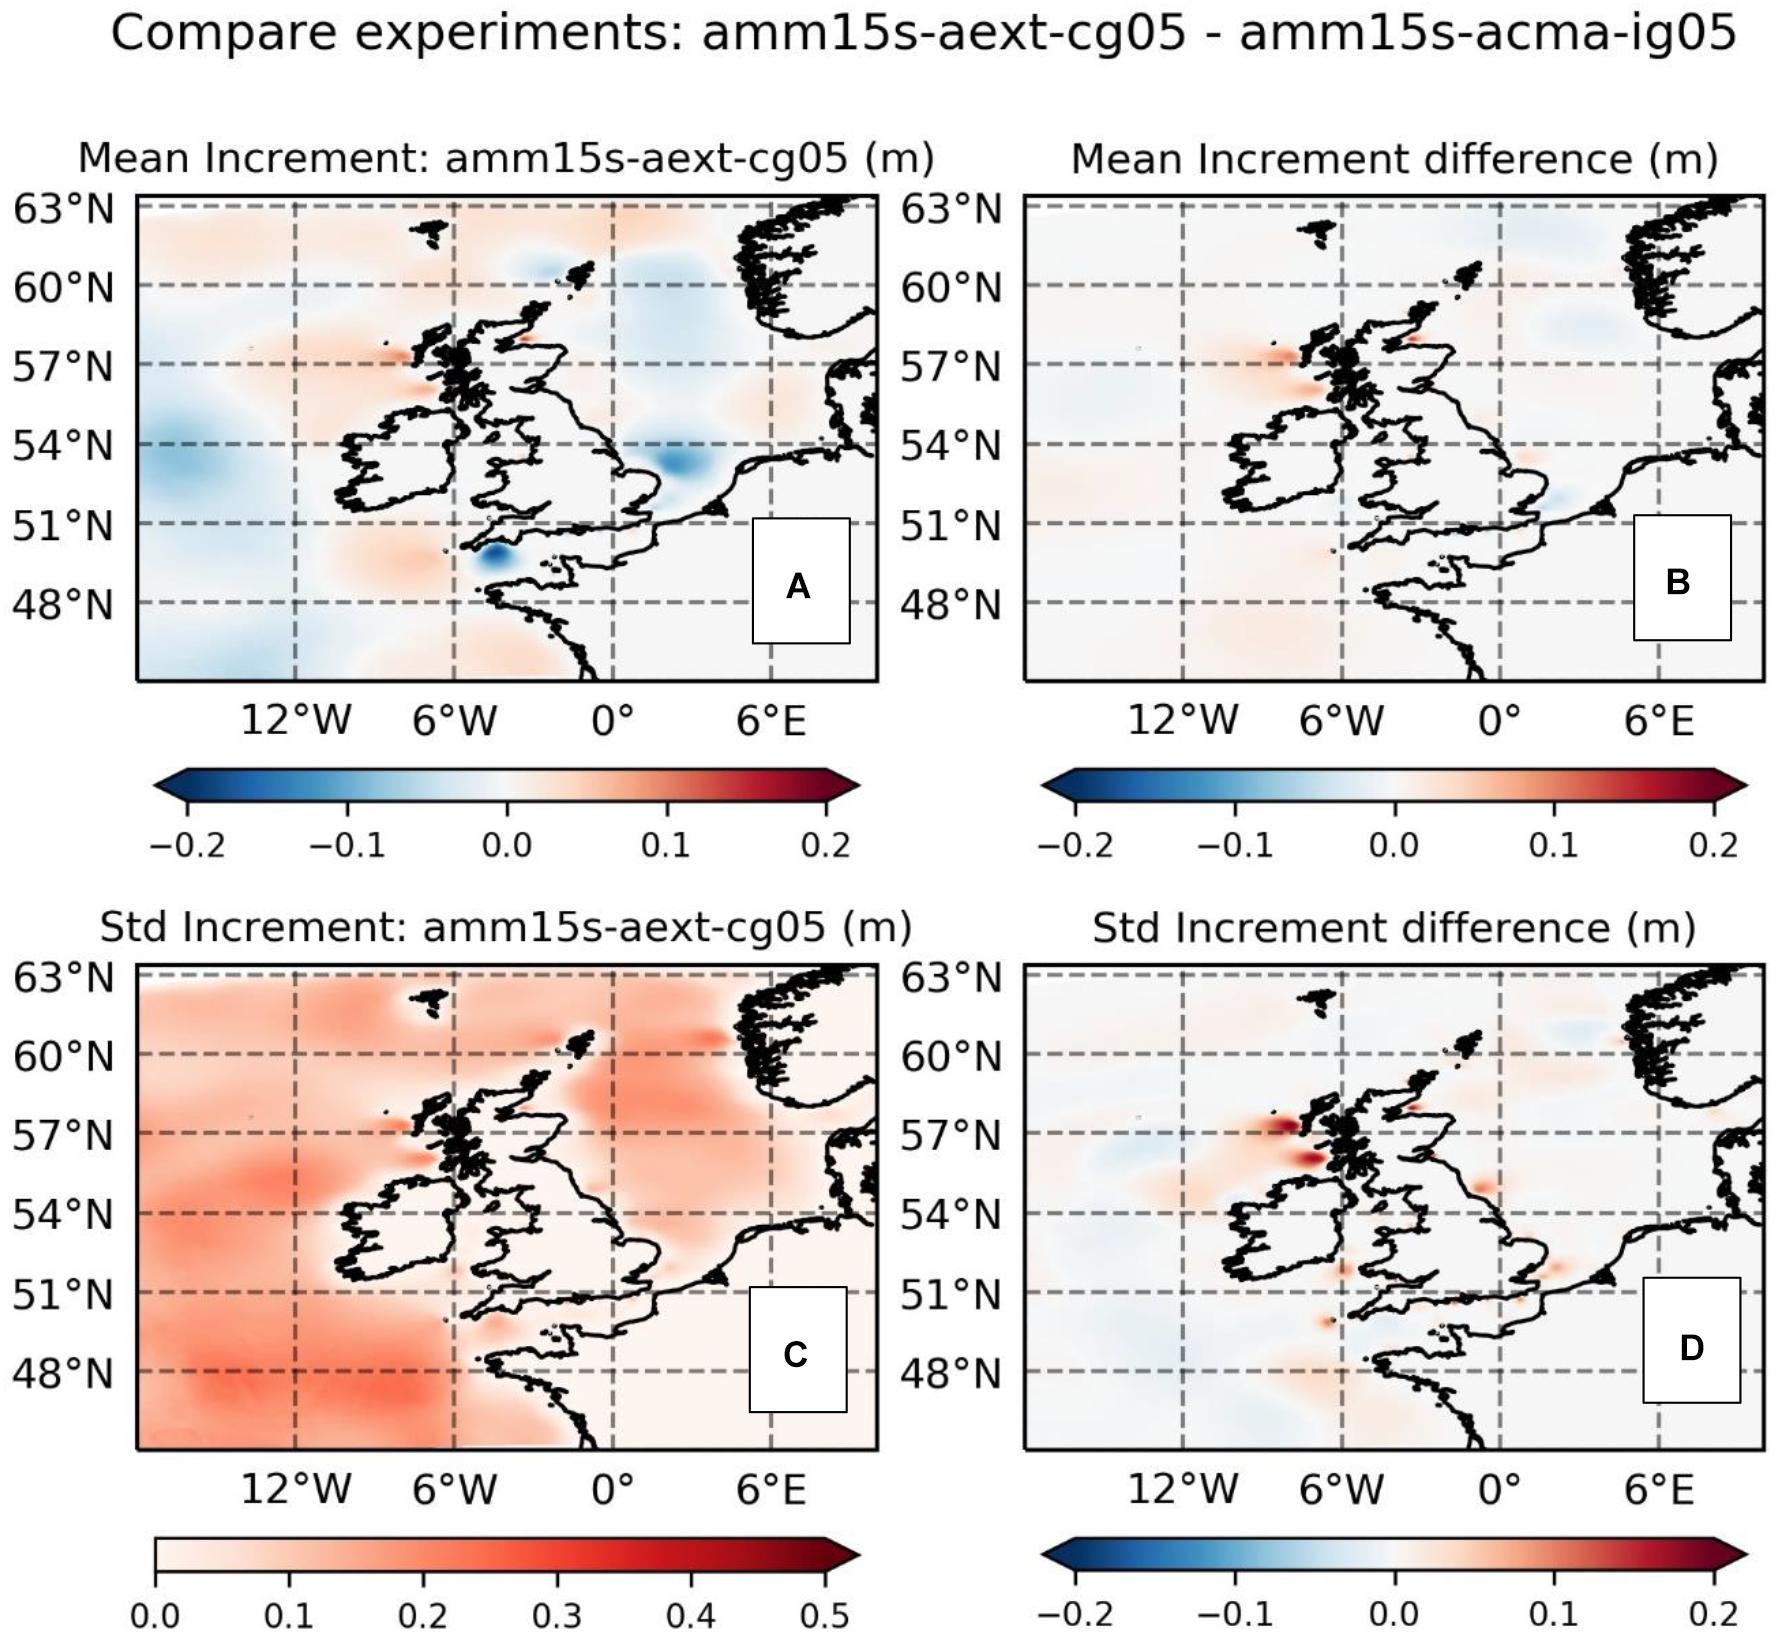
Figure 10. Significant wave height increment statistics and differences between the experiment assimilating altimeter and in situ data with coastal extension (amm15s-aext-cg05) versus assimilation of offshore-only altimeter and in situ (amm15s-acma-ig05). (A) Mean increments for experiment amm15s-aext-cg05; (B) difference in mean increments (amm15s-aext-cg05 minus amm15s-acma-ig05); (C) standard deviation of increments for experiment amm15s-aext-cg05; (D) difference in standard deviations of increments (amm15s-aext-cg05 minus amm15s-acma-ig05).
For the coastal regions (United Kingdom East and South Coast) the impact of including coastal in situ data at analysis time (T + 0) is large (please note the change in scale between these panels in Figure 9, versus Figures 5, 7), as are the coastal zone increments local to clusters of in situ observation sites (Figures 10B,D). Again, noting the different scales in the two figures, the change in standard deviation of increments attributed to the combination of coastal in situ and altimeter observations in Figure 10D is significantly larger than the change introduced in Figure 6D by extending the coastal altimeter coverage only. This is most likely due to the more frequent temporal sampling made by the in situ observations. Mean increments are less impacted, except for an area just off the west coast of Scotland (Figure 10B). However, the effect on forecast skill of the additional coastal increments is lost almost immediately for forecasts of the United Kingdom South Coast and within 3–4 h for the United Kingdom East Coast (Figures 9C,D). This rapid degradation is likely to be a function of both the process scales local to the coast (including regular rapid changes in wave energy associated with short fetch, shallow water dissipation and tidal effects) and, as lead time increases, the influence exerted on predicted wave conditions by wave energy directed shoreward from the offshore regions of the model.
Discussion
Verification Method
Within the region studied, the distribution of in situ observation locations across the domain made it difficult to separate validating observation sites from assimilated sites, particularly in coastal areas. This is a potential issue for a traditional Observing Systems Experiments assessment of assimilation impact, in which it is the preferred choice for assimilated and verifying observations to be independently sourced when verifying the analysis. In order to reduce dependence between these datasets as much as possible, this study both limited the number of in situ observations being used in the assimilation (via a 50% random draw greylisting process) and only used a subset of in situ sites for the verification. The sites used were chosen to reflect the geographic distribution of wave conditions through the domain.
In addition, and from a practical perspective, it is argued that a verification of the analyzed wave conditions and subsequent forecasts is still a useful and valid measure of assimilation impact, even when in situ observations are included in the assimilation. In such cases, the evaluation may no longer be an independent assessment of the assimilation process, but instead answers the question “will the assimilating model produce data that regularly fall closer to the observations than in the model free run.” From a user perspective this is a valid system requirement, since the in situ observations tend to be considered a de facto truth that is publicly available and easy to access and compare against issued forecasts in near real-time. Users generally wish these data and the predictive model to be as consistent as possible.
Through comparing experiments where offshore and coastal in situ measurements were not used, some understanding of the assimilation scheme’s ability to impact forecast skill at locations independent of the assimilated observations can also be reached, and used to infer the likely impact on skill throughout the domain. In this case, we can consider those experiments that use altimeters only (amm15s-acma and amm15s-aext) as a genuinely independent test of the assimilation system’s impact throughout the domain, whilst the experiment which incorporates offshore in situ observations only (amm15s-acma-ig05) is independently verified in the coastal zone. Altimeter-only assimilation and experiments where in situ data were also incorporated showed similar skill impacts after approximately 3 h into the forecasts in the offshore zone. These results suggest that, not far beyond the analysis, positive impacts on forecast skill are dominated by the broadscale assimilation of spatially distributed observations rather than any memory of more localized corrections. Similarly, improvements in skill in the coastal zone, found when including coastal observations in the assimilation, reduced to a similar value to those from using offshore observations after only a few forecast hours. It is noted from the altimeter-only assimilation that some increase in (squared) bias occurred in the North Sea and, to a lesser extent, the Atlantic Approaches which was subsequently removed when including in situ observations in the assimilation. These results suggest that some further work would be needed to properly cross-calibrate the two different observation types in these regions in order to fully exploit altimeter-only assimilation. Reviewing all the experiments holistically, it can be inferred that the most long-lived impacts of the broadscale assimilation improves model SWH forecast skill in terms of MSE relative to background variability (Equation 1) by 1–2% and over the first 12 h of lead time.
Contextualizing Data Assimilation Impacts
An abstracted Mean Squared Error skill score has been used as the principle measure of assimilation impact in the results section. This metric was chosen in order to focus on the relative change in model forecast performance with and without assimilation and because the verification was carried out over regions of the model domain with very different wave height climates. In order to contextualize the assimilation impacts in terms that are relevant to practical applications of the forecasts by users, it is important to look at both the background model skill and error statistics quantified in parameter space (SWH in meters). For the system being tested, the model is relatively skillful in both offshore and coastal regions, with SkillMSE scores of order 5–8% for significant wave height offshore and 10–12% in the coastal zone for the control run. Thus, the inferred improvement of 1–2% in skill when data assimilation is applied is substantive against an already low background error. To quantify the practical outcome, Figure 11 shows the RMS Error (RMSE) scores for SWH against lead time, for the control (experiment amm15s), offshore altimeter-only assimilation (amm15s-acma) and the experiment including both in situ observations and the extension into the coastal zone (amm15s-aext-cg05). For both assimilating experiments the impact is clearly most substantial in the more energetic offshore regions, with RMSE reductions of 5–10 cm in the first 9 h of the forecast (Figures 11A,B). RMSE is only reduced by the order of 1–3 cm in the coastal zone (Figures 11C,D). In all regions, after an hour or two of the forecasts, the in situ data only add order of 1 cm improvement over the altimeter-only assimilation. Therefore, whilst the assimilation scheme is found to positively impact the forecasts across the full domain, the forecasts most practically benefitting will generally be those in offshore regions with a high energy wave climate and more regular coverage by altimeter observations.
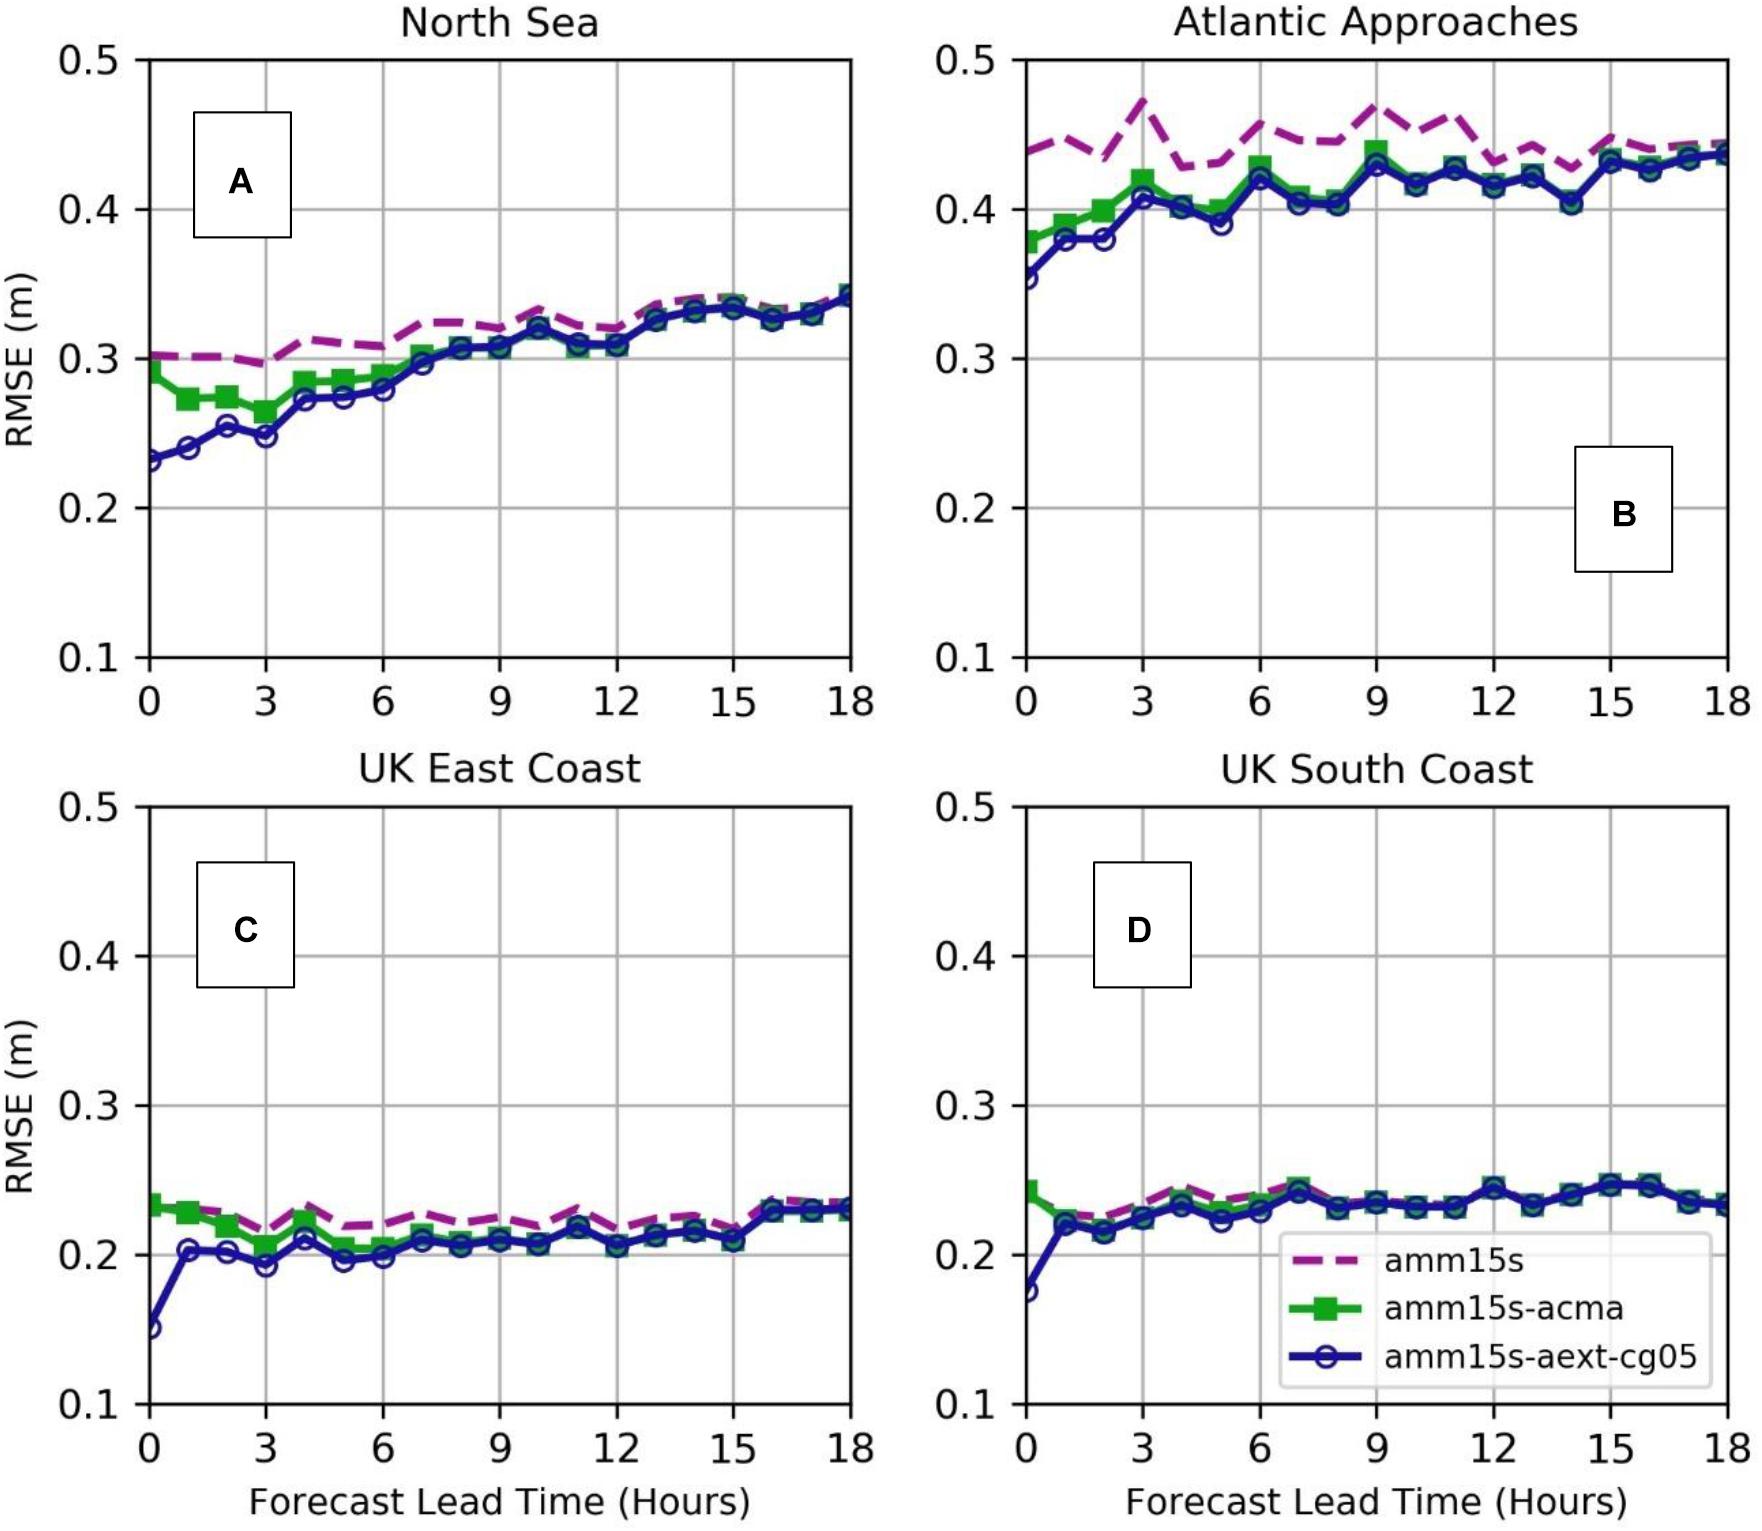
Figure 11. Regional SWH RMSE values for control run (amm15s) plus assimilation experiments using offshore altimeter observations only (amm15s-acma); and extension of Sentinel-3 and Jason-3 data into the near-coastal zone plus offshore and coastal in situ observations (amm15s-aext-cg05). (A) Comparison against North Sea in situ data; (B) Atlantic Approaches; (C) United Kingdom East Coast; (D) United Kingdom South Coast.
The 12-h regional system memory found here is relatively short when compared with the up to 2-days memory cited for global systems (Lefevre and Aouf, 2012). The more limited system memory in the regional model is most likely due to domain size, the quality of wind forcing being applied to the model and any systematic biases or errors inherent in the wave model itself. The domain size and propagation distances to coastlines and other model boundaries affect the residence time of increments in the model. Forcing data quality and wave model errors tend the model toward its free running state regardless of domain size, but in a regional model these effects can be exacerbated by short local fetch lengths and the extent to which the conditions are wind-sea dominated. This is illustrated by the reduced system memory seen in the North Sea and United Kingdom East Coast (11–12 h; Figures 11A,C) versus the Atlantic Approaches (15 h; Figure 11B). Fetch lengths are more constrained in the North Sea. System memory is further reduced for the United Kingdom South Coast (8 h; Figure 11D). In certain locations and scenarios, strong tidal influences may further reduce system memory times by modulating the wave field through the course of a tidal cycle (e.g., Palmer et al., 2015; Lewis et al., 2019).
When operational forecast delivery times are considered, the comparatively short system memory for the regional wave model is a potential issue for practical implementation. For example, in the existing Met Office operational suite wave models are run downstream from the forcing atmosphere model and, as a result, may not deliver forecasts until 4–5 h after the given analysis time (i.e., a wave forecast using the 0000Z cycle will not be run until 0430Z and data will not be released until 0500Z). Even if the computational times were reduced in both atmosphere and wave model, or via implementing a coupled system, latency of the same order (approximately 3 h) is necessary for processing and delivery of near real-time satellite products. In such cases, much of the benefit of the assimilation may be lost by the time the user receives the forecast. On a more positive note, the significant improvements in offshore SWH prediction skill mean that the assimilation scheme would add value in both a rapidly cycling short range forecast system (e.g., for nowcasting lead times up to 18 h with an update frequency of 8 times per day or more), or for a reanalysis product. Figure 12 illustrates that, at individual analysis timesteps, the corrections to the SWH field can be substantial (up to 0.5 m in this example) whilst the additional use of in situ observations (Figures 12C,D) is important in ensuring that coastal and short fetch seas within the domain are regularly constrained by the assimilation.
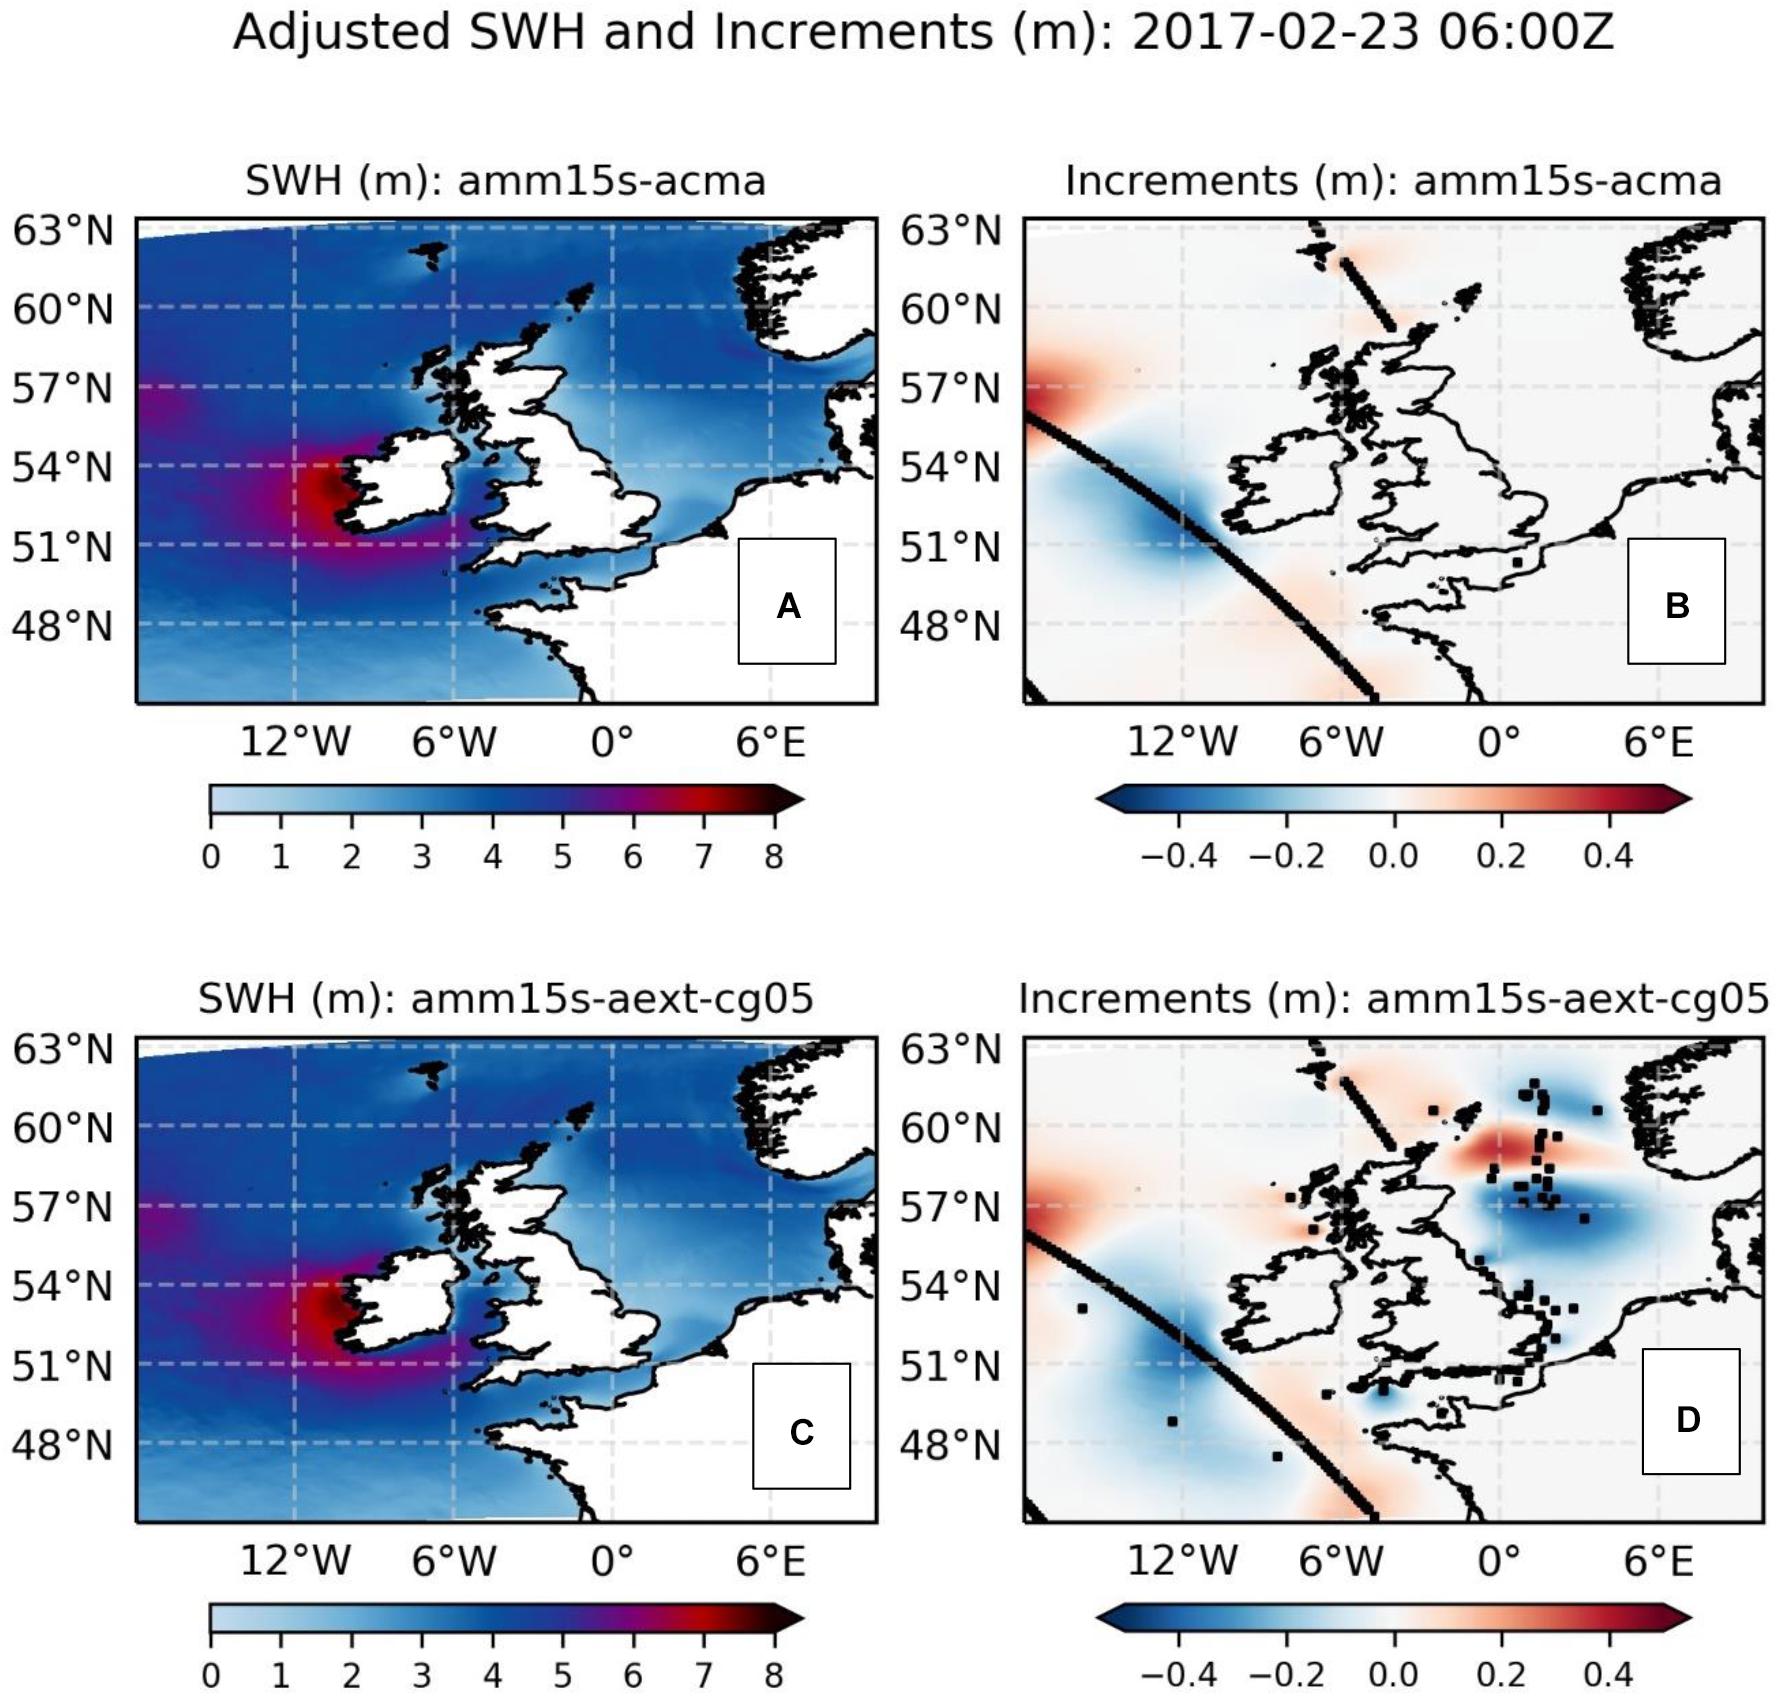
Figure 12. Snapshot of analyzed SWH fields and assimilated SWH increments from experiments (A,B) amm15s-acma and (C,D) amm15s-aext-cg05. The SWH fields correspond to the control run field shown in Figure 1. Observations contributing to the assimilation are overlaid on the increment fields.
In addition to forecasts of SWH, the impacts of assimilating the SWH increments were also validated for peak and mean zero-upcrossing wave period forecast parameters and, where available in the coastal zone, direction and spreading parameters. For all these other parameters the assimilation scheme had near negligible impact. The inference is that model-observation errors for these parameters are strongly dominated by fundamental errors, in either the wave model or observations, which the analyzed increments in wave energy fail to mitigate. In modeling terms, these parameters are harder to predict than SWH, since both wave energy and its distribution in two-dimensional spectral space need to be correctly represented. In global wave models a similar lack of impact on these parameters has been found when assimilating altimeter data, although more positive results have been achieved where Synthetic Aperture Radar (SAR) wave spectra are also assimilated and make more direct corrections to the wave spectrum (Lefevre and Aouf, 2012).
The dependency of forecast skill on forcing conditions and lack of assimilation impact on parameters besides SWH suggests that making longer term improvements to regional wave data assimilation will need to be achieved through more tightly associating the assimilation method with improvements in both the forcing data and background wave model parameterizations. For example, in a coupled atmosphere-wave-ocean model, multi-variate assimilation might enable a better dynamical balancing between the wave conditions and exchanged forcing variables via correction not only to initial wave conditions, but also the wind and surface current fields that provide, respectively, primary and secondary contributions to wave model uncertainty. In terms of using observations, the application of spectral buoy data and SAR may improve impacts on period and direction characteristics (Portilla-Yandún and Cavaleri, 2016).
Conclusion
An assimilation scheme applying NEMOVAR and a northwest European continental shelf seas regional configuration of WAVEWATCH III® has been successfully developed and used to test the impacts of both satellite altimeter and in situ observations on model forecast skill. The assimilation scheme has been demonstrated to have a positive impact on significant wave height forecast skill at a subset of verifying in situ platforms, over lead times of up to 12 h. 5–10 cm improvements in root mean squared error were found for offshore locations in the North Sea and Atlantic Approaches and 1–3 cm improvements along the United Kingdom East Coast and South Coast.
Observation sensitivity experiments suggest that the core, most long lived (12 h), improvements in forecast skill give an order 1–2% change from a free running control. These are underpinned by a geographically broadscale assimilation of altimeter data in open waters of the regional domain. Addition of offshore in situ data introduced an additional 1–2% improvement, but only in the first few hours of the forecast. A similar result was found when extending in situ observations coverage into the coastal zone, which introduced a benefit of 3–5% but only the first 1–2 h of the forecast.
The comparatively short system memory suggests that longer lead time improvements in a regional model applying data assimilation are only likely to be achievable by additionally focusing on contributions to model uncertainty beyond the initial wave conditions. Since the wave model forecast is strongly influenced by the fields used to force the model, it is speculated that further improvements might be achieved through tighter coupling of atmosphere, ocean and wave fields in the analysis cycle, alongside more general improvements to the model’s internal parameterizations of wave growth and dissipation. In lieu of these improvements, the recommended application for this type of assimilation is in either a rapidly cycling short range forecast system for short range nowcasts, or a reanalysis product.
Data Availability Statement
The raw data supporting the conclusions of this article will be made available by the authors, without undue reservation.
Author Contributions
AS led the project research and wrote the initial manuscript. CB designed and built the wave model cycling suite used in the experiments. RK contributed technical configuration for the NEMOVAR wave assimilation. RK and JW provided technical oversight on the wave assimilation method and interpretation of results. All authors contributed to the final editing.
Funding
The research in this paper was funded under the European Union Horizon 2020 Programme H2020-EO-2016, EU contract 730030; CEASELESS project.
Conflict of Interest
The authors declare that the research was conducted in the absence of any commercial or financial relationships that could be construed as a potential conflict of interest.
The reviewer JS-S declared a past collaboration with one of the authors, AS, to the handling Editor.
Acknowledgments
We would like to thank Matt Martin (Met Office) and Jean Bidlot (ECMWF) for their advice and assistance during the project. In addition we would like to thank the reviewers, for their guidance in improving the manuscript.
Footnotes
- ^ https://www.ecmwf.int/en/newsletter/161/news/wmo-lead-centre-wave-forecast-verification-established-ecmwf#:~:text=With%20more%20than%2020%20years,intercomparison%20(see%20ECMWF%20Newsletter%20No.&text=The%20role%20of%20Lead%20Centre,improvements%20to%20the%20wave%20model
- ^ http://www.emodnet.eu/bathymetry
- ^ https://code.metoffice.gov.uk/trac/nwpscience/wiki/ModelInfo/global/PS38
- ^ http://marine.copernicus.eu
- ^ http://www.channelcoast.org
- ^ https://www.cefas.co.uk/cefas-data-hub/wavenet
- ^ http://resources.marine.copernicus.eu/documents/QUID/CMEMS-WAV-QUID-014-001.pdf
- ^ https://sentinels.copernicus.eu/web/sentinel/missions/sentinel-3
References
Almeida, S., Rusu, L., and Guedes Soares, C. (2016). Data assimilation with the ensemble Kalman filter in a high-resolution wave forecasting model for coastal areas. J. Operat. Oceanogr. 9, 103–114. doi: 10.1080/1755876X.2016.1244232
Aouf, L., and Lefèvre, J. M. (2015). On the impact of the assimilation of SARAL/AltiKa wave data in the operational wave model MFWAM. Mar. Geod. 38(Suppl. 1), 381–395. doi: 10.1080/01490419.2014.1001050
Aouf, L., Lefevre, J.-M., and Hauser, D. (2006). Assimilation of directional wave spectra in the wave model WAM: an impact study from synthetic observations in preparation for the SWIMSAT satellite mission. J. Atmos. Oceanic Technol. 23, 448–463.
Ardhuin, F., Gille, S. T., Menemenlis, D., Rocha, C. B., Rascle, N., Chapron, B., et al. (2017). Small-scale open ocean currents have large effects on wind wave heights. J. Geophys. Res. Oceans. 122, 4500–4517. doi: 10.1002/2016JC012413
Ardhuin, F., Rogers, E., Babanin, A. V., Filipot, J.-F., Magne, R., Roland, A., et al. (2010). Semi-empirical dissipation source functions for wind-wave models. Part I: definition, calibration and validation. J. Phys. Oceanogr. 40, 1917–1941.
Ardhuin, F., Stopa, J. E., Chapron, B., Collard, F., Husson, R., Jensen, R. E., et al. (2019). Observing sea states. Front. Mar. Sci. 6:124. doi: 10.3389/fmars.2019.00124
Bannister, R. N. (2017). A review of operational methods of variational and ensemble-variational data assimilation. Q. J. R. Meteorol. Soc. 143, 607–633. doi: 10.1002/qj.2982
Battjes, J. A., and Janssen, J. P. F. M. (1978). “Energy loss and set-up due to breaking of random waves,” in Proceedings of the 16th International Conference on Coastal Engineering, (Reston, VA: ASCE), 569–587.
Bidlot, J.-R. (2016). Twenty-One Years of Wave Forecast Verification. Available online at: https://www.ecmwf.int/sites/default/files/elibrary/2017/16987-newsletter-no-150-winter-201617.pdf (accessed September 17, 2020).
Bloom, S. C., Takacs, L. L., da Silva, A. M., and Ledvina, D. (1996). Data assimilation using incremental analysis updates. Mon. Wea. Rev. 124, 1256–1271. doi: 10.1175/1520-04931996124<1256:DAUIAU<2.0.CO;2
Booij, N., Ris, R., and Holthuijsen, L. (1999). A third-generation wave model for coastal regions: 1. Model description and validation. J. Geophys. Res. 104, 7649–7666.
Breivik, L.-A., Reistad, M., Schyberg, H., Sunde, J., Krogstad, H. E., and Johnsen, H. (1998). Assimilation of ERS SAR wave spectra in an operational wave model. J. Geophys. Res. 103, 7887–7900.
Brown, A., Milton, S., Cullen, M., Golding, B., Mitchell, J., and Shelly, A. (2012). Unified modeling and prediction of weather and climate: a 25-year journey. Bull. Am. Meteorol. Soc. 93, 1865–1877.
Cavaleri, L., Abdalla, S., Benetazzo, A., Bertotti, L., Bidlot, J.-R., Breivik, Ø, et al. (2018). Wave modelling in coastal and inner seas. Prog. Oceanogr. 167, 164–233. doi: 10.1016/j.pocean.2018.03.010
Cavaleri, L., and Bertotti, L. (2006). The improvement of modelled wind and wave fields with increasing resolution. Tellus 33, 553–565.
Cavaleri, L., Bertotti, L., and Pezzutto, P. (2019). Accuracy of altimeter data in inner and coastal seas. Ocean Sci. 15, 227–233. doi: 10.5194/os-15-227-2019
European Centre for Medium-range Weather Forecasts [ECMWF] (2020). Integrated Forecast System (IFS) Documentation CY47R1 – Part VII ECMWF Wave Model. Available online at: https://www.ecmwf.int/en/elibrary/19751-part-vii-ecmwf-wave-model (accessed September 18, 2020).
Flather, R. (1976). A tidal model of the northwest European continental shelf. Mem. Soc. Roy. Sci. Liege 10, 141–164.
Fujiwara, K., Arikawa, T., and Seki, K. (2019). “A study on applicability of ensemble kalman filter for wave prediction model,” in APAC 2019, eds N. Trung Viet, D. Xiping, and T. Thanh Tung (Singapore: Springer), doi: 10.1007/978-981-15-0291-0_34
Graham, J. A., O’Dea, E., Holt, J., Polton, J., Hewitt, H. T., Furner, R., et al. (2018). AMM15: a new high-resolution NEMO configuration for operational simulation of the European north-west shelf. Geosci. Model Dev. 11, 681–696. doi: 10.5194/gmd-11-681-2018
Greenslade, D. J. M., and Young, I. R. (2004). Background errors in a global wave model determined from altimeter data. J. Geophys. Res. 109:C09007. doi: 10.1029/2004JC002324
Hasselmann, K., Barnett, T. P., Bouws, E., Carlson, H., Cartwright, D. E., Enke, K., et al. (1973). Measurements of wind-wave growth and swell decay during the Joint North Sea Wave Project (JONSWAP). Erg änzung. zur Deut. Hydrogr. Z. 12, 1–95.
Hasselmann, S., Hasselmann, K., Allender, J. H., and Barnett, T. P. (1985). Computations and parameterisations of the nonlinear energy transfer in a gravity wave spectrum. Part 2: parameterisations of the nonlinear energy transfer for application in wave models. J. Phys. Oceanogr. 15, 1378–1391.
Janssen, P. A. E. M. (2008). Progress in ocean wave forecasting. J. Comp. Phys. 227, 3572–3594. doi: 10.1016/j.jcp.2007.04.29
Janssen, P. A. E. M., Abdalla, S., Hersbach, H., and Bidlot, J.-R. (2007). Error estimation of buoy, satellite, and model wave height data. J. Atmos. Oc. Tech. 24, 1665–1677. doi: 10.1175/JTECH2069.1
Kohno, N., Miura, D., and Yoshita, K. (2011). “The development of JMA wave data assimilation system,” in Proceedings of the 12th International Workshop on Wave Hindcasting and Forecasting, (Tokyo: Japan Meteorological Agency).
Kwon, I., English, S., Bell, W., Potthast, R., Collard, A., and Ruston, B. (2018). Assessment of Progress and Status of Data Assimilation in Numerical Weather Prediction. Bull. Amer. Meteor. Soc. 99, ES75–ES79. doi: 10.1175/BAMS-D-17-0266.1
Lefevre, J.-M., and Aouf, L. (2012). “Latest developments in wave data assimilation,” in Proceedings of the ECMWF Workshop on Ocean Waves, (Reading: ECMWF).
Lewis, M. J., Palmer, T., Hashemi, R., Robins, P., Saulter, A., Brown, J., et al. (2019). Wave-tide interaction modulates nearshore wave height. Ocean Dyn. 69, 367–384. doi: 10.1007/s10236-018-01245-z
Li, J., and Zhang, S. (2020). Mitigation of model bias influences on wave data assimilation with multiple assimilation systems using WaveWatch III v5.16 and SWAN v41.20. Geosci. Model Dev. 13, 1035–1054. doi: 10.5194/gmd-13-1035-2020
Li, J.-G. (2008). Upstream Non-Oscillatory (UNO) advection schemes. Mon. Weather Rev. 136, 4709–4729.
Li, J.-G. (2011). Global transport on a spherical multiple-cell grid. Mon. Weather Rev. 139, 1536–1555.
Li, J.-G. (2012). Propagation of ocean surface waves on a spherical multiple-cell grid. J. Comput. Phys. 231, 8262–8277.
Lionello, P., Günther, H., and Janssen, P. A. E. M. (1992). Assimilation of altimeter data in a global third-generation wave model. J. Geophys. Res. 97, 14453–14474. doi: 10.1029/92JC01055
Madec, G. (2008). NEMO Ocean Engine. (Note du Pôle de Modélisation). France: Institut Pierre-Simon Laplace (IPSL).
Mirouze, I., Blockley, E. W., Lea, D. J., Martin, M. J., and Bell, M. J. (2016). A multiple length scale correlation operator for ocean data assimilation. Tellus A 68, 1–13. doi: 10.3402/tellusa.v68.29744
Mirouze, I., and Weaver, A. T. (2010). Representation of correlation functions in variational assimilationusing an implicit diffusion operator. Q. J. R. Meteorol. Soc. 136, 1421–1443. doi: 10.1002/qj.643
Mogensen, K., Balmaseda, M. A., Weaver, A. T., Martin, M., and Vidard, A. (2009). NEMOVAR: a variational data assimilation system for the NEMO model. ECMWF Newsl. 120, 17–22.
Mogensen, K. S., Balmaseda, M. A., and Weaver, A. (2012). The NEMOVAR Ocean Data Assimilation System as Implemented in the ECMWF Ocean Analysis for System 4. Technical Report 668. Reading: ECMWF.
Moore, A. M., Martin, M. J., Akella, S., Arango, H. G., Balmaseda, M., Bertino, L., et al. (2019). Synthesis of Ocean observations using data assimilation for operational, real-time and reanalysis systems: a more complete picture of the state of the Ocean. Front. Mar. Sci. 6:90. doi: 10.3389/fmars.2019.00090
O’Dea, E., Arnold, A., Edwards, K., Furner, R., Hyder, P., Martin, M., et al. (2012). An operational ocean forecast system incorporating NEMO and SST data assimilation for the tidally driven European north-west shelf. J. Operat. Oceanog. 5, 3–17.
Orzech, M. D., Veeramony, J., and Ngodock, H. (2013). A variational assimilation system for nearshore wave modeling. J. Atmos. Oceanic Technol. 30, 953–970. doi: 10.1175/JTECH-D-12-00097.1
Palmer, T., and Saulter, A. (2013). Assessment of Significant Wave Height Correlation Distances in the North Sea and North East Atlantic using a Mesoscale Wave Hindcast. Available online at: https://library.metoffice.gov.uk/Portal/DownloadImageFile.ashx?objectId=424 (accessed July 3, 2020).
Palmer, T., Stratton, T., Saulter, A., and Henley, E. (2015). “Case study comparisons of UK macro-tidal regime wave and current interaction processes; mesoscale wave model versus coastal buoy data,” in Proceedings 14th International Workshop on Wave Hindcasting and Forecasting and 5th Coastal Hazard Symposium, Florida Keys, FL.
Polavarapu, S., Ren, S., Rochon, Y., Sankey, D., Ek, N., Koshyk, J., et al. (2005). Data assimilation with the Canadian middle atmosphere model. Atmos. Ocean 43, 77–100.
Portilla-Yandún, J., and Cavaleri, L. (2016). On the specification of background errors for wave data assimilation systems. J. Geophys. Res. Oceans 121, 209–223. doi: 10.1002/2015JC011309
Queffeulou, P. (2013). “Merged altimeter data base. An update,” in Proceedings of the ESA Living Planet Symposium 2013, (Edinburgh: ESA), 9–13.
Saulter, A., Bunney, C., and Li, J.-G. (2016). Application of a Refined Grid Global Model for Operational Wave Forecasting. Available online at: https://library.metoffice.gov.uk/Portal/DownloadImageFile.ashx?objectId=405 (accessed July 3, 2020).
Saulter, A., Bunney, C., Li, J.-G., and Palmer, T. (2017). “Process and resolution impacts on UK coastal wave predictions from operational global-regional wave models,” in Proceedings of the 15th International Workshop on Wave Hindcasting and Forecasting & 6th Coastal Hazard Symposium. Liverpool.
Schulz-Stellenfleth, J., and Staneva, J. (2019). A multi-collocation method for coastal zone observations with applications to Sentinel-3A altimeter wave height data. Ocean Sci. 15, 249–268. doi: 10.5194/os-15-249-2019
Siddons, L. A., Wyatt, L. R., and Wolf, J. (2009). Assimilation of HF radar data into the SWAN wave model. J. Mar. Syst. 77, 312–324.
Song, Q., and Mayerle, R. (2017). A 4D variational assimilation scheme with partition method for nearshore wave models. Ocean Dyn. 67, 989–1002. doi: 10.1007/s10236-017-1069-9
Toba, Y. (1972). Local balance in the air-sea boundary processes. I. On the growth process of wind waves. J. Oceanogr. 28, 109–121.
Waters, J., Martin, M. J., Lea, D. J., Mirouze, I., Weaver, A. T., and While, J. (2015). Implementing a variational data assimilation system in an operational 1/4 degree global ocean model. Q. J. Roy. Meteorol. Soc. 141, 333–349.
Wavewatch III® Development Group (2019). User Manual and System Documentation of WAVEWATCH III§Version 6.07. Available online at: https://github.com/NOAA-EMC/WW3/wiki/Manual (accessed July 3, 2020).
Keywords: waves, wave modeling, data assimilation, NEMOVAR, regional, shelf seas
Citation: Saulter AN, Bunney C, King RR and Waters J (2020) An Application of NEMOVAR for Regional Wave Model Data Assimilation. Front. Mar. Sci. 7:579834. doi: 10.3389/fmars.2020.579834
Received: 03 July 2020; Accepted: 02 October 2020;
Published: 27 October 2020.
Edited by:
Joanna Staneva, Helmholtz Centre for Materials and Coastal Research (HZG), GermanyReviewed by:
Johannes Schulz-Stellenfleth, Helmholtz Centre for Materials and Coastal Research (HZG), GermanyNobuhito Mori, Kyoto University, Japan
Liliana Celia Rusu, “Dunarea de Jos” University of Galati, Romania
Jane Smith, Engineer Research and Development Center (ERDC), United States
Emmanuel Cosme, Université Grenoble Alpes, France
Copyright © 2020 Saulter, Bunney, King and Waters. This is an open-access article distributed under the terms of the Creative Commons Attribution License (CC BY). The use, distribution or reproduction in other forums is permitted, provided the original author(s) and the copyright owner(s) are credited and that the original publication in this journal is cited, in accordance with accepted academic practice. No use, distribution or reproduction is permitted which does not comply with these terms.
*Correspondence: Andrew N. Saulter, YW5kcmV3LnNhdWx0ZXJAbWV0b2ZmaWNlLmdvdi51aw==