- 1Laboratorio de Reproducción y Biología Integrativa de Invertebrados Marinos, Centro Cientifico Tecnológico CONICET-CENPAT, Instituto de Biología de Organismos Marinos, Puerto Madryn, Argentina
- 2Facultad de Ciencias Naturales, Universidad Nacional de la Patagonia San Juan Bosco, Puerto Madryn, Argentina
- 3Universidad Espíritu Santo, Guayaquil, Ecuador
Temperate rocky reefs in Atlantic Patagonia are productive areas that support a high diversity of invertebrates, algae, and fishes. Complex surface structures on rocky reefs offer a range of microhabitats, which in turn, lead to a broad variety of co-existing species. Despite their ecological importance and the ecosystem services they provide, Patagonian rocky reef habitats have received limited attention. Until now studies have not discerned nor consequently described the assemblages found on each of the different surface orientations, namely horizontal, vertical, overhang and cavefloor. During this study we developed a protocol for sampling different surface orientations on subtidal rocky reefs using georeferenced high-resolution photoquadrats. We described and compared the epibenthic assemblage of surface orientations on 7 rocky reefs within 1–25 m depth in a northern Patagonia gulf. A total of 70 taxa were identified (12 macroalgae, 44 invertebrates, 10 tunicates, and 4 fishes), which doubles the number of species previously reported for the area. Each surface orientation presented a different assemblage structure while species richness was higher on vertical surfaces. The overhang surfaces had the most distinct assemblage conformed by cnidarians, tunicates, sponges and the absence of algae. The average overall species richness increased with depth due to the increase of sponge and tunicate species. Our results highlight the need of including several surface orientations in rocky reef biodiversity monitoring. This study offers a protocol for large-scale programs aimed at monitoring changes in biodiversity, which is broadly accessible and will provide accurate information. With robust yet simple, non-destructive and relatively low-cost practices this protocol can adequately assess changes in marine habitats, which provide important ecosystem services.
Introduction
Rocky subtidal reefs are recognized as highly biodiverse and productive areas, particularly in temperate waters of the world where other types of communities, such as coral reefs are scarce or absent. These areas generally support communities dominated by macroalgae that are habitat forming species that provide shelter, food and substrate for a broad range of organisms in turn sustaining high biodiversity and ecosystem services (Steneck et al., 2002; Worm et al., 2006). Some rocky shore subtidal areas, such as part of the Mediterranean, the NE Pacific or the coasts of Australia have been extensively studied for decades and a wealth of knowledge including ecological theories have developed from them (Dayton et al., 1984; Edgar and Stuart-Smith, 2009). Large-scale patterns have been described and changes in species distributions and community structure due to the rapidly changing climate have been detected and are being studied (e.g., Ling, 2008; Marzinelli et al., 2015). However, other parts of the world, with less resources, have received much less attention and what little is known generally derives from fragmented information of local scale studies.
The lack of basic biological knowledge may lead to well-intended but uninformed decisions by policymakers and the ensuing creation of marine protected areas that may not entirely serve the intended purpose (Carpenter et al., 2009; Leenhardt et al., 2015). There is, therefore, an urgent need to acquire data of under-sampled marine areas in order to collect baseline information that may allow the detection of changes in species composition due to environmental or anthropogenic stressors and to identify sites that are biodiversity hotspots. As part of the effort to monitor and understand changes in marine biodiversity as a consequence of anthropogenic stressors a range of biological and ecological Essential Ocean Variables (EOVs) and emerging EOVs have been proposed (Miloslavich et al., 2018). Monitoring of EOVs are intended to provide the scientific, governance and policy baselines against which anthropogenic driven effects may be measured and reported. This knowledge is needed for conservation and management of ecosystem functions and services of subtidal rocky reefs that are often overlooked. Long term monitoring programs, such as MBON (Marine Biodiversity Observation Network) Pole to Pole1 which monitor biodiversity on rocky shores from the American continent, could be a way of coordinating activities that may fill local knowledge gaps whilst simultaneously providing broader scale information on the effects of global change.
Rocky reefs are unique habitats because of the presence of outcrops, crevices, small caves and other microhabitats that provide refuge for organisms that are only found in these environments (Witman and Dayton, 2001; Stephens et al., 2006; Galván et al., 2009). As in most parts of the world, in Atlantic Patagonia there is more knowledge about intertidal than subtidal habitats. Patagonian rocky reefs include large areas that remain largely unexplored regarding subtidal benthic life. These gaps of knowledge impede the detection of changes in local and regional biodiversity if they were occurring (Fraschetti et al., 2008; Halpern et al., 2008; Claudet and Fraschetti, 2010; Duffy et al., 2013). For example, chronic impact of diving tourism has already been detected on these reefs (Bravo et al., 2015) while unregulated fisheries has led to local depletion of certain species (Venerus et al., 2014). Hence, targeting these habitats for subtidal monitoring programs is useful to detect changes that may occur in the future due to rising sea-water temperature, the increase and severity of extreme weather events as well as anthropogenic stressors that are on the rise (Harley et al., 2006; Hawkins et al., 2008; Wernberg et al., 2011; Cheung et al., 2012).
On land, ecologists have used emerging technologies such as remote sensing to establish ecological patterns which have been the baseline for comparison to determine the changes produced by changing climate or other stressors (Pan et al., 2013). However, marine ecologist attempting to describe patterns have consistently encountered time restriction problems which determines the number of samples (Bianchi et al., 2004; Murray et al., 2006). Subtidal sampling that involves SCUBA diving enhances this restriction and generally limits the extent of the studies. Developing technologies such as remotely operated underwater vehicles and autonomous underwater vehicles have been successfully used to describe large-scale patterns in subtidal habitats (Marzinelli et al., 2015). However, these technologies tend to be inaccessible for regions of the world with financial restrictions that are coincidentally poorly studied. Thus, emerging large-scale monitoring programs need to address these issues.
The effect of surface orientation on benthic communities has been observed in various parts of the world (for references see Miller and Etter, 2011) and studied using manipulative field experiments (e.g., Irving and Connell, 2002). Light intensity (Glasby, 1999; Miller and Etter, 2008), sedimentation (Irving and Connell, 2002), water flow (Leichter and Witman, 1997), predation pressure (Jones and Andrew, 1990; Andrew and Underwood, 1993), larvae settlement process (Saunders and Connell, 2001) and spatial refuge (Witman, 1985) are the main factors structuring the benthic assemblages on adjacent surfaces inclinations. Environmental variables that are correlated with depth also have an effect on benthic communities (Garrabou et al., 2002; Heyns et al., 2016). However, sampling protocols for monitoring benthic assemblages in subaquatic programs tend to focus mainly on horizontal benthic surfaces and ignore other microhabitats such as vertical surfaces, overhangs and cavefloors (but see Jørgensen and Gulliksen, 2001; Virgilio et al., 2006; Cárdenas and Montiel, 2015).
In this study, benthic rocky reef images from four contrasting surface orientations (horizontal, vertical, overhang, and cavefloor) at three different depth ranges were collected by SCUBA diving using georeferenced benthic digital images. Our goals were to: (a) determine and describe the species contribution to local assemblages of each surface orientation, (b) describe and compare species richness of each surface orientation among depths using the proposed method and (c) based on (a) and (b) propose a simple and comprehensive sampling protocol for large scale, long-term monitoring programs.
Materials and Methods
Study Site
Seven rocky reefs grouped in an area of almost 11 km2 were sampled off the coast of Punta Pardelas Bay (42° 37.737′S, 64° 15.739′W) inside Nuevo Gulf (Figure 1A) during March 2019. The region is considered as an ecotone of two marine biogeographic provinces (Argentinian and Magellanic), with both warm temperate and cold temperate species represented (Balech and Ehrlich, 2008). The tide regime is semidiurnal with a mean amplitude of 3.8 m and spring tides of up to 5.73 m. Hence, rocky reefs were sampled at three different depth ranges 1–7 m: “shallow rocky reefs” (n = 2 reefs), 8–15 m: “mid depth rocky reefs” (n = 3 reefs) and 16–25 m: “deep rocky reefs” (n = 2 reefs) during the same week. Sedimentation traps (aspect ratio > 3 as recommended by Hakanson et al., 1989), light loggers (Hobo MX2202), alabaster blocks (Jokiel and Morrissey, 1993) and temperature loggers (iButton type z) were deployed at each depth range during the time of the study to characterize the differences among depths (Table 1). Protocol is available on protocols.io2. All rocky reefs were >80 m length and separated by at least 100 m (Figure 1A).
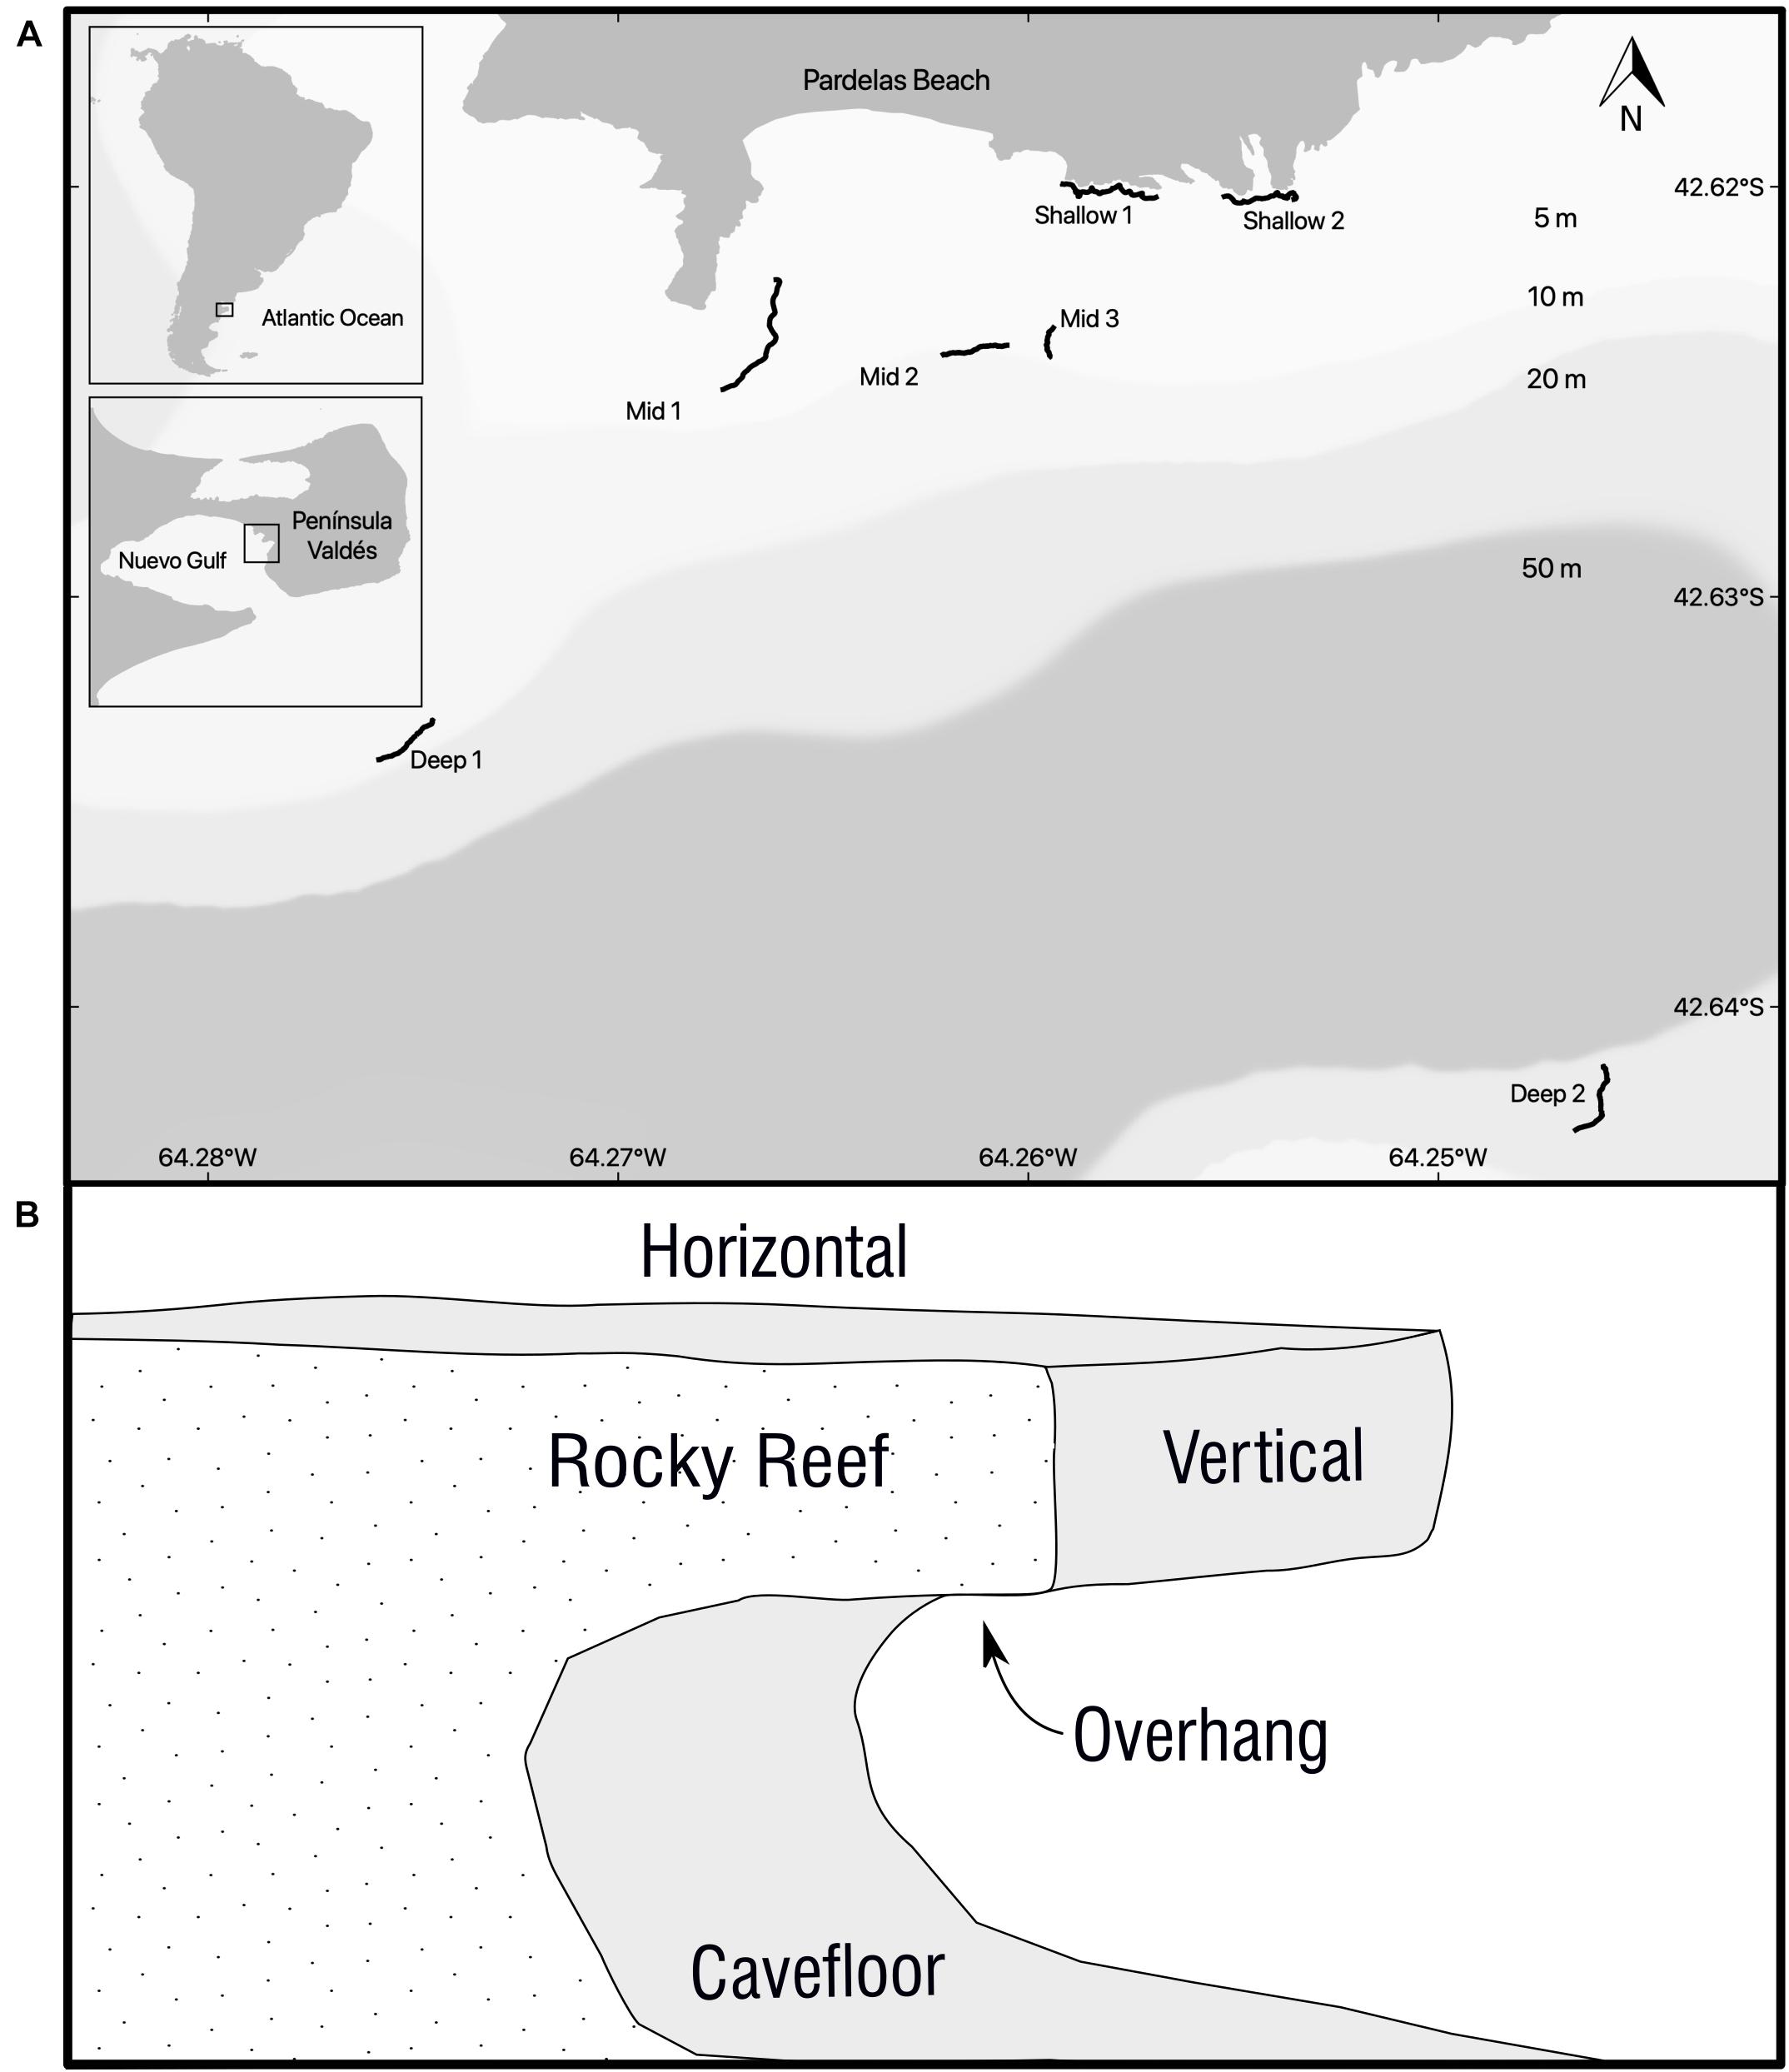
Figure 1. (A) Study site, location and extension of all the rocky reefs sampled. Black lines are the GPS track of the rocky reefs ledges. (B) Diagram of a transversal view of a typical Patagonian rocky reefs where surface orientations (horizontal, vertical, overhang, and cavefloor) are represented.
Selection of Methods
Ledge borders were followed as underwater transects in all rocky reefs (Figure 1B). Photoquadrats (25 × 25 cm) spaced at 2–5 m intervals were taken by scuba diving. Preliminary test showed that a focal length of 50 cm, which in turn determined quadrat size, was the best to reduce the negative influence of water turbidity on the resolution of the image. The presence of cavities of 1.5–3 m high below the rocky ledges provided enough space to sample 4 different surface orientations, Figure 1B. On a preliminary study we determined that 80 photoquadrats (20 per surface orientation) represented 70% of the total richness. This replication could be obtained along transects of more than 100 m on 30′ dives at the deepest rocky reef. Voucher samples were collected to confirm photo identifications when necessary. Divers were equipped with a Canon 100D camera and two Ikelite DS-161 strobes mounted on a stainless-steel structure with a 0.0625 m2 quadrat (0.25 × 0.25 m). The camera had a 18–55 mm Canon lens and all the images were taken with the 18 mm setting, auto focus, ISO 400, Exposure 1/200 s at f/11 and flashes set on automatic TTL. A dive computer (Oceanic Geo2) was mounted on one side of the quadrat to register depth and temperature of each photoquadrat. Divers carried a monofilament line that towed a surface buoy with a GPS loading a waypoint every 3 seconds. Camera and GPS clocks were synchronized before each dive in order to georeference photographs by matching time.
Image Analyses
Images were prepared for analysis using photo processing software (Adobe Lightroom Classic version: 9.1). All the images passed through the same workflow: (1) Georeferencing with the.gpx file; (2) registering depth, site and orientation data on photo’s metadata; (3) white balance; (4) crop the area of interest (i.e., quadrat); and (5) lens distortion correction. Blurry or out of focus images were discarded.
All photos were uploaded to a public CoralNet source3, an open source and free software for benthic image analysis (Beijbom et al., 2015). Percentage cover of algae, sessile invertebrates and bare substrate was estimated by using a 100 point grid with 2.5 cm separation among points. When large mobile fauna covered points of the grid, those points where not considered for the cover estimation in each photo. On the same image the presence of mobile fauna larger than 2 cm was recorded for the creation of a presence-absence matrix. Species which were difficult to identify to low taxonomic levels by photo were grouped into a category or taxonomic group.
Data Analyses
The dataset that resulted from photoquadrats analyses was divided into two matrices. A percentage cover matrix and presence-absence matrix. The latter uses species identities and was created by the combination of sessile and mobile taxa recorded in each photo.
Multivariate comparison of percentage cover of epibenthic community structure across reef surface orientations at each depth were visually inspected using non-metric Multi Dimensional Scaling (nMDS) ordinations and differences were evaluated using Permutational Analysis of Variance (PERMANOVA, n = 999, Bray- Curtis dissimilarity, log(x + 1) transformed data) followed by multiple comparisons using the function “pairwise.adonis” (Martinez Arbizu, 2017). Prior to PERMANOVA, multivariate dispersion homogeneity was tested using the “betadisper” function of the R package “vegan” (Oksanen et al., 2019). When PERMANOVA and “betadisper” are significant, differences may be due to factors (i.e., surface orientations), dispersion effects or both.
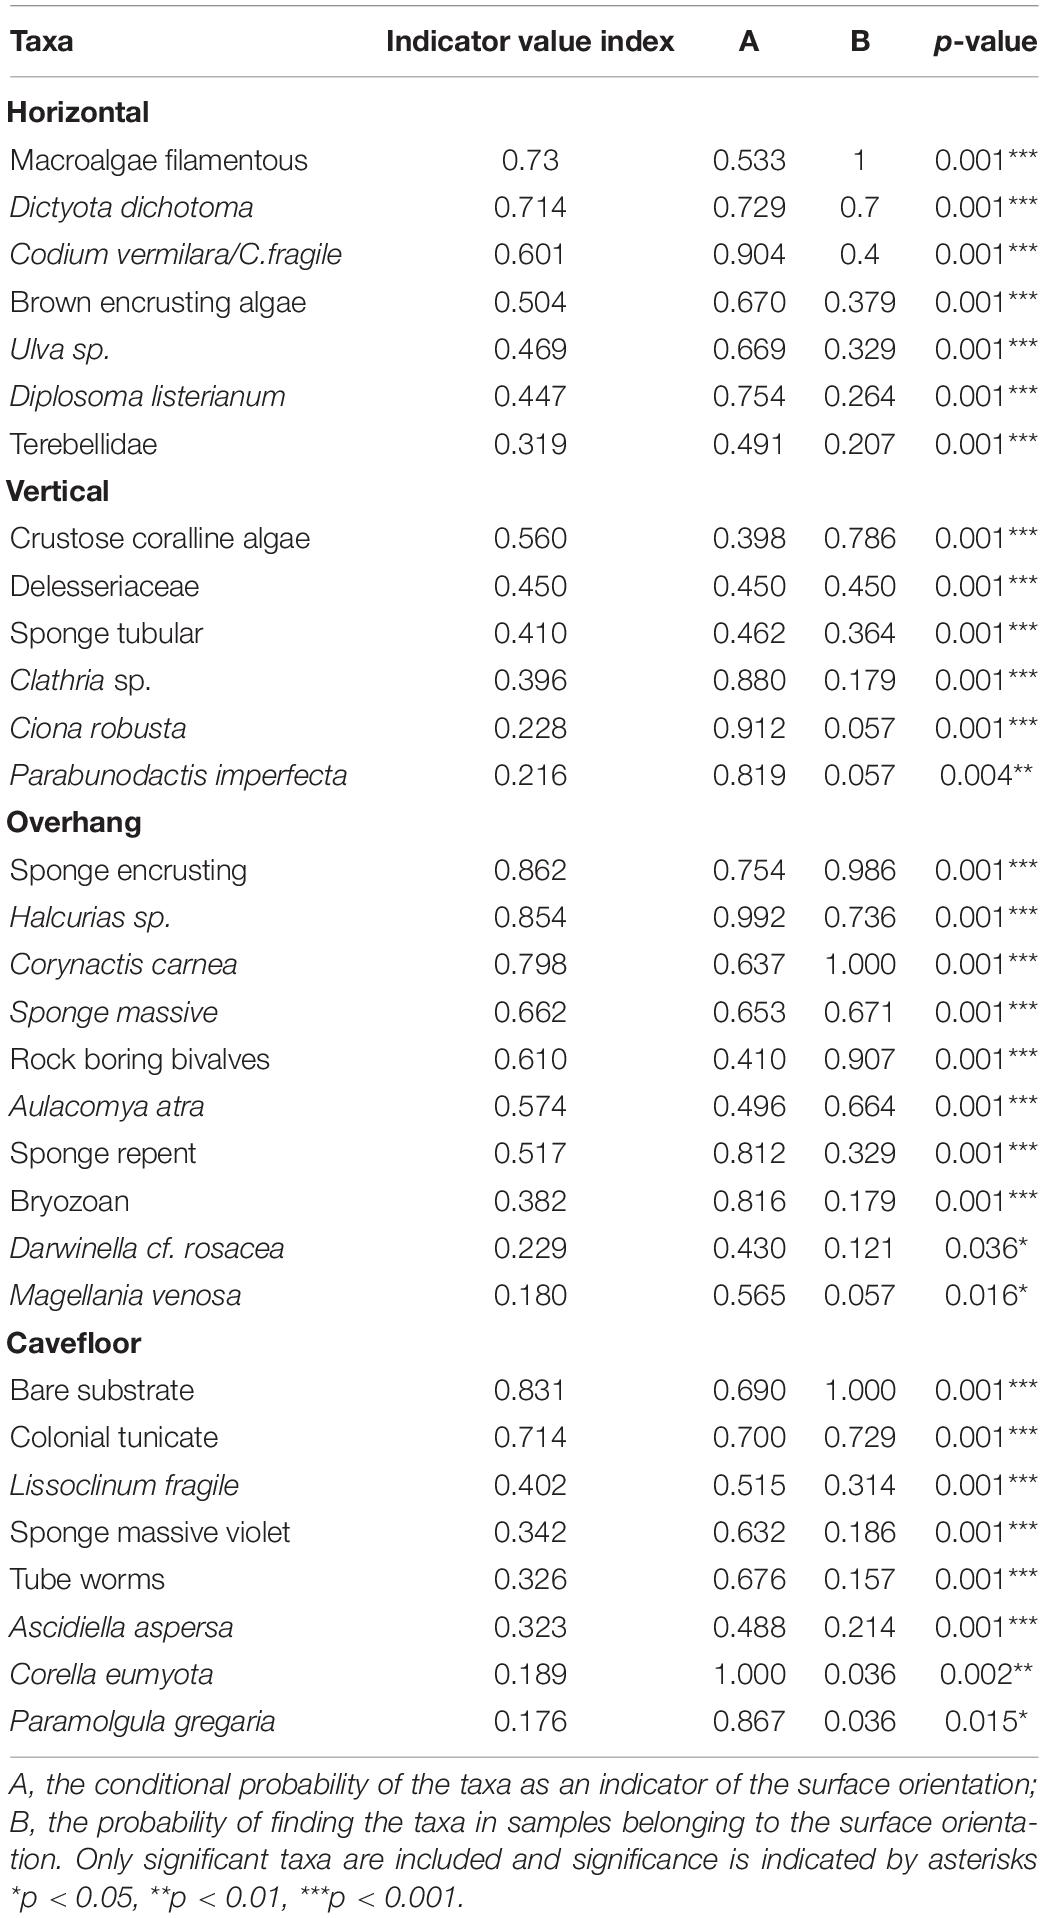
An Indicator Species Analysis (IndVal; Dufrêne and Legendre, 1997) was used to detect which taxa were indicative of each surface orientation. The “multipatt” function of the R package “Indispecies” using data from all depths (pooled). This function looks for indicator species based on the Indicator Value method as explained in De Cáceres et al. (2010), reflecting both the conditional probability of the taxa as an indicator of a particular surface orientation (A) and the probability of finding the taxa in samples from this surface orientation (B). High values in the component A indicate specificity or positive predictive value of the taxon as indicator of that surface orientation. High values of the component B indicate that the taxon occurs consistently in most photoquadrats within that surface orientation.
We analyzed the average number of species and cumulative richness of epibenthic assemblage from each surface orientation and depth using the R package “rich” (Rossi, 2011) with the presence-absence matrix as input. This package offers two functions “c2cv” and “c2m,” which allows the comparison of cumulative and average species richness, respectively, over two set of samples using randomization tests (Rossi, 2011). In contrast to standard parametric tests, randomization tests do not require distributional assumptions (Manly, 1991). Shared species between different surface orientations and depths were computed by the function “shared” of the same R package. Chao 2 estimation for the whole set of photoquadrats was calculated using the function “specpool” of the “Vegan” package (Oksanen et al., 2019). All plots and statistical analyses were carried out using R software V 3.6.2 (R Development Core Team, 2018).
Results
A total of 70 taxa were identified from 560 georreferenced photoquadrats covering more than 1,500 m of rocky reef ledge (Supplementary Table 1). The more diverse groups registered by photoquadrats were Mollusca, macroalgae, Ascidiacea, Porifera, Equinodermata, and Cnidaria. A lower diversity was found for Arthropoda, Annelida, Hydrozoa, Bryozoa, Brachiopoda, and Platyhelminthes. Some cryptic fishes were also recorded in the photoquadrats. The expected number of species estimated by Chao2 (71.99) for this study suggests that the majority of species were recorded (97%).
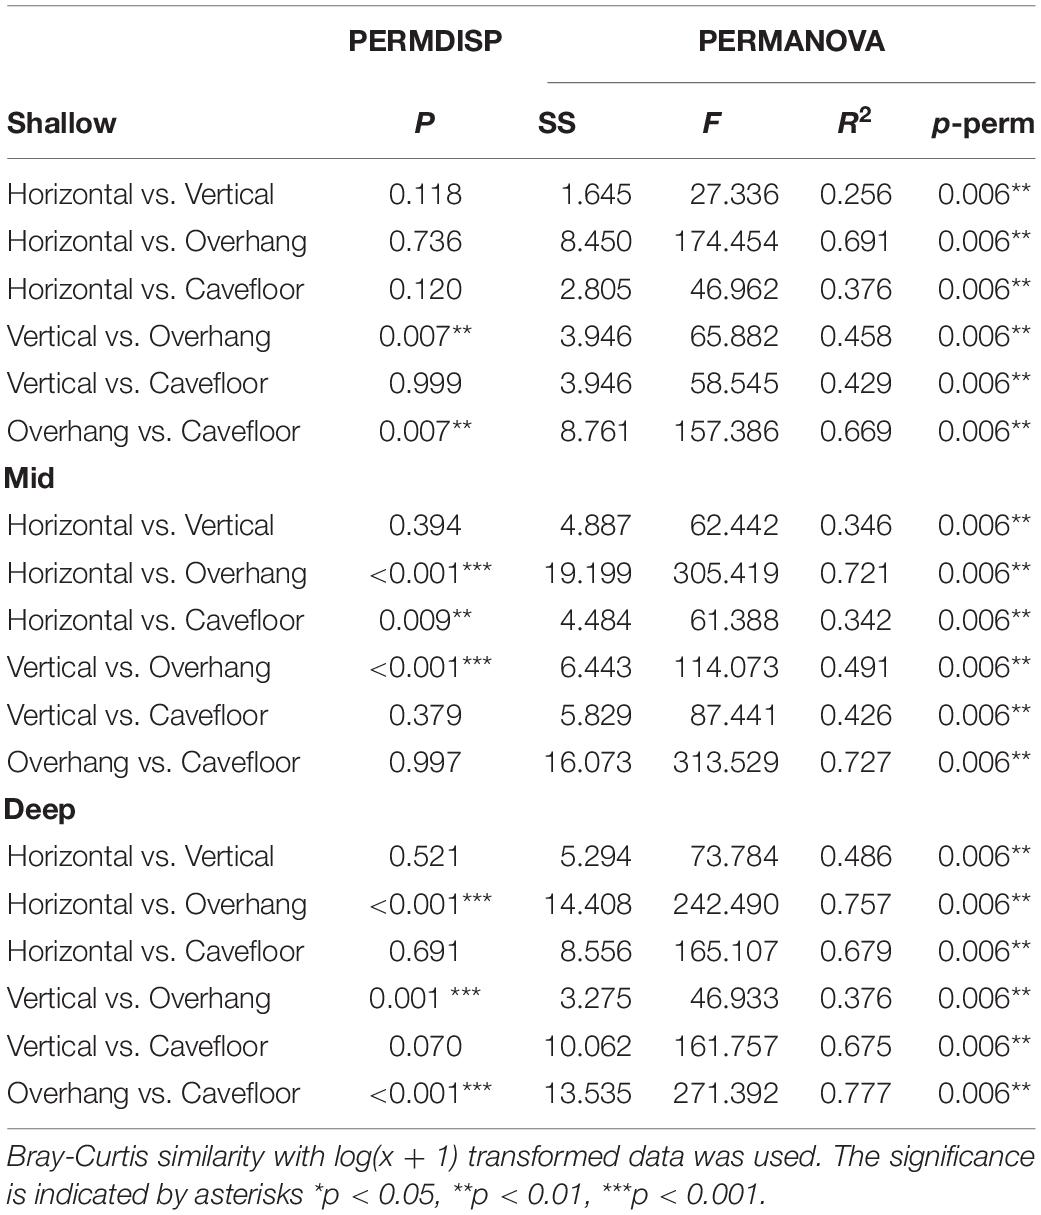
The nMDS ordination (Figure 2) showed that each surface orientation had a distinct assemblage. The separation among epibenthic assemblages, in each surface orientation, increased with depth. Shallow assemblages show a small overlap of samples, particularly between vertical, horizontal and cavefloor surfaces (Figure 2A). This overlap is less pronounced and absent in mid depth and deep assemblages, respectively (Figures 2B,C). Pairwise comparisons (Table 2) indicated that all surface orientations had distinct epibenthic assemblages within each depth. However, only two surfaces combinations, horizontal/vertical and vertical/cavefloor, presented multivariate dispersion homogeneity throughout all depth ranges suggesting that differences were effectively due to factor and not dispersion.
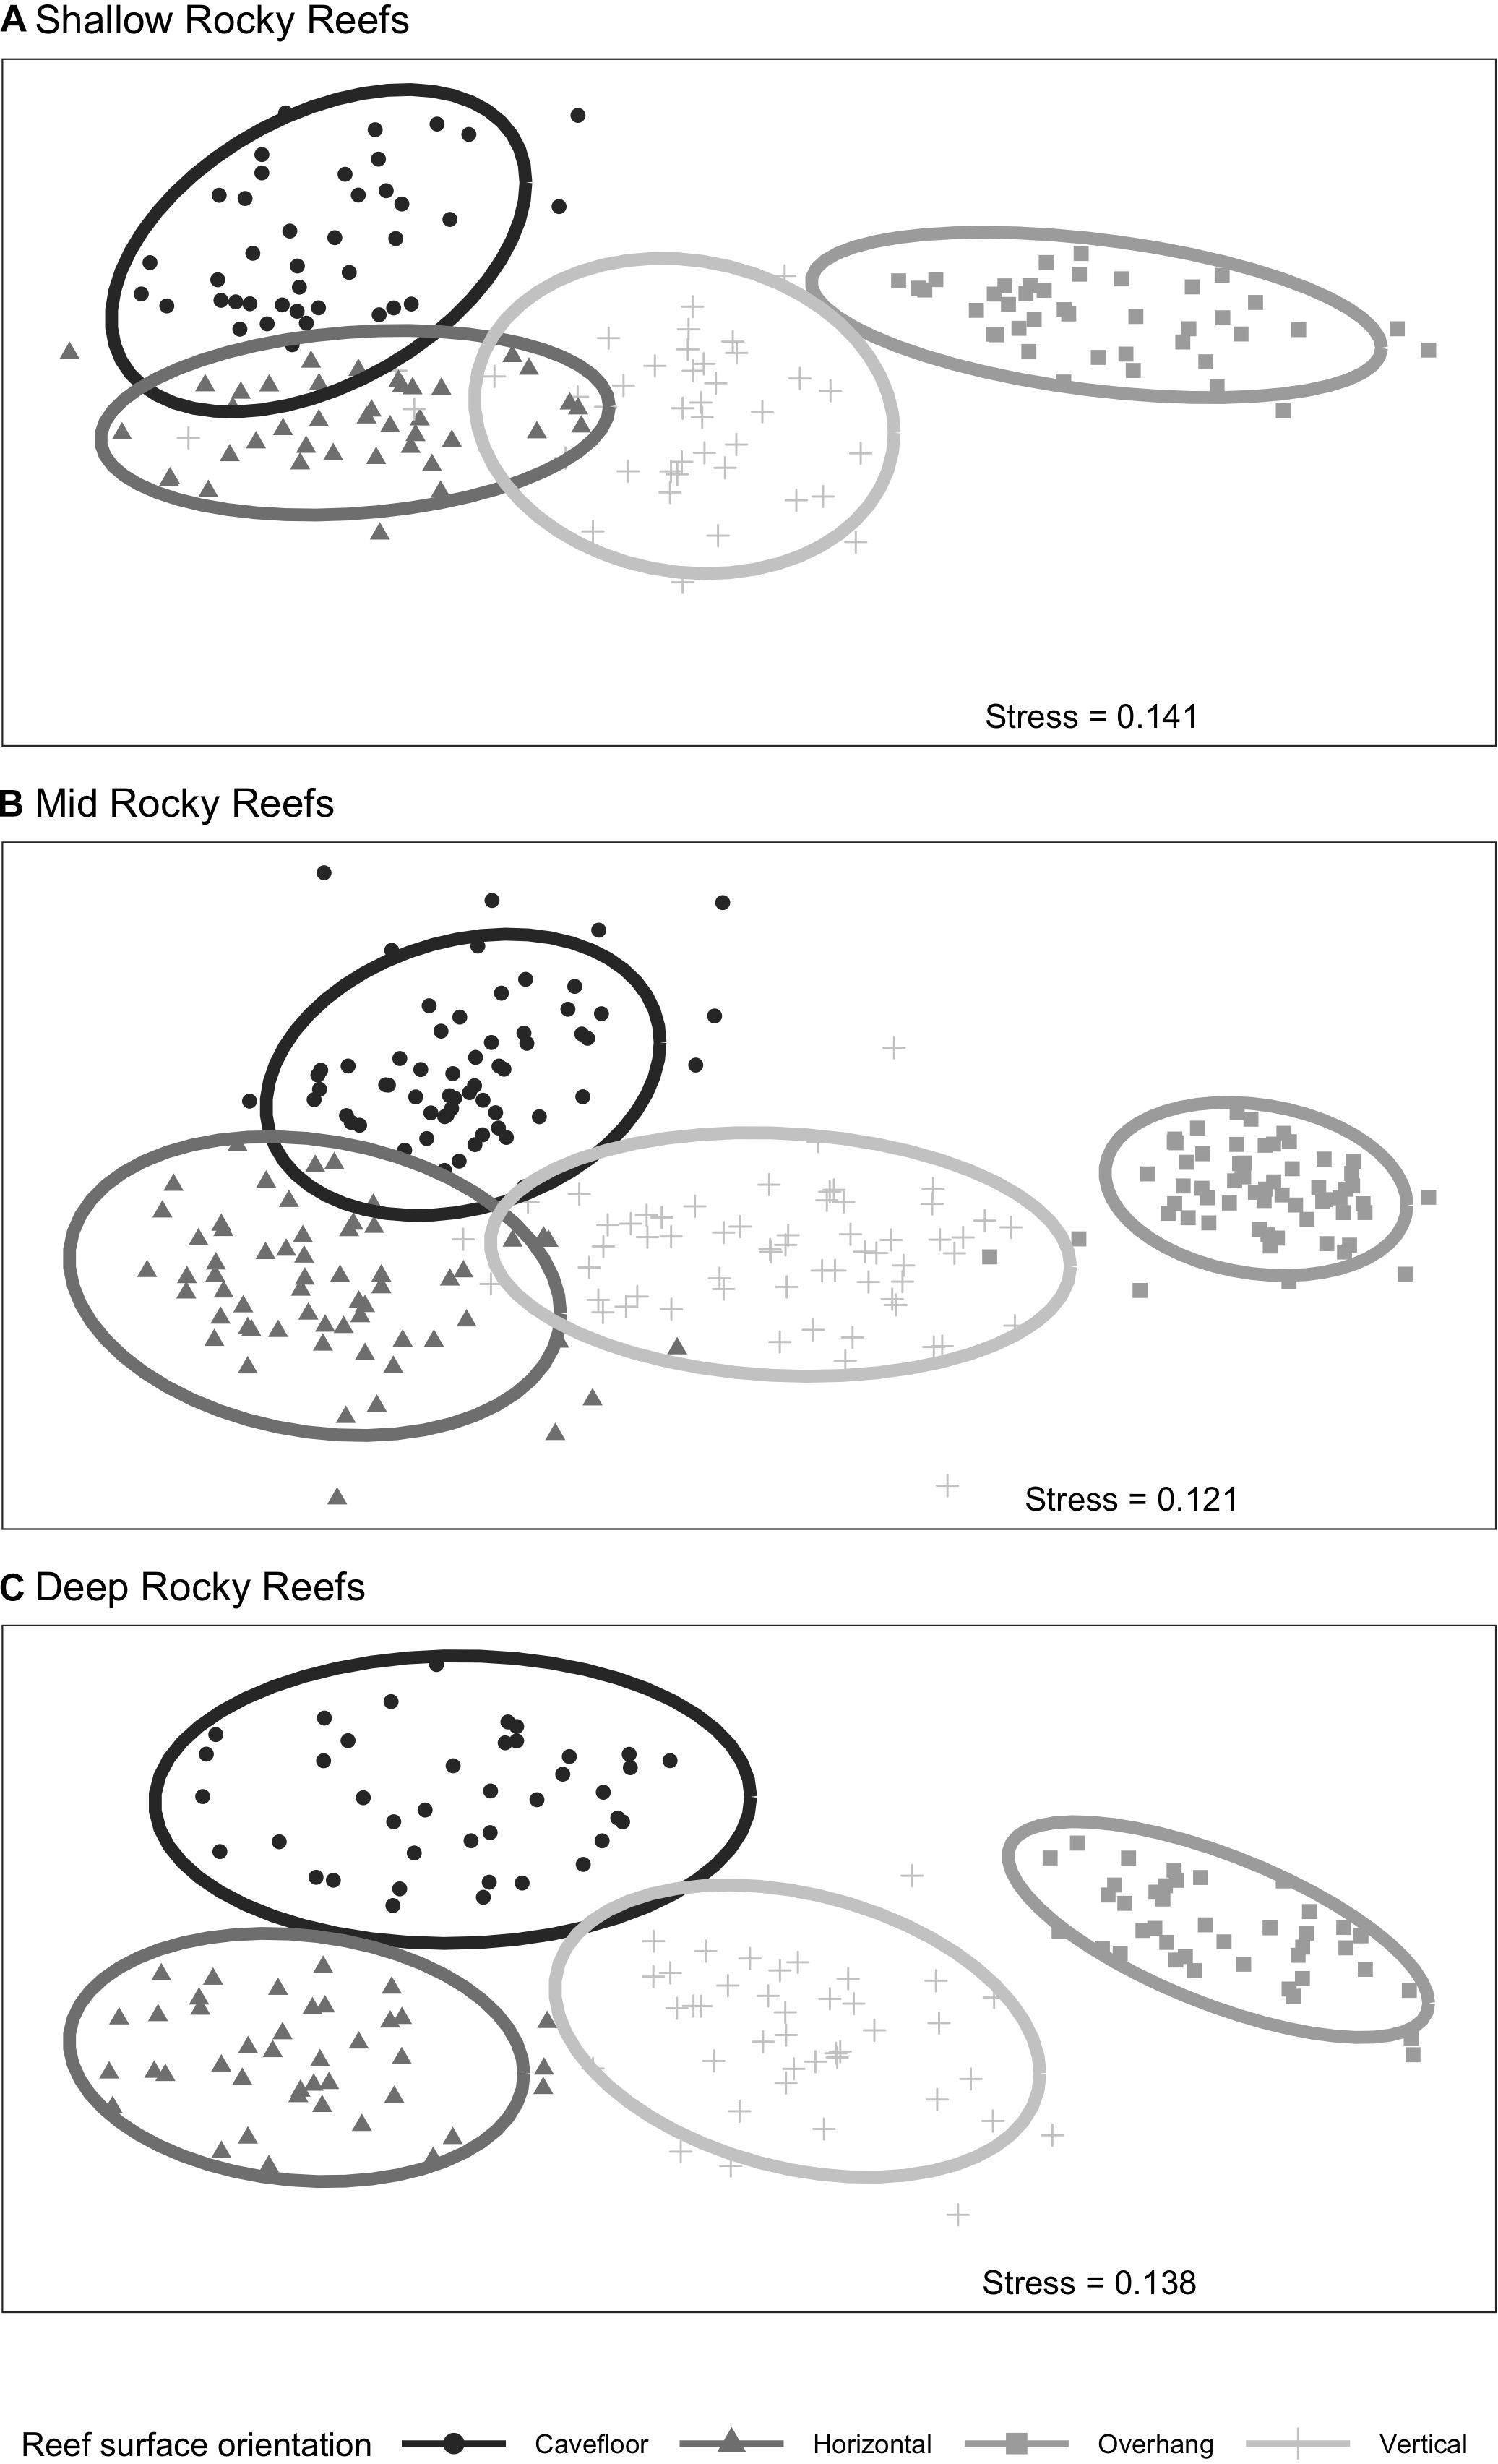
Figure 2. nMDS ordination plots of rocky reef surface orientation of epibenthic assemblage by depth (A) shallow, (B) mid, and (C) deep reefs. Ellipses represent 95% confidence interval. Based on Bray-Curtis distance metric and with log (x+1) transformed data.
Macroalgae covered on average 71% of horizontal surfaces, 40% of vertical surfaces, 20% of cavefloor surfaces and less than 1% of overhang surfaces. The most prevalent algal group on horizontal surfaces were filamentous algae (47%) composed primarily by Anotrichium furcellatum and Ceramiun sp., which were identified by extractive vouchers. Dyctyota dichotoma was the second most prevalent alga (10%) followed by crustose coralline algae (4%). On the vertical surfaces average algal cover was ∼40% followed by the anemone Corynactis carnea (32%), filter feeders such as the bivalve Aulacomya atra (4%) and sponges (4%). On the overhang surfaces suspension feeder cnidarians with 70% (Corynactis carnea. 62%, Halcurias sp. 7%, and Anthothoe chilensis 1%) and filter feeders with 24% (sponges 14%, Aulacomya atra 5%, rock boring bivalves 4%, and tunicates 1%) were the dominant groups. The highest percentage of bare substrate was found on cavefloor surfaces (65%) where a significant percentage of colonial tunicates was observed (5%). A decrease in macroalgal cover was recorded with higher depths for all orientations, while filter feeders became more abundant (Figure 3). On overhang surfaces percentage cover of filter feeders (Porifera, tunicates, and bivalves) decreased with depth while suspension feeders increased.
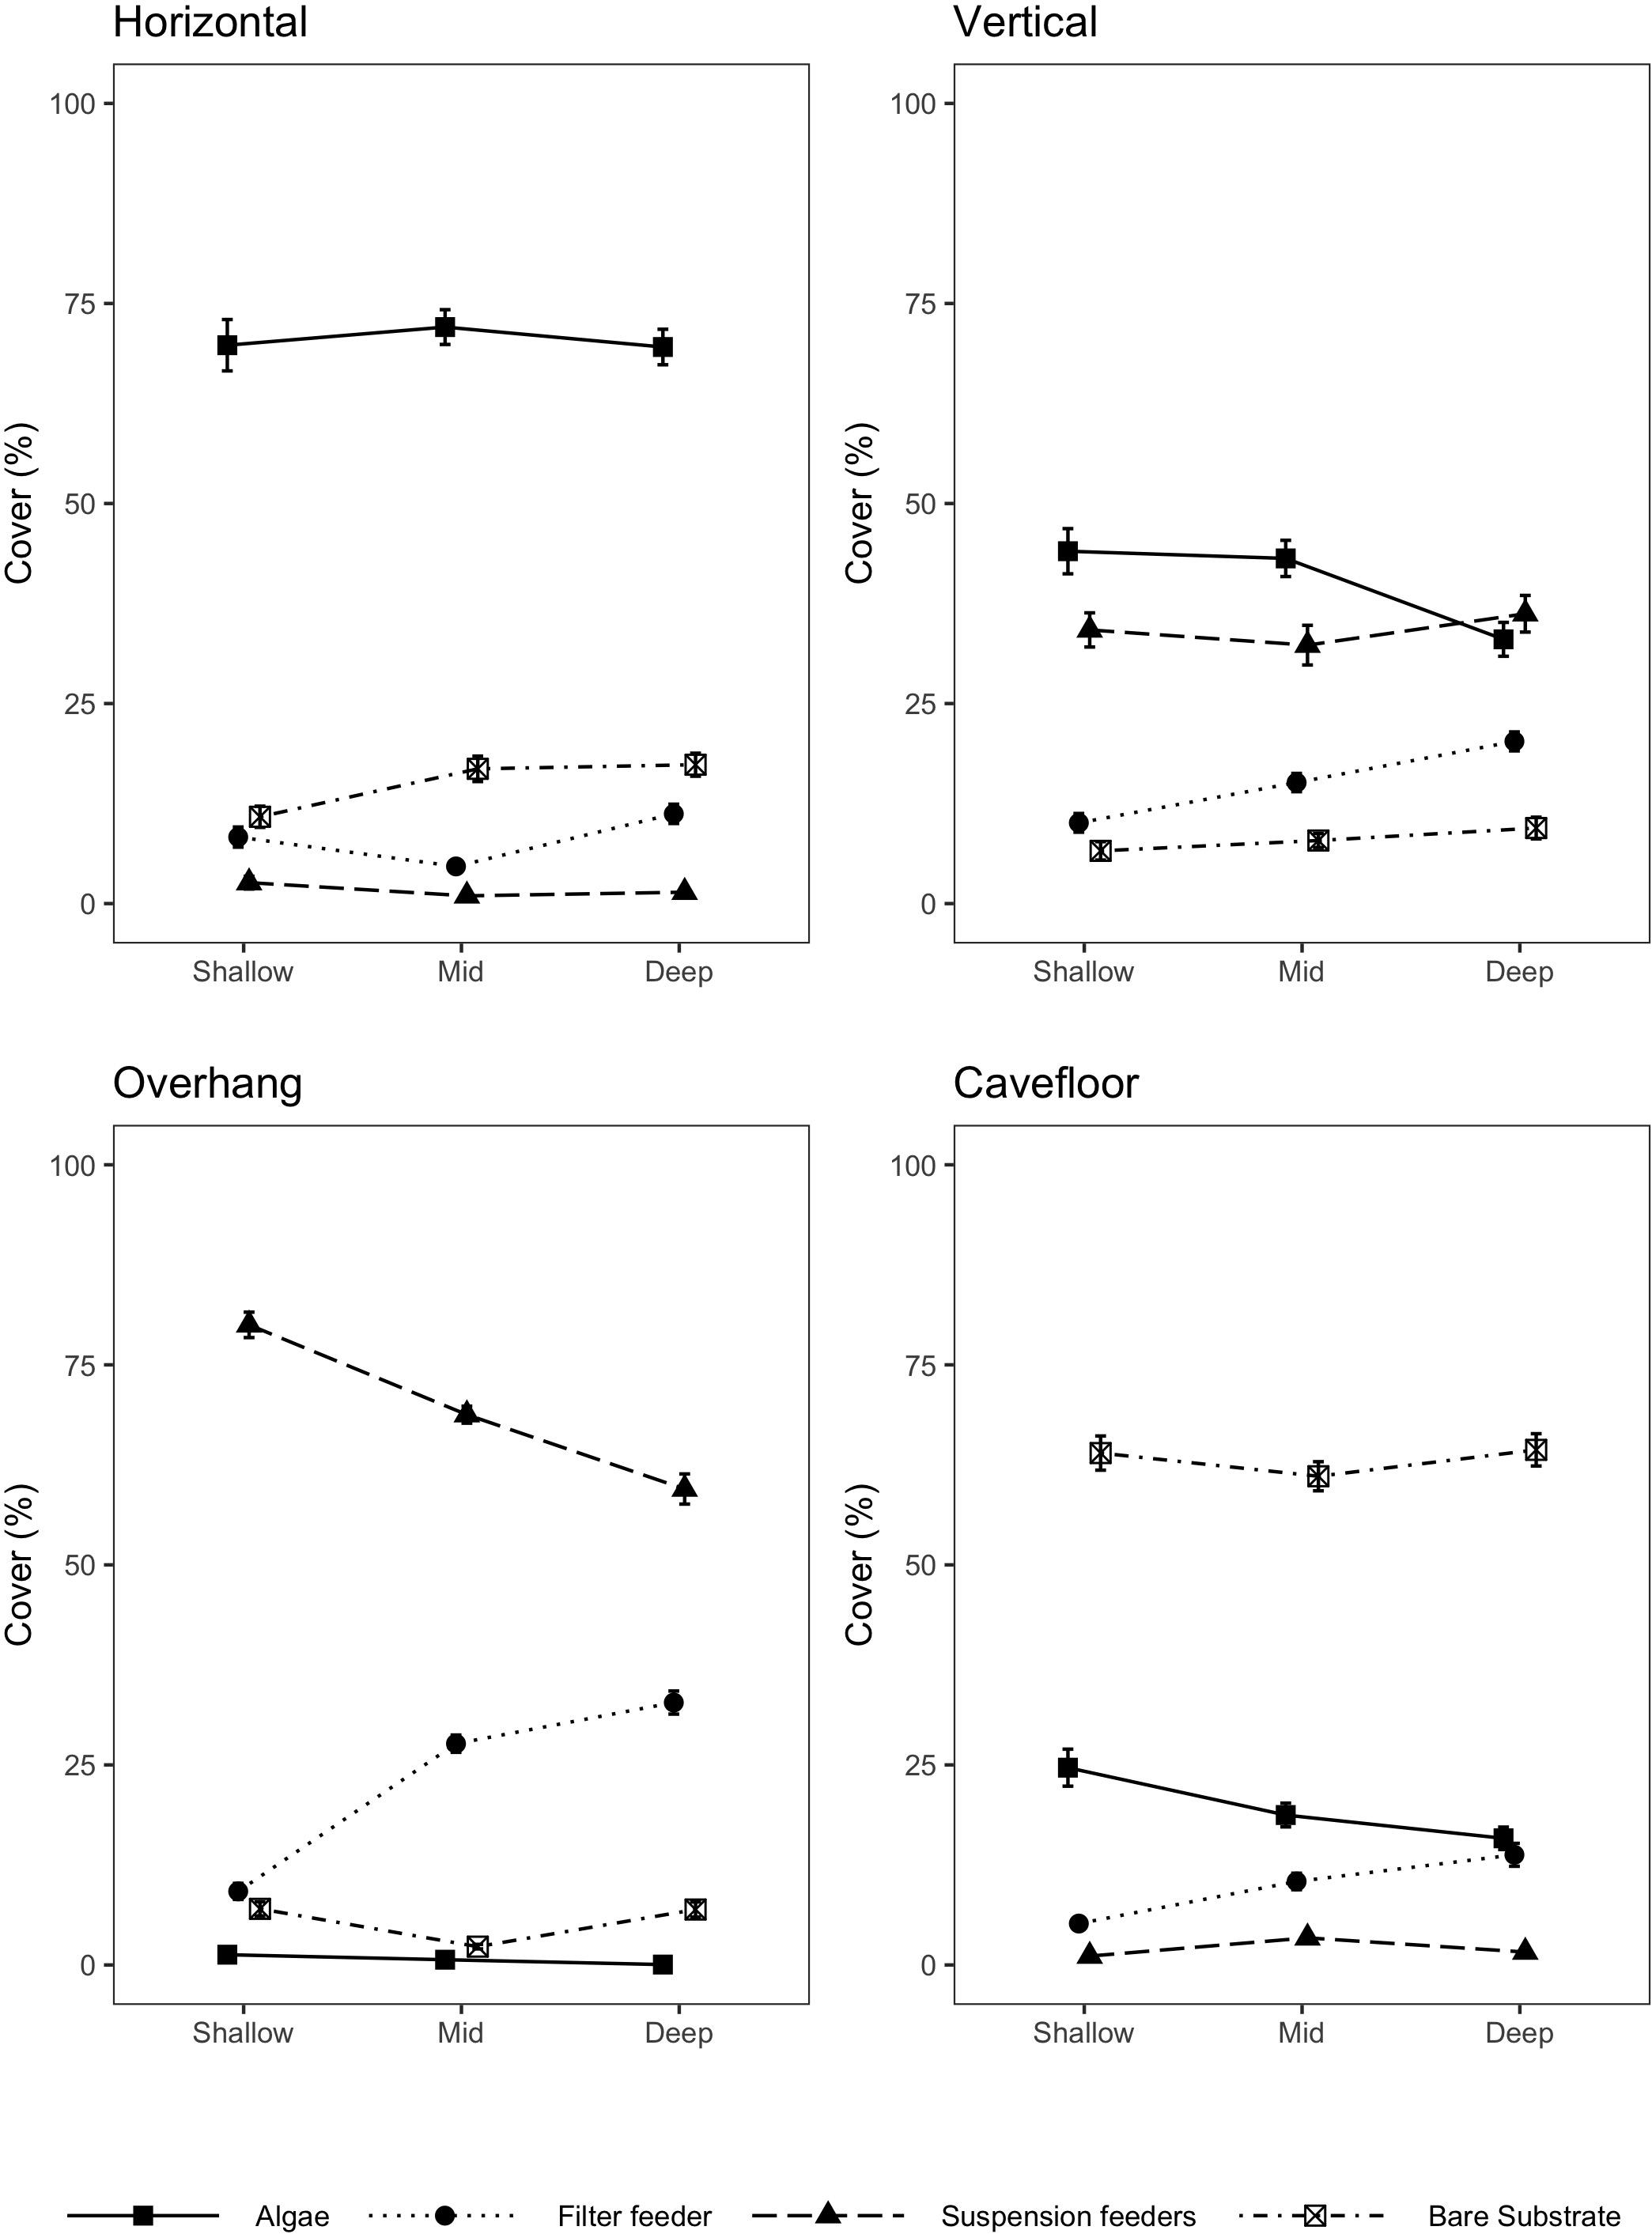
Figure 3. Percentage cover ± SE, of algae, bare substrate, filter feeders and suspension feeders on each orientation surface for shallow (n = 40), mid (n = 60), and deep reefs (n = 40).
A total of 31 sessile indicator taxa were identified, varying for overhang (10), cavefloor (8), horizontal (7), and vertical (6) surfaces (Table 3). The indicative taxa for overhang surfaces were 4 sponges, 2 anemones, 2 bivalves, 1 Brachiopoda (Magellania venosa), and 1 bryozoan. The indicative taxa in the cavefloor surfaces were mostly tunicates along with bare substrate, a sponge and tube worms. Macroalgae taxa were indicative from horizontal surfaces together with the tunicate Diplosoma listerianum and polychaeta Terebelidae. The vertical surfaces presented the lowest number of indicator taxa (2 algae, 2 sponges, 1 solitary tunicate, and 1 anemone) and all indicator indexes were below 0.56.
Average species richness of epibenthic communities increased with depth (Figure 4) and all depth ranges were significantly different from each other (Table 4). We found no differences in cumulative richness between deep (58) and mid (61) depth rocky reefs, but both were statistically different to shallow reefs (48) (Table 4). The sum of species observed between mid and deep reefs (67) represented 96% of the total number of species registered in this study and the mid depth shared the most species with the other two depths (Figure 5). Analysis of assemblages of a single surface orientation at different depths through a one-way PERMANOVA showed that each depth had a different assemblage for all surface orientations (Supplementary Table 2).
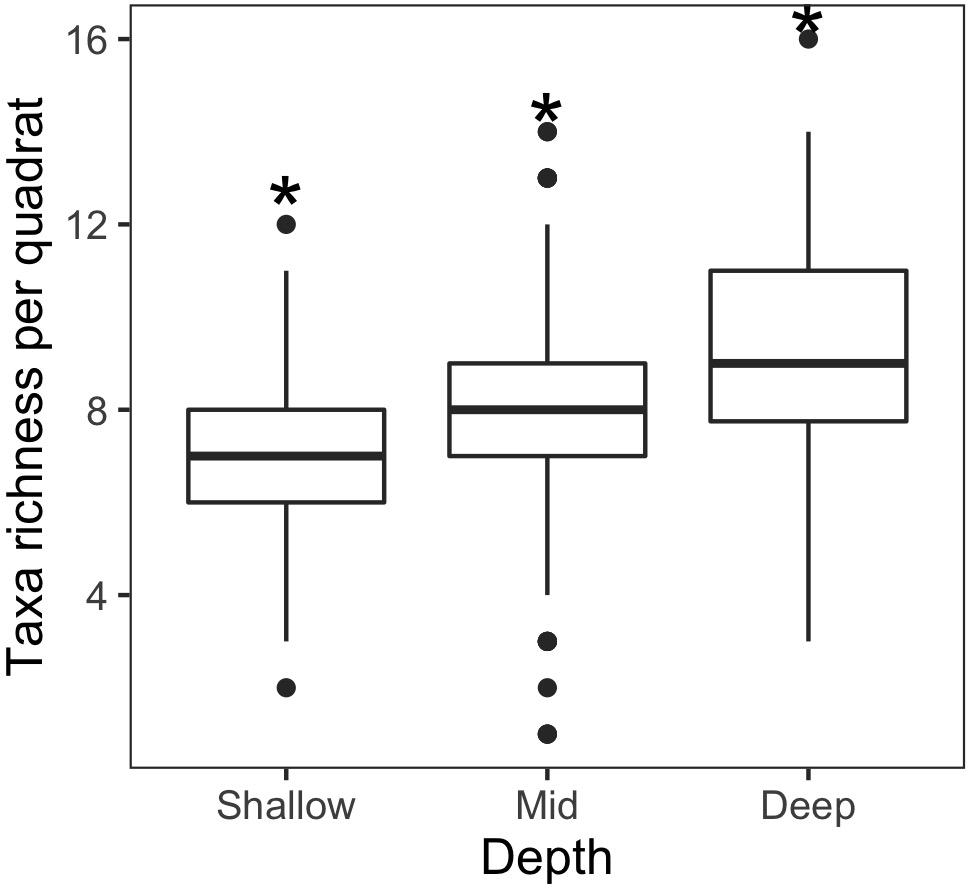
Figure 4. Boxplot of species richness among shallow, mid, and deep reefs. The * indicates p < 0.001 obtained by randomization test.
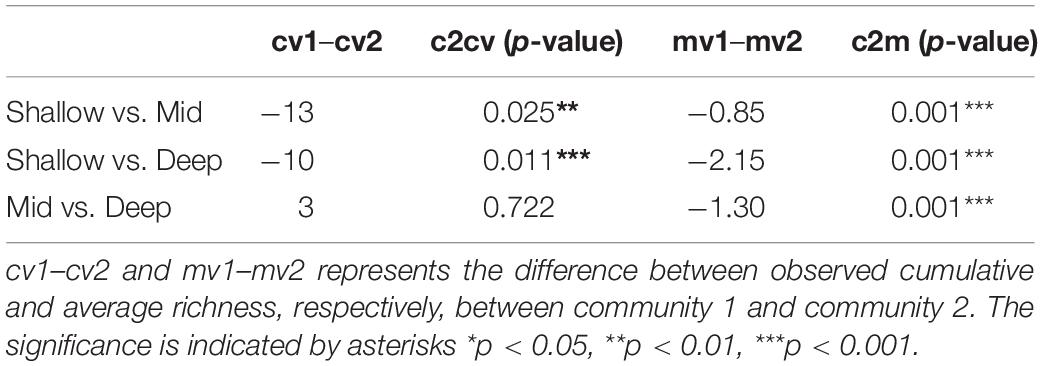
Table 4. Results of comparison of cumulative species richness (c2cv) and mean species richness (c2m) by depth levels with randomization procedure.
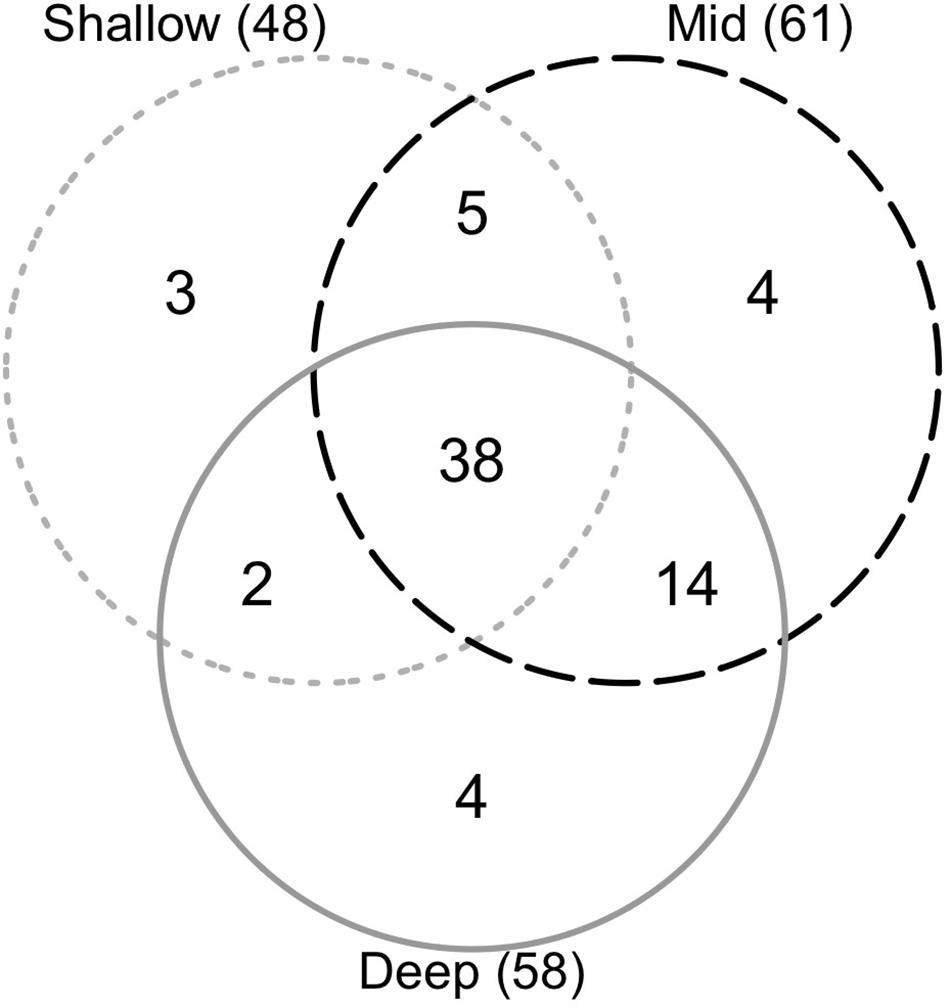
Figure 5. Venn diagram showing unique and shared species in shallow, mid and deep rocky reefs. Numbers inside parentheses are total number of species found at each depth.
Vertical surfaces presented the highest species richness, ranging from 4 to 16 species by photoquadrat with a cumulative richness of 54, representing 77.14% of the total richness (Table 5). Average richness for this surface (9.06 ± 0.19 SE) was significantly higher than the other surfaces (p < 0.001) (Figure 6). Horizontal surfaces with 1–14 species by sample (mean 7.8 ± 0.19 SE) and 48 species in total had the second highest species richness. Among all the invertebrates species found using this protocol, four were recorded in a single photoquadrat. From these species, one was observed on the horizontal, one on the vertical, two on the overhang and three on the cavefloor surfaces exclusively, the other four were observed on at least two surfaces.
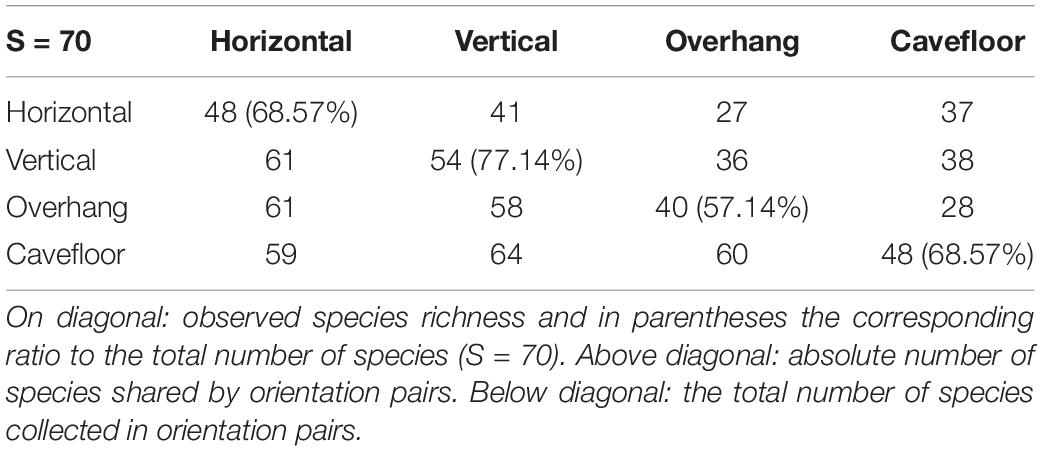
Table 5. Species richness and shared species of benthic assemblage over rocky reefs surface orientations.
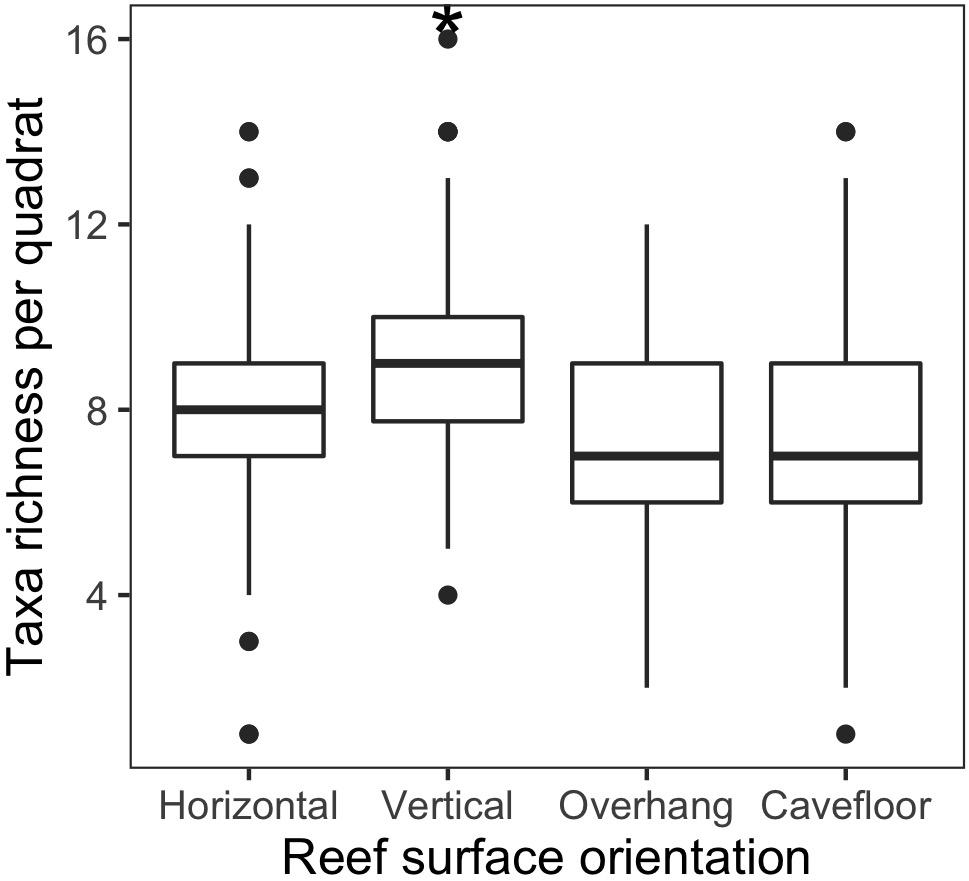
Figure 6. Boxplot of species richness among rocky reef surfaces orientations (Horizontal, vertical, overhang, and cavefloor). The * indicates p < 0.001 obtained by randomization test.
Discussion
This paper highlights the importance of sampling different surface orientations in subtidal monitoring programs as distinct epibenthic assemblages were associated to each orientation of the rocky reefs. In contrast with other similar approaches, the protocol proposed in this study simultaneously detected differences among rocky reef surface orientations and depths, whilst capturing 90% of the estimated species richness in a non-destructive manner. By sampling all available surfaces a more precise estimation of the local biodiversity can be achieve to detect temporal changes while monitoring rocky benthic assemblages. The georeferencing of photoquadrats used in our work provides the possibility of returning to specific places of the reef where an interesting feature was detected. Through this protocol that considers surface orientations, this study reports uncited species for the area such as Halcurias sp., Darwinella cf. rosacea, and calcareous sponges.
Our results indicate that all surfaces orientations must be contemplated in order to obtain high quality estimations of epibenthic biodiversity of coastal rocky reefs. Sampling all surface orientations increases the number of rare species that are normally difficult to detect. This also reduces the risk of not detecting species that may be limited to a specific microhabitat consequently giving more accuracy to richness estimations. When diving time restrictions impede sampling all surfaces, horizontal and vertical orientations combined were the most efficient and comprehensive approach to capture species richness. This has also been suggested for algae and invertebrates of Mediterranean rocky shores where both vertical and horizontal surfaces better represented the spatial variability (Benedetti-Cecchi, 2001). Our study also identified strong associations between specific taxa and surface orientations which should be considered in studies aimed at describing those taxa. For example, overhang surfaces in our study showed a unique assemblage and the highest number of indicative sessile species. A great diversity of sponges was found in the overhang surface as has been previously observed in rocky reefs from other parts of the world (Preciado and Maldonado, 2005; Maldonado et al., 2016). Invertebrate assemblages were found to be richest on vertical surfaces which coincides with Witman et al. (2004) who on a global description of epibenthic species richness used rocky walls instead of horizontal surfaces. They found invertebrate richness ranged from 50 to 130 for rocky walls in Chile, South Africa and New Zealand that are similar to our results (Witman et al., 2004). Finally, three species of nudibranchs and one species of platyhelminth were exclusively found on cavefloor surfaces. This surface orientation presented an important cover of sponges and colonial tunicates which likely explain the presence of the nudibranchs and flat worm. Sea slugs for example, live in close association with their diets (Scoresby and Graham, 2013) and most of the species are carnivores that prey on sponges, tunicates, hydroids and bryozoans (Rudman and Bergquist, 2007).
Shade and low sedimentation surfaces support a larger number of sessile invertebrates (Irving and Connell, 2002) and benthic assemblage structure can vary along gradients of sedimentation (Naranjo et al., 1996). Therefore, the lower sedimentation rates and light intensity found on deeper reefs may explain the observed differences on the horizontal and cavefloor surfaces at varying depths. Sessile invertebrates were more abundant in vertical and overhang surfaces as reported in other studies in Patagonian Magellan Strait (Cárdenas and Montiel, 2015). These results are consistent with studies from other latitudes that observed distinctions between horizontal and vertical rocky surface communities (Sebens, 1986; Baynes, 1999; Miller and Etter, 2011), between vertical and overhang surfaces (Virgilio et al., 2006; Cárdenas et al., 2012; Cárdenas and Montiel, 2015) and also between horizontal, vertical and overhang surfaces (Jørgensen and Gulliksen, 2001). The macroalgal richness in this study was well represented on horizontal surfaces orientations (10 of 11 recorded taxa) suggesting that this orientation should be sampled if the diving time is scarce and algae are of main interest. Our methodology is adequate for estimations of algal cover by functional groups, but if more detailed taxonomic resolution is required, voucher samples should be collected, since filamentous and crustose algal groups contain several species otherwise unidentifiable.
Our sampling found almost the same number of species on mid and deep rocky reefs, but the average number of species registered by individual photoquadrats was significantly higher on deep reefs. Similar results were found in several Antarctic rocky reefs, where species and phylum richness increased with depth in similar depth ranges (Barnes, 1995; Gambi et al., 2000; Nonato et al., 2000; Smale, 2007). This may be the consequence of a decrease in algal cover that in turn releases more settlement surfaces for sessile invertebrates which were more diverse per unit area than algae, a pattern that was also observed on Mediterranean rocky bottoms (Garrabou et al., 2002). As diving logistics and security protocols become stricter for diving at 30 m depth for >30′, we propose that rocky reef sampling for large-scale monitoring programs should be done at depths around 8–15 m where species richness is comparable to deeper reefs but diving limitations and risks are fewer. Hence, large-scale biodiversity monitoring programs should consider these findings and include this perspective when designing subtidal sampling protocols in rocky reefs.
The choice of the sampling unit should consider the size of the sampled organism and the aggregation among them (Underwood and Chapman, 2013). However, water visibility must also be considered when using photoquadrats. Using 25 × 25 cm quadrats ensures good quality photos even with low visibility (e.g., up to 1 m). In the cases where macroalgae species are bigger than the size of the quadrat a solution could be taking 4 photos with 25 × 25 cm quadrats together and then pool the photos for analysis (see Parravicini et al., 2009). The Reef Life Survey (RLS) created a sampling protocol and collected data using an international group of trained divers (Edgar and Stuart-Smith, 2014). Even though the RLS has similar features to our protocol such as n = 20 photoquadrats of ∼30 × 30 cm or smaller, there is no special consideration on the use of quadrats in overhang or cavefloor surfaces, losing detail in the species composition of the rocky reef. Furthermore, there is no precise georeferencing in the RLS protocol. Using the protocol presented here where all the surface orientations are considered for the first time in the region, we could detect more than 90% of species estimated for the zone and more species than those recorded previously through extractive methods (Olivier et al., 1966; Bravo, 2013; Rechimont et al., 2013). The distinctive aspect of our study and likely the principal explanation of such disparity in species richness is that in addition to the horizontal surface, vertical, overhang and cavefloor surfaces were included in the sampling design.
The use of remotely operated vehicles or towed cameras has considerably increased spatial extent of benthic surveys. However, exploring overhang or cave surfaces with these technologies is at least challenging when not impossible. Overall, it is clear that a combination of techniques, when available, will get a broader and more precise picture of subtidal habitats (Van Rein et al., 2009). An important complement to our protocol, could be the use of towed cameras or a second diver counting fishes. Employing semi-automated annotation of images by deep machine learning (Beijbom et al., 2015) could also improve this protocol by decreasing the analysis time per photo.
All considered, we propose the use of this protocol to monitor rocky reefs in large-scale long-term benthic biodiversity programs since it amalgamates technical, academic and financial aspects that make it applicable across the globe. Low cost and simple, it is capable of sampling different surface orientations and detecting a broad range of species. The proposed protocol adequately estimates macroalgal cover, benthic invertebrate abundance and benthic invertebrate diversity which were identified as Essential Ocean Variables (EOVs) or emerging EOVs by the Global Ocean Observing System (GOOS) (Miloslavich et al., 2018) and as Essential Biodiversity Variables (EBVs) by the Group on Earth Observations (GEO BON) (Pereira et al., 2013). In this context, the proposed protocol can be useful for monitoring rapid changes in rocky reef biodiversity through periodic sampling, and can be implemented as part of large monitoring programs such as MBON Pole to Pole to detect less tangible changes in fragile marine habitats, which provide important ecosystem services to society.
Data Availability Statement
The datasets presented in this study can be found in online repository https://doi.org/10.15468/xqgdsm. The R codes are available in https://github.com/gonzalobravoargentina/SupplementaryMaterials_Bravo-et-al.2020.
Author Contributions
GBi and JPL supervised the study that forms part of the Ph.D. thesis of GBr. All authors designed the study and wrote the first manuscript. GBr collected the data and did the statistical analysis and plots. All authors contributed to manuscript revision, read and approved the submitted version.
Funding
Funding for this work was provided by the Rapid Ocean Conservation grants (ROC) from Waitt foundation (https://www.waittfoundation.org/) granted to GBr. National Scientific and Technical Research Council—Argentina (CONICET) supports GBr Ph.D. grant and Livore and Bigatti’s salary. Part of the financial support came from the PICT 2018-0969, ProyectoSub foundation and Instituto de Conservación deBallenas (ICB) with the Australis award.
Conflict of Interest
The authors declare that the research was conducted in the absence of any commercial or financial relationships that could be construed as a potential conflict of interest.
Acknowledgments
We are grateful to the team members: Ricardo Vera, Néstor Ortiz, Facundo Irigoyen, Fabián Quiroga, Julio Rua, Nicolás Battini, Martín Brogger, Juan Pablo Laclaud, Estefanía Alvarez, and Yann Herrera Fuchs (Rolex scholar 2018) for participated in the field work. Special thanks to Punta Ballena (https://www.puntaballena.com.ar/) and Claudio Nicolini for logistical assistance in Puerto Pirámides. GBi acknowledges Alejo Irigoyen for the help with the rocky reef locations and fish identification. Special mention to all the taxonomists that helped with identification, Paula Raffo (Algae), Marianela Gastaldi (Porifera), Cristian Lagger (Tunicates), Daniel Lauretta (Cnidaria), and all the members of LARBIM laboratory. Ezequiel Marzinelli for statistical advice. We also wish to thank the two reviewers whose suggestions enhanced this manuscript. This is publication N_140 of the Laboratorio de Reproducción y Biología Integrativa de Invertebrados Marinos (LARBIM).
Supplementary Material
The Supplementary Material for this article can be found online at: https://www.frontiersin.org/articles/10.3389/fmars.2020.578595/full#supplementary-material
Footnotes
- ^ https://marinebon.org/p2p/
- ^ https://www.protocols.io/view/simple-subtidal-rocky-reef-environmental-parameter-3vdgn26
- ^ https://coralnet.ucsd.edu/source/1933/
References
Andrew, N., and Underwood, A. (1993). Density-dependent foraging in the sea urchin Centrostephanus rodgersii on shallow subtidal reefs in New South Wales. Aust. Mar. Ecol. Prog. Ser. 99, 89–98. doi: 10.3354/meps099089
Balech, E., and Ehrlich, M. (2008). Esquema biogeográfico del Mar Argentino. Rev. Investig. y Desarro. Pesq. 19, 45–75.
Barnes, D. K. A. (1995). Sublittoral epifaunal communities at Signy Island, Antarctica. II. Below the ice-foot zone. Mar. Biol. 121, 565–572. doi: 10.1007/BF00349467
Baynes, T. W. (1999). Factors structuring a subtidal encrusting community in the southern Gulf of California. Bull. Mar. Sci. 64, 419–450.
Beijbom, O., Edmunds, P. J., Roelfsema, C., Smith, J., Kline, D. I., Neal, B. P., et al. (2015). Towards automated annotation of benthic survey images: variability of human experts and operational modes of automation. PLoS One 10:e0130312. doi: 10.1371/journal.pone.0130312
Benedetti-Cecchi, L. (2001). Variability in abundance of algae and invertebrates at different spatial scales on rocky sea shores. Mar. Ecol. Prog. Ser. 215, 79–92. doi: 10.3354/meps215079
Bianchi, C. N., Pronzato, R., Cattaneo-Vietti, R., Benedetti-Cecchi, L., Morri, C., Pansini, M., et al. (2004). “Hard Bottoms,” in Mediterranean Marine Benthos: A Manual of Methods for Its Sampling And Study, eds M. C. Gambi and M. Dappiano (Genova: SIBM), 185–215.
Bravo, G. (2013). Efecto del Buceo Sobre Organismos Bentónicos En Los Parques Subacuáticos de Puerto Madryn, Chubut, Argentina. Bachelor Thesis, Univ. Nac. la Patagon. San Juan Bosco, Puerto Madryn.
Bravo, G., Márquez, F., Marzinelli, E. M., Mendez, M. M., and Bigatti, G. (2015). Effect of recreational diving on Patagonian rocky reefs. Mar. Environ. Res. 104, 31–36. doi: 10.1016/j.marenvres.2014.12.002
Cárdenas, C., Davy, S., and Bell, J. (2012). Correlations between algal abundance, environmental variables and sponge distribution patterns on southern hemisphere temperate rocky reefs. Aquat. Biol. 16, 229–239. doi: 10.3354/ab00449
Cárdenas, C. A., and Montiel, A. (2015). The influence of depth and substrate inclination on sessile assemblages in subantarctic rocky reefs (Magellan region). Polar Biol. 38, 1631–1644. doi: 10.1007/s00300-015-1729-5
Carpenter, S. R., Mooney, H. A., Agard, J., Capistrano, D., DeFries, R. S., Diaz, S., et al. (2009). Science for managing ecosystem services: beyond the millennium ecosystem assessment. Proc. Natl. Acad. Sci. U. S. A. 106, 1305–1312. doi: 10.1073/pnas.0808772106
Cheung, W. W. L., Meeuwig, J. J., Feng, M., Harvey, E., Lam, V. W. Y., Langlois, T., et al. (2012). Climate-change induced tropicalisation of marine communities in Western Australia. Mar. Freshw. Res. 63, 415–427. doi: 10.1071/MF11205
Claudet, J., and Fraschetti, S. (2010). Human-driven impacts on marine habitats: a regional meta-analysis in the Mediterranean Sea. Biol. Conserv. 143, 2195–2206. doi: 10.1016/j.biocon.2010.06.004
Dayton, P. K., Currie, V., Gerrodette, T., Keller, B. D., Rosenthal, R., and Tresca, D. V. (1984). Patch dynamics and stability of some California Kelp communities. Ecol. Monogr. 54, 253–289. doi: 10.2307/1942498
De Cáceres, M., Legendre, P., and Moretti, M. (2010). Improving indicator species analysis by combining groups of sites. Oikos 119, 1674–1684. doi: 10.1111/j.1600-0706.2010.18334.x
Doty, M. S. (1971). Measurement of water movement in reference to Benthic Algal Growth. Bot. Mar. 14, 32–35. doi: 10.1515/botm.1971.14.1.32
Duffy, J. E., Amaral-Zettler, L. A., Fautin, D. G., Paulay, G., Rynearson, T. A., Sosik, H. M., et al. (2013). Envisioning a marine biodiversity observation network. Bioscience 63, 350–361. doi: 10.1525/bio.2013.63.5.8
Dufrêne, M., and Legendre, P. (1997). Species assemblages and indicator species: the need for a flexible asymmetrical approach. Ecol. Monogr. 67, 345–366. doi: 10.2307/2963459
Edgar, G., and Stuart-Smith, R. (2009). Ecological effects of marine protected areas on rocky reef communities—a continental-scale analysis. Mar. Ecol. Prog. Ser. 388, 51–62. doi: 10.3354/meps08149
Edgar, G. J., and Stuart-Smith, R. D. (2014). Systematic global assessment of reef fish communities by the Reef Life Survey program. Sci. Data 1:140007. doi: 10.1038/sdata.2014.7
Fraschetti, S., Terlizzi, A., and Boero, F. (2008). How many habitats are there in the sea (and where)? J. Exp. Mar. Bio. Ecol. 366, 109–115. doi: 10.1016/j.jembe.2008.07.015
Galván, D. E., Venerus, L. A., and Irigoyen, A. J. (2009). The reef-fish Fauna of the Northern Patagonian Gulfs, Argentina, South-western Atlantic. Open Fish Sci. J. 2, 90–98. doi: 10.2174/1874401X00902010090
Gambi, M. C., Buia, M. C., Mazzella, L., Lorenti, M., and Scipione, M. B. (2000). “Spatio-temporal variability in the structure of benthic populations in a physically controlled system off Terra Nova Bay: the shallow hard bottoms,” in Ross Sea Ecology, eds M. F. Francesco, G. Letterio, and A. Lanora (Berlin: Springer), 527–538. doi: 10.1007/978-3-642-59607-0_38
Garrabou, J., Ballesteros, E., and Zabala, M. (2002). Structure and dynamics of North-western Mediterranean Rocky Benthic communities along a Depth Gradient. Estuar. Coast. Shelf Sci. 55, 493–508. doi: 10.1006/ecss.2001.0920
Glasby, T. M. (1999). Effects of shading on subtidal epibiotic assemblages. J. Exp. Mar. Bio. Ecol. 234, 275–290. doi: 10.1016/S0022-0981(98)00156-7
Hakanson, L., Floderus, S., and Wallin, M. (1989). “Sediment trap assemblages a methodological description,” in Sediment/Water Interaction, eds P. G. Sly and B. T. Hart (Dordrecht: Springer), 481–490. doi: 10.1007/978-94-009-2376-8_46
Halpern, B. S., Walbridge, S., Selkoe, K. A., Kappel, C. V., Micheli, F., D’Agrosa, C., et al. (2008). A global map of human impact on marine ecosystems. Science 319, 948–952. doi: 10.1126/science.1149345
Harley, C. D. G., Randall Hughes, A., Hultgren, K. M., Miner, B. G., Sorte, C. J. B., Thornber, C. S., et al. (2006). The impacts of climate change in coastal marine systems. Ecol. Lett. 9, 228–241. doi: 10.1111/j.1461-0248.2005.00871.x
Hawkins, S., Moore, P., Burrows, M., Poloczanska, E., Mieszkowska, N., Herbert, R., et al. (2008). Complex interactions in a rapidly changing world: responses of rocky shore communities to recent climate change. Clim. Res. 37, 123–133. doi: 10.3354/cr00768
Heyns, E. R., Bernard, A. T. F., Richoux, N. B., and Götz, A. (2016). Depth-related distribution patterns of subtidal macrobenthos in a well-established marine protected area. Mar. Biol. 163:39. doi: 10.1007/s00227-016-2816-z
Irving, A., and Connell, S. (2002). Sedimentation and light penetration interact to maintain heterogeneity of subtidal habitats: algal versus invertebrate dominated assemblages. Mar. Ecol. Prog. Ser. 245, 83–91. doi: 10.3354/meps245083
Jokiel, P., and Morrissey, J. (1993). Water motion on coral reefs: evaluation of the “clod card” technique. Mar. Ecol. Prog. Ser. 93, 175–181. doi: 10.3354/meps093175
Jones, G. P., and Andrew, N. L. (1990). Herbivory and patch dynamics on rocky reefs in temperate Australasia: the roles of fish and sea urchins. Aust. Ecol. 15, 505–520. doi: 10.1111/j.1442-9993.1990.tb01474.x
Jørgensen, L. L., and Gulliksen, B. (2001). Rocky bottom fauna in arctic Kongsfjord (Svalbard) studied by means of suction sampling and photography. Polar Biol. 24, 113–121. doi: 10.1007/s003000000182
Leenhardt, P., Low, N., Pascal, N., Micheli, F., and Claudet, J. (2015). “The role of marine protected areas in providing ecosystem services,” in Aquatic Functional Biodiversity, eds A. Belgrano, G. Woodward, and U. Jacob (San Diego: Elsevier), 211–239. doi: 10.1016/b978-0-12-417015-5.00009-8
Leichter, J. J., and Witman, J. D. (1997). Water flow over subtidal rock walls: relation to distributions and growth rates of sessile suspension feeders in the Gulf of Maine Water flow and growth rates. J. Exp. Mar. Bio. Ecol. 209, 293–307. doi: 10.1016/S0022-0981(96)02702-5
Ling, S. D. (2008). Range expansion of a habitat-modifying species leads to loss of taxonomic diversity: a new and impoverished reef state. Oecologia 156, 883–894. doi: 10.1007/s00442-008-1043-9
Maldonado, M., Aguilar, R., Bannister, R. J., James, J. B., Conway, K. W., Dayton, P. K., et al. (2016). “Sponge grounds as key marine habitats: a synthetic review of types, structure, functional roles, and conservation concerns,” in Marine Animal Forests, eds S. Rossi, A. Gori, L. Bramanti, and C. Orejas (Cham: Springer International Publishing), 1–39. doi: 10.1007/978-3-319-17001-5_24-1
Manly, B. F. J. (1991). Randomization and Monte Carlo Methods in Biology. London, UK: Chapman and Hall.
Martinez Arbizu, P. (2017). pairwiseAdonis: Pairwise multilevel comparison using adonis. Boston, MA: R Package.
Marzinelli, E. M., Williams, S. B., Babcock, R. C., Barrett, N. S., Johnson, C. R., Jordan, A., et al. (2015). Large-Scale geographic variation in distribution and abundance of Australian deep-water kelp forests. PLoS One 10:e0118390. doi: 10.1371/journal.pone.0118390
Miller, R., and Etter, R. (2011). Rock walls: small-scale diversity hotspots in the subtidal Gulf of Maine. Mar. Ecol. Prog. Ser. 425, 153–165. doi: 10.3354/meps09025
Miller, R. J., and Etter, R. J. (2008). Shading facilitates sessile invertebrate dominance in the rocky subtidal gulf of maine. Ecology 89, 452–462. doi: 10.1890/06-1099.1
Miloslavich, P., Bax, N. J., Simmons, S. E., Klein, E., Appeltans, W., Aburto-Oropeza, O., et al. (2018). Essential ocean variables for global sustained observations of biodiversity and ecosystem changes. Glob. Chang. Biol. 24, 2416–2433. doi: 10.1111/gcb.14108
Murray, S. N., Ambrose, R., and Dethier, M. N. (2006). Monitoring rocky shores. London: University of California Press.
Naranjo, S. A., Carballo, J., and García-Gómez, J. (1996). Effects of environmental stress on ascidian populations in Algeciras Bay (Southern Spain). Possible marine bioindicators? Mar. Ecol. Prog. Ser. 144, 119–131. doi: 10.3354/meps144119
Nonato, E. F., Brito, T. A. S., De Paiva, P. C., Petti, M. A. V., and Corbisier, T. N. (2000). Benthic megafauna of the nearshore zone of Martel Inlet (King George Island, South Shetland Islands, Antarctica): depth zonation and underwater observations. Polar Biol. 23, 580–588. doi: 10.1007/s003000000129
Oksanen, J., Blanchet, F. G., Friendly, M., Kindt, R., Legendre, P., MsGlinn, D., et al. (2019). Vegan: Community Ecology Package. Boston, MA: R Package.
Olivier, S. R., Paternoster, I. K., and Bastida, R. (1966). Estudios biocenóticos en las costas de Chubut (Argentina) I. Zonación biocenológica de Puerto Pardelas (Golfo Nuevo). Inst. Biol. Mar. 10, 1–71. doi: 10.11646/zootaxa.172.1.1
Pan, Y., Birdsey, R. A., Phillips, O. L., and Jackson, R. B. (2013). The structure, distribution, and biomass of the world’s forests. Annu. Rev. Ecol. Evol. Syst. 44, 593–622. doi: 10.1146/annurev-ecolsys-110512-135914
Parravicini, V., Morri, C., Ciribilli, G., Montefalcone, M., Albertelli, G., and Bianchi, C. N. (2009). Size matters more than method: Visual quadrats vs photography in measuring human impact on Mediterranean rocky reef communities. Estuar. Coast. Shelf Sci. 81, 359–367. doi: 10.1016/j.ecss.2008.11.007
Pereira, H. M., Ferrier, S., Walters, M., Geller, G. N., Jongman, R. H. G., Scholes, R. J., et al. (2013). Essential biodiversity variables. Science 339, 277–278. doi: 10.1126/science.1229931
Preciado, I., and Maldonado, M. (2005). Reassessing the spatial relationship between sponges and macroalgae in sublittoral rocky bottoms: a descriptive approach. Helgol. Mar. Res. 59, 141–150. doi: 10.1007/s10152-004-0213-3
R Development Core Team. (2018). A Language and Environment for Statistical Computing. New York, NY: R Development Core Team.
Rechimont, M. E., Galván, D. E., Sueiro, M. C., Casas, G., Piriz, M. L., Diez, M. E., et al. (2013). Benthic diversity and assemblage structure of a north Patagonian rocky shore: a monitoring legacy of the NaGISA project. J. Mar. Biol. Assoc. United Kingdom 93, 2049–2058. doi: 10.1017/S0025315413001069
Rossi, J.-P. (2011). rich: an R Package to analyse species richness. Diversity 3, 112–120. doi: 10.3390/d3010112
Rudman, W. B., and Bergquist, P. R. (2007). A review of feeding specificity in the sponge-feeding Chromodorididae (Nudibranchia: Mollusca). Molluscan Res. 27, 60–88.
Saunders, R. J., and Connell, S. D. (2001). Interactive effects of shade and surface orientation on the recruitment of spirorbid polychaetes. Aust. Ecol. 26, 109–115. doi: 10.1111/j.1442-9993.2001.01090.pp.x
Scoresby, S., and Graham, E. (2013). in Ecology of Australian Temperate Reefs: The Unique South, eds S. Scoresby and E. Graham Collingwood (Australia: CSIRO publishing).
Sebens, K. P. (1986). “Community ecology of vertical rock walls in the Gulf of Maine, USA: small-scale processes and alternative community states,” in The Ecology of Rocky Coasts, eds P. G. Moore and R. Seed (New York, NY: Columbia Univ. Press), 346–371.
Smale, D. A. (2007). Continuous benthic community change along a depth gradient in Antarctic shallows: evidence of patchiness but not zonation. Polar Biol. 31, 189–198. doi: 10.1007/s00300-007-0346-3
Steneck, R. S., Graham, M. H., Bourque, B. J., Corbett, D., Erlandson, J. M., Estes, J. A., et al. (2002). Kelp forest ecosystems: biodiversity, stability, resilience and future. Environ. Conserv. 29, 436–459. doi: 10.1017/S0376892902000322
Stephens, J. S., Larson, R. J., and Pondella, D. J. (2006). “Rocky Reefs and Kelp Beds,” in The Ecology of Marine Fishes: California and Adjacent Waters, eds L. G. Allen, D. J. Pondella, and M. H. Horn (Berkeley: University of California Press), 227–252. doi: 10.1525/9780520932470-011
Underwood, A. J., and Chapman, M. G. (2013). “Design and analysis in benthic surveys in environmental sampling,” in Methods for the Study of Marine Benthos, ed. A. Eleftheriou (Oxford, UK: John Wiley & Sons, Ltd), 1–45. doi: 10.1002/9781118542392.ch1
Van Rein, H., Brown, C., Quinn, R., and Breen, J. (2009). A review of sublittoral monitoring methods in temperate waters: a focus on scale. Underw. Technol. 28, 99–113. doi: 10.3723/ut.28.099
Venerus, L. A., Irigoyen, A. J., Galván, D. E., and Parma, A. M. (2014). Spatial dynamics of the Argentine sandperch, Pseudopercis semifasciata (Pinguipedidae), in temperate rocky reefs from northern Patagonia, Argentina. Mar. Freshw. Res. 65, 39–49. doi: 10.1071/MF12163
Virgilio, M., Airoldi, L., and Abbiati, M. (2006). Spatial and temporal variations of assemblages in a Mediterranean coralligenous reef and relationships with surface orientation. Coral Reefs 25, 265–272. doi: 10.1007/s00338-006-0100-2
Wernberg, T., Russell, B. D., Moore, P. J., Ling, S. D., Smale, D. A., Campbell, A., et al. (2011). Impacts of climate change in a global hotspot for temperate marine biodiversity and ocean warming. J. Exp. Mar. Bio. Ecol. 400, 7–16. doi: 10.1016/j.jembe.2011.02.021
Witman, J. D. (1985). Refuges, biological disturbance, and rocky subtidal community structure in New England. Ecol. Monogr. 55, 421–445. doi: 10.2307/2937130
Witman, J. D., and Dayton, P. K. (2001). “Rocky subtidal communities,” in Marine community ecology, eds M. D. Bertness, S. D. Gaines, and M. E. Hay (Sunderland, MA: Sinauer Associates), 339–366.
Witman, J. D., Etter, R. J., and Smith, F. (2004). The relationship between regional and local species diversity in marine benthic communities: a global perspective. Proc. Natl. Acad. Sci. 101, 15664–15669. doi: 10.1073/pnas.0404300101
Keywords: epibenthic survey, large-scale monitoring, photoquadrats, MBON, benthos, subtidal, Southwestern Atlantic
Citation: Bravo G, Livore JP and Bigatti G (2020) The Importance of Surface Orientation in Biodiversity Monitoring Protocols: The Case of Patagonian Rocky Reefs. Front. Mar. Sci. 7:578595. doi: 10.3389/fmars.2020.578595
Received: 30 June 2020; Accepted: 03 December 2020;
Published: 23 December 2020.
Edited by:
Juan Carlos Azofeifa-Solano, University of Costa Rica, Costa RicaReviewed by:
Jeffrey Sibaja-Cordero, University of Costa Rica, Costa RicaAndrés Beita-Jiménez, Memorial University of Newfoundland, Canada
Copyright © 2020 Bravo, Livore and Bigatti. This is an open-access article distributed under the terms of the Creative Commons Attribution License (CC BY). The use, distribution or reproduction in other forums is permitted, provided the original author(s) and the copyright owner(s) are credited and that the original publication in this journal is cited, in accordance with accepted academic practice. No use, distribution or reproduction is permitted which does not comply with these terms.
*Correspondence: Juan Pablo Livore, bGl2b3JlQGNlbnBhdC1jb25pY2V0LmdvYi5hcg==
 Gonzalo Bravo
 Juan Pablo Livore
 Gregorio Bigatti
