
94% of researchers rate our articles as excellent or good
Learn more about the work of our research integrity team to safeguard the quality of each article we publish.
Find out more
ORIGINAL RESEARCH article
Front. Mar. Sci., 30 October 2020
Sec. Marine Fisheries, Aquaculture and Living Resources
Volume 7 - 2020 | https://doi.org/10.3389/fmars.2020.577964
This article is part of the Research TopicManaging for the Future: Understanding the Relative Roles of Climate and Fishing on Structure and Dynamics of Marine EcosystemsView all 22 articles
 Heidi R. Pethybridge1*
 Elizabeth A. Fulton1,2
 Alistair J. Hobday1,2
 Julia Blanchard2,3
 Catherine M. Bulman1
 Ian R. Butler2,4,5
 William W. L. Cheung6
 Leo X. C. Dutra1,2
 Rebecca Gorton1Trevor Hutton1
 Richard Matear1Hector Lozano-Montes1
 Eva E. Plagányi1,2
 Cecilia Villanueva2,3
 Xuebin Zhang1
Climate-driven trends in ocean temperature and primary productivity are projected to differ greatly across the globe, triggering variable levels of concern for marine biota and ecosystems. Quantifying these changes, and the complex ways in which resource-dependent communities will need to respond, is inherently difficult. Existing uncertainty about the structure, function and responses of marine ecosystems, means that a multi-model or ensemble model approach is the most prudent means of assessing the potential ecosystem responses to climate change. In this study, climate-ecological projections of 13 marine ecosystem models for regions around Australia were evaluated. Model types included dynamic food web, spatial whole of ecosystem, intermediate complexity, species distribution, and size spectrum models and were all forced by high-resolution ocean model data. Each Australian region and fishery will face its own challenges in terms of ecosystem shifts and fisheries management responses over the next 30 years. Across regions, demersal systems appear to be more strongly affected by climate change than pelagic systems, with invertebrate species in shallow waters likely to respond first and to a larger degree. With the assistance of qualitative confidence evaluations, the multi-model approach was useful for identifying the likely state of concern for each functional group and thus adaptive management and research priorities. Largest model discrepancies were found between the regional ecosystem models that represent trophic interactions and the species distribution models, with implications for future assessments and adaption planning. Study results highlight that fisheries and their management will need to foster pro-active and flexible adaptation options to make the most of coming opportunities and to minimize risks or negative outcomes.
Globally, marine ecosystems are in a period of rapid change with predicted climate effects reducing our confidence in the outcomes from continued existing management actions. There is substantial evidence of climate change affecting the distribution, abundance and size of both target and non-target species around the globe in tropical, temperate and polar environments (Hobday and Pecl, 2014) and at time scales relevant to current management and strategic planning (Allison and Bassett, 2015; Busch et al., 2016; Sheaves et al., 2016). While some species or populations will be highly sensitive to ocean warming, others will be much more tolerant and adaptive, meaning there will be winners, losers, and potential surprises (Fulton, 2011; Dutkiewicz et al., 2013). Changes at the sub-population level can modify communities and ecosystems, which in turn feedback to affect individuals of many species. Therefore, industries and managers will need to be strategic and structured in their approach to adaptive planning in ways that will minimize losses and maximize opportunities that might arise from climate change (Norman-López et al., 2011; Pecl et al., 2017). Ideally this would involve taking a climate-informed, ecosystem approach to fisheries management (EAFM), which encourages conservation and sustainable use of the whole ecosystem (Heenan et al., 2015).
Marine ecosystem and multi-species models attempt to represent links between species, either through feeding or habitat use, as well as human activities and natural variability influencing the system. These models are particularly useful tools for synthesizing and extending scientific understanding of how the ecosystems function. The models also offer a strategic tool for managers of natural resources where they can explore the potential consequences of human or environmental impacts and test potential solutions. Increasingly, ecosystem models are used to distinguish the effects of climate change and fishing on entire ecosystems as well as on individual species or groups of species (Plagányi et al., 2011). Global model simulations of direct and indirect effects of climate change suggest that over a large spatial scale, bulk fisheries yields will be reduced (Cheung et al., 2010; Sumaila et al., 2011; Blanchard et al., 2012; Free et al., 2019).
Best practice for utilizing ecosystem models in support of EAFM is suggested as a multi-model (or ensemble) approach where at least two models, developed independently and that use different frameworks, are compared to make sure underlying process biases or structural assumptions are not skewing model results (Spence et al., 2018). Direct comparisons across many regional and global models are inherently difficult due to the way that different models are structured and function (Payne et al., 2016). However, the multi-model approach has proven useful to demonstrate the potential range in outcomes and the level of confidence that is associated with each of the different model projections (Cheung et al., 2016a; Barange et al., 2018; Hollowed et al., 2020). Close agreement between model outputs offers enhanced confidence in model outcomes while disagreement can be used to flag the need for more targeted information. Within a climate context, most effort to date around ensemble projections has been in terms of bulk (total system-level) changes in biomasses, though more is being done through the Fisheries Inter-Model Comparison Project (Fish-MIP) in terms of functional group and species level effects at the global (Tittensor et al., 2018; Lotze et al., 2019) and ocean basin (Bryndum-Buchholz et al., 2019) scales. Within both Fish-MIP and national agencies, there are also a growing number of studies, particularly in the Northern hemisphere, being undertaken using the multi-model approach to project local or regional-scale climate driven changes at the species or functional level (e.g. Pacific sardine in the California current; Kaplan et al., 2019).
Australia’s marine environment encompasses sub-polar to tropical zones. Two of the world’s most rapidly warming ocean areas are located in the south-east and south-west, and even outside these regions, the tropical waters of Australia are warming at almost twice the global average (Lough and Hobday, 2011; Hobday and Pecl, 2014). Australia has a rich history of ecosystem modeling and many ecosystem models, using various modeling platforms, have been developed over the last two decades such that they collectively cover most of the Australian coastline (Figure 1). These models were built for varying purposes but are being increasingly used to provide information in support of EAFM (Brown et al., 2010; Fulton et al., 2011a; Smith et al., 2017). Key examples include the use of a spatial whole of ecosystem model (Atlantis) as a tool for evaluating alternative management strategies for the Southern and Eastern Scalefish and Shark Fishery (SESSF), where model projections were used to restructure the fisheries (Fulton et al., 2014). Dynamic food web models (using the Ecopath with Ecosim (EwE) framework) of the Northern Prawn Fishery have been used to evaluate spatial management options for the Marine Stewardship Certified high value fishery (Dichmont et al., 2013). Lastly, statistical fit bespoke Models of Intermediate Complexity of Ecosystems (MICE) are being used to inform strategic thinking about management of tropical beche-de-mer, prawn and lobster fisheries (Plagányi et al., 2014, 2019).
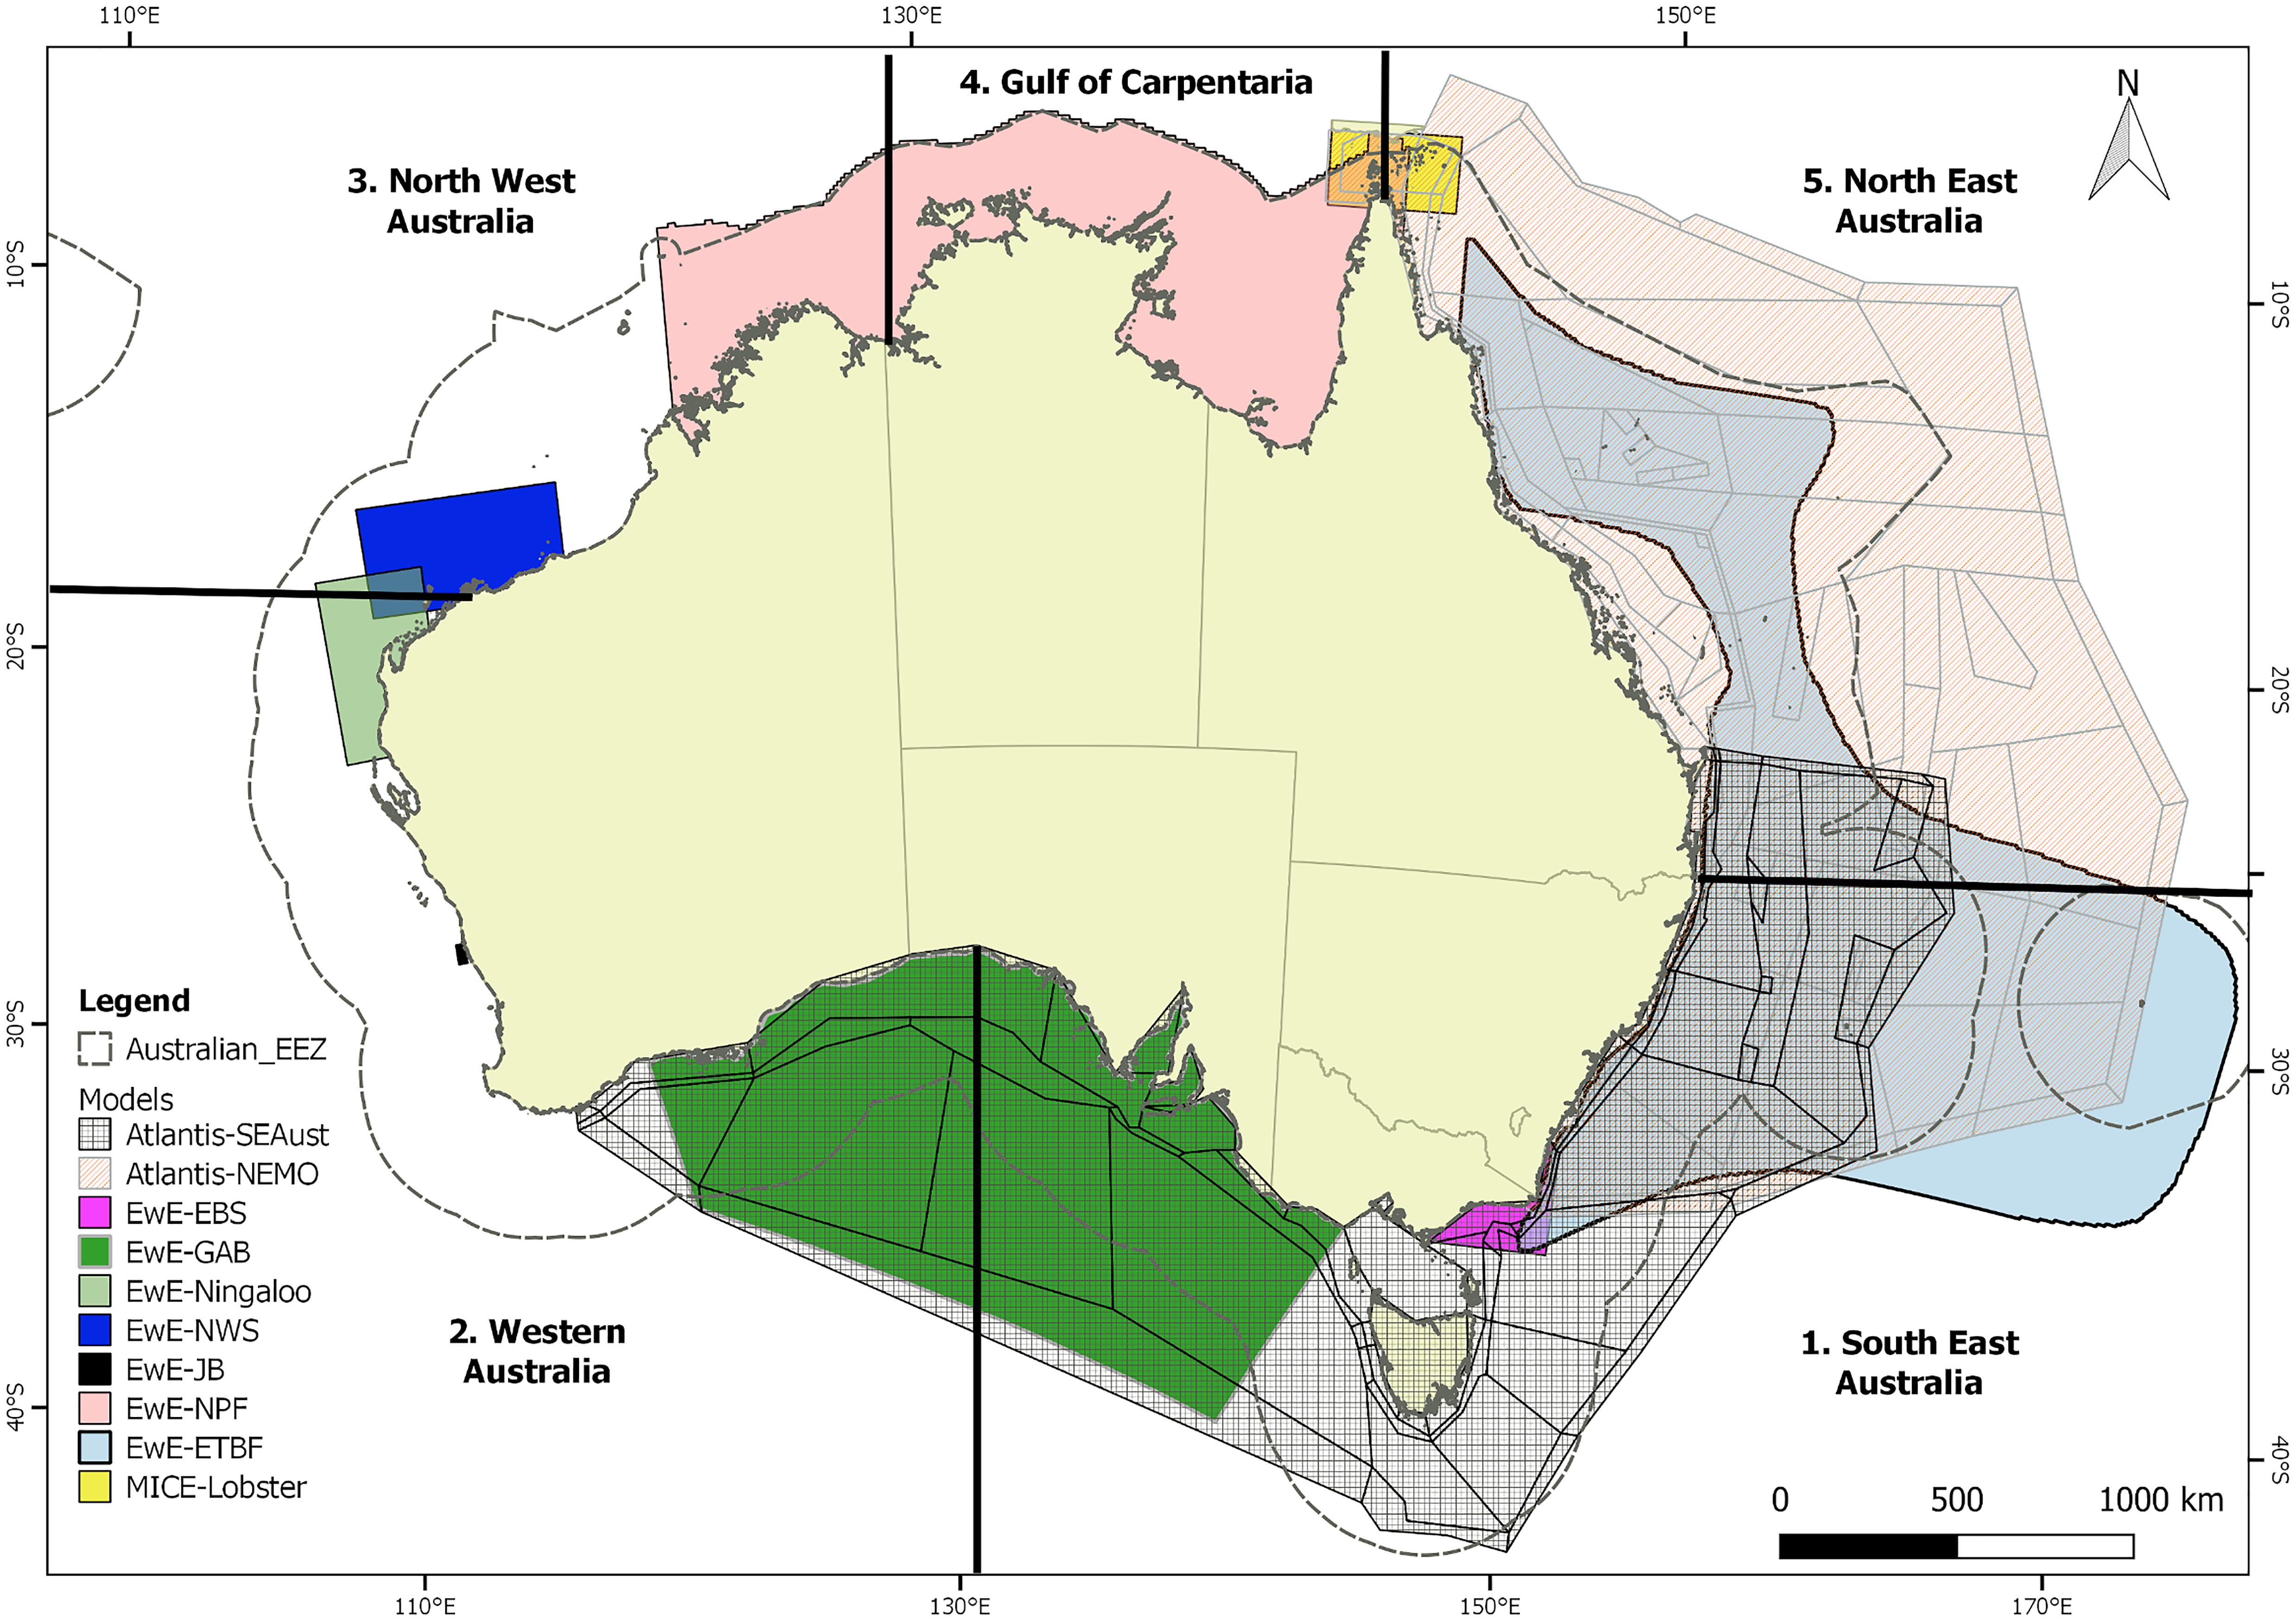
Figure 1. Map showing the regional ecosystem model domains and the 5 assessment regions. The two global modeling platforms are not shown on the map though extracted outputs for each assessment region within the Australian Economic Exclusion Zone (EEZ).
The aim of this study was to use 13 different ecosystem models to assess the likely state of concern for Australia’s fisheries stocks under projected climate change and to report the level of confidence in our ecosystem projections. To achieve this, we run ecosystem projections to 2050 using ocean model projections for the Australian region and the Commonwealth fisheries and explored the single and combined effects of climate change and fisheries. Commonwealth fisheries are those managed at a federal Australia wide level, (typically) from three nautical miles offshore to the boundary of the Australian Fishing Zone (200 nautical miles offshore), as well as Australian boats fishing on the high seas. A novel framework was developed to assess confidence in the robustness of climate-mediated biomass projections by accounting for uncertainty from multiple sources (the ocean model, ecosystem model, and data). We focus on ecological projections over the short to medium term (between 2020 and 2050) as this is the scale most relevant to industry and climate-risk management and adaptation planning. It is also a period for which a high degree of overlap occurs in the various greenhouse gas emissions scenarios used in future climate projection such as the Coupled Model Intercomparison Project (CMIP5 IPCC; Van Vuuren et al., 2011). The information generated from this study is of relevance to Australian and international fishers and fisheries managers looking to incorporate climate change adaptation measures and strategies into existing plans.
We used thirteen extant ecosystem models across five published and validated modeling platforms to provide a wide coverage of the Australian Exclusive Economic Zone (EEZ) (Table 1). This set included five different modeling platforms and approaches: a dynamic and spatially explicit whole of ecosystem model, Atlantis (Fulton et al., 2011b; Audzijonyte et al., 2019), a dynamic mass-balanced EwE model (Christensen and Walters, 2004; Colléter et al., 2015), a statistically data-fitted MICE (Plagányi et al., 2014), a community size spectrum model (Blanchard et al., 2012), and an ensemble of species-based distribution models called dynamic bioclimate envelope models (DBEM, Cheung et al., 2009). Greater details of these modeling approaches are provided in Supplementary Material 1. These modeling platforms vary greatly in their assumptions, structure (number of functional groups, size or age classes represented) and the level of spatio-temporal and ecological complexity (Table 2). Each of these models was originally designed for a specific question or purpose and as such often focuses on particular components of the ecosystem.
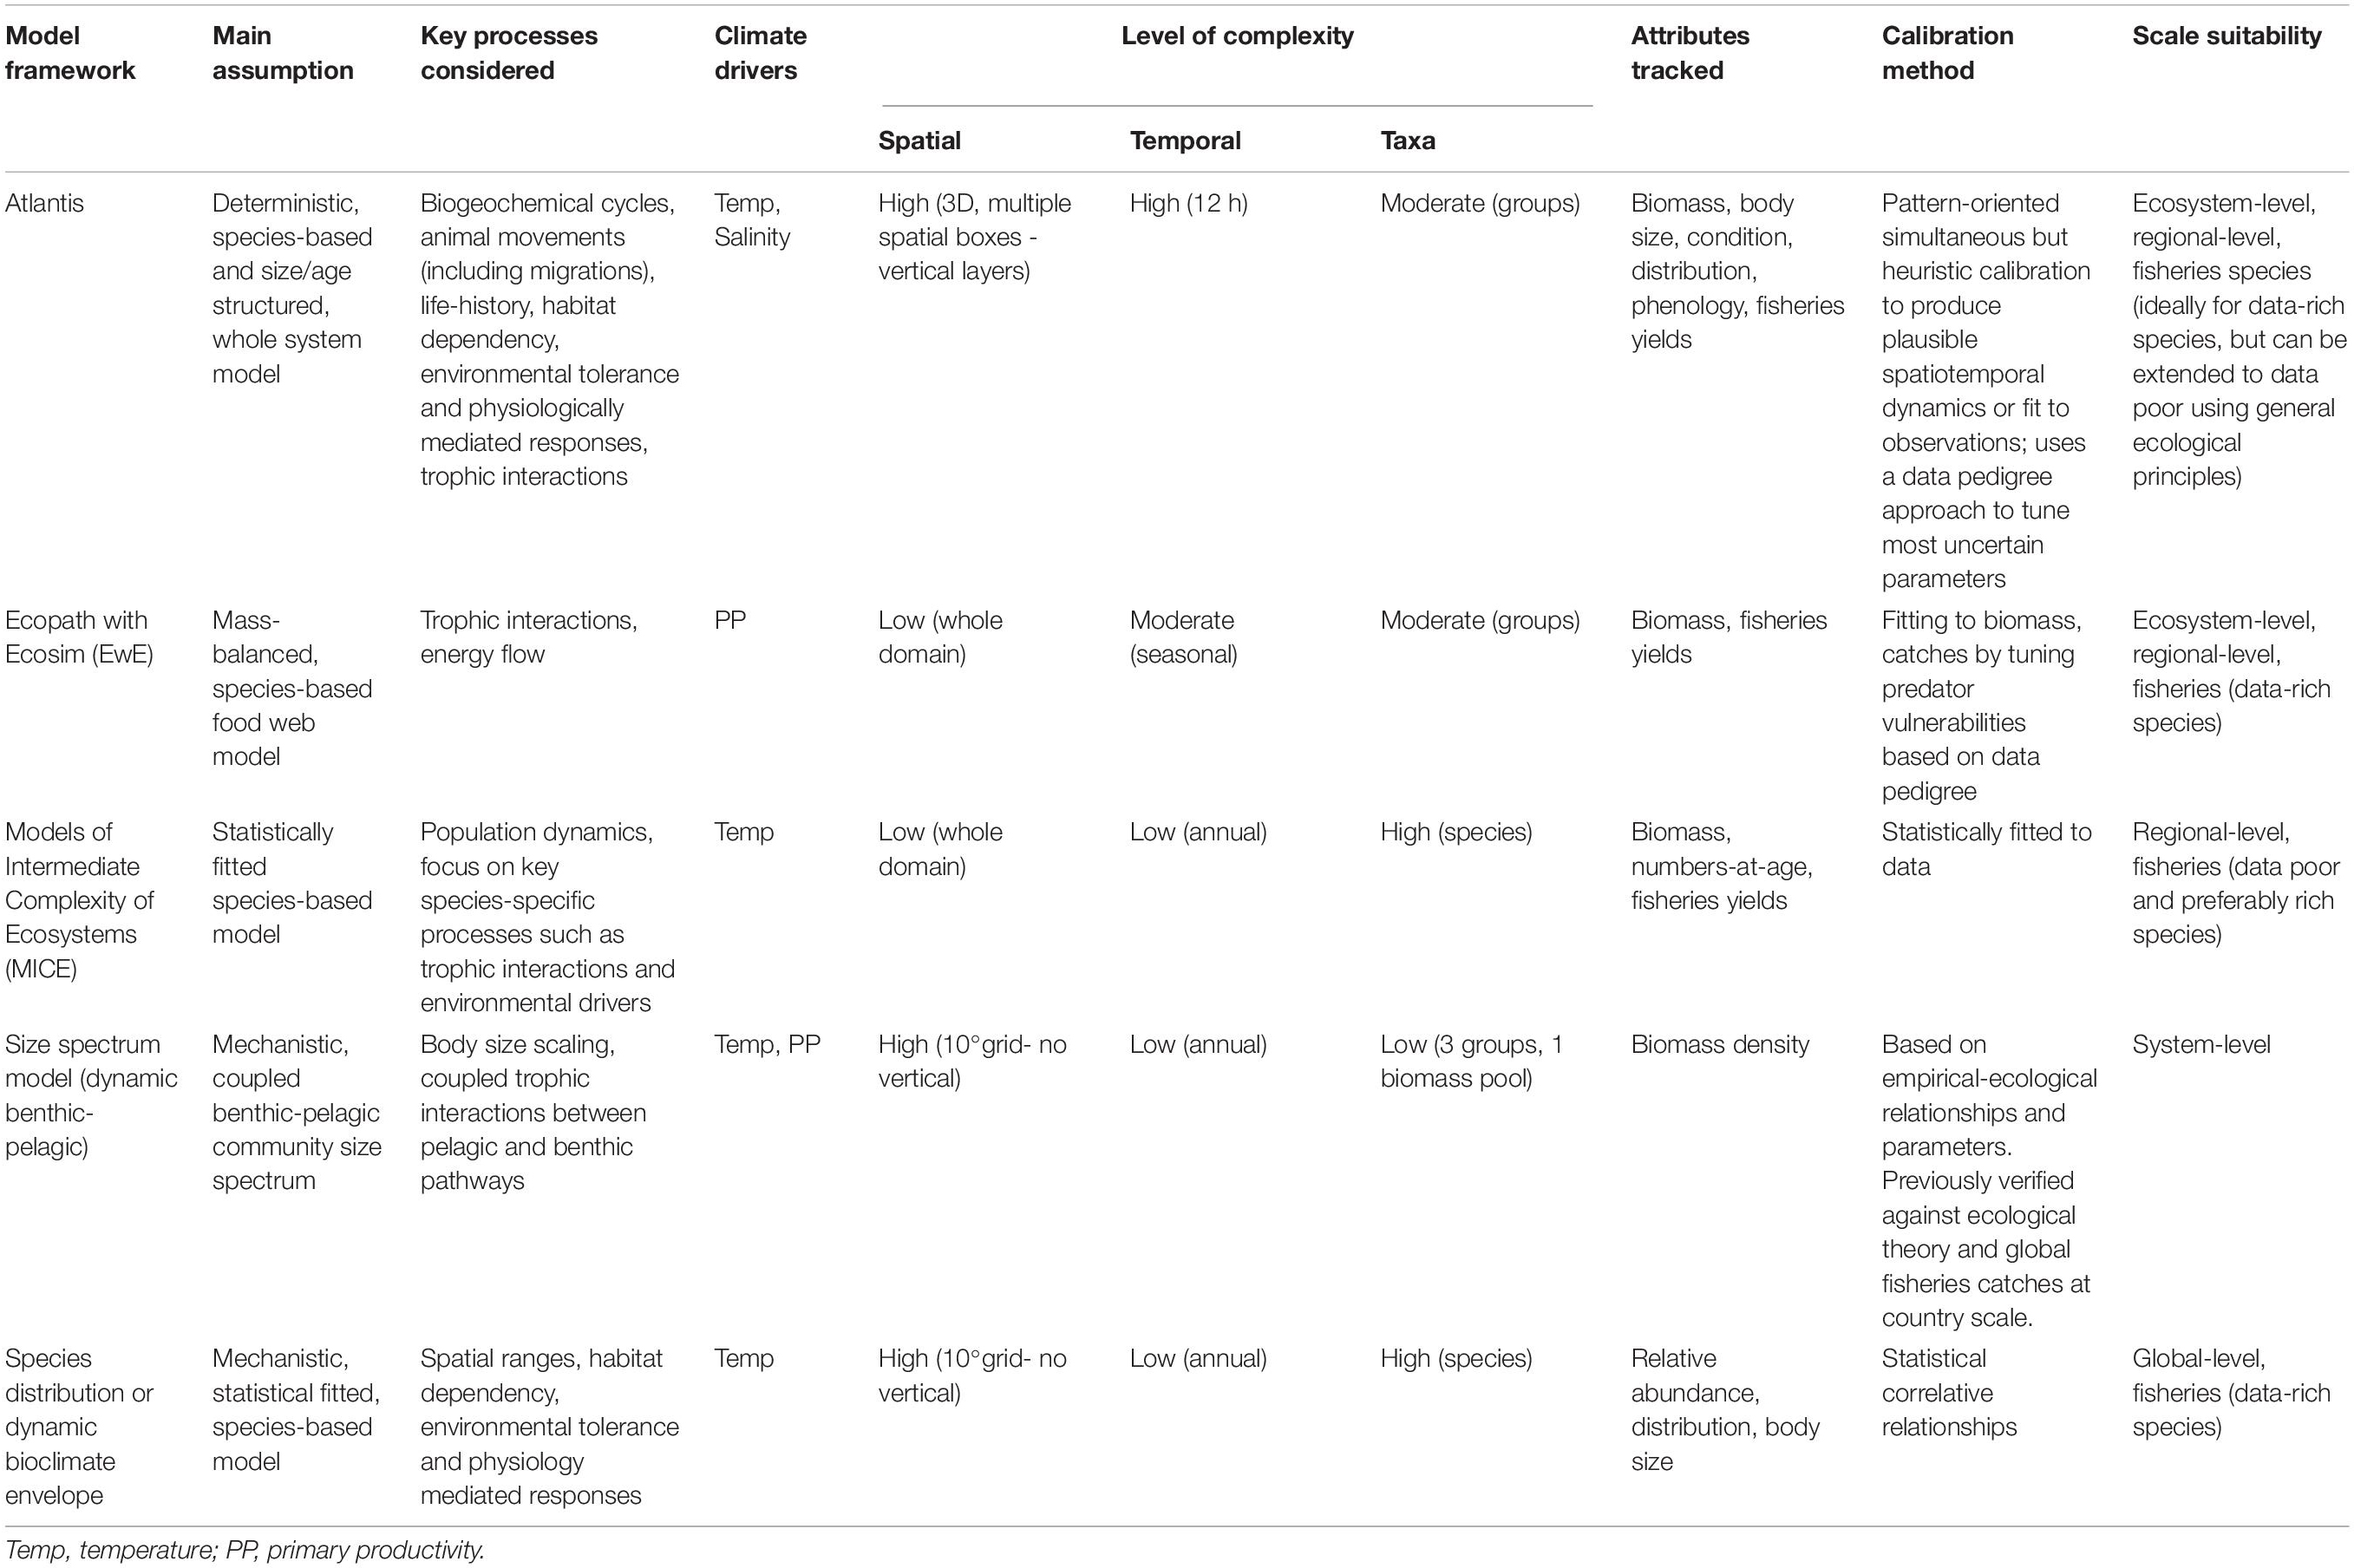
Table 1. Summary of the main differences between the five model frameworks used to examine ecosystem responses to climate and fishing management drivers.
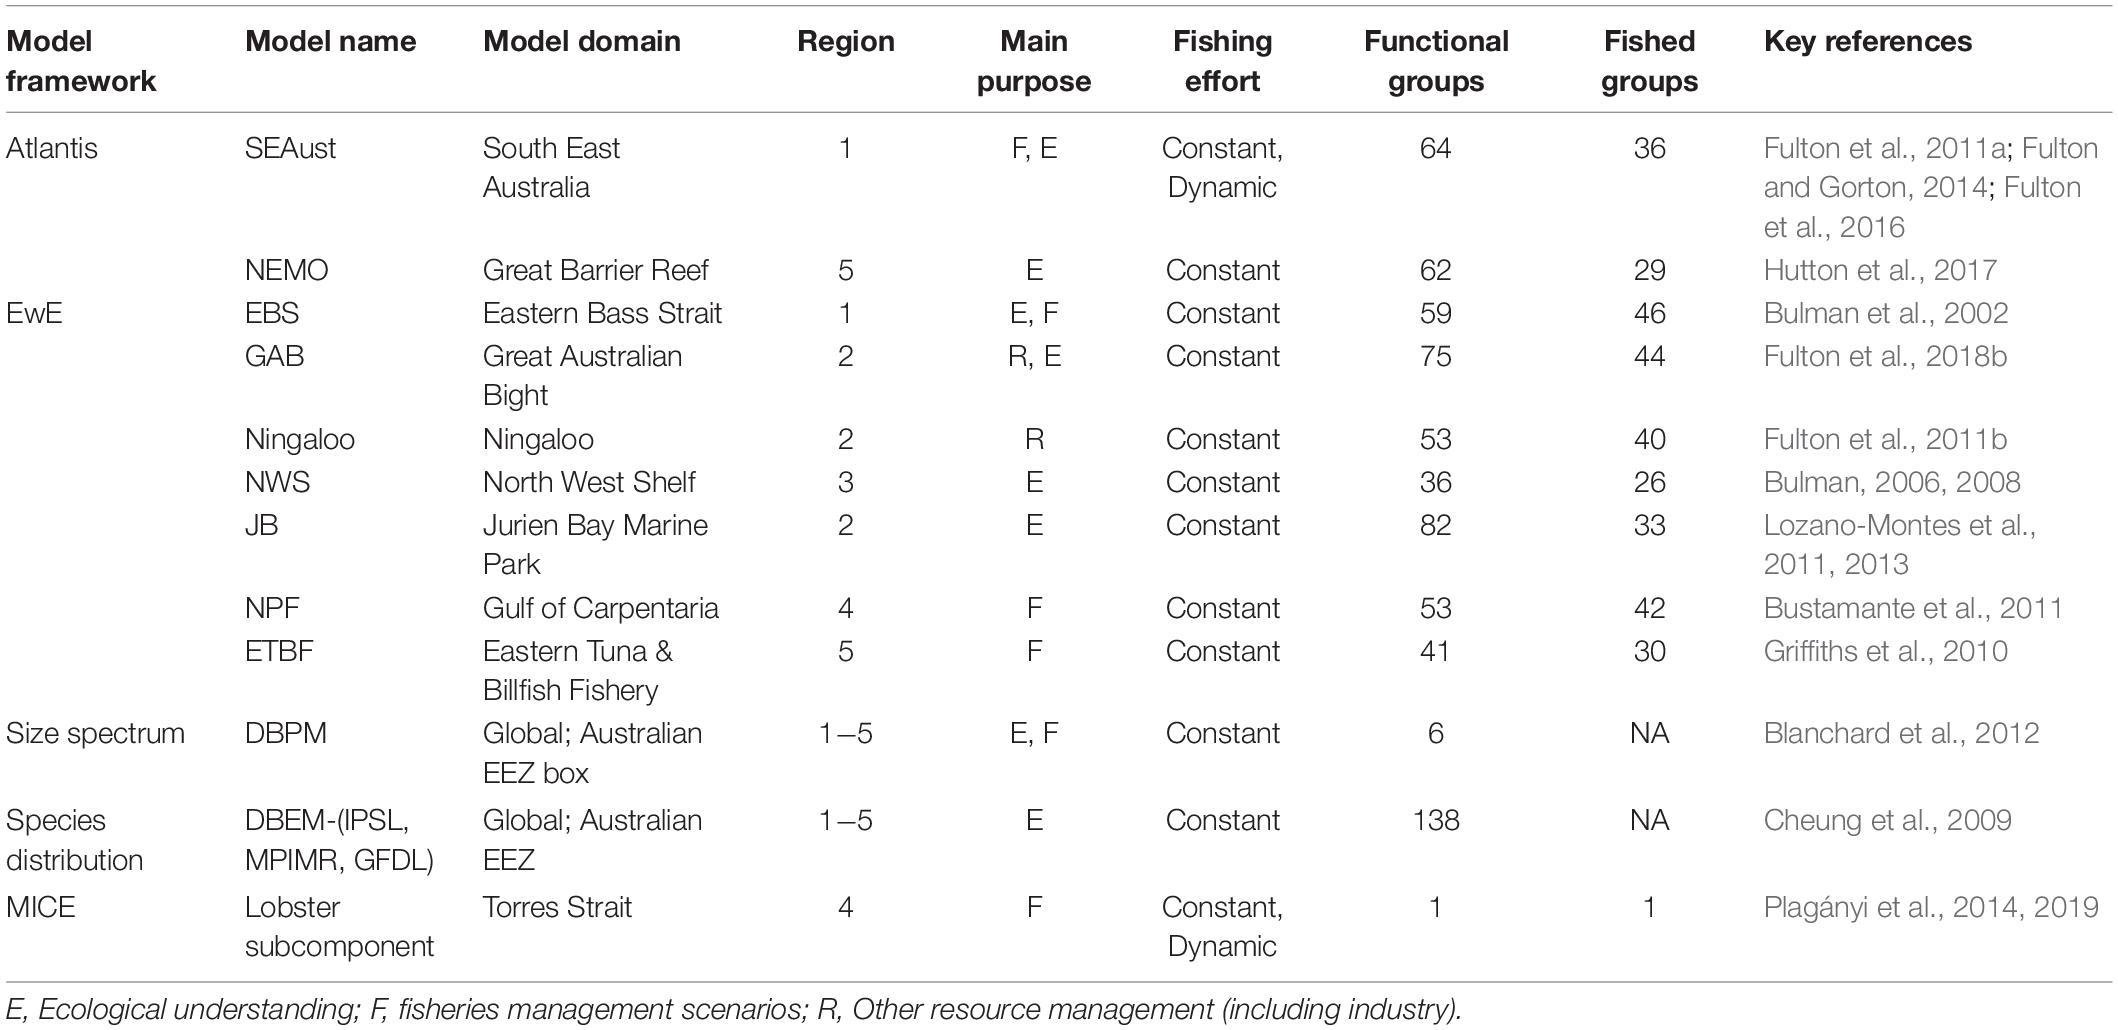
Table 2. Summary of the regional and global ecosystem models used in this project to examine ecosystem responses to climate change and fisheries. NA indicates that fishing was not directly included.
Regional models, using the Atlantis, EwE or MICE platforms, have been implemented for specific Australian marine ecosystems (Figure 1 and Table 2), with the combined set covering much of Australia’s coastline: Great Barrier Reef, Coral Sea, Gulf of Carpentaria, Northwest Shelf, Ningaloo Reef (Gascoyne coast), southwest Australia (Jurien Bay), North east Australia (Torres Strait), Great Australian Bight, and the entire southeast Australia. This geographic extent also spans all of Australia’s major marine continental ecosystem types from sub-polar to tropical.
Outputs from two global models, which contributed global-scale climate simulations to the Fisheries Inter-Model Comparison Project (Fish-MIP; Tittensor et al., 2018), were obtained for the Australian EEZ. Mean outputs from the global models were extracted for each of the 5 assessment regions: (1) South East Australia, (2) Western Australia; (3) North West Australia, (4) Gulf of Carpentaria; and (5) North East Australia (Figure 1).
Four hundred and sixty five species or functional groups were assessed from the 11 regional ecosystem models around Australia. This equates to representing in total 294 harvested groups and 52 threatened, endangered and protected species (TEPs), and a significant proportion of non-target bycatch species. A further 6 trophic size-based and system level groups were assessed using the output from the global benthic-pelagic size spectrum model and 138 species were assessed by the ensemble of dynamic bioclimate envelope models. While the complete set of species represented (either individually or within functional groups) is well short of the more than 600 species that interact with Australian fisheries, it incorporates the major target species and the interactions between them either individually or within ecological functional groups.
The regional ecosystem models were updated and re-calibrated with fisheries data on catches, discards and effort obtained from both State and Commonwealth fisheries for the 2006 to 2016 period. In all regional models, fishing fleets were distinguished by gear-type and target species and projections were made using constant fishing mortality or effort of 2016. All harvested groups or species were assigned according to nine Australian Commonwealth fisheries including the SESSF, Small Pelagic Fishery (SPF), Northern Prawn Fishery (NPF), Eastern and Western Tuna and Billfish Fishery (ETBF and WTBF), Southern Bluefin Tuna Fishery (SBTF), Torres Strait Rock Lobster Fisheries (TSRLF), and Bass Strait Central Zone Scallop Fishery (BSCZSF).
For the global benthic-pelagic size spectrum model (DBPM) fishing was not included and therefore the model outputs reported here represent relative changes in the unexploited biomass of pelagic and benthic consumers under climate forcing only. Previously, DBPM was calibrated for the North Sea (Blanchard et al., 2009) and globally using regional shelf sea models with fishing mortality rates of 0.2 year–1 producing catches in broad agreement with empirical time-averaged country-level EEZ estimates from the Sea Around Us Project (Blanchard et al., 2012). Size-dependent growth rates were consistent with the empirical estimates by Pauly (1980) (Blanchard et al., 2012). DBPM produced relative biomass change close to the multi-model mean of (Lotze et al., 2019) which were shown to be consistent with the temperature-dependent hindcasts of Maximum Sustainable Yield for 235 assessed fish stocks after controlling for fishing effects (Free et al., 2019; Lotze et al., 2019).
For the dynamic bioclimate envelope model, global fisheries catch data from the Sea Around Us project (Pauly et al., 2020) contributed to the determination of the baseline biogeography of the exploited marine species. Moreover, simulated maximum catch potential for historical time period from the model was shown to be significantly correlated with the reported fisheries catch data, providing additional confidence on the model outputs (Cheung et al., 2009, 2016c).
The climate projection used to force the environmental conditions for each regional model was derived from the Ocean Forecasting Australia Model version 3 (OFAM-v3) downscaling simulations which used the IPCC RCP8.5 high emissions or “no mitigation” greenhouse gas emission scenarios. The atmospheric forcing of the ocean model comes from the multi-model mean of the CMIP5 climate projections under the RCP8.5 scenario (Feng et al., 2017; Zhang et al., 2017). The OFAM-v3 model was coupled to a biogeochemical model representing nutrient flows and plankton components of the ocean food web to produce patterns of primary productivity, nutrient cycling and carbon fluxes that are consistent with observations. The OFAM-v3 simulations provided high-resolution (10 km, 0.1°) projection of the future ocean state with outputs that resolved important oceanographic features (e.g. eddies) and ocean state variables including sea surface temperature (°C), sea surface salinity (PSU), phytoplankton (mmol N m–3), primary productivity (mmol C m–2), phosphate (nmol m–3), base oxygen levels, aragonite saturation, and current flows. For this study, we used two different atmospheric forcings of OFAM-v3 over the 2006 to 2101 period: (1) a high “no mitigation” emission scenario (RCP8.5) where the atmospheric forcings are derived from the CMIP5 multi-model mean, and (2) a control scenario where the atmospheric forcings are based on present-day conditions (Zhang et al., 2017). We used the difference between the RCP8.5 and control scenarios to determine the future climate change. Monthly climate data with spatial resolution of 0.1° (∼10 km) was stored for use in forcing the ecosystem models.
The two global ecosystem models were not forced by the OFAM-v3 model, instead they were forced by climate simulations generated from the ensemble of global Earth system models used within the CMIP5 (Taylor et al., 2012) under the framework of the Fisheries and Marine Ecosystems Impact Models Intercomparison Project (FishMIP) (Tittensor et al., 2018). More specifically FishMIP used the Geophysical Fluid Dynamics Laboratory Climate Model (GFDL-ESM2M, 60), the Institute Pierre Simon Laplace Climate Model (IPSL-CM5A-LR, 61) and the Max Planck Institute Mixed Resolution model (MPIMR). For the benthic-pelagic size-spectrum model, climate change projections were run by linking the lower end of the pelagic consumer size spectrum to small and large phytoplankton biomass time-series from the IPSL-CM5A-LR model only. The benthic consumer size spectrum was linked to time series estimates of near seafloor detritus obtained through sinking rates of primary producers and depth in each grid cell of the ocean. The size-dependent feeding rates in the pelagic and benthic size spectra were forced by average water column and near seafloor temperature, respectively. For the dynamic bioclimate envelope model, growth, body size, mortality, larval dispersal, adult movement and carrying capacity of the habitat of each studied species are functions of annual average ocean conditions including temperature, oxygen level, salinity, ocean advection and net primary production over the simulation timeframe (Cheung et al., 2016a).
Depending on the type of ecosystem model, daily to monthly climate forcing files were created by extracting and interpolating the climate variables (described above) to the geometry of the ecosystem model. Atlantis models were forced with an interpolated times series of forcing data of daily temperature, salinity and currents (oceanographic exchanges). To do this, the original monthly climate data was overlaid onto the geometry of the Atlantis models to extract mean monthly climate values for each spatial box and horizontal layer in the model domain. Where there were no climate data, the average of the adjacent box values in the appropriate layer was used. The monthly value per box and layer was then interpolated to create daily forcing data. The species and functional groups within Atlantis respond to these conditions – both through physiological rates (e.g. growth) that are conditioned on ambient temperatures, salinity, oxygen and pH levels and via modifying spatial distributions if conditions were beyond their tolerance.
The other regional ecosystem models (EwE and MICE) had coarser temporal and (vertical and horizontal) spatial resolution. For these models, mean monthly surface (0−5 m) values of climate data were extracted from the gridded data for the specific area of the regional model. Forcing time series were calculated as appropriate for the specific model. In EwE models, primary producers were forced using the time series of OFAM primary productivity anomalies, which then fed up through the food web. MICE models can be forced with a range of physical drivers (e.g. Tulloch et al., 2019), but the MICE subcomponent used here was forced with monthly temperature only because it was considered the key driver of growth and mortality for lobsters in the relatively shallow well-mixed Torres Strait region.
Control and climate forcing files were applied for a projection period of 40 years, from 2010 to 2050. The two Atlantis models were run for at least 10−20 years prior to the projection period of each simulation which is standard protocol for Atlantis as it allows for consistent model ‘burn-in’ so that transient effects of the initial conditions in the system do not unduly influence the projections (Pethybridge et al., 2019) and so that historically realistic biomasses are present at the start of the projection period. For the MICE and EwE models, observation data was used for at least 10 years before the projection period so that the short-term historical trajectories were reproduced ensuring the ecosystems were conditioned to the correct biomasses rather than assuming an equilibrium state.
To evaluate the short and medium-term impacts of climate change, the series of 5-year averages of model-derived biomass and fisheries catches were calculated and normalized relative to the values in 2010. These averages were used rather than snapshot values so that there was not undue influence of inter-annual variation (i.e., the results were not skewed by the coincidence of a “poor” year within a reporting window).
To look at the impact of climate change alone (and not the combined effects of fishing and climate), the output for the RCP8.5 emission scenario was calculated relative to the values from the control scenario (present-day fishing and climate state). For the global benthic-pelagic size spectrum and dynamic bioclimate envelope models, biomass changes under RCP8.5 were analyzed relative to historical average biomass across 1990–1999 (reference period) without the requirement of a control run simulation. Both global models were initialized until the simulation outputs stabilized before making forward projections.
Three different anomalies were calculated to examine relative changes in biomass at a given time period (Xt):
(i) Combined impacts of climate change and fisheries projection = RCP8.5 scenario =
where Xt,r is the value for that group at time t in the RCP8.5 scenario:
(ii) Fisheries impacts only projection (for regional ecosystem models only) = Control scenario =
where Xt,c is the value for that group at time t in the control scenario:
(iii) Climate change impacts only projection =
For each regional model, we assessed the likely state of concern of all functional groups and species (negligible – low – moderate – high) based on: (1) sensitivity – the magnitude and direction of their projected rates of biomass change to the climate change impacts only scenario, and (2) response type – differences in the direction and sensitivity between projections of the RCP8.5 and control scenarios (Figure 2). For the sensitivity assessment of climate impacts only, we used 7 incremental changes of 10% as smaller changes may constitute normal inter-annual or regional variation. For the response type, functional groups were assigned to one of 7 groups based on the magnitude and direction of biomass trends (using incremental changes of 20%) for the combined impacts of climate change and fisheries projection relative to the fisheries impact only projection (Figure 2). This included divergent responses in which climate change and fisheries projections are in an opposite direction to that of fisheries impacts only; stable projections where biomass trends of both the combined impacts and fisheries impacts only projections are similar (with differences <20%); enhanced response in which biomass changes are in the same direction but are heightened in magnitude under climate change; and dampened responses where biomass changes are in the same direction but where the magnitude is lower under climate change. For the global benthic-pelagic size spectrum and dynamic bioclimate envelope models, a stable response type was assumed.
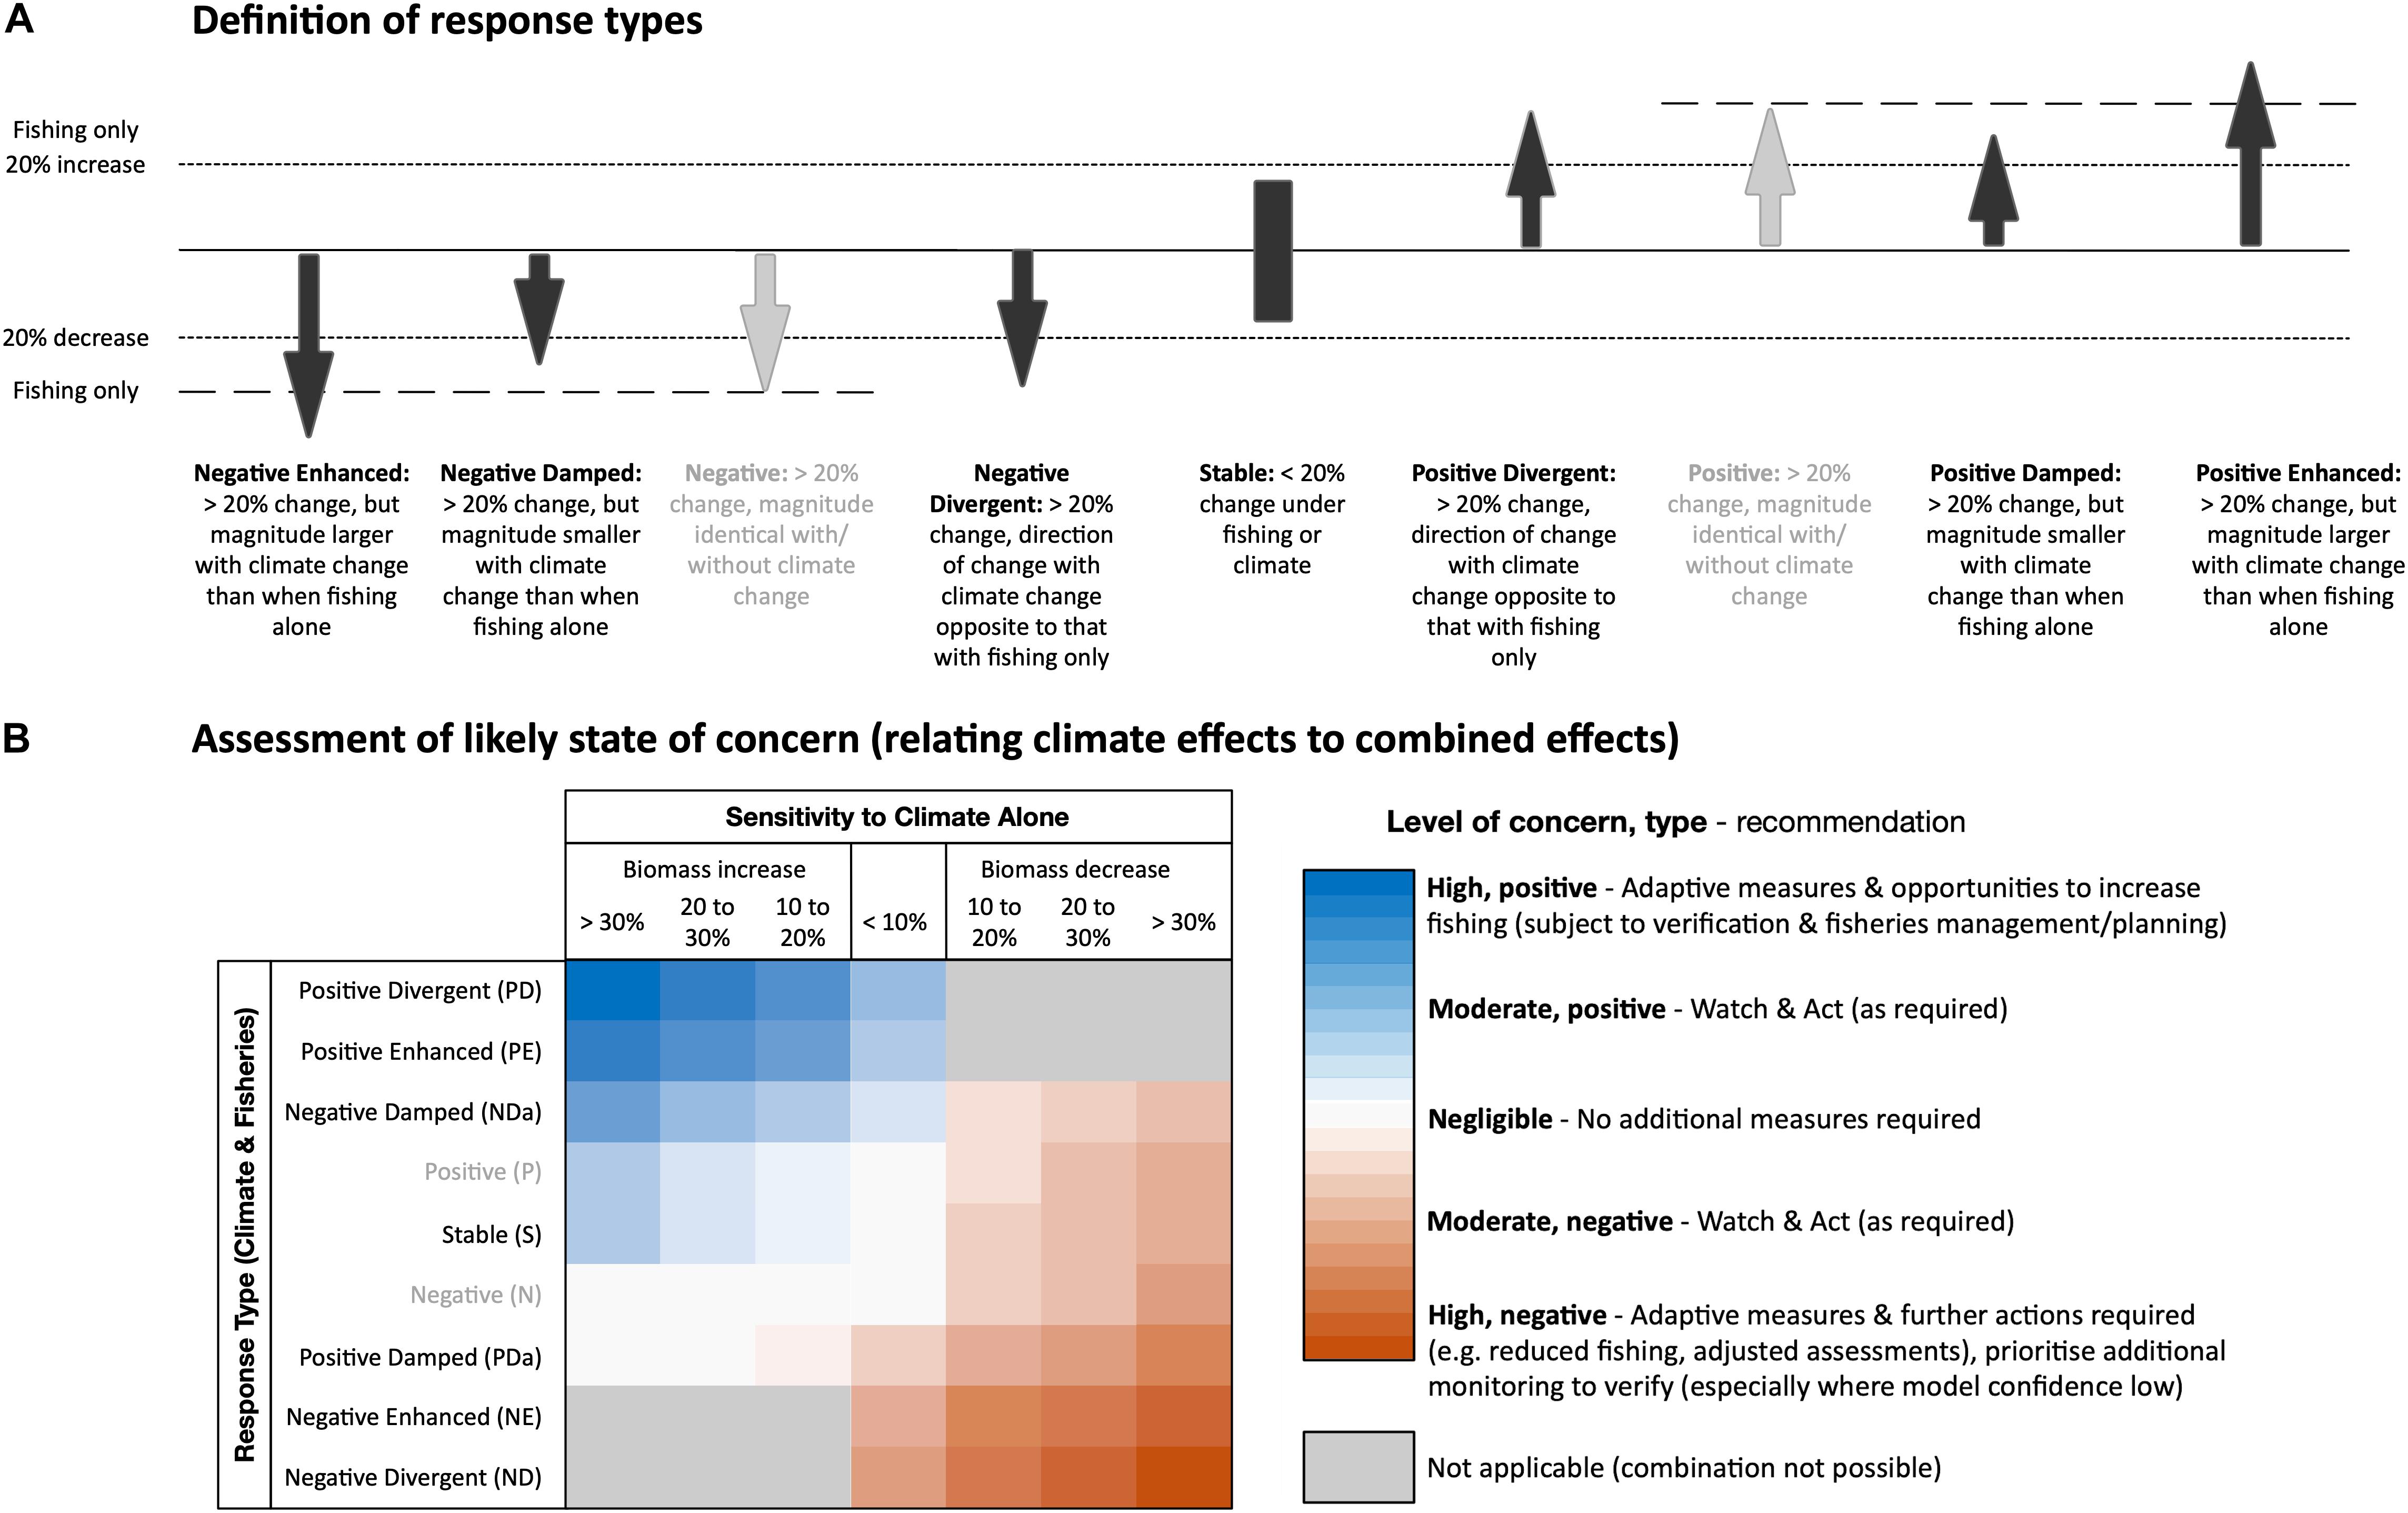
Figure 2. (A) Definitions of different responses types based on differences between biomass trends under the fisheries impacts only (control scenario) and the combined impacts of climate change and fisheries (RCP8.5 scenario) between 2045 and 2050. Response types in gray were classified as stable responses as they too represent a <20% difference in biomass. (B) Assessment of the level and type of likely state of concern for functional groups were based on classification of (1) sensitivity or scale and direction of relative biomass changes to the climate change only scenario, and (2) the response type. Dampened response may appear to sit out of order, but this is because of their response to climate alone is in the opposite direction to their combined response.
Inter-regional and global model projections of relative biomass trajectories were compared where there were taxonomic agreement and fisheries or spatial overlap. Such comparisons were relatively simple between the regional models but more challenging between the regional and global models due to differing taxonomic resolutions. Outputs of the dynamic bioclimate envelope model were compared where species could be matched specifically or to the group level (where the species was the strongest representative of the regional model group). Outputs from the global benthic-pelagic size spectrum model were compared with relative trends of aggregated biomass of different species and functional groups in regional models, to determine whether the regional directions of change were consistent with larger-scale relative changes in unexploited biomass under climate forcing alone.
Uncertainty was quantified in three ecosystem models – the two regional Atlantis SEAust models and the ensemble of dynamic bioclimate envelope models (DBEM). For the DBEM, the uncertainty was reduced by using the mean outputs driven by three Earth system models (Cheung et al., 2016b). The results per species were averaged across the three models to give the final ensemble estimate of the impacts of climate change in terms of shifts in abundance. For the regional Atlantis model, uncertainty within model projections was explicitly accounted for by making subtle changes to multiple productivity and food web parameterizations. The parameter sets used were bounded so that they were constrained only to sets that produced plausible modeled systems given the available data and alternative possible system structures (based on a pattern-oriented modeling approach given in Kramer-Schadt et al., 2007). As outlined in Fulton and Gorton (2014), the alternative diet structure was expanded to allow for diets with the potential for the level of variability observed in the North Sea and on Georges Bank over the last century. All alternative parameterizations were then all carried forward in the simulations for both the dynamic and fixed (constant) fishing versions of Atlantis-SEAust. The differences in the results between the model variants were used to examine the robustness of model results.
Uncertainty within and among the ecosystem models was translated into a qualitative evaluation of model confidence (low – medium – high; Figure 3). This confidence had two components – uncertainty due to the data amount and quality used in creating the model and uncertainty around model structure. For data uncertainty, where possible this was judged based on how well the “now” state (abundance and distributions) or historical trajectories matched available data. If this was not possible then model developers used expert judgment to rank the level of confidence in the projected species responses. In doing this the modelers considered the amount and quality of data used for model parameterization and calibration of each functional group or species. This included data directly relevant to the species (such as biological rates, diets and mortality levels), but in some models also included processes (such as environmental or habitat-mediated response functions) that influence species abundance or distribution. Process uncertainty was also assessed based on the fit to data and was treated as distinct from model structural uncertainty (explained below).
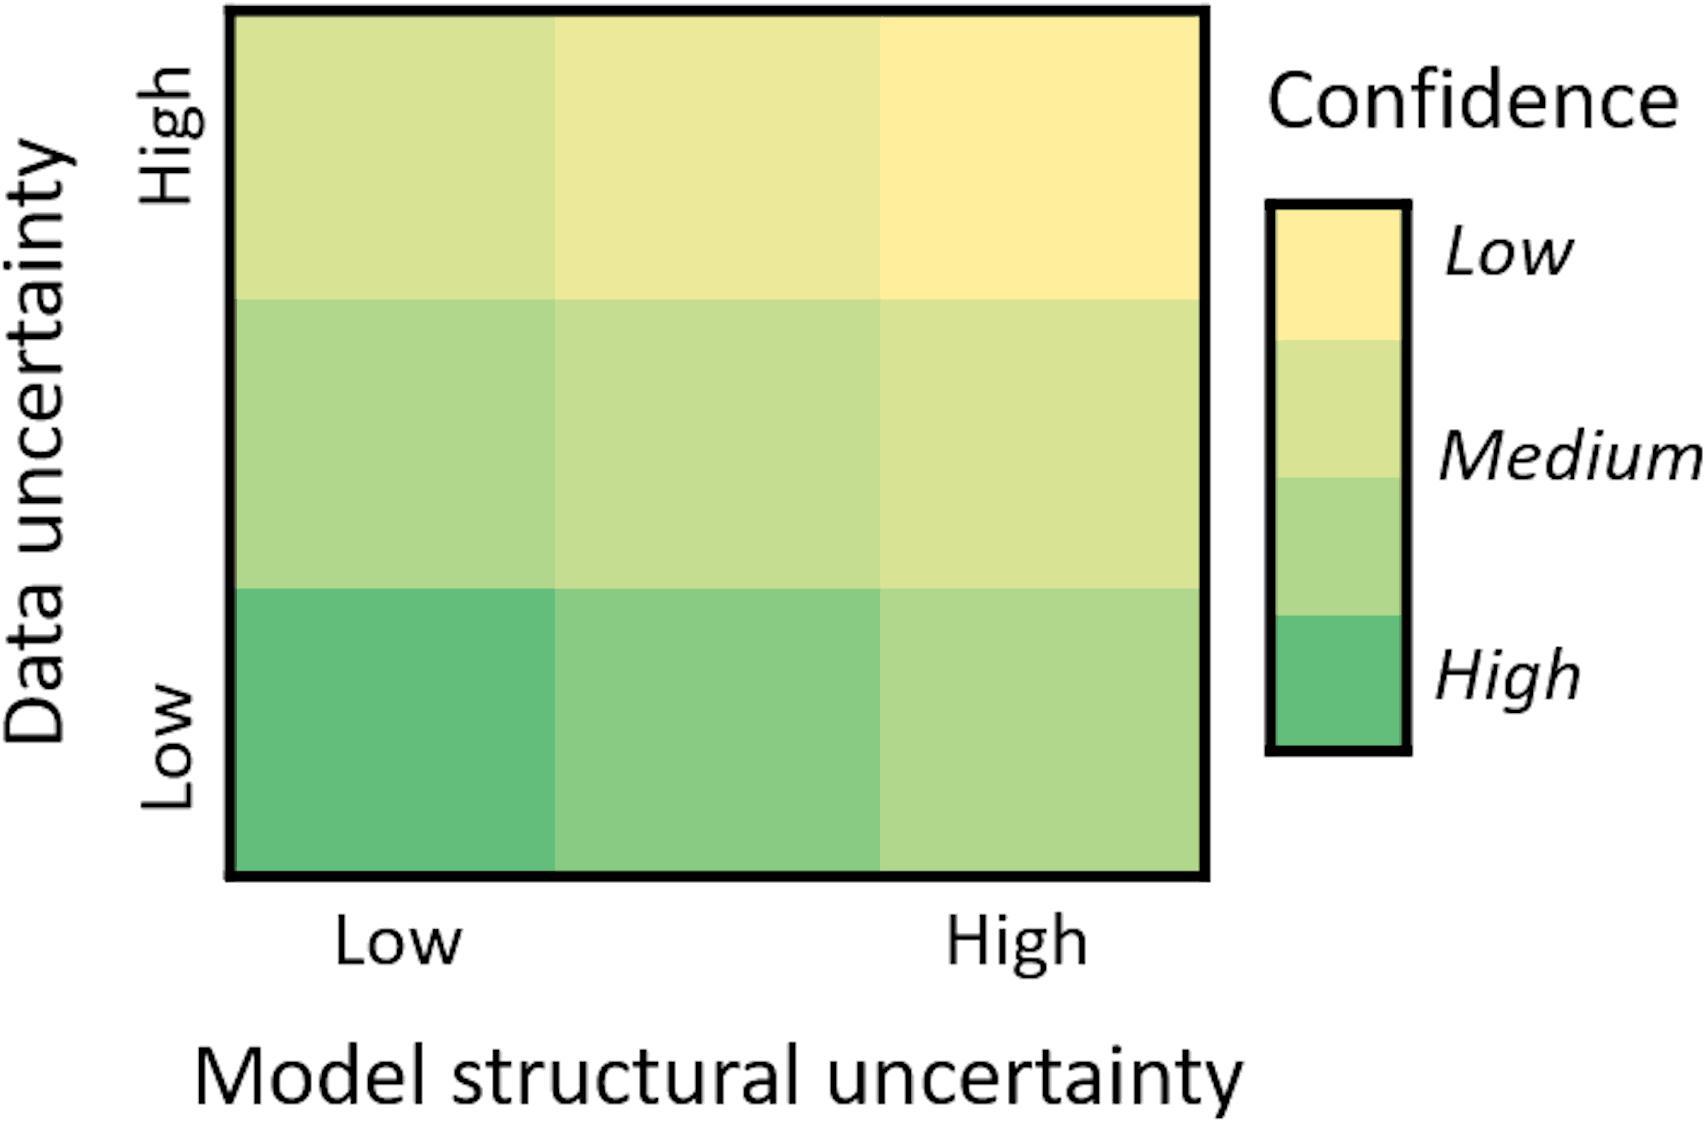
Figure 3. Evaluation of confidence in ecosystem model climate projections based on expert judgment of (1) data uncertainty considering data availability, quality and fitting, and (2) model structural uncertainty reflecting the climate drivers and spatial and processes resolution of different model frameworks.
For the regional ecosystem models, the data uncertainty comparisons were primarily based on how well modeled biomass and catch trajectories matched the available data. Where there were no or limited data, and particularly where there were insufficient time-series of biomass or catch data with which to constrain the model and improve its performance, functional group responses were classified as having high data uncertainty. Species for which modelers used a large amount of relevant data, including fitting outputs to historical time-series data, were judged as having low data uncertainty. For the dynamic bioclimate envelope model, simulated distribution maps for a particular species were visually assessed by comparing the “now state” of their distributions with distributional maps from the Codes for Australian Aquatic Biota1. Modeled species maps that corresponded well with the known distribution were ranked low to low-medium data uncertainty (this was roughly half of the modeled species). A medium rank was assigned where some part of the observed geographic distribution was missing or incorrect (this was the case for 40% of the modeled species). Species where there was significant disagreement with observed distributions were initially ranked as high data uncertainty, but ultimately these nine species were removed from further analysis as they had grossly incorrect spatial distributions or because the species did not actually occur in Australia.
Model structural uncertainty of the different modeling frameworks used was also ranked (low – medium – high) according to the degree of taxonomic and spatial-temporal resolution and representation of ecological processes (trophic interactions, dispersal, phenology, habitat associations and socioeconomics) considered most important to inferring climate-mediated changes in productivity. Higher model uncertainty rankings were given to Ecosim model implementations that have low spatial and temporal resolution and are largely determined by trophic interactions. Medium ranking was given to the dynamic bioclimate envelope models that have high spatial and temporal resolution and are driven by temperature, but lack the inclusion of trophic mechanisms. Finally, lower rankings were given to the MICE model application focused on key drivers of the population dynamics and environmental tolerances of a targeted species of interest and to Atlantis model applications that represent a greater number of ecological processes and have high spatial and temporal resolution.
Our model comparisons approach, along with a qualitative assessment of model confidence, provides a more informative reflection on the associated uncertainty around potential outcomes, cognizant of underlying model assumptions that may influence the results and conclusions.
There was a high degree of temporal variability in sea surface temperatures (SST) and primary production projections of the Australian OFAM-v3 model for both the control and RCP8.5 scenarios. Under the RCP8.5 scenario, the mean change across all the model domains between 2010−2015 and 2045−2050 was +0.8°C for SST, while integrated primary productivity declined by 5.8%. However, there were notable regional patterns for both variables and high interannual variability for primary production projections for most regions (Table 3). Slightly larger increases in SST by 2050 were observed in the South East Australia region (+1.0°C) than in the Western Australia region (+0.8°C). Mean differences in primary productivity between the control and RCP8.5 scenarios were projected to be largest for the Great Australian Bight (GAB) EwE model domain and the smallest for the Eastern Bass Strait (EBS) EwE model domain, with an average decline of 34% and 2% respectively (Table 3). Inter-annual variability was also largest for the EwE-GAB model domain and was lowest for the North West Shelf (NWS) EwE model domain.
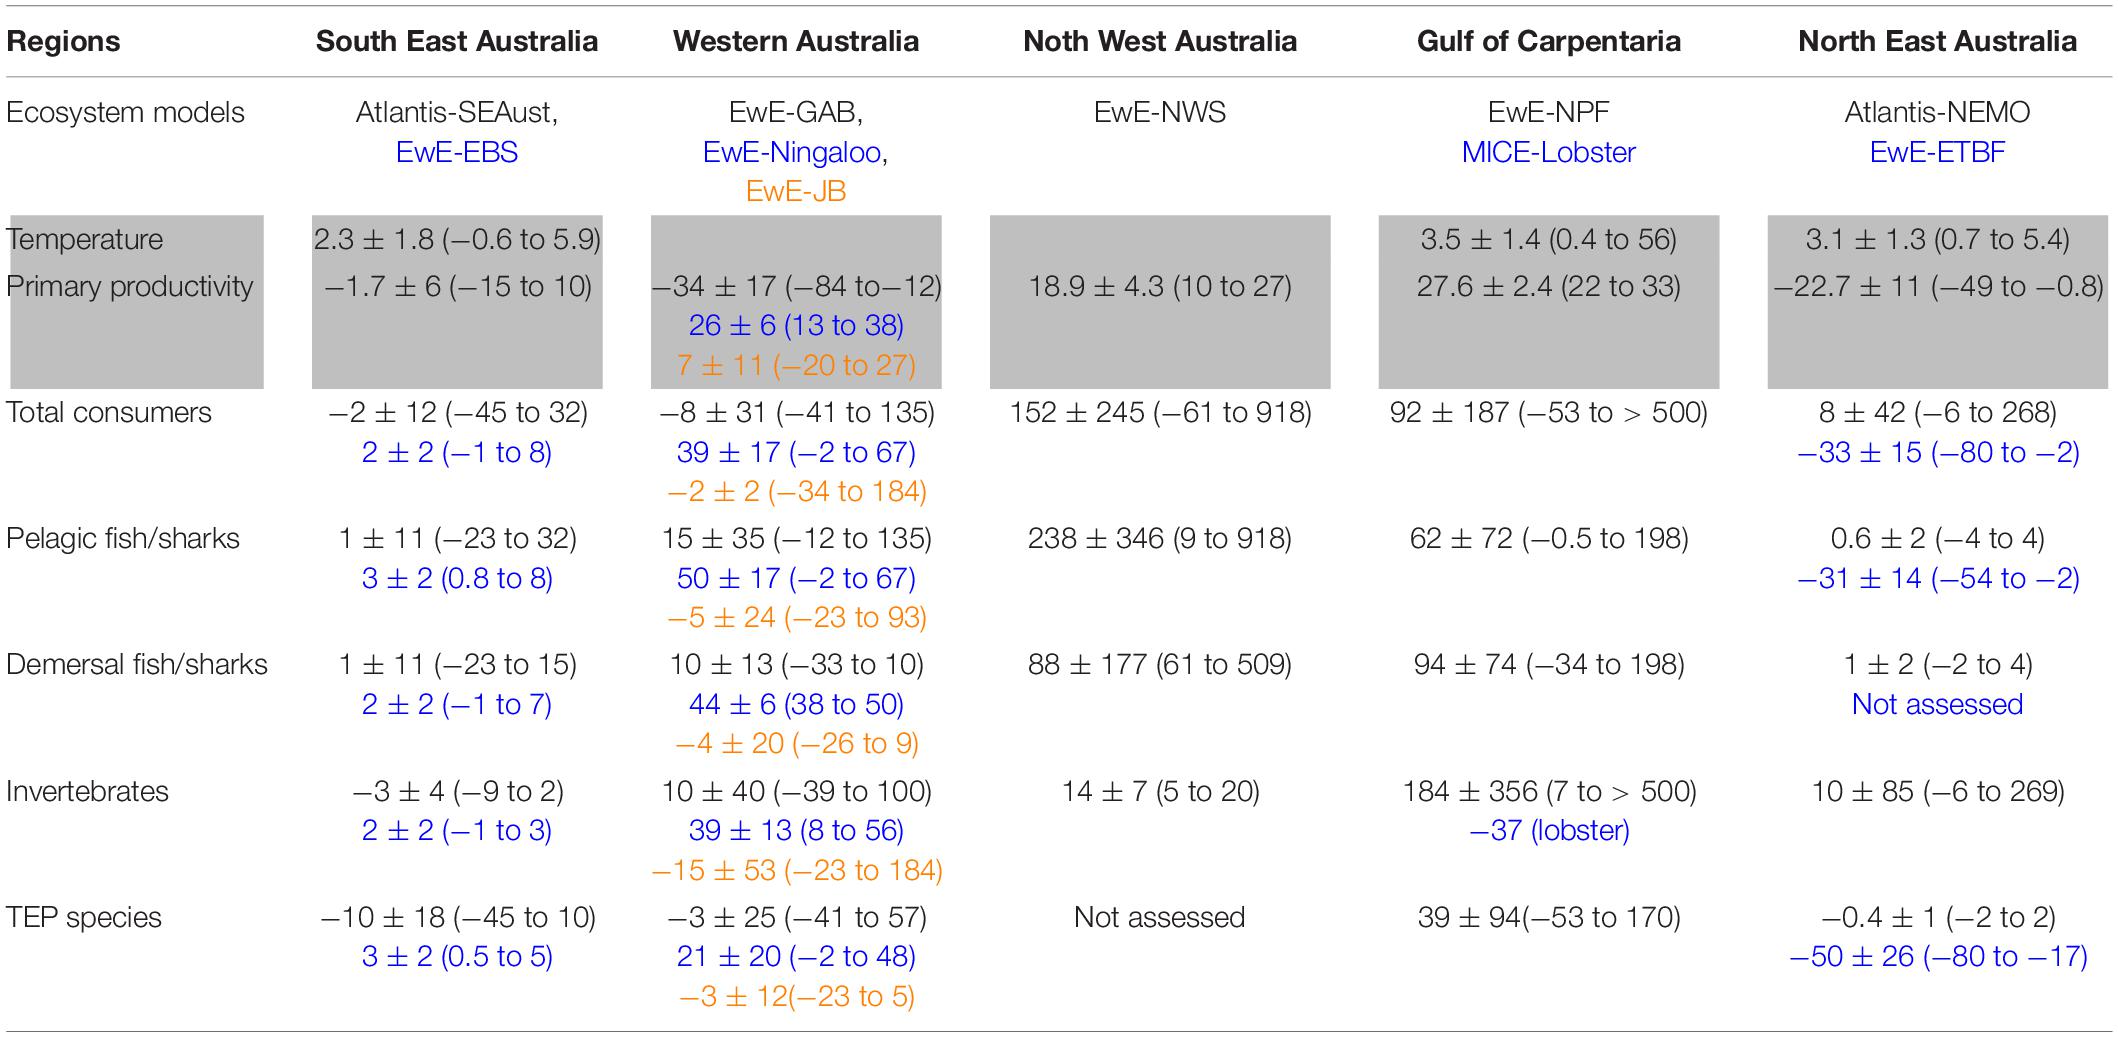
Table 3. Relative percentage changes (mean standard deviation with minimum and maximum values provided in parentheses) in regional climate and ecosystem model projections averaged over model domains between 2010 and 2050. Climate model projections of temperature or primary productivity (highlighted in gray) represent mean differences between control and RPC8.5 scenarios. Biomass changes of ecological groups represent anomalies for the climate change impact only scenario. Colored values match the color used to represent different ecosystem models in the same column.
The climate change impacts scenario resulted in a range of responses for total consumer biomass, and biomass of ecological groups in the different modeled regions and fisheries (Table 3). By 2050, climate change was predicted to negatively impact, to varying degrees, all functional groups in the EwE-ETBF model (NE Australia region). In contrast, most groups in the EwE-Ningaloo (Western Australia) models responded positively. The least sensitive model (i.e., with the smallest deviation from zero change in average biomass) was the EwE-EBS model while the most sensitive model was the EwE-NPF model. The threatened, endangered or protected (TEP) species, including mostly marine mammals and seabirds but also turtles, were projected to be the most impacted ecological group from climate change in most regions. Pooled invertebrate and demersal fish and shark groups typically saw greater declines than pooled pelagic fish and shark groups, particularly in Western Australia.
Across all the regional models, more than half the examined functional groups (328 of the total 678) were predicted to be relatively stable and unaffected by the RCP8.5 (combined climate change and fisheries impacts) scenario, with changes between −20 and 20% from initial biomasses (Figure 4). There were 186 groups that showed biomass increases, and 51 groups that showed biomass declines, of between 20 and 40%. A further 15 and 46 groups showed positive and negative changes of between 40 and 60%. The groups projected to decline in biomass >60% in response to both climate change and fishing in 2045−2050 included demersal fish, dogfish sharks, rock lobster (SE Australia), reef-associated zoobenthic fish, corals and sponges, seagrass associated carnivores, and squid (W Australia), prawns, crabs, and small sharks (GoC) and turtles, seabirds, swordfish and tuna (NE Australia) (Supplementary Table 1). Under the climate change impacts scenario, only 3 groups declined > 60% including turtles and shelf Lutjanids and 13 groups decline between 40 and 60% including seabirds, whales, dugongs, small pelagic and shelf fish, and Carangids (Supplementary Table 1). Groups projected to show the largest increases in relative biomass under the climate impact scenario included jack mackerel, anchovy and demersal shelf fish (SE Australia), crabs and bugs, squid, and spantangoids (W Australia), small tunas and shelf Serranids (NW Australia), prawns and crabs (GoC) and lobsters and squid (NE Australia) (Supplementary Table 2).
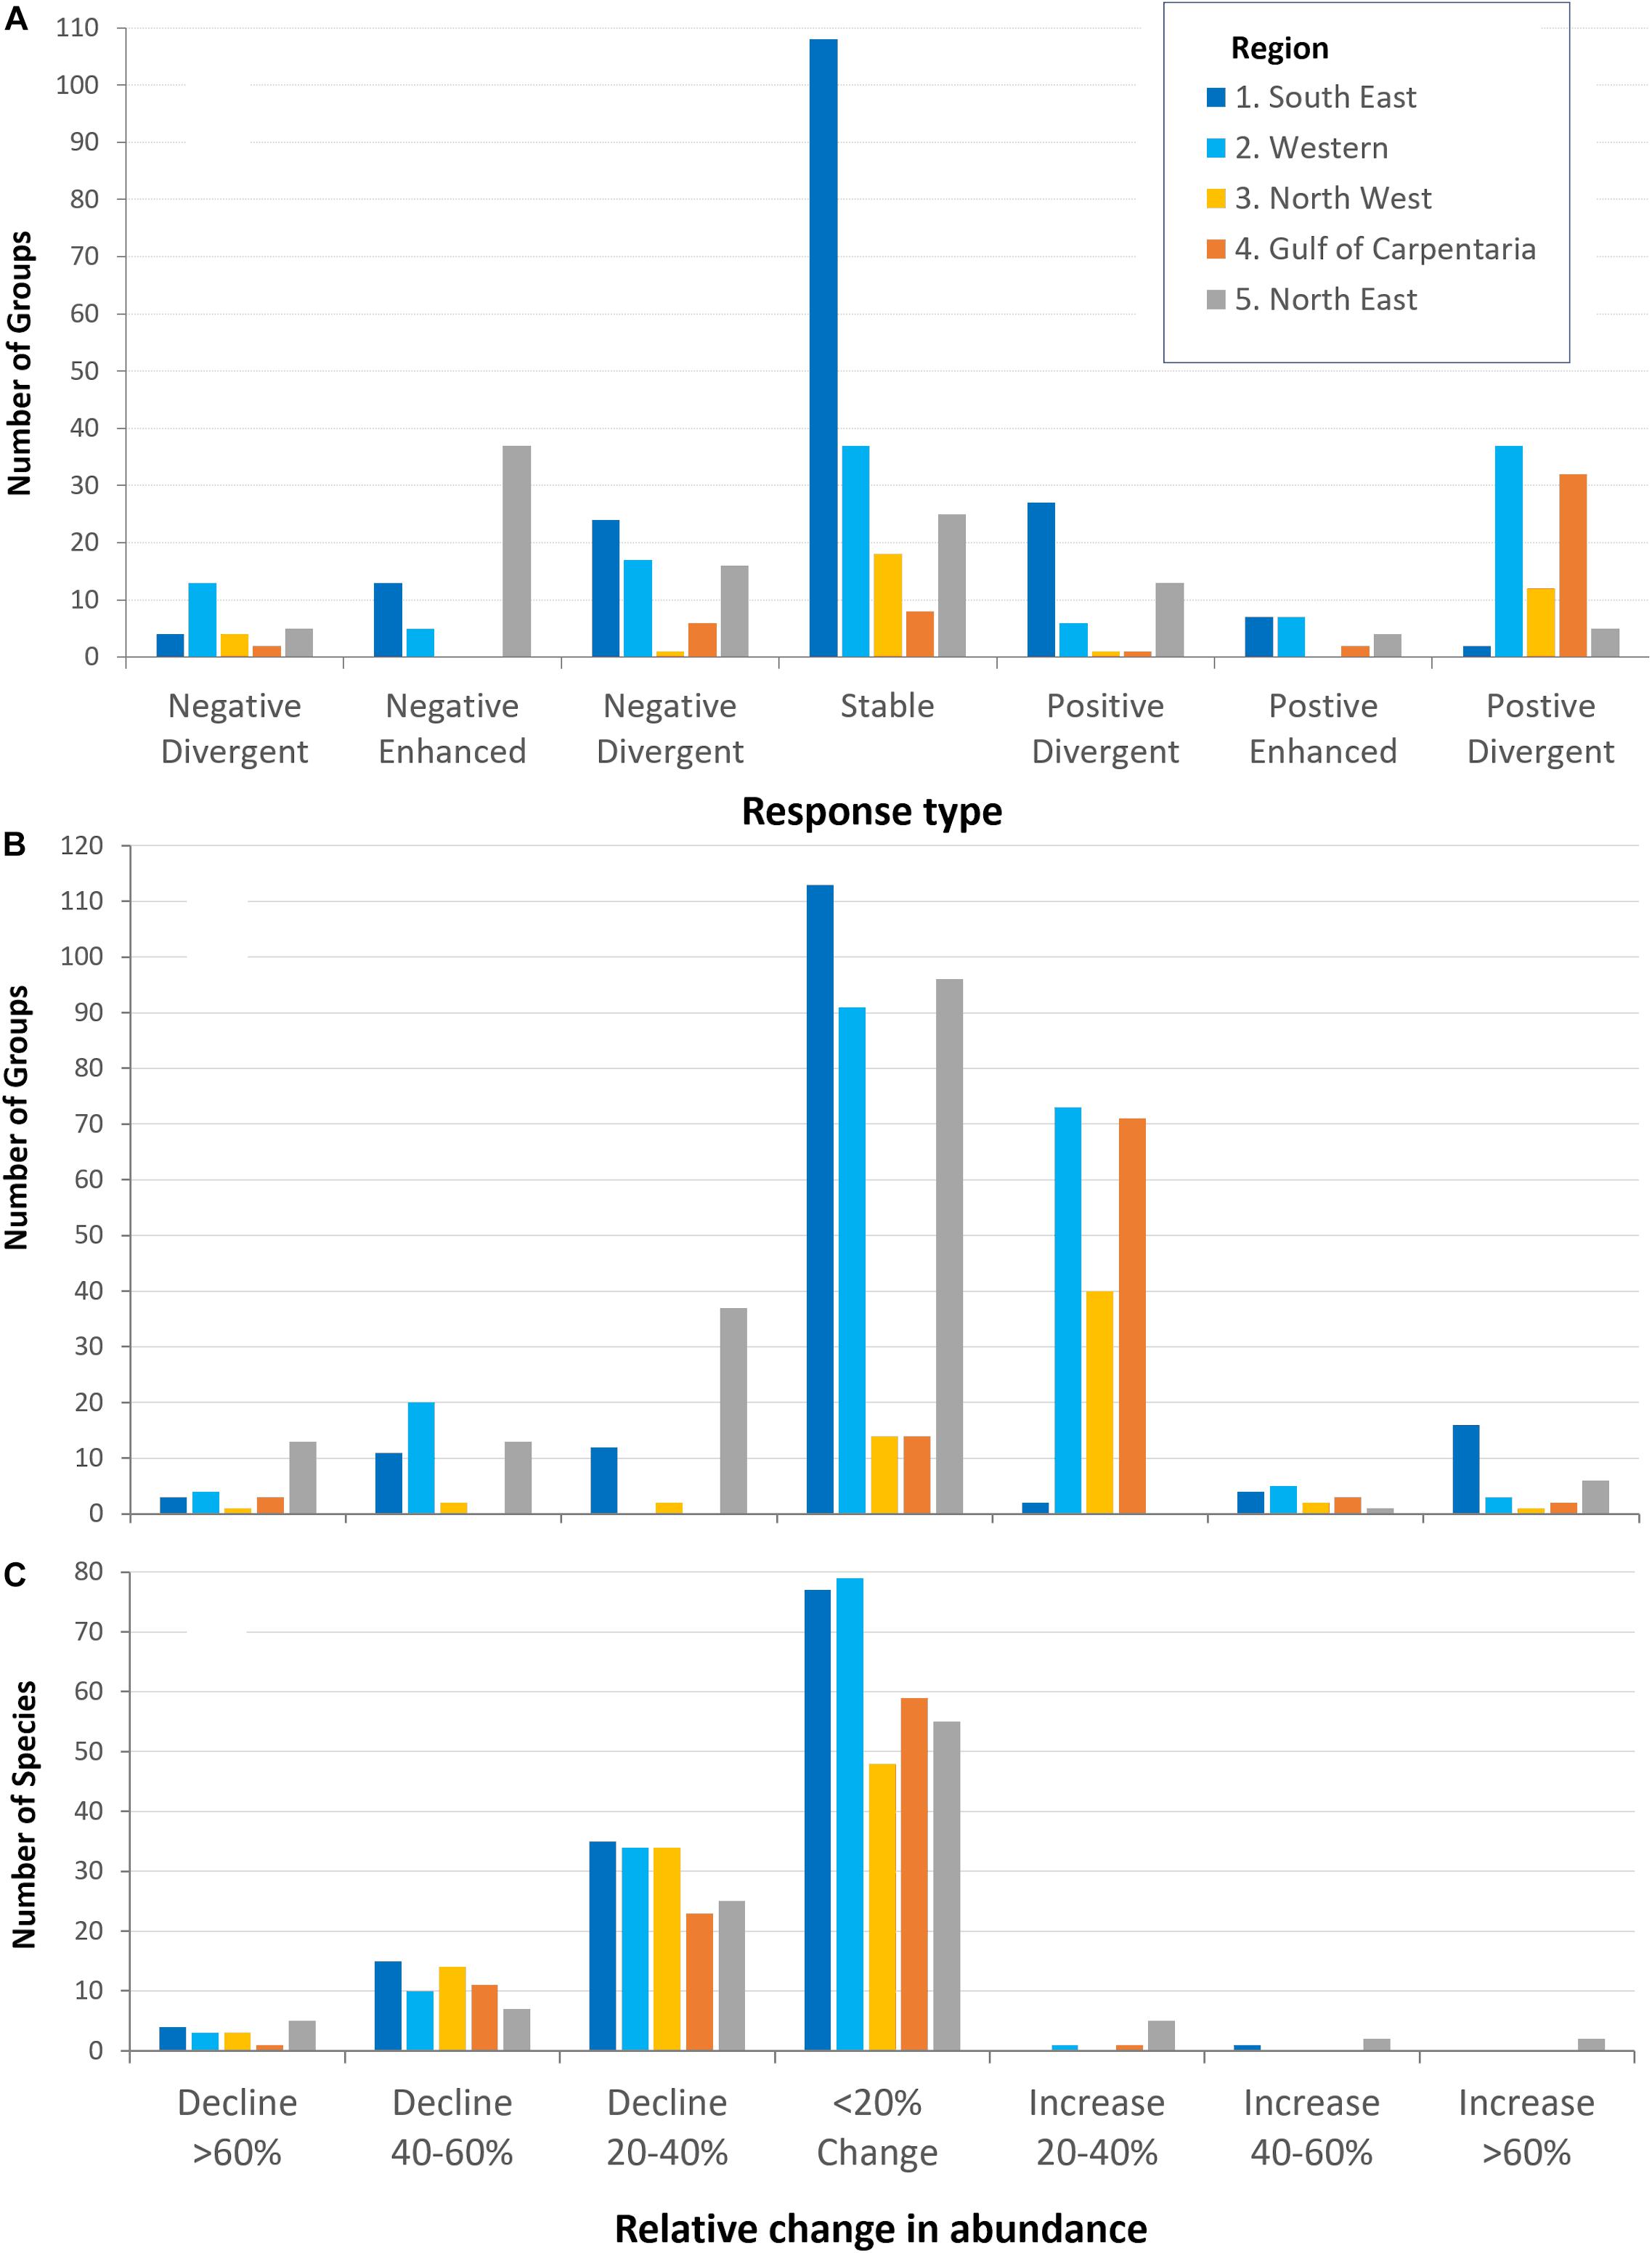
Figure 4. Projected response types or abundance changes (sensitivities) to RCP8.5 greenhouse gas emission scenario (combined response to fisheries and climate change) for different assessment regions around Australia based on (A,B) regional ecosystem models with trophic linkages (on functional groups), and (C) species distribution models without trophic linkages (on individual species).
There were 55 and 20 groups that showed enhanced negative and enhanced positive responses respectively (same direction but larger rates of change under climate change than fisheries) while a further 28 and 88 groups showed negative and positive divergent response patterns (Figure 4A). The assessment of the likely state of concern indicated that there were 13 groups of high negative concern (with > 40% sensitivity and divergent or enhanced negative responses) and 3 groups of high positive concern (Supplementary Table 3). Listed among the groups of most likely concern with respects to negative climate change impacts included small pelagic fish (medium confidence), pelagic and deep demersal sharks (medium confidence), piscivorous fish (medium confidence), and bight redfish (low to medium confidence) in SE Australia; dhufish and pink snapper (medium to high confidence) in SW-W Australia; and large sharks and marlin (medium confidence) in NE Australia. TEP species of highest negative concern (with medium to high confidence) included albatrosses, bottlenose dolphins, and penguins (SE Australia), dolphins and dugongs (W Australia), dugongs (N Australia), and seabirds, leatherback and green turtles (NE Australia). In the medium term (2030−2035), groups of higher negative concern included lobster (high confidence), morwong and gummy shark (medium to high confidence) (SE Australia), reef associated zooplankton feeders (low confidence) and lutjanids (medium confidence) (W Australia), all the prawn species (medium confidence) (GoC), and swordfish and sailfish (low to medium confidence) (NE Australia). Groups or species of highest positive concern from climate change impacts (with positive enhanced or divergent responses and large increases in relative biomass) included small and large pelagic fishes (anchovy, sardine and tuna) in the SE Australia (medium to high confidence), shallow demersal fish and trevallies in Western Australia (medium confidence), tunas, rays, sweetlip and red emperors in NW Australia (low to medium confidence), and bigeye tuna and squid in NE Australia (medium confidence). Time-series plots for each functional group are provided for each model in a technical report (Fulton et al., 2018a2).
The benthic-pelagic size spectrum model projected temporal (5-year) changes in the relative biomass of 6 size-based ecological groups to the RCP8.5 scenario for each of the assessment regions (Figure 5). The ecological group with the most consistent decrease, typically <10%, across all regions was pelagic predators >10 cm (all age groups combined) with biomass declining in all regions except the Gulf of Carpentaria. In contrast, benthic detritivores >30 cm were projected to increase in all regions, though again only by modest amounts (typically < 10%). Total system biomass was projected to decrease in all regions, although there was variability in this general trend across spatial regions (e.g. the Torres Strait and oceanic areas across much of southern Australia increased).
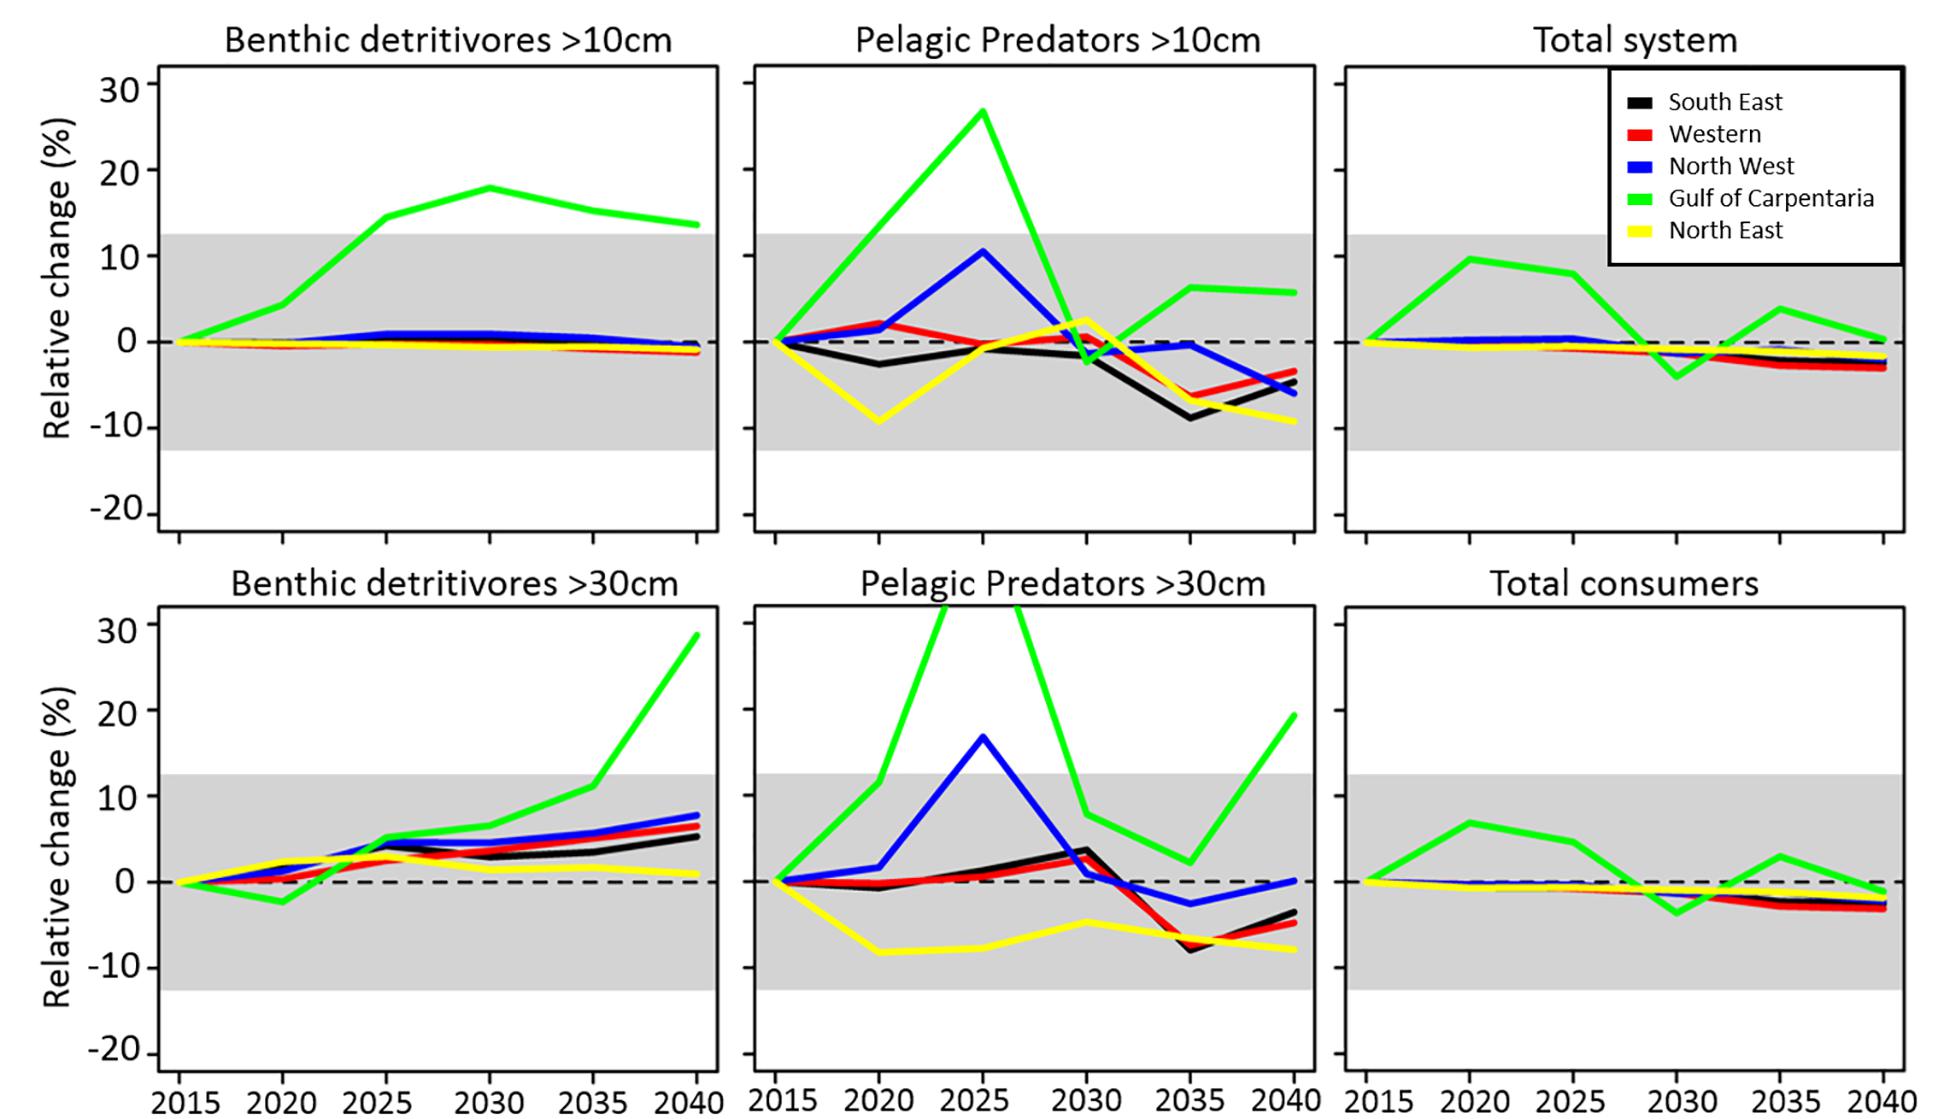
Figure 5. Global benthic-pelagic size spectrum model projections of relative changes in biomass density of different model groups at 5-year intervals for each Australian region under the RCP8.5 scenario without fishing. These model outputs therefore represent relative changes in the unexploited baseline of biomass due to climate forcing alone.
Across all regions, the ensemble of dynamic bioclimate envelope model simulations projected declines in relative abundance for most species, with only 31 species projected to increase (Figure 4C). The species with high model confidence, that were projected to be among the most negatively impacted from climate change included: blue endeavor prawn (regions 1, 3, and 4), bartail flathead (regions 1, 2, 3, and 5), big eye tuna (region 3 and 5), dusty whaler (regions 3 and 4), golden snapper (region 2), giant trevally (region 4), and queenfish (region 5). Key Commonwealth fishery species that were predicted to see large positive increases in relative abundance due to climate change only, with moderate to high model confidence, included Australian sardine (regions 1 and 5), gemfish (region 1), and blue mackerel (region 5). Relative changes in abundance for Commercial species are provided in Table 4 while model projections and maps for all species are included in a technical report (Fulton et al., 2018a).
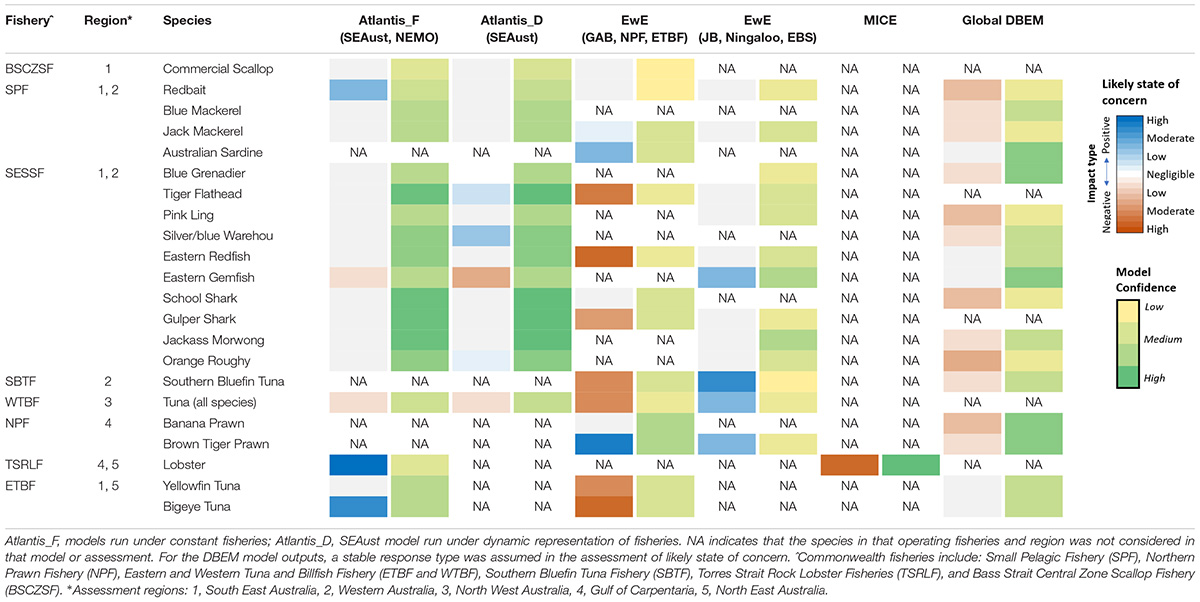
Table 4. Inter-model comparisons of the projected likely states of concern to climate change in key commercial species at the end of 2050 and the associated level of confidence.
Amongst the species that are the focus of Commonwealth fisheries there was moderate to strong agreement between models with geographic overlap (Table 4). There was particularly high model-model agreement for species or functional groups that scored high in the confidence assessment (had low data uncertainty) and where the models contained both trophic, life-history and distribution mechanisms. In South East Australia, all 3 ecosystem models suggested that piscivorous shelf fishes (including flathead, gemfish, and demersal sharks) were among the most negatively impacted by climate change. There was also model agreement that small pelagic fishes such as jack mackerel, blue mackerel, anchovy, and sardine were among those projected to increase in biomass under climate change. In Western Australia, the EwE models projected that pink snapper, rays and dhufish would be negatively impacted, while reef associated zoobenthos, breaksea cod, tuna and billfish, as well as mackerels would likely increase in biomass. In North West Australia, the EwE-NWS projected negative impacts of climate on bream, snappers (Lutjanids), carangids and lizard fish, and positive relative biomass shifts on tunas, seabass and groupers (Serranids), as well as red emperor. In the Gulf of Carpentaria, the EwE-NPF model indicated the relative biomass of most groups, including prawns and crabs, would likely increase with negative impacts only projected for reef-associated carnivorous fish. For the North East Australia, the Atlantis-NEMO model projected negative impacts on large pelagic sharks, and small planktivorous fishes and positive impacts on macrobenthos and squid. The EwE-EBTF projected enhanced negative responses from large pelagic fishes including spearfish and swordfish. For yellowfin and bigeye tuna they predicted opposite trends, most probably due to assumptions with regard to diet switching. Very different biomass trends of tropical rock lobster were projected between the Atlantis-NEMO model (large increase) and the more targeted lobster MICE (large decline).
There was often a divergence between model projections of the regional models and the ensemble of global dynamic bioclimate envelope models (DBEM) (which do not include any trophic interactions), even where there was a high confidence and good match to current observations. This was particularly true for several small pelagic and demersal fish species, such as Australian sardine and Eastern redfish. Moreover, the DBEM generally tended to suggest higher sensitivity and more negative responses than the regional models (Figure 4B). Poor or mixed agreement between the model outputs were typically seen for shallow shelf demersal stocks and many of the invertebrates, which are often poorly constrained and only generally parameterized in the trophic models (i.e., have low confidence scores). Projections of habitat-dependent species (such as emperors and snappers) also varied between models that did and didn’t explicitly represent habitat connections.
Outputs from the global benthic-pelagic size spectrum model (DBPM) can only be compared with other model outputs in terms of relative trends of aggregated biomass of different species. Whilst there was a large range of responses observed spatially and across species and functional groups for each of the regional models, there was agreement of the direction in total system biomass with the DBPM regional outputs (Figure 5 and Table 3). An opposite general trend seems evident for predictions of benthic detritivores where regional ecosystem models projected some declines in group biomasses.
Atlantis SE Australian simulations under dynamic fishing management saw fewer harvested species negatively impacted by climate change over both the short and long terms compared to constant fishing effort that was applied to all other regional models (Supplementary Table 1). For example, grenadier, warehou, jack mackerel and school shark fared better in the Atlantis SEAust dynamic fisheries and management model (Table 4). In contrast, the results for invertebrates and TEP species were more variable and uncertain. This reflects the capacity of the simulated fishers and management bodies within the model to adapt to the changing conditions and mitigate negative outcomes.
Over the next century, the marine ecosystems of Australia are expected to exhibit some of the largest climate-driven changes in the Southern Hemisphere (Creighton et al., 2016; Hobday et al., 2018; Fordyce et al., 2019). Our multi-model projections provide the most comprehensive outlook on potential climate-driven ecological changes on Australia’s large-scale Commonwealth fisheries stocks to date. Using multiple ecosystem models, that encompassed different assumptions and covered the entire Australian coastline, allowed for a broader view of the potential futures for Australia’s fisheries – identifying the level and type of concern for commercial stocks to climate change with an accompanying measure of confidence. This information helps managers and the fishing industry to be better prepared over the next 30 years by highlighting those species that may be at risk and those that might benefit from climate change. Results presented here also provide recommendations that can help shape future management and prioritize research directions – both to guide alterations in management to allow for greater adaptation to changes in the fisheries and to identify actions that can help clarify what is occurring and reduce uncertainty.
Consistent with previous ecosystem modeling work, the direction of response to climate drivers seems to be species- and system-dependent. We found that both temperate and demersal systems are likely to be more strongly affected by climate change than tropical and pelagic systems which is in line with previous vulnerability analyses (Pecl et al., 2014, and updated in Fulton et al. (2018a)) and climate-ecosystem model assessments (Brown et al., 2010; Fulton, 2011) of Australian ecosystems. In addition, nearly all models in our study predicted that coastal or shallow water species, and particularly benthic invertebrate species, such as lobster, were among the first to respond and to the largest extent. This probably reflects the more responsive life-history traits of invertebrates, compared to sharks and most fish, which make them more sensitive to sequences of stochastic events such as marine heatwaves (Hobday et al., 2018) projected in the immediate and near future. Some of the models were also able to reflect that many benthic invertebrates live in shallower waters, which may provide less buffering from temperature-driven changes and/or are dependent on particularly vulnerable habitats (such as reef structures or seagrass), which are more sensitive to changes in temperature (Babcock et al., 2019), whereas many large pelagic species are cosmopolitan and roam over ocean basins.
Some of our single and multiple model results suggest that the coming decades may prove to be challenging for Australian fisheries operators and managers, particularly as there is a strong reliance on seafood sourced from demersal food webs. All regional models in this study showed that the combined effects of fishing and climate change are often non-additive (synergistic or antagonistic), as has been shown previously for south eastern Australia (Griffith et al., 2012; Fulton and Gorton, 2014) and in other areas of the world (Mackinson et al., 2009; Travers-Trolet et al., 2014; Fu et al., 2018). Our categorization of the responses of species groups to climate drivers, and the interplay with fisheries on the ecosystem, can be used to prioritize management decisions at a species and regional level. For fishing stocks ranked as high negative concern, the utilization of combined ecosystem-based, adaptive and co-management approaches are likely to be the best ways of enabling climate change adaption, as they have already been shown to be particularly promising in Australian fisheries (Ogier et al., 2016).
From our study, biomass changes most likely to worry management and fishing industry are those to do with climate mediated declines where a species decline only occurs, or is greater, under scenarios of climate change rather than just fisheries alone (response types ND and NE). While including recognition of climate effects in assessments (e.g. Wayte, 2013; Ianelli et al., 2016) and on reference points (Holsman et al., 2016) is a direct means of folding in climate considerations, responses may need to go further. Moreover, it is recognized that it is challenging to explicitly incorporate climate drivers in stock assessment models that can reliably be used in forward projections. A preferred approach is to use Management Strategy Evaluation (MSE) to test the robustness of Harvest Control Rules (HCRs) to climate variability (Plagányi et al., 2019), as applied using MICE in the Northern Prawn Fishery (Plagányi et al., 2013).
Across our models, nine species were categorized as being of high negative concern due to climate change, including mostly demersal fish species and sharks. Future management plans for stocks affected to this degree will likely need to incorporate climate adaptation approaches that rapidly increase their adaptive or absorptive capacity. While adaptive management approaches used for these species are likely to facilitate some adaptation (Melnychuk et al., 2014), further action may be needed to provide the species greater capacity to cope with the combined pressure of climate and other anthropogenic pressures, such as reducing what is considered acceptable levels of fishing pressure and/or increasing protection measures to ensure future sustainability.
Different management approaches are recommended for stocks that are likely to benefit from climate change and to have highly positive responses under combined impacts of fishing and climate change (response types PD and PE). In our study, this categorization was given to three pelagic fish groups (anchovy, sardine, and tuna) in the SE Australia region which managers could seek to increase fishing effort or promote new commercial opportunities in the future. However, before implementing any changes to existing management, more targeted consideration of species responses is needed, including scrutiny of spatial variability, which although represented by some ecosystem models (Atlantis and DBEM) are likely to need further refinement given the level of data available to condition these models. Our results also noted that many fishing stocks transition through different likely states of concern over time and are currently observed to have only undergone negligible or low to moderate levels of change, which demonstrates the need for fisheries management to be as flexible as possible. The complexity of possible stock responses shown among the ecosystem models also highlights the strong need to incorporate uncertainty information.
Identifying, quantifying, and reporting multiple sources of uncertainty is a key step for multiple and ensemble ecosystem model predictions to be taken up and used effectively by fisheries managers and policy makers (Payne et al., 2016). This includes the inclusion of regional and global ecosystem model results in future IPCC assessments that currently only report results from the global ensemble of dynamic bioclimate envelope models (DBEM) (IPCC, 2018). While such species distribution models have been shown to provide reliable predictions of both abundance and distribution for targeted and data-rich species (Cheung et al., 2011), our study demonstrated large discrepancies between these model results and those that incorporate trophic interactions for Australia. For example, jack mackerel increases in Atlantis-SEAust but decreases in the DBEM. Both are spatial models, allowing for range shifts, but trophic interactions (starting from interannually variable seasonal plankton blooms in Atlantis) enable the pelagic food web, including jack mackerel, to be supported and this compensates for any loss in individual response rates due to thermal conditions moving into sub-optimal conditions. In contrast, the DBEM is heavily influenced by the environmental conditions alone. Only by stepping through and acknowledging the various major sources of uncertainty, such as the structural uncertainty introduced by the processes that are or are not represented, will we be able to obtain more robust and meaningful ecosystem and species projections.
The first source of uncertainty to consider is that related to climate projections of the ocean forecasting or global climate model(s). All climate models typically predict temperature with much more confidence than primary production (Laufkötter et al., 2015) which has notable flow-on effects to the different ecosystem models. For example, drops in production were projected by the coupled OFAM-production model for many of the EwE model domains. However, while Atlantis did see declines and changes in plankton composition, that were in rough alignment with what was seen in the OFAM-production model it was not an exact match – partly due to a different spatial resolution, but also due to additional variability induced by top-down, predator mediated processes not represented in the OFAM-production model. This is not to say Atlantis is more accurate than the OFAM-production model, just that it highlighted another potential source of uncertainty. In addition, the spatio-temporal scale at which climate projections are provided have flow-on implications with higher confidence likely provided for downscaled regional than global climate models and for those ecosystem models that reflect finer (daily to weekly rather than monthly or seasonal) temporal dynamics. In this study, the degree of change in the climate forcing variable largely determined the direction and magnitude of broad system outputs of the regional ecosystem models which has been noted in other ensemble ecosystem modeling studies (Thuiller et al., 2019). In some regions, such as the Great Australian Bight, larger variability in annual mean primary productivity anomalies meant that predicted responses of fishing stocks and other ecosystem components were also highly variable. In contrast there were only small changes in primary productivity and thus biomass projected in eastern Bass Strait, Torres Strait, and Ningaloo Reef EwE model domains. In regions where primary production is predicted to increase, typically we saw an increase in commercially harvested and TEP species under the climate change scenario, as observed by Brown et al. (2010). In the future, uncertainty of climate model projections should be incorporated by undertaking multiple ecosystem modeling runs that span upper and lower confidence intervals of the climate model outputs.
Uncertainty related to the availability and quality of data or knowledge used to parameterize ecosystem models needs to be carefully considered, even where there is good model-model agreement. Acknowledgment of such uncertainty is important because previous work has shown that ecosystem models can be quite skillful, but in the absence of data for a specific group they may only be producing a plausible system not one reflective of reality (Olsen et al., 2016). In this study, higher incidences of model-model discrepancy were noted for data-poor lower-trophic and invertebrate functional groups with less taxonomic resolution. For such data-poor species assessment tools such as qualitative models (e.g. Dambacher et al., 2009) or trait-based sensitivity or vulnerability assessments (e.g. Sunday et al., 2015) are likely to provide additional or higher levels of confidence than more complicated ecosystem model outputs alone. Another important factor to consider is that biological data (e.g. size at maturity, growth rates, diets) used in the ecosystem models typically come from disparate data sources and may be out-of-date in fast-changing areas. This also highlights the need for all ecosystem models to be periodically updated, assessed and refined (every 5–10 years) if they are to continue being effective strategic tools for management and policy decision making. Whilst not every component of the ecosystem can be studied, rankings of data uncertainty and model confidence should be used to determine which species or functional groups to prioritize monitoring or data collection programs, particularly if it is deemed to be of high level of concern. Whereas the qualitative confidence assessments used here provided a reasonable and rapid check when comparing model-model outputs, in the future more rigorous pedigree routines undertaken during model development could be used such as those presented for EwE (Christensen et al., 2005) and Atlantis (Pethybridge et al., 2019), in addition to the reporting of model skills statistics (e.g. Olsen et al., 2016).
A particularly challenging source of uncertainty to account for when comparing model outputs is related to the core assumptions and structure of the modeling framework which includes differences in model processes considered and taxonomic, temporal and spatial resolution (Table 1). In this study, the greatest model discrepancies were found between the regional ecosystem models that represent trophic interactions and the ensemble of dynamic bioclimate envelope models (DBEM). Around a third of the species represented by the DBEM simulated negative responses to climate change, while regional ecosystem models predicted a broader range of both potential winners and losers (Figure 4). These results suggest that indirect climate effects through changing trophic interactions, such as changing predation pressures, play an important role in mediating the sensitivity and impacts on many marine species and thus are crucial to consider in future climate projections. This has broader management implications because of the complex interactions between species and highlights the importance of using multiple modeling approaches to explore ecosystem responses to future climate and fisheries scenarios.
Another source of model-model discrepancy was between some of the EwE and Atlantis regional models, particularly for the NE Australia region. While both models were set up with the primary purpose to assess tuna population dynamics, the Atlantis-NEMO model domain is larger covering more oceanic habitats. NEMO projected an increase in many of the tunas, as they shift with the conditions and congregate on prey fields along oceanic fronts, whereas the EwE-EBTF model (which was forced by a primary production anomaly estimated for a static geographic location) saw the same tuna species decline. Such a result demonstrates the value in acknowledging that inconsistency in the degree of spatial overlap and resolution, or vastly different representation pf physical forcing and ecological processes (trophic interactions, dispersal, phenology, habitat associations and socioeconomics), will create very different responses for particular species for which these processes are important and should be reflected in confidence ratings provided alongside projected outcomes. Extending the EwE models by implementing their spatial modules (Ecospace) may address the spatially mediated results where prey availability influences abundance and lead to less divergence in outcomes (Steenbeek et al., 2013; Christensen et al., 2014). However, that is not guaranteed for species such as squids and mesopelagics, where depth mediated processes are involved (which Ecospace does not resolve) or if the responses are due to bottom-up primary production processes. Another discrepancy was the opposing direction of change in the biomass of tropical rock lobster projected by the MICE (decline) and the Atlantis-NEMO (increase) model, demonstrating that managers should acknowledge model confidence rankings. High rankings were given to projections of the MICE as it is focused on representing the main species relevant processes and environmental drivers and is closely fit to data, whereas very limited empirical data was used to represent lobster (as 1 of 58 groups) in the NEMO model, with mortality due to heat stress also not modeled.
A final source of uncertainty stems from being able to reflect in ecosystem models the adaptive capacity of human users and the role of management in mitigation or even interventionist actions. Representing adaptive HCRs is a useful elaboration many models could include, even if the HCRs are applied using simple measures of fishing mortality F such as dynamic location choice method (Plagányi et al., 2013), rather than explicitly modeling the full fishing effort dynamics which can include different fleets and gear types (as can occur in Atlantis, Fulton et al., 2014). A lot of attention in fisheries science and ecosystem modeling has gone into capturing dynamic ecological responses, less so into human dynamic responses. Over the past couple of decades the number of bioeconomic and effort dynamics models have grown considerably (e.g. Nielsen et al., 2018), but currently few ecosystem models are capable of representing socio-economics and human behavior, with the Atlantis-SEAust model being one of the first. This is a rapidly advancing space, with many more models likely to have some capacity in this area in the near future, benefiting from increased attention being placed on understanding fisher behavior and the feedback between human users and ecosystem dynamics (e.g. Van Putten et al., 2018; Bourdaud et al., 2019).
The move to more consideration of human components is important as comparison between the Atlantis-SEAust model run with a fixed fishing mortality and with dynamically responding fisheries illustrated that there is the capacity to avoid fisheries activities amplifying climate effects through adaptive management and autonomous fisher responses. Some of the model responses included shifting fishing patterns (spatially or in terms of species fished) and management restructuring to support ongoing recovery from past overfishing and relieving pressure on species declining due to climate change. The Atlantis-SEAust model also illustrated that with human adaptation, and sustainable, economically viable fisheries can be maintained over the next few decades with little radical change for many species. However, to have “ensemble level” confidence in these results more models will need to include dynamic representations of fishing and management activities.
While we recognize that greater uncertainty quantification is needed, our model projections and assessments of the likely state of concern and model confidence do provide new insight into how Australia’s fishing stocks may respond to projected climate change in the future. These findings are much more relevant to regional fisheries management around Australia than those previously provided by the FISH-MIP global studies. The high occurrences of low confidence projections in this study, typically associated with data-poor species, clearly point to the need for greater data collection and research on lower trophic and invertebrate species around much of Australia. Low confidence rankings for species or groups classified to be of high concern, such as commercial scallops, should be prioritized by managers for monitoring and data collection programs. For data-rich and often more taxonomically resolved species, we recommend using a similar assessment framework to that developed here. This includes classifying the species state of concern based on both changes in sensitivity but also the type of response of the climate impacts compared to combined effects of climate and fisheries. Rankings of high concern can be used to directly prioritize which stocks to apply climate adaptation measures to potentially review levels of fishing pressure. This study has highlighted the importance of representing key trophic and human interactions in addition to physiological processes (such as species tolerance limits) and responses to environmental variability in models used to project species biomass changes under climate change. Certainly, the complexity of possible species responses shown among our different models and the increasing importance of environmental drivers means that current approaches for advising on acceptable catch levels may be insufficient for understanding stock patterns under climate change and would benefit from strategic consideration of projections from ecosystem models. Considering outputs from a multiple or ensemble ecosystem modeling approaches should assist managers in understanding the most important climate feedbacks and the range of model sensitivity estimates. In future studies, we suggest greater effort should be put into obtaining quantified estimates of uncertainty by running all models under a range of plausible parametrizations for key ecological processes (e.g. different diet compositions) and various scenarios (including a greater suite of climate drivers, potential human impact effects, and socioeconomic characteristics). For example, development of multispecies and trait-based size spectrum models for use in climate projections (Woodworth-Jefcoats et al., 2019) has focused on testing the effects of alternative climate processes and mechanisms as well as the use of statistical models to quantify their contribution toward uncertainty (Reum et al., 2020). Such advances, in addition to those discussed above, will provide more confidence in the robustness of individual, multiple and ensemble ecosystem model projections of the future.
Modelled biomass and catch time series used in this article is available from the authors on request.
HRP carried out the resources, data curation, and formal analysis, investigated and visualized the data, performed the methodology, wrote the original draft of the manuscript, and reviewed and edited the manuscript. EAF did the conceptualization, carried out the funding acquisition, resources, and project administration, performed the methodology, wrote the original draft of the manuscript, and reviewed and edited the manuscript. AJH did the conceptualization, carried out the funding acquisition, resources, and project administration, performed the methodology, and wrote, reviewed, and edited the manuscript. IRB directed and supervised the project, did the conceptualization and wrote, reviewed, and edited the manuscript.
JB, CMB, WWLC, LXCD, RG, TH, RM, HL-M, EEP, CV, and XZ carried out the resources, performed the methodology of the model development, and wrote, reviewed, and edited the manuscript.
This is a synthesis of work undertaken for the Australian Fisheries Research and Development Corporation project 2016-2018/138.
The authors declare that the research was conducted in the absence of any commercial or financial relationships that could be construed as a potential conflict of interest.
We thank Prof. Greta Pecl for providing input into earlier versions of this manuscript and for constructive suggestions from our reviewers.
The Supplementary Material for this article can be found online at: https://www.frontiersin.org/articles/10.3389/fmars.2020.577964/full#supplementary-material
Allison, E. H., and Bassett, H. R. (2015). Climate change in the oceans: human impacts and responses. Science 350, 778–782. doi: 10.1126/science.aac8721
Audzijonyte, A., Pethybridge, H., Porobic, J., Gorton, R., Kaplan, I., and Fulton, E. A. (2019). Atlantis: a spatially explicit end-to-end marine ecosystem model with dynamically integrated physics, ecology and socio-economic modules. Methods Ecol. Evol. 10, 1814–1819. doi: 10.1111/2041-210x.13272
Babcock, R. C., Bustamante, R. H., Fulton, E. A., Fulton, D. J., Haywood, M. D. E., Hobday, A. J., et al. (2019). Severe and extensive climate change impacts are happening now: recent dieback of marine habitat forming communities along 40% of the Australian coast. Front. Mar. Sci. 6:411. doi: 10.3389/fmars.2019.00411
Barange, M., Bahri, T., Beveridge, M. C. M., Cochrane, K. L., Funge-Smith, S., and Poulain, F. (eds). (2018). Impacts of Climate Change on Fisheries and Aquaculture: Synthesis of Current Knowledge, Adaptation and Mitigation Options. FAO Fisheries and Aquaculture Technical Paper No. 627. Rome: FAO, 628.
Blanchard, J. L., Jennings, S., Law, R., Castle, M. D., McCloghrie, P., Rochet, M. J., et al. (2009). How does abundance scale with body size in coupled size-structured food webs? J. Anim. Ecol. 78, 270–280. doi: 10.1111/j.1365-2656.2008.01466.x
Blanchard, J. L., Jennings, S., Holmes, R., Harle, J., Merino, G., Allen, J. I., et al. (2012). Potential consequences of climate change for primary production and fish production in large marine ecosystems. Philos. Trans. R. Soc. B Biol. Sci. 367, 2979–2989. doi: 10.1098/rstb.2012.0231
Bourdaud, P., Travers-Trolet, M., Vermard, Y., and Marchal, P. (2019). Improving the interpretation of fishing effort and pressures in mixed fisheries using spatial overlap metrics. Can. J. Fisher. Aquat. Sci. 76, 586–596. doi: 10.1139/cjfas-2017-0529
Brown, C. J., Fulton, E. A., Hobday, A. J., Matear, R. J., Possingham, H. P., Bulman, C., et al. (2010). Effects of climate-driven primary production change on marine food webs: implications for fisheries and conservation. Glob. Change Biol. 16, 1194–1212. doi: 10.1111/j.1365-2486.2009.02046.x
Bryndum-Buchholz, A., Tittensor, D. P., Blanchard, J. L., Cheung, W. W., Coll, M., Galbraith, E. D., et al. (2019). Twenty-first-century climate change impacts on marine animal biomass and ecosystem structure across ocean basins. Glob. Change Biol. 25, 459–472. doi: 10.1111/gcb.14512
Bulman, C., Condie, S., Furlani, D., Cahill, M., Klaer, N., Goldsworthy, S., et al. (2002). Trophic Dynamics of the Eastern Shelf and Slope of the South East Fishery: Impacts of and on the Fishery. Final Report for the Fisheries Research and Development Corporation, Project, 2002/028. Canberra: Fisheries Research and Development Corporation.
Bulman, C. M. (2006). Trophic Webs and Modelling of Australia’s North West Shelf. Northwest Shelf Joint Environmental Management Study Technical Report CSIRO Report No. 9. Canberra: CSIRO.
Bulman, C. M. (2008). Preliminary trophic models of the South east fishery and North West shelf. Fish. Centre Res. Rep. 14:32.
Busch, D. S., Griffis, R., Link, J., Abrams, K., Baker, J., Brainard, R. E., et al. (2016). Climate science strategy of the US national marine fisheries service. Mar. Policy 74, 58–67. doi: 10.1016/j.marpol.2016.09.001
Bustamante, R. H., Dichmont, C. M., Ellis, N., Griffiths, S., Rochester, W. A., Burford, M. A., et al. (2011). Morello Effects of Trawling on the Benthos and Biodiversity: Development and Delivery of a Spatially-Explicit Management Framework for the Northern Prawn Fishery. Final Report, FRDC No. 2005/050. Hobart: CSIRO Marine and Atmospheric Research.
Cheung, W. W., Dunne, J., Sarmiento, J. L., and Pauly, D. (2011). Integrating ecophysiology and plankton dynamics into projected maximum fisheries catch potential under climate change in the Northeast Atlantic. ICES J. Mar. Sci. 68, 1008–1018. doi: 10.1093/icesjms/fsr012
Cheung, W. W., Lam, V. W., Sarmiento, J. L., Kearney, K., Watson, R., and Pauly, D. (2009). Projecting global marine biodiversity impacts under climate change scenarios. Fish Fish. 10, 235–251. doi: 10.1111/j.1467-2979.2008.00315.x
Cheung, W. W., Lam, V. W., Sarmiento, J. L., Kearney, K., Watson, R. E. G., Zeller, D., et al. (2010). Large-scale redistribution of maximum fisheries catch potential in the global ocean under climate change. Glob. Change Biol. 16, 24–35. doi: 10.1111/j.1365-2486.2009.01995.x
Cheung, W. W. L., Frölicher, T. L., Asch, R. G., Jones, M. C., Pinsky, M. L., Reygondeau, G., et al. (2016a). Building confidence in projections of the responses of living marine resources to climate change. ICES J. Mar. Sci. 73, 1283–1296. doi: 10.1093/icesjms/fsv250
Cheung, W. W. L., Jones, M. C., Reygondeau, G., Stock, C. A., Lam, V. W. Y., and Frölicher, T. L. (2016b). Structural uncertainty in projecting global fisheries catches under climate change. Ecol. Modell. 325, 57–66. doi: 10.1016/j.ecolmodel.2015.12.018
Cheung, W. W. L., Reygondeau, G., and Frölicher, T. L. (2016c). Large benefits to marine fisheries of meeting the 1.5C global warming target. Science 354, 1591–1594. doi: 10.1126/science.aag2331
Christensen, V., Coll, M., Steenbeek, J., Buszowski, J., Chagaris, D., and Walters, C. J. (2014). Representing variable habitat quality in a spatial food web model. Ecosystems 17, 1397–1412. doi: 10.1007/s10021-014-9803-3
Christensen, V., and Walters, C. J. (2004). Ecopath with Ecosim: methods, capabilities and limitations. Ecol. Modell. 172, 109–139. doi: 10.1016/j.ecolmodel.2003.09.003
Christensen, V., Walters, C. J., and Pauly, D. (2005). Ecopath with Ecosim: a User’s Guide. Vancouver: University of British Columbia, 154.
Colléter, M., Valls, A., Guitton, J., Gascuel, D., Pauly, D., and Christensen, V. (2015). Global overview of the applications of the Ecopath with Ecosim modeling approach using the EcoBase models repository. Ecol. Modell. 302, 42–53. doi: 10.1016/j.ecolmodel.2015.01.025
Creighton, C., Hobday, A. J., Lockwood, M., and Pecl, G. T. (2016). Adapting management of marine environments to a changing climate: a checklist to guide reform and assess progress. Ecosystems 19, 187–219. doi: 10.1007/s10021-015-9925-2
Dambacher, J. M., Gaughan, D. J., Rochet, M. J., Rossignol, P. A., and Trenkel, V. M. (2009). Qualitative modelling and indicators of exploited ecosystems. Fish Fish. 10, 305–322. doi: 10.1111/j.1467-2979.2008.00323.x
Dichmont, C. M., Ellis, N., Bustamante, R. H., Deng, R., Tickell, S., Pascual, R., et al. (2013). Evaluating marine spatial closures with conflicting fisheries and conservation objectives. J. Appl. Ecol. 50, 1060–1070. doi: 10.1111/1365-2664.12110
Dutkiewicz, S., Scott, J. R., and Follows, M. J. (2013). Winners and losers: ecological and biogeochemical changes in a warming ocean. Glob. Biogeochem. Cycles 27, 463–477. doi: 10.1002/gbc.20042
Feng, M., Zhang, X., Sloyan, B., and Chamberlain, M. (2017). Contribution of the deep ocean to the future changes of the Indonesian Throughflow. Geophys. Res. Lett. 44, 2859–2867. doi: 10.1002/2017gl072577
Fordyce, A. J., Ainsworth, T. D., Heron, S. F., and Leggat, W. (2019). Marine heatwave hotspots in coral reef environments: physical drivers, ecophysiological outcomes, and impact upon structural complexity. Front. Mar. Sci. 6:498. doi: 10.3389/fmars.2019.00498
Free, C. M., Thorson, J. T., Pinsky, M. L., Oken, K. L., Wiedenmann, J., and Jensen, O. P. (2019). Impacts of historical warming on marine fisheries production. Science 363, 979–983. doi: 10.1126/science.aau1758
Fu, C., Travers-Trolet, M., Velez, L., Grüss, A., Bundy, A., Shannon, L. J., et al. (2018). Risky business: the combined effects of fishing and changes in primary productivity on fish communities. Ecol. Modell. 368, 265–276. doi: 10.1016/j.ecolmodel.2017.12.003
Fulton, E. A. (2011). Interesting times: winners, losers, and system shifts under climate change around Australia. ICES J. Mar. Sci. 68, 1329–1342. doi: 10.1093/icesjms/fsr032
Fulton, E. A., Bulman, C. M., Pethybridge, H., and Goldsworthy, S. D. (2018a). Modelling the great Australian bight ecosystem. Deep Sea Res. II Top. Stud. Oceanogr. 157, 211–235. doi: 10.1016/j.dsr2.2018.11.002
Fulton, E. A., Hobday, A. J., Pethybridge, H., Blanchard, J., Bulman, C., Butler, I., et al. (2018b). Decadal Scale Projection of Changes in Australian Fisheries Stocks under Climate Change. FRDC Final Report No. 2016/139. Canberra: CSIRO.
Fulton, E. A., and Gorton, R. (2014). Adaptive Futures for SE Australian Fisheries & Aquaculture: Climate Adaptation Simulations. Canberra: CSIRO, 309.
Fulton, E. A., Gray, R., Sporcic, M., Scott, R., Little, R., Hepburn, M., et al. (2011a). Ningaloo Collaboration Cluster: Adaptive Futures for Ningaloo. Ningaloo Collaboration Cluster Final Report No. 5.3. Canberra: CSIRO.
Fulton, E. A., Link, J. S., Kaplan, I. C., Savina-Rolland, M., Johnson, P., Ainsworth, C., et al. (2011b). Lessons in modelling and management of marine ecosystems: the Atlantis experience. Fish Fish. 12, 171–188. doi: 10.1111/j.1467-2979.2011.00412.x
Fulton, E. A., Punt, A. E., Dichmont, C. M., Gorton, R., Sporcic, M., Dowling, N., et al. (2016). Developing risk equivalent data-rich and data-limited harvest strategies. Fish. Res. 183, 574–587. doi: 10.1016/j.fishres.2016.07.004
Fulton, E. A., Smith, A. D. M., Smith, D. C., and Johnson, P. (2014). An integrated approach is needed for ecosystem based fisheries management: insights from ecosystem-level management strategy evaluation. PLoS One 9:e84242. doi: 10.1371/journal.pone.0084242
Griffith, G. P., Richardson, A. J., Fulton, E. A., and Gorton, R. (2012). Evaluating the interaction effects of ocean warming, ocean acidification and fisheries. Conserv. Biol. 26, 1145–1152. doi: 10.1111/j.1523-1739.2012.01937.x
Griffiths, S. P., Young, J. W., Lansdell, M. J., Campbell, R. A., Hampton, J., Hoyle, S. D., et al. (2010). Ecological effects of the longline fishery and climate change on the pelagic ecosystem off eastern Australia. Rev. Fish Biol. Fish. 20, 239–272. doi: 10.1007/s11160-009-9157-7
Heenan, A., Pomeroy, R., Bell, J., Munday, P. L., Cheung, W., Logan, C., et al. (2015). A climate-informed, ecosystem approach to fisheries management. Mar. Policy 57, 182–192.
Hobday, A. J., and Pecl, G. T. (2014). Identification of global marine hotspots: sentinels for change and vanguards for adaptation action. Rev. Fish Biol. Fish. 24, 415–425. doi: 10.1007/s11160-013-9326-6
Hobday, A. J., Oliver, E. C., Gupta, A. S., Benthuysen, J. A., Burrows, M. T., Donat, M. G., et al. (2018). Categorizing and naming marine heatwaves. Oceanography 31, 162–173. doi: 10.5670/oceanog.2018.205
Hollowed, A. B., Holsman, K. K., Haynie, A. C., Hermann, A. J., Punt, A. E., Aydin, K., et al. (2020). Integrated modeling to evaluate climate change impacts on coupled social-ecological systems in Alaska. Front. Mar. Sci. 6:775. doi: 10.3389/fmars.2019.00775
Holsman, K. K., Ianelli, J., Aydin, K., Punt, A. E., and Moffitt, E. A. (2016). A comparison of fisheries biological reference points estimated from temperature-specific multi-species and single-species climate-enhanced stock assessment models. Deep Sea Res. II Top. Stud. Oceanogr. 134, 360–378. doi: 10.1016/j.dsr2.2015.08.001
Hutton, T., Rochester, W., Fulton, E. A., Gorton, B., Campbell, R., and Smith, D. C. (2017). A Coral Sea and Temperate East Marine Region Spatially Explicit Ecosystem Model: an Application of Atlantis. Canberra: CSIRO.
Ianelli, J., Holsman, K. K., Punt, A. E., and Aydin, K. (2016). Multi-model inference for incorporating trophic and climate uncertainty into stock assessments. Deep Sea Res. II Top. Stud. Oceanogr. 134, 379–389. doi: 10.1016/j.dsr2.2015.04.002
IPCC, (2018). Global Warming of 1.5°C. An IPCC Special Report on the Impacts of Global Warming of 1.5°C Above Pre-Industrial Levels and Related Global Greenhouse gas Emission Pathways, in the Context of Strengthening the Global Response to the Threat of Climate Change, Sustainable Development, and Efforts to Eradicate Poverty, eds V. Masson-Delmotte, P. Zhai, H.-O. Pörtner, D. Roberts, J. Skea, P. R. Shukla, et al. (Geneva: IPCC).
Kaplan, I. C., Francis, T. B., Punt, A. E., Koehn, L. E., Curchitser, E., Hurtado-Ferro, F., et al. (2019). A multi-model approach to understanding the role of Pacific sardine in the California Current food web. Mar. Ecol. Prog. Ser. 617, 307–321.
Kramer-Schadt, S., Revilla, E., Wiegand, T., and Grimm, V. (2007). Patterns for parameters in simulation models. Ecol. Modell. 204, 553–556. doi: 10.1016/j.ecolmodel.2007.01.018
Laufkötter, C., Vogt, M., Gruber, N., Aita-Noguchi, M., Aumont, O., Bopp, L., et al. (2015). Drivers and uncertainties of future global marine primary production in marine ecosystem models. Biogeosciences 12, 6955–6984. doi: 10.5194/bg-12-6955-2015
Lotze, H. K., Tittensor, D. P., Bryndum-Buchholz, A., Eddy, T. D., Cheung, W. W., Galbraith, E. D., et al. (2019). Global ensemble projections reveal trophic amplification of ocean biomass declines with climate change. Proc. Nat. Acad. Sci. U.S.A. 116, 12907–12912.
Lough, J. M., and Hobday, A. J. (2011). Observed climate change in Australian marine and freshwater environments. Mar. Freshw. Res. 62, 984–999. doi: 10.1071/mf10272
Lozano-Montes, H., Loneragan, N., Babcock, R., and Caputi, N. (2013). Evaluating the ecosystem effects of variation in recruitment and fishing effort in the western rock lobster fishery. Fish. Res. 145, 128–135. doi: 10.1016/j.fishres.2013.01.009
Lozano-Montes, H., Loneragan, N. R., Babcock, R., and Jackson, K. (2011). Using trophic flows and ecosystem structure to model the effects of fishing in the Jurien Bay Marine Park, temperate Western Australia. Mar. Freshw. Res. 62, 421–431. doi: 10.1071/mf09154
Mackinson, S., Daskalov, G., Heymans, J. J., Neira, S., Arancibia, H., Zetina-Rejón, M., et al. (2009). Which forcing factors fit? Using ecosystem models to investigate the relative influence of fishing and changes in primary productivity on the dynamics of marine ecosystems. Ecol. Modell. 220, 2972–2987. doi: 10.1016/j.ecolmodel.2008.10.021
Melnychuk, M. C., Banobi, J. A., and Hilborn, R. (2014). The adaptive capacity of fishery management systems for confronting climate change impacts on marine populations. Rev. Fish Biol. Fish. 24, 561–575. doi: 10.1007/s11160-013-9307-9
Nielsen, J. R., Thunberg, E., Holland, D. S., Schmidt, J. O., Fulton, E. A., Bastardie, F., et al. (2018). Integrated ecological–economic fisheries models: evaluation, review and challenges for implementation. Fish Fish. 19, 1–29. doi: 10.1007/978-90-481-2655-2_1
Norman-López, A., Pascoe, S., and Hobday, A. J. (2011). Potential economic impacts of climate change on Australian fisheries and the need for adaptive management. Clim. Change Econ. 2, 209–235. doi: 10.1142/s2010007811000279
Ogier, E. M., Davidson, J., Fidelman, P., Haward, M., Hobday, A. J., Holbrook, N. J., et al. (2016). Fisheries management approaches as platforms for climate change adaptation: comparing theory and practice in Australian fisheries. Mar. Policy 71, 82–93. doi: 10.1016/j.marpol.2016.05.014
Olsen, E., Fay, G., Gaichas, S., Gamble, R., Lucey, S., and Link, J. S. (2016). Ecosystem model skill assessment. Yes we can! PLoS One 11:e0146467. doi: 10.1371/journal.pone.0146467
Pauly, D. (1980). On the interrelationships between natural mortality, growth parameters, and mean environmental temperature in 175 fish stocks. ICES J. Mar. Sci. 39, 175–192. doi: 10.1093/icesjms/39.2.175
Pauly, D., Zeller, D., and Palomares, M. L. D. (eds). (2020). Sea Around Us Concepts, Design and Data. Vancouver: University of British Columbia.
Payne, M. R., Barange, M., Cheung, W. W., MacKenzie, B. R., Batchelder, H. P., Cormon, X., et al. (2016). Uncertainties in projecting climate-change impacts in marine ecosystems. ICES J. Mar. Sci. 73, 1272–1282.
Pecl, G. T., Araújo, M. B., Bell, J. D., Blanchard, J., Bonebrake, T. C., Chen, I. C., et al. (2017). Biodiversity redistribution under climate change: impacts on ecosystems and human well-being. Science 355:eaai9214.
Pecl, G. T., Ward, T., Doubleday, Z. A., Clarke, S., Day, J., Dixon, C., et al. (2014). Rapid assessment of fisheries species sensitivity to climate change. Clim. Change 127, 505–520. doi: 10.1007/s10584-014-1284-z
Pethybridge, H. R., Weijerman, M., Perrymann, H., Audzijonyte, A., Porobic, J., McGregor, V., et al. (2019). Calibrating process-based marine ecosystem models: an example case using Atlantis. Ecol. Modell. 412:108822. doi: 10.1016/j.ecolmodel.2019.108822
Plagányi, E. E., Bell, J. D., Bustamante, R. H., Dambacher, J. M., Dennis, D., Dichmont, C. M., et al. (2011). Modelling climate change effects on Australian and Pacific aquatic ecosystems: a review of analytical tools and management implications. Mar. Freshw. Res. 62, 1132–1147. doi: 10.1071/mf10279
Plagányi, É. E., Haywood, M. D., Gorton, R. J., Siple, M. C., and Deng, R. A. (2019). Management implications of modelling fisheries recruitment. Fish. Res. 217, 169–184. doi: 10.1016/j.fishres.2019.03.007
Plagányi, É. E., Punt, A. E., Hillary, R., Morello, E. B., Thébaud, O., Hutton, T., et al. (2014). Multispecies fisheries management and conservation: tactical applications using models of intermediate complexity. Fish Fish. 15, 1–22. doi: 10.1111/j.1467-2979.2012.00488.x
Plagányi, É. E., Skewes, T., Haddon, M., and Dowling, N. (2013). Risk management tools for sustainable fisheries management under changing climate: a sea cucumber example. Clim. Change 119, 181–197. doi: 10.1007/s10584-012-0596-0
Reum, J. C., Blanchard, J. L., Holsman, K. K., Aydin, K., Hollowed, A. B., Hermann, A. J., et al. (2020). Ensemble projections of future climate change impacts on the Eastern Bering Sea food web using a multispecies size spectrum model. Front. Mar. Sci. 7:124. doi: 10.3389/fmars.2020.00124
Sheaves, M., Sporne, I., Dichmont, C. M., Bustamante, R., Dale, P., Deng, R., et al. (2016). Principles for operationalizing climate change adaptation strategies to support the resilience of estuarine and coastal ecosystems: an Australian perspective. Mar. Policy 68, 229–240. doi: 10.1016/j.marpol.2016.03.014
Smith, D. C., Fulton, E. A., Apfel, P., Cresswell, I. D., Gillanders, B. M., Haward, M., et al. (2017). Implementing marine ecosystem-based management: lessons from Australia. ICES J. Mar. Sci. 74, 1990–2003. doi: 10.1093/icesjms/fsx113
Spence, M. A., Blanchard, J. L., Rossberg, A. G., Heath, M. R., Heymans, J. J., Mackinson, S., et al. (2018). A general framework for combining ecosystem models. Fish Fish. 19, 1031–1042. doi: 10.1111/faf.12310
Steenbeek, J., Coll, M., Gurney, L., Mélin, F., Hoepffner, N., Buszowski, J., et al. (2013). Bridging the gap between ecosystem modeling tools and geographic information systems: driving a food web model with external spatial-temporal data. Ecol. Modell. 263, 139–151. doi: 10.1016/j.ecolmodel.2013.04.027
Sumaila, U. R., Cheung, W. W., Lam, V. W., Pauly, D., and Herrick, S. (2011). Climate change impacts on the biophysics and economics of world fisheries. Nat. Clim. Change 1, 449–456. doi: 10.1038/nclimate1301
Sunday, J. M., Pecl, G. T., Frusher, S., Hobday, A. J., Hill, N., Holbrook, N. J., et al. (2015). Species traits and climate velocity explain geographic range shifts in an ocean-warming hotspot. Ecol. Lett. 18, 944–953. doi: 10.1111/ele.12474
Taylor, K. E., Stouffer, R. J., and Meehl, G. A. (2012). An overview of CMIP5 and the experiment design. Bull. Am. Meteorol. Soc. 93, 485–498. doi: 10.1175/bams-d-11-00094.1
Thuiller, W., Guéguen, M., Renaud, J., Karger, D. N., and Zimmermann, N. E. (2019). Uncertainty in ensembles of global biodiversity scenarios. Nat. Commun. 10:1446.
Tittensor, D. P., Eddy, T. D., Lotze, H. K., Galbraith, E. D., Cheung, W., and Barange, M. (2018). A protocol for the intercomparison of marine fishery and ecosystem models: FISH-MIP v1.0. Geosci. Model Dev. 11, 1421–1442.
Travers-Trolet, M., Shin, Y. J., Shannon, L. J., Moloney, C. L., and Field, J. G. (2014). Combined fishing and climate forcing in the southern Benguela upwelling ecosystem: an end-to-end modelling approach reveals dampened effects. PLoS One 9:e94286. doi: 10.1371/journal.pone.0094286
Tulloch, V. J. D., Plagányi, E., Brown, C., Matear, R., and Richardson, A. J. (2019). Future recovery of baleen whales is imperiled by climate change. Glob. Change Biol. 25, 1263–1281. doi: 10.1111/gcb.14573
Van Putten, E. I., Plagányi, E., Booth, K., Ctivanovic, C., Kelly, R., Punt, A., et al. (2018). A framework for incorporating Sense of Place into the management of marine systems. Ecol. Soc. 23, 1–24.
Van Vuuren, D. P., Edmonds, J., Kainuma, M., Riahi, K., Thomson, A., Hibbard, K., et al. (2011). The representative concentration pathways: an overview. Clim. Change 109:5. doi: 10.1007/s10584-011-0148-z
Wayte, S. E. (2013). Management implications of including a climate-induced recruitment shift in the stock assessment for jackass morwong (Nemadactylus macropterus) in south-eastern Australia. Fish. Res. 142, 47–55. doi: 10.1016/j.fishres.2012.07.009
Woodworth-Jefcoats, P. A., Blanchard, J. L., and Drazen, J. C. (2019). Relative impacts of simultaneous stressors on a pelagic marine ecosystem. Front. Mar. Sci. 6:383. doi: 10.3389/fmars.2019.00383
Keywords: forecasting, climate change, model uncertainty, fisheries management, adaptive management, ensemble modeling
Citation: Pethybridge HR, Fulton EA, Hobday AJ, Blanchard J, Bulman CM, Cheung WWL, Dutra LXC, Gorton R, Hutton T, Matear R, Lozano-Montes H, Plagányi EE, Villanueva C, Zhang X and Butler IR (2020) Contrasting Futures for Australia’s Fisheries Stocks Under IPCC RCP8.5 Emissions – A Multi-Ecosystem Model Approach. Front. Mar. Sci. 7:577964. doi: 10.3389/fmars.2020.577964
Received: 30 June 2020; Accepted: 17 September 2020;
Published: 30 October 2020.
Edited by:
Maria Grazia Pennino, Spanish Institute of Oceanography, SpainReviewed by:
Lynne Jane Shannon, University of Cape Town, South AfricaCopyright © 2020 Pethybridge, Fulton, Hobday, Blanchard, Bulman, Cheung, Dutra, Gorton, Hutton, Matear, Lozano-Montes, Plagányi, Villanueva, Zhang and Butler. This is an open-access article distributed under the terms of the Creative Commons Attribution License (CC BY). The use, distribution or reproduction in other forums is permitted, provided the original author(s) and the copyright owner(s) are credited and that the original publication in this journal is cited, in accordance with accepted academic practice. No use, distribution or reproduction is permitted which does not comply with these terms.
*Correspondence: Heidi R. Pethybridge, SGVpZGkuUGV0aHlicmlkZ2VAY3Npcm8uYXU=
Disclaimer: All claims expressed in this article are solely those of the authors and do not necessarily represent those of their affiliated organizations, or those of the publisher, the editors and the reviewers. Any product that may be evaluated in this article or claim that may be made by its manufacturer is not guaranteed or endorsed by the publisher.
Research integrity at Frontiers
Learn more about the work of our research integrity team to safeguard the quality of each article we publish.