 Maike Iris Esther Scheffold
 Inga Hense
- Institute of Marine Ecosystem and Fishery Science, Center for Earth System Research and Sustainability, University of Hamburg, Hamburg, Germany
The identification of carbon pools and the quantification of carbon stocks is necessary to (1) track changes in ecosystem dynamics, (2) inform science-based ecosystem and blue-carbon management, and (3) evaluate ecosystem and food web models. However, estimates of organic carbon stocks in marine ecosystems are incomplete or inconsistent. Therefore, we provide a first consistent estimate of relevant organic carbon stocks of a distinct marine ecosystem- the Baltic Sea. We estimate its contemporary standing stocks of 18 non-living and living organic carbon pools using data from literature and open-access databases. In contrast to existing data, our estimates are valid for the entire Baltic Sea, include necessary pools and are verifiable, as we describe data sources, methods and the associated uncertainties in detail to allow reproduction and critical evaluation. The total organic carbon (TOC) in the Baltic Sea ecosystem amounts to 1,050 ± 90 gC/m2 (440 ± 40 Mt). The non-living stocks account for about 98.8% and the living stocks for 1.2% of the TOC. Our estimates indicate that benthos has the highest living organic carbon stock and that the stock of particulate organic carbon (POC) has been underestimated in some previous studies. In addition, we find a partially inverted biomass distribution with a higher stock of primary consumers than primary producers. Our estimates provide a baseline of the size and distribution of the organic carbon in the Baltic Sea for the current period. Analyses of inorganic carbon stocks and the interplay between inorganic and organic stocks must follow to further define the baseline of total carbon stocks in the Baltic Sea.
Introduction
The identification of carbon pools and the quantification of carbon stocks is necessary to (1) track changes in ecosystem dynamics, (2) inform science-based ecosystem or blue carbon management, and (3) evaluate ecosystem and food web models. To meet these needs in the Baltic Sea, we identify living and non-living organic carbon pools of the Baltic Sea ecosystem and quantify their contemporary stocks.
The semi-enclosed, brackish Baltic Sea lies in the northern part of Europe and covers an area of about 420,000 km2; including the Danish Strait and the Kattegat. With an average depth of ∼53 m (Jakobsson et al., 2019) and a high surface-to-volume ratio it is relatively shallow compared to other marine systems. Surrounded by nine countries and with a drainage system about four times larger than its sea surface, the Baltic Sea system is influenced by the input of river freshwater and terrestrial organic material, while the water exchange with the neighboring North Sea is limited. Due to a strong meridional gradient of environmental factors, physical and biological characteristics differ within the Baltic Sea and shape very different habitats (i.e., Snoeijs-Leijonmalm and Andrén, 2017). Anthropogenic pressure, such as climate change, overfishing and eutrophication, is increasingly changing the Baltic Sea ecosystem and thus the size and distribution of its carbon stocks.
Previous studies have not or not sufficiently quantified the organic carbon stocks of the relevant carbon pools in the entire Baltic Sea. Most studies focus on small ecosystems or basins within the Baltic Sea rather than on the Baltic Sea ecosystem as a whole. Carbon stocks are estimated for small scales (Kumblad et al., 2003; Tomczak et al., 2009), different basins (Elmgren, 1984; Sandberg et al., 2004; Niiranen et al., 2013), and/or for a specific subset of carbon pools (Kuparinen et al., 1996; Carstensen et al., 2003; Boström et al., 2014).
Almost all of today’s carbon stock estimates are by-products or input parameters of other studies where carbon stocks are only a secondary object of interest. This has two consequences. First, organic carbon stocks are often based on limited data such as values of single years (Bossier et al., 2018), data with low spatial coverage (Bauer et al., 2018) or adopted values from other, mostly older, publications (Baird et al., 1991; Sandberg et al., 2000). Second, data and methods used for estimating carbon stocks are not sufficiently described (Sandberg et al., 2000; Harvey et al., 2003; ICES, 2005a). In most cases, it is not possible to reproduce the carbon estimates nor to evaluate the references, assumptions and constraints of methods and data.
The existing estimates of organic carbon stocks are either not valid for the entire Baltic Sea ecosystem and its area, do not contain all relevant carbon pools, are based on limited data or cannot be reproduced. To fill this gap, we provide the first consistent stock estimate of 18 currently existing living and non-living organic carbon pools of the Baltic Sea ecosystem presented in mass/area (gC/m2). With our estimates, we establish a reproducible baseline for the current period that is needed to evaluate the ecosystem models of the Baltic Sea and to estimate changes in the size of organic carbon stocks and their distribution within the organic carbon pools of the Baltic Sea.
Materials and Methods
We identify 18 organic carbon pools in living biomass and non-living organic matter important for the carbon cycling in the Baltic Sea. The living pools include organisms responsible to build up organic biomass out of inorganic carbon (primary producers) and organisms that consume living organic carbon pools or decompose extrinsic organic material to build up their biomass (consumers and detrivores). We include pools of high biomass and pools of commercially relevant species as well as pools of lower biomass that potentially influence processes of organic carbon cycling or act as mediators between different pools as suggested by Lutz and Martin (2014) and Atwood et al. (2015).
We differentiate species-specific carbon pools for higher trophic levels directly addressed by anthropogenic activities and management, for example with species-specific catch advice and population monitoring. Although these species of higher trophic levels are possibly of small standing stock, they are included as they potentially provide different marine ecosystem carbon services and could link human activities and larger carbon stocks (Lutz and Martin, 2014; Schmitz et al., 2014). Vice versa, we combine several species as homogeneous pools if they are not addressed by species-specific management and only contribute to the carbon cycle via the food web and by sinking. We do not specify age groups because we estimate the standing stock biomass of the living pools and not age-specific food consumption or distribution patterns.
We select particulate and dissolved organic carbon in the water column (POC, DOC) and particulate organic carbon in the upper sediment as non-living pools. The sediment carbon stock is calculated for the top layer (10 cm) that is above the average mixing depth of 5–10 cm of the Baltic Sea (Bunke et al., 2019) and thus still involved in the carbon cycling via natural and anthropogenic mixing processes. This restriction follows the methods of former studies estimating marine sediment carbon stocks (Burrows et al., 2017; Diesing et al., 2017; Luisetti et al., 2019). However, this limit does not reflect a natural limit of organic carbon and our estimate only represents a fraction of the total organic sediment carbon stock.
We estimate the contemporary standing stock. Therefore, we average biomass or carbon concentrations over timespans covered in the individual data sets (on average ∼15 years) to omit seasonal and interannual variability. However, we acknowledge that changes in the organic carbon stocks may have occurred in the past and are likely to occur in future due to anthropogenic drivers in this region (Tamelander et al., 2017; Lønborg et al., 2020).
To estimate the standing stocks of the living and non-living carbon pools per area of the Baltic Sea in gC/m2, we use existing data from various literature and open-access databases. In the following, we conceptually describe how we aggregate the data over time and space and discuss the validity of our estimates. Data, calculations, carbon conversion factors and codes for data processing can be found and downloaded at PANGAEA (Scheffold and Hense, 2020).
Data Formatting
Data for our chosen individual pools are available in different formats and units, for example in number of individuals per area (mammals), carbon content per dry weight (sediment carbon) or in absolute values of wet weight (fish, benthos, sediment carbon and zooplankton) (Table 1). In a first step, we convert these different units into wet weight/carbon per area or volume.
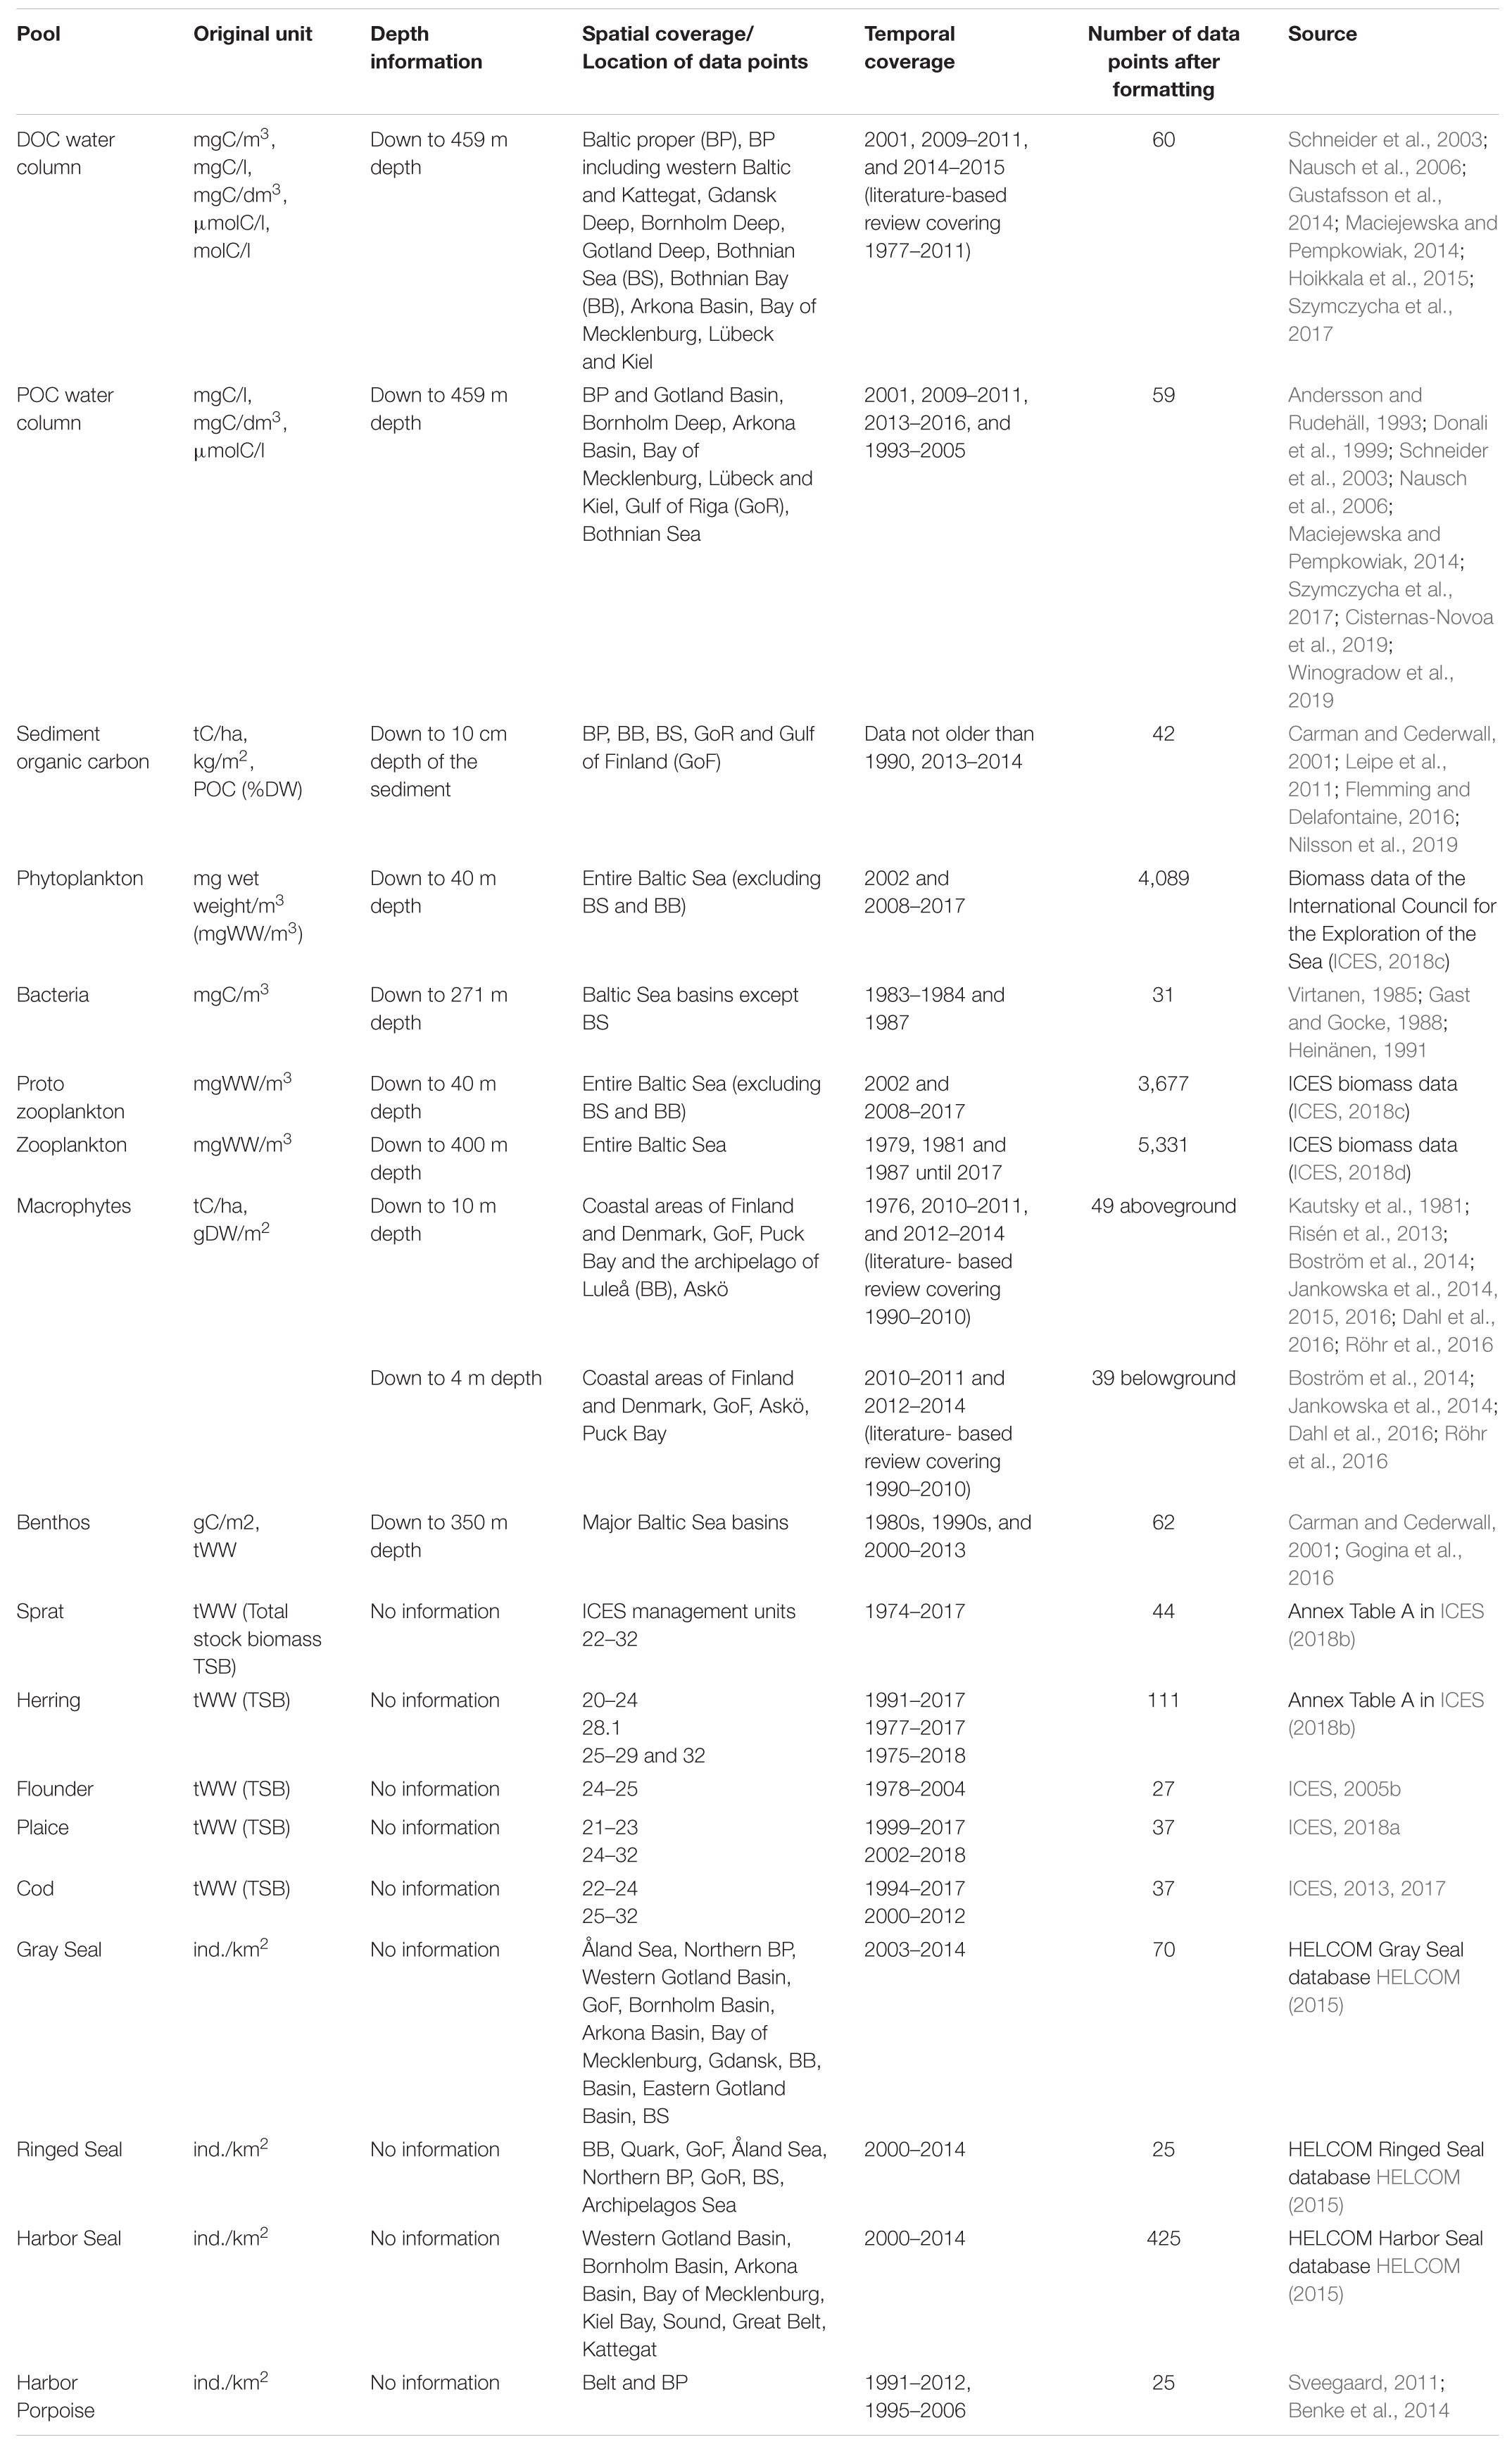
Table 1. Data specifications of the original data.
We divide all absolute values by associated areas (benthos and fish) or sampled volumes (zooplankton). For this purpose, we use either information on spatial extents or sampled volumes from the associated literature or we calculate areas using bathymetric data of NOAA with the R-package marmap (Pante and Simon-Bouhet, 2013).
For mammals, we multiply the number of sighted individuals per area by a mean weight per individual. We calculate this mean weight based on age- and sex-distribution data of the Baltic Sea for gray seals [∼94 kg based on Lundstedt-Enkel et al. (2008) and Kauhala et al. (2012)] and harbor seals [∼42 kg based on Härkönen and Heide-Jørgensen (1990) and Härkönen et al. (1999)]. To approximate the mean weight of ringed seals (∼58 kg), we use data on sex- and age-distribution from the northwestern coast of Hudson Bay and from Svalbard (Holst et al., 2006; Krafft et al., 2006). Although different seal populations have different sex- and age-distributions, we assume that the characteristics are comparable. For harbor porpoises, we use an average weight of 65 kg reported by Miller and Wahlberg (2013).
To obtain sediment carbon concentrations, we multiply particulate organic carbon contents per dry weight (POC%) and dry bulk densities (DBD) for accumulation, transport and erosion bottoms for every centimeter down to 10 cm. If only POC% or DBD is provided, we use the DBD-POC% and POC%-POC concentration correlations given by Leipe et al. (2011) for Baltic Sea sediments. Since these correlations do not cover sediments with POC contents below 2.5%, we additionally use the mud content-POC% correlation by Leipe et al. (2011) and mud content-POC concentration correlations given for a variety of sediments with POC% < 2.5% by Flemming and Delafontaine (2016).
The plankton data require three steps of formatting. First, to separate the data of phytoplankton (purely autotrophic) and protozooplankton (mixo- to heterotrophic), we identify protozooplankton based on non-exclusive literature research on trophic status and occurrence during the year. For example, mixotrophic species in late summer, winter and spring months belong to protozooplankton. Due to a large amount of phytoplankton and protozooplankton data, we do not expect the manual sorting to severely bias our stock estimates.
Second, plankton data often include several entries per site and date. These are either species-specific subsamples of the same measurements (same depth range, date, site) or measurements for different depth ranges (0–1 m, 2–5 m). We sum species-specific subsamples to obtain bulk concentrations.
Third, phytoplankton and protozooplankton data were not measured at all depths between 20 and 40 m. We use a linear regression to approximate missing concentrations. Although the vertical profile of phytoplankton concentrations is far from being linear, we only lack values below 20 m. The probability that sub-surface maxima occur at these depths is low as several studies show a euphotic zone with primary production of maximum 20 m depth (i.e., Feistel et al., 2008; Snoeijs-Leijonmalm et al., 2017; Purina et al., 2018; Vanharanta et al., 2020). Thus, the use of a linear regression is appropriate in this case.
To distinguish between living and non-living organic particles in POC in the water column, we multiply the POC concentrations in the surface waters by the seasonal detritus content (December–February 0.63, March–May 0.64, June–August 0.80, September–November 0.92) given by Andersson and Rudehäll (1993) or the corresponding mean detritus content (0.75 ± 0.12). We consider the living content for the upper 20 m only since we assume that the POC below the upper 20 m of the water column is detrital and migratory zooplankton species, sub-surface phytoplankton as well as dormant resting stages occasionally caught during POC measurements are non-living or metabolically inactive. Although a simplification, we consider this assumption sufficient for quantifying the stock.
Quantification of Stocks
Following the formatting of the data, the data come in three spatial specifications: volume-specific with a certain depth range (Case 1), area-specific with a certain depth range (Case 2) or area-specific without any associated depth (Case 3). Case 1 pools contain phytoplankton, protozooplankton, zooplankton, bacteria, POC, DOC and sediment organic carbon. Case 2 data are associated with the benthic environments including macrophytes and benthos. The last case contains fish and mammals.
For case 1 stocks except the sediment stock, we assume that a wet-weight/carbon concentration per volume specified for a certain depth range applies to each covered 1m-thick water layer j and average all concentrations of the same layer j. We obtain a mean concentration per layer j (Kj) (Figure 1, 1. Assumption and 1. Calculation) that applies to the volume of the layer j (Vj) (Figure 2).
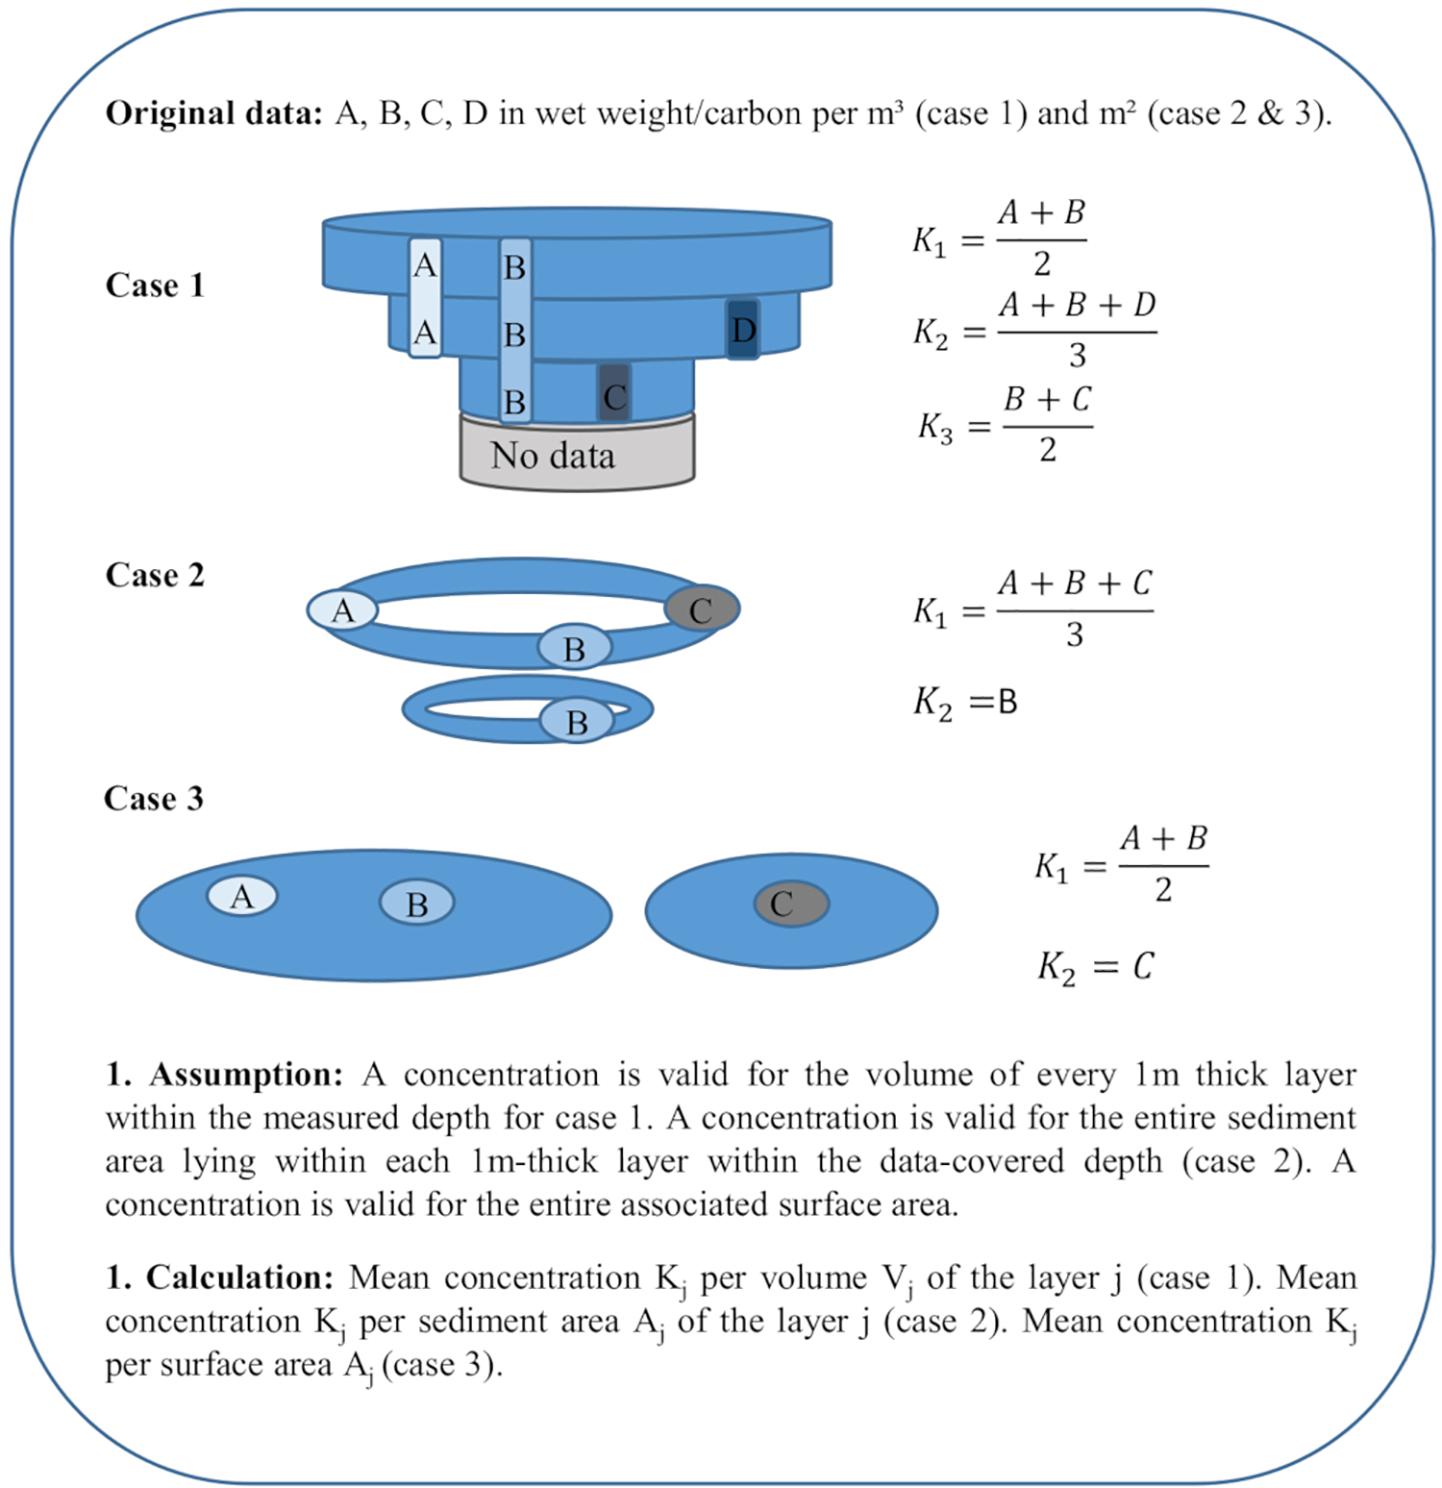
Figure 1. Calculation of the mean concentration per layer, sediment or surface area (Kj) for case 1, 2, and 3 pools. A, B, C, D, wet weight or carbon per m3/m2; Aj, sediment area within layer j or associated surface area; Vj, volume of the layer j; and Kj, mean concentration.
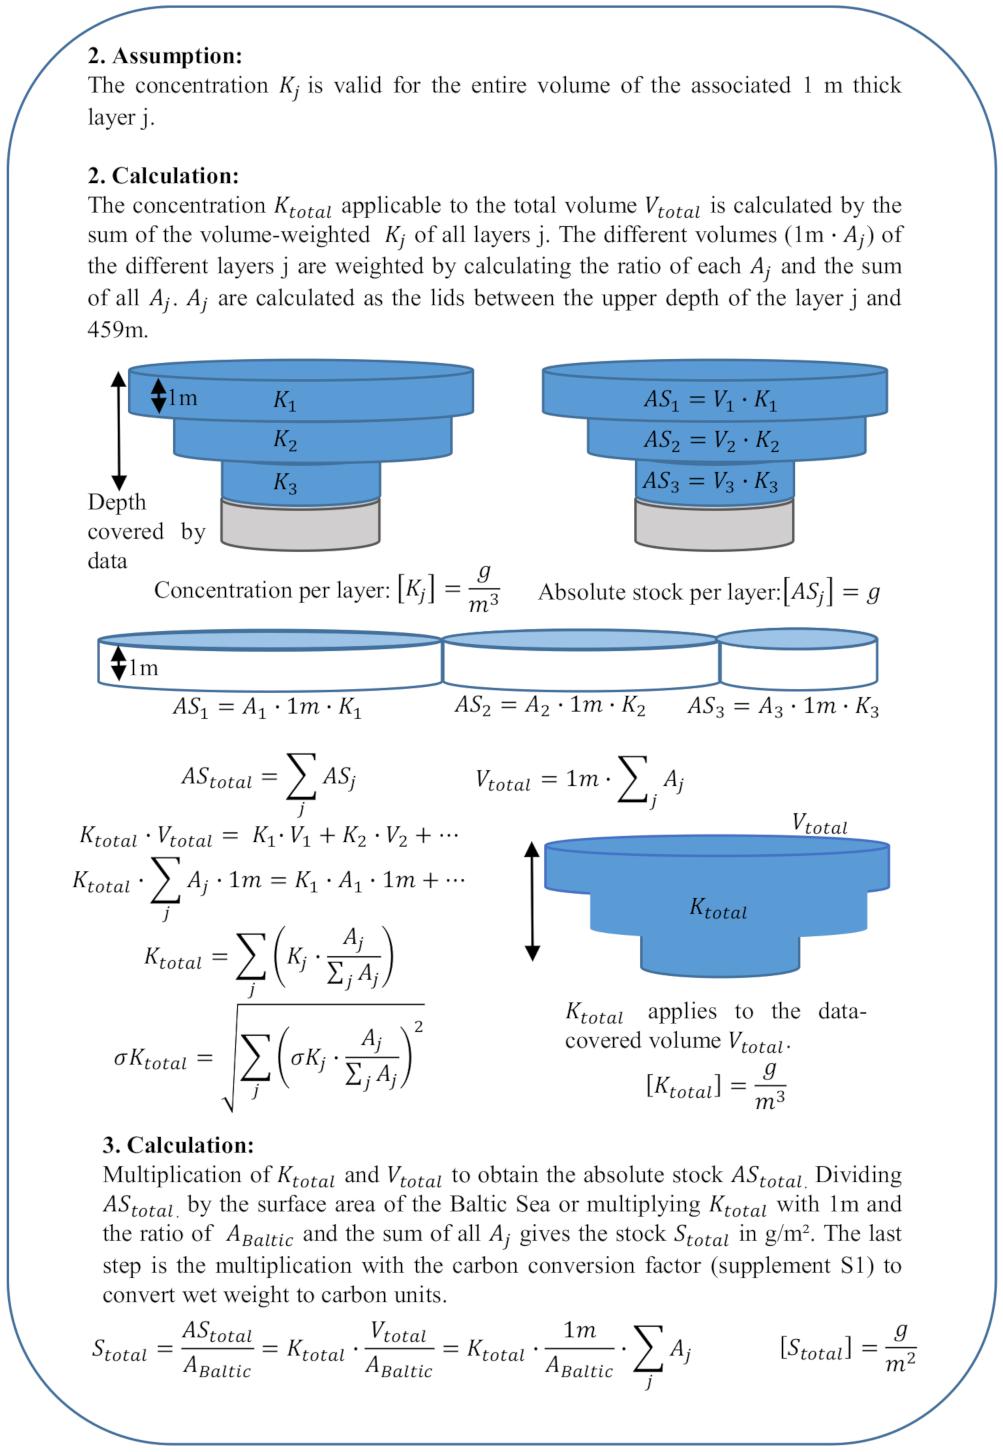
Figure 2. Calculations and assumptions for case 1 stocks. ASj, absolute stock of layer j; AStotal, total absolute stock of the entire volume Vtotal; Stotal, total stock in g/m2; Vtotal, total volume; Vj, volume of the layer j; Aj, area of the layer j; Kj, mean concentration of layer j in g/m3; σKj, standard deviation of the mean concentration per layer j; Ktotal, weighted concentration of all layers covered by the data; σKtotal, standard deviation of the mean concentration; and ABaltic, area of the Baltic Sea.
Since the total absolute stock (AStotal) is the sum of the absolute stocks (ASj) of all layers, a larger Vj translates into a higher share of absolute stock of that layer (ASj) of the total stock (Figure 2). To calculate the mean concentration of the total data-covered volume (Ktotal), we thus weight all Kj according to the ratio of Vj to the total volume (Vtotal). This volume-ratio translates into a ratio of the area of each layer j (Aj) and the sum of all areas covered by the data since all layers are 1 m thick (Figure 2, 2. Calculation). Ktotal is the sum of the products of each Kj with the associated area ratio [Aj/sum(Aj)] (Figure 2, 2. Calculation). For case 1 stocks, Aj is the lid of the volume between the upper depth of the layer and 459 m (maximum depth of the Baltic Sea). To obtain the stock per m2 (Stotal), we multiply Ktotal with Vtotal and divide it by the area of the Baltic Sea (420,000 km2).
For the sediment stock, carbon concentrations are given for different sediment depths and bottom types in different basins. We calculate a weighted concentration () for each covered 1 cm-thick layer of sediment down to a depth of 10 cm by weighting the carbon concentrations with the corresponding areas of transport, erosion and accumulation bottoms in the different basins (Figure 3, 1. Calculation), which we calculate with the percentages in Table 11.1 by Carman and Cederwall (2001). The total sediment stock is the sum of each multiplied with 1 cm (Figure 3, 2. Calculation).
Figure 3. Calculation of the weighted mean concentration per 1 cm-thick sediment layer for the sediment stock. EB, Erosion Bottom; TB, Transport bottom; AB, Accumulation bottom; , concentration for the 1 cm-thick layer j and the basin-specific area of different sediment types ; , uncertainty of the concentration for j and ; mean weighted concentration for j; , uncertainty of the weighted mean concentration for j; and Stotal, total sediment stock in g/m2.
The calculations for case 2 and 3 are similar since both stocks are associated with areas. The main difference is that case 2 stocks apply to sediment areas with additional depth ranges (i.e., 2–3 m, 0–10 m). For case 2, we thus assume that concentrations given for a certain depth range apply to the sediment area lying within each 1 m-thick layer covered by the depth range, i.e., 10 g/m2 for 0–2 m applies to the sediment area lying within 0–1 m and 1–2 m (Figure 1). Case 3 concentrations, given for a certain location or basin, apply to the entire surface extent of the associated area. Kj is the mean of all concentrations given for each sediment or surface area (Figure 1). For benthos (case 2), associated areas for the considered depth ranges in different basins are given. We thus weight Kj for benthos () similar to the weighting of the bottom types for the sediment stock (Figure 3) before calculating Ktotal (Figure 4, 2. Calculation).
Figure 4. Calculations and assumptions for case 2 and case 3 stocks. ASj, absolute stock of layer j; AStotal, total absolute stock of the entire area Atotal; Stotal, total stock in g/m2; Atotal, total area; Aj, sediment (case 2) or surface area (case 3); Kj, mean concentration of the area in g/m2; σKj, standard deviation of the mean concentration per area; Ktotal, weighted concentration of all areas covered by data; and σKtotal, standard deviation of the mean concentration.
To calculate Ktotal for case 2 and 3 we proceed similarly to case 1, we weight the mean concentrations Kj or with area ratios (Figure 4, 2. Calculation). We assume that the mean concentration Ktotal in g/m2 is the resulting stock estimate and if no spatial restriction applies, the stock is used for the entire Baltic Sea area (Figure 4, 3. Assumption).
Finally, we convert wet weight to carbon units by applying the conversion factors we aggregate from the literature (Supplementary Material S1). We use specific carbon conversion factors if available, as it is the case for benthos (depth depending carbon conversion factors by Carman and Cederwall, 2001, Supplementary Material S2). We determine the associated uncertainties by propagating the standard deviations of each layer.
Some of the case 2 and 3 pools do not occur in the entire Baltic Sea. The stocks of these pools, calculated as described above, thus only apply to their habitat. To project these stocks to the entire Baltic Sea, we multiply the values with spatial limitation factors, the ratios between the areas where the stocks occur and 420,000 km2, thus artificially “diluting” them. Macrophytes only grow on light exposed coastal seabed (mostly above 10 m). This coastal stripe is further restricted by a combination of sediment types, salinity, wave exposure, temperature and ice cover (Al-Hamdani and Reker, 2007). We use a mean area of 2,020 ± 410 km2 of seagrass beds reported by Green and Short (2003) and Boström et al. (2014) as macrophytes habitat and a spatial limitation factor of 0.0048. We further assume that benthos do not live in areas with permanent oxygen concentration below 2 mlO2/l and dilute our benthic stock using a spatial limiting factor of 0.83 (83%), based on the mean anoxic and hypoxic areas by Hansen et al. (2007), Carstensen et al. (2014a, b), and Hansson et al. (2017). Populations of harbor seals and ringed seals occur in selected areas only. We calculate spatial-limiting factors of 0.30 for harbor and 0.46 for ringed seals based on the reported habitats. We do not use spatial limitations of the chosen fish species in the Baltic Sea, although some fish species might favor specific habitats and occur in some areas more frequently.
Validity and Limitations of Our Estimates
One limitation of our estimates is our assumption of a homogeneous Baltic Sea. We temporally and spatially average the carbon concentration and overwrite heterogeneous signals, meridional gradients and area-specific properties. The assumption of homogeneity is very simplified but we consider it sufficient because we include heterogeneous signals in our uncertainty estimates where possible and are interested in the magnitudes rather than concrete numbers of the Baltic organic carbon stocks. However, our estimated distribution and size of the organic carbon stocks apply to the Baltic Sea ecosystem as a whole and sub basins might show very different magnitudes and distributions of organic carbon stocks.
The main limitation of our estimates is the lack and inhomogeneity of data in space and time. Although the Baltic Sea is well monitored, there are large data gaps and few comparable data and reported uncertainties. In addition, sampling data is inhomogeneous in space and time. To work with such a dataset, we have to assume that the data represent the actual state of the Baltic Sea and are “perfect” (i.e., we do not take the frequency nor the spatial clustering of observations into account).
Even if our estimate represents the most comprehensive estimate of total organic carbon (TOC) in the Baltic Sea, we could not quantify the stocks of all pools in the Baltic Sea due to lack of data (e.g., for some fish species and sediment DOC) and to avoid double counting (e.g., for macrophytes associated sediments and benthic bacteria). Further data and research are needed to complete the estimate of TOC in the Baltic Sea.
Our stock estimates reflect orders of magnitude. The estimates apply to the selected groups on the scale of the entire Baltic Sea ecosystem and the area of the Baltic Sea (420,000 km2). Our estimates can be used to evaluate and compare the carbon stocks in the Baltic Sea for the selected pools, as they are all calculated under the same assumptions. Any comparison with historical data sets or other regions must take into account our assumptions and resulting limitations. Comparisons should not overestimate the accuracy of our estimates and should take into account the risks of non-quantifiable uncertainties sensu Hauge (2011).
Results and Discussion
Non-living Carbon Stocks
We summarize results and associated uncertainties in gC/m2 in Table 2 and in Mt in Figure 5. The estimated TOC stock in the selected pools valid for the entire Baltic Sea area (420,000 km2) amounts to 1,050 ± 90 gC/m2. The non-living organic stocks are by far the largest, contributing about 98.8%. The largest singular stock is sediment carbon with 830 ± 90 gC/m2 (79.1% of TOC), followed by a DOC stock of 196 ± 4 gC/m2 (18.7% of TOC) and a POC stock of 10.8 ± 1.2 gC/m2 (1% of TOC).
Table 2. Organic carbon concentration and stock estimates with the associated uncertainties in gC/m3 and gC/m2 for the identified organic carbon pools with references volumes and areas and explanatory aspects.
Figure 5. The carbon cycle of the Baltic Sea with the relevant living and non-living organic carbon stocks in Mt. Carbon stock estimates of the living pools are scaled and indicate their magnitudes. Colors of bubbles indicate diet preferences. Fluxes between the pools are not quantified.
Our estimate of the sediment carbon stock of the upper 5 cm (410 ± 60 gC/m2) is of similar magnitude as basin-specific estimates of previous studies (Table 3) although they differ in some respects.
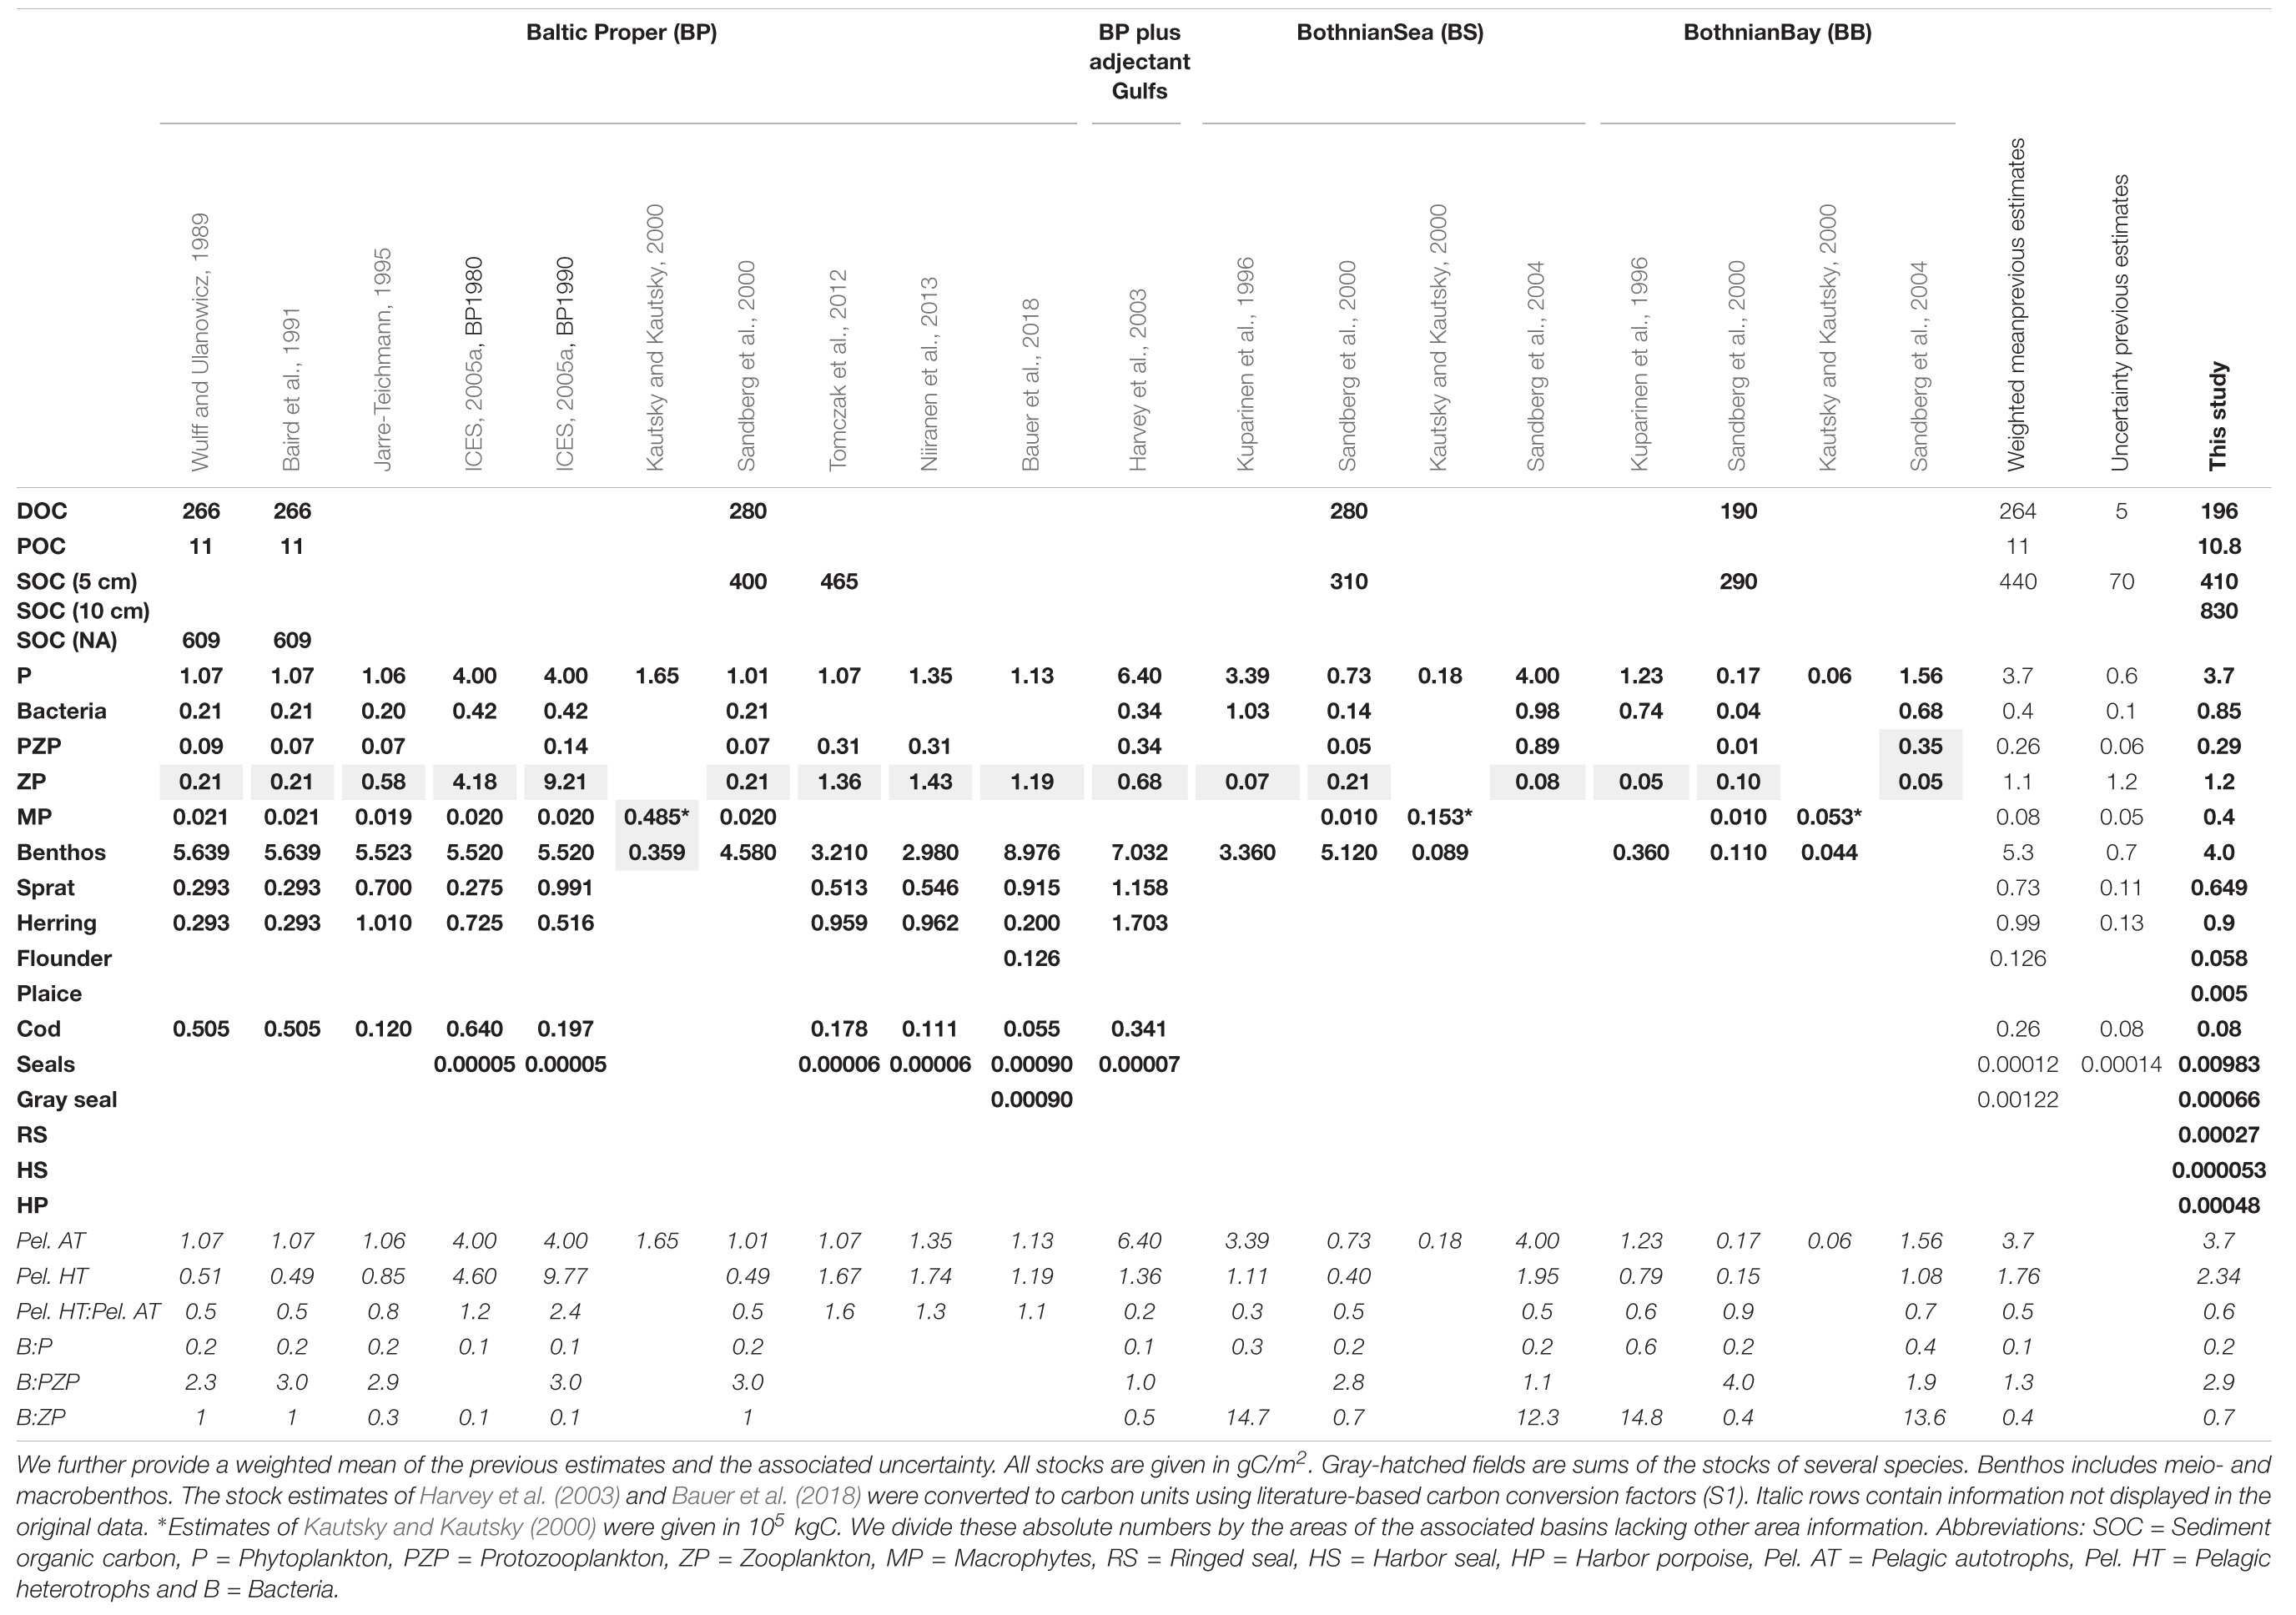
Table 3. Basin-specific estimates from previous studies compared to our stock estimates.
There is no estimate of the organic sediment carbon stock for the upper 10 cm for the entire Baltic Sea yet. To assess whether our estimate of 830 ± 90 gC/m2 is appropriate, we compare our result with the sediment carbon stock of the Northwest European (NWE) continental shelf by Diesing et al. (2017). Our estimate is above the estimated range of 206–793 gC/m2 by Diesing et al. (2017) (10 cm) and twice the estimated mean of 476 gC/m2. The most likely explanation for the difference lies in the higher carbon contents (POC%) of the Baltic Sea sediments used in this study (0.44–11%) compared to POC% of the NWE shelf of 0.03–2.74% used by Diesing et al. (2017). Higher sedimentary POC% values are reasonable, since the Baltic Sea sediments show generally higher TOC contents compared to global values (Bunke et al., 2019). This is also reflected in Atwood et al. (2015) describing the Baltic Sea as a carbon hotspot (high carbon stock per unit area). Based on this assessment of Atwood et al. (2015) and the similarity of our estimate to previous basin-specific assessments, we conclude that our estimate is appropriate.
In contrast to many studies using average POC% or at least average dry bulk densities (DBD) for the sediment profile, we incorporate DBD and POC% changes with sediment depth. Although this method is more accurate since POC%, DBD and thus POC concentrations are known to change with sediment depth, our approach is subject to uncertainties as we use correlations for POC% below 2.5% (for erosion and transport bottoms) that are not specific for the Baltic Sea. To account for the uncertainty of our approach, we set the uncertainty of sediment POC concentrations associated with POC% below 2.5% to ±30 gC/m2, based on the variability of the POC%-POC concentration correlation given by Leipe et al. (2011). However, the coarse resolution of sediments (erosion, transport and accumulation bottoms) is another source of uncertainty and more research on depth-depending DBD, POC% and POC concentrations for all relevant sediment types in different depths and distances from the shore are needed.
Our DOC stock is of similar magnitude but lower than most of the basin-specific stock estimates (Table 3). The difference to our stock estimates is probably due to the fact that these estimates are based on a higher DOC concentration (4.5 gC/m3 by Sandberg et al., 2000) than ours. We can only assume that this higher DOC concentration is due to a higher data proportion of surface water and/or of the growing season.
Compared to the stock estimate for the entire Baltic Sea of 75 ± 2 TgC corresponding to 179 ± 4 gC/m2 by Gustafsson et al. (2014), our estimate of 196 ± 4 gC/m2 is of similar magnitude. The estimated DOC concentration by Legge et al. (2020) used for the mean depth of the study area of Diesing et al. (2017) results in 40–88 gC/m2. Our estimate is about 2–5 larger than the estimate of the NWE shelf. This is close to reported 3–4 higher DOC concentrations in the Baltic Sea compared to open ocean systems (Hagström et al., 2001) due to high riverine DOC inputs (Kulinski and Pempkowiak, 2011; Deutsch et al., 2012) and to high residence times of water (Savchuk, 2005) and refractory DOC (Seidel et al., 2017). Besides, our average DOC concentration of 3.88 ± 0.07 gC/m3 (before depth integration) is within the estimated concentrations for the Baltic Sea of 3.2–4.6 gC/m3 (Hagström et al., 2001; Nausch et al., 2002; Hoikkala et al., 2015). These similarities suggest that our DOC stock estimate is reasonable.
Among previous studies on organic carbon stocks of the Baltic Sea (Table 3), a basin-specific POC stock estimate is only available for the Baltic Proper by Wulff and Ulanowicz (1989). Our estimate of 10.8 gC/m2 is very similar to their result. A more detailed comparison is not possible as data and method description in Wulff and Ulanowicz (1989) is missing.
The model-based estimate of the POC of the Baltic Sea by Gustafsson et al. (2014) suggests much smaller values of 1.71 ± 0.17 gC/m2 (0.72 ± 0.07 TgC). Kulinski and Pempkowiak (2012) report surface water concentrations of 0.2–0.8 gC/m3 for shelf seas and 0.1–1.0 gC/m3 for the Baltic Sea. Our concentration estimate of 0.214 gC/m3 (before depth integration) is at the lower limit of these ranges, probably because we include deeper water layers with lower POC concentrations. In addition, our estimate fits POC concentrations of 0.08–0.48 gC/m3 (Legge et al., 2020) for the NWE shelf and a POC stock of 5.6–32.1 gC/m2 for the study area of Diesing et al. (2017).
A possible source for our relatively high POC stock is the used proportion of living particles in POC based on Andersson and Rudehäll (1993), who estimated the plankton content of POC in the northern part of the Baltic Sea. As the northern part of the Baltic Sea is less productive than the rest of the Baltic Sea, the planktonic contribution to POC of these parts might not be applicable for the entire Baltic Sea. However, since the mean contribution of phytoplankton to the POC of 25 ± 12% (based on Andersson and Rudehäll, 1993) is very similar to the estimated contribution of 10–30% given by Arteaga et al. (2016) for high latitude (>40°N) and productive marine ecosystems, we consider the planktonic content of POC of 25% as non-critical.
However, the proportion of living particles based on Andersson and Rudehäll (1993) does not include bacteria and zooplankton. To account for these living particles, we recalculate the POC stock with a living content of 50% as lower limit, following the estimate of Hagström et al. (2001) that less than 50% of the particulate organic matter is alive. The resulting POC stock is 9.6 ± 0.6 gC/m2. With a more realistic living content of 36% (ratio of the sum of all estimated pelagic stocks and the sum of all pelagic stocks plus POC), the POC stock is 10.4 ± 0.7 gC/m2. If we additionally include living bacteria below the surface waters by applying a bacterial content of 7% below 20 m depth (ratio of estimated bacteria and bacteria plus POC), the POC stock is 10.2 ± 0.6 gC/m2. All three stocks are smaller (−11%, −4%, and −6%) than our estimate using the percentages of Andersson and Rudehäll (1993) but of similar magnitude. Hence, the proportion of living particles does not lead to a strong overestimation and cannot explain the difference to the estimate of Gustafsson et al. (2014). Due to the small differences and the lack of measured seasonal and mean bacterial and zooplankton content of POC, we keep our original estimate. However, we set the uncertainty of our POC stock at ±1.2 gC/m2 to include our estimate of the lower limit (with 50% living content).
The relative variability of the POC stock is higher than, for example, of the DOC stock (Kulinski and Pempkowiak, 2012). Seasonal and spatial signals are more pronounced and our spatially limited data could influence the outcome disproportionally leading to an overestimation. However, our mean POC concentrations/stocks of the growing (0.286 gC/m3/14.4 gC/m2) and non-growing season (0.109 gC/m3/5.5 gC/m2) for the entire water column are similar to previous values (Nausch et al., 2005; Naumann et al., 2018). In addition, the mean of these two concentrations of 0.198 gC/m3 (10.0 gC/m2) is close to our estimate including seasonal and mean data. We conclude that seasonal signals do not skew our estimate disproportionally.
Our DOC:POC ratio of ∼18 further supports the reasonability of our POC estimate, as it is within the global range of 10–20 given by Kulinski and Pempkowiak (2012). The ratio of 100 by Gustafsson et al. (2014) is well above this global mean ratio. One could argue that this is reasonable due to the higher DOC stocks of the Baltic Sea. However, our DOC estimate agrees well with the one of Gustafsson et al. (2014) and thus the discrepancy is not due to differences in the DOC stocks. Besides, productive systems generally have higher POC stocks and lower DOC:POC ratios (Biddanda et al., 2001). Thus, our estimated DOC:POC ratio and consequently the POC stock are reasonable.
Living Organic Carbon Stocks
Living pools contribute about 1.2% (12.6 ± 1.9 gC/m2) to the TOC stock.
Phytoplankton and macrophytes are the major primary producers of the Baltic Sea, providing the energy basis for the food web. The carbon stock of the primary producers accounts for 4.2 ± 1.6 gC/m2 [0.39% of TOC and 33% of living total organic carbon (lTOC)].
Even though phytoplankton concentrations vary significantly in time and space, our stock estimate of phytoplankton of 3.7 ± 1.5 gC/m2 is very similar to the basin-specific estimates (Table 3). In addition, our mean phytoplankton concentration value of 0.13 ± 0.05 gC/m3 (before depth integration) agrees well with the mean biomass concentration values of 0.12 gC/m3 and 0.13 gC/m3 based on Wasmund et al. (2000) and Wasmund et al. (2016).
Macrophytes stock estimates are not available for the entire Baltic Sea. Our estimated stock of 89.5 ± 2.9 gC/m2 for the reported seagrass areas in the Baltic Sea (2,020 km2) (Table 2) is similar to estimated 85 gC/m2 for macrophytes areas in the North Atlantic by Fourqurean et al. (2012). It also fits well within the reported dry weight range of ∼50–300 gDW/m2 (20–120 gC/m2) for vegetated areas with phytobenthos (Kautsky et al., 2017).
However, Kautsky et al. (2017) estimate an absolute macrophytes stock of ∼0.99 Mt (for BB, BS plus BP), while our estimate for the entire Baltic Sea is only 0.2 ± 0.2 Mt, which is about 5.5 times smaller. The difference lies in the selection of areas covered with macrophytes. In our estimate, we use ∼0.5% of the entire Baltic Sea based on Green and Short (2003) and Boström et al. (2014) as a reference area. If we use 2% of the Baltic Sea area instead, similar to the share of vegetated areas in the NWE shelf (see supplement of Legge et al., 2020) and to 1–2% of global coverage presented in Krause-Jensen et al. (2018) and Attard et al. (2019), our undiluted stock of 89.5 gC/m2 is valid for 8,400 km2. The diluted and the absolute stock for the entire Baltic Sea consequently amount to 1.79 ± 0.06 gC/m2 and 0.75 ± 0.02 Mt. Since these 2% are not verified for the Baltic Sea, we keep our estimate. Nevertheless, it is likely that we underestimate the vegetated areas and thus the macrophytes stock of the Baltic Sea. We use the stock estimate with 2% coverage as an upper limit.
Macrophytes may locally enhance carbon contents of sediments compared to the not vegetated state and are associated with sediment carbon stocks of 251–4,324 gC/m2 for the upper 25 cm (Jankowska et al., 2016; Röhr et al., 2016). To avoid double counting, we do not consider macrophyte-covered sediments separately, but when assessing macrophyte losses, the consequences for the associated sediment stocks must be considered.
The primary consumers, herbivores and detrivores, make up 7 ± 1 gC/m2 (0.64% of TOC and 53% of lTOC). Interestingly, benthos, including meio- and macrobenthos, shows the highest living carbon stock (0.42% TOC and 35% lTOC). The estimate of benthos is of similar magnitude as the basin-specific estimates (Table 3), although the heterogeneous signals for the different basins are strong. The large carbon stock of benthos implies a strong benthic-pelagic coupling with productivity-controlled export fluxes of organic material that feed the benthos. The eutrophic Baltic Sea has strong export fluxes, due to its high bottom surface to volume ratio, high benthic-pelagic connectivity (Kopp et al., 2015; Tamelander et al., 2017; Ehrnsten et al., 2019) and temporarily decoupled zooplankton and phytoplankton peak biomass (Dahlgren, 2010). These fluxes lead to high food supply for benthos but also, if in oversupply, to decreasing oxygen concentrations in bottom waters. Allochthonous organic material can provide an additional energy resource that supports such a high benthic stock (Wikner and Andersson, 2012).
One source of uncertainty for the benthic stock is the extent of the estimated anoxic and hypoxic areas. With an estimated mean area of ∼17% of the Baltic Sea with oxygen concentrations below 2 mlO2/l [according to Hansen et al. (2007); Carstensen et al. (2014a, b), and Hansson et al. (2017)] our diluted stock is 4 ± 1 gC/m2. If we use the ∼30% of the Baltic Sea area below 3 mlO2/l [according to Hansen et al. (2007)], the diluted benthic stock is 3.7 ± 0.8 gC/m2. Since the hypoxic threshold in the Baltic Sea is generally defined as oxygen concentration below 2 mlO2/l (Diaz and Rosenberg, 1995) and the mean lethal oxygen concentration for benthos is ∼1.54 mlO2/l (Vaquer-Sunyer and Duarte, 2008), we use an area of 348,600 km2 (73%) as mean area with sufficient oxygen ratios. The estimated value associated with <3 mlO2/l is well suited as a lower limit of the benthos stock to account for sublethal oxygen concentrations.
Of the other consumer stocks, the protozooplankton stock fits best with the basin-specific estimates, while the bacteria are about three times larger. Estimates of zooplankton, protozooplankton and bacteria vary strongly between the basins (Table 3), due to inter alia the productivity gradient from the eutrophic southwest to the more oligotrophic northern part of the Baltic Sea. This also means that our estimated distribution and size of the planktonic carbon stocks, valid on the scale of the entire Baltic Sea, are not per se valid on a basin-scale since the Baltic Sea exhibits very different planktonic systems in its basins.
Our estimated ratio of pelagic autotrophs and heterotrophs supports the accuracy of our estimates. In contrast to some basin-specific studies (Table 3), the pelagic plankton system of the entire Baltic Sea shows a “bottom-heavy” pyramidal biomass distribution, with biomass decreasing with increasing trophic level. Phytoplankton has a larger biomass compared to its consumers (heterotrophic/autotrophic ratio of 0.6). This is consistent with the finding that eutrophied planktonic systems are dominated by phytoplankton biomass (Dortch and Packard, 1989) and support lower heterotrophic: autotrophic ratios (H:A ratios) than systems with lower phytoplankton biomass (Gasol et al., 1997). Accordingly, our H:A ratio of 0.6 fits reported H:A ratios for comparable phytoplankton biomasses by Gasol et al. (1997).
Our estimates of zooplankton and bacteria are in the same order of magnitude as other estimates for similar phytoplankton stocks (see Figure 2 in Gasol et al., 1997). Our zooplankton stock is about 1.4 times larger than that of bacteria fitting a zooplankton to bacteria ratio of 1.4 estimated for coastal systems by Gasol et al. (1997). In contrast to open ocean systems, coastal systems have a higher proportion of zooplankton biomass and a stronger coupling of primary production to the grazing chain than to the microbial loop. As most of the Baltic Sea resembles a coastal system rather than an open ocean system with its shallow water depth, the proximity of the coast and strong terrestrial influence, it is dominated by higher zooplankton than bacteria stocks (Gasol et al., 1997).
Interestingly, the unusually high DOC stock compared to open ocean systems does not lead to bacterial dominance in the planktonic system. The bacterial stock seems to be limited to some extent and unable to use the entire available DOC. Probable but not exclusive causes could be a high proportion of refractory DOC (Kuliński et al., 2016), light or temperature limited bacterial growth and/or competition between phytoplankton and bacteria for nutrients (Church, 2008). The large surface-to-volume ratio of bacteria is advantageous in nutrient-limited systems but does not bring any advantage in productive systems (Azam et al., 1983; Cotner and Biddanda, 2002). On the contrary, in areas with periodic nutrient input like the Baltic Sea, larger cells like phytoplankton are advantageous, as they can store nutrients (Cotner and Biddanda, 2002).
Protozooplankton plays only a minor role in coastal systems and its stock is on average 2–4 times smaller than that of zooplankton (Gasol et al., 1997). In our case, the protozooplankton stock is 4 times smaller. Since our protozooplankton stock is at the lower limit, this might indicate a stock limitation, such as top–down regulation by zooplankton. The ratio and the small difference to the mean of the basin-specific estimates suggest a reasonable protozooplankton stock.
The standing stock of secondary consumers (sprat, herring, flounder, plaice) and tertiary consumers (cod) amount to 1.6 ± 0.5 gC/m2 (0.002% TOC and 13% lTOC) and 0.08 ± 0.06 gC/m2 (<0.001% TOC and 0.6% lTOC). Our stock estimates of sprat and herring are smaller than the mean of the basin-specific estimates but within the uncertainty range. Similar to the weighted mean of the basin-specific estimates, our sprat stock is lower than the herring stock. This is further supported by the temporal development of the clupeid stocks (sprat and herring) reported by HELCOM, which are on average of similar size, with a recent trend toward higher herring stocks (HELCOM, 2017).
Due to different salinity tolerances, flounder is more abundant in the Baltic Sea than plaice (Ojaveer et al., 2010), which is reflected in our stock estimates. Further, the cod stock is significantly smaller than the clupeid stocks. This ratio is consistent with the Baltic Sea regime change from a cod-dominated to a clupeid-dominated system (Österblom et al., 2007). However, apart from these similarities, our estimates for flounder and cod are much smaller than the basin-specific estimates for the Baltic Proper. We can only assume that the reasons for these differences are limited data (i.e., for flounder only ICES units 24–25) and/or the high interannual and spatial variability of fish stocks, which is reflected in the broad range of basin-specific estimates (i.e., for cod 0.055–0.640 gC/m2, Table 3) and in the high uncertainties of our fish stock estimates. Although our fish-stock estimates are subject to considerable uncertainty, we use them nevertheless as they are the only available estimates for the entire Baltic Sea.
The Baltic Sea is home to about 230 species of fish. Due to lack of data, we cannot estimate the stocks of most of these species. Stocks of these fish species could be around 0.09–0.40 gC/m2 (including flounder and plaice), assuming that clupeids and cod represent 80% (Elmgren, 1984) to 95% (Thurow, 1980) of all fish stocks.
The standing stock of the highest trophic level accounts for 0.0015 ± 0.0004 gC/m2 (<0.001%TOC and <0.001% lTOC). The few basin-specific estimates given do not allow for a comparison and a discussion about the accuracy of our estimates. However, our overall estimates remain reasonable, as these stocks, due to their small size, do not significantly alter the TOC stock. Their importance for this stock quantification is small. However, this does not necessarily mean that their influence on carbon fluxes and their contribution to the carbon cycle (see Figure 5) is insignificant (Schmitz et al., 2014).
One of the most interesting results concerning all living stocks is that our estimated stocks form a partially inverted biomass pyramid with a higher stock of primary consumers than primary producers (Figure 6). This distribution is consistent with most basin-specific estimates (Table 2) and remains consistent if we add the upper limit of macrophytes of 1.79 gC/m2 (2% areal coverage) and the lower limit of benthos of 3.7 gC/m2 (30% lethal area).
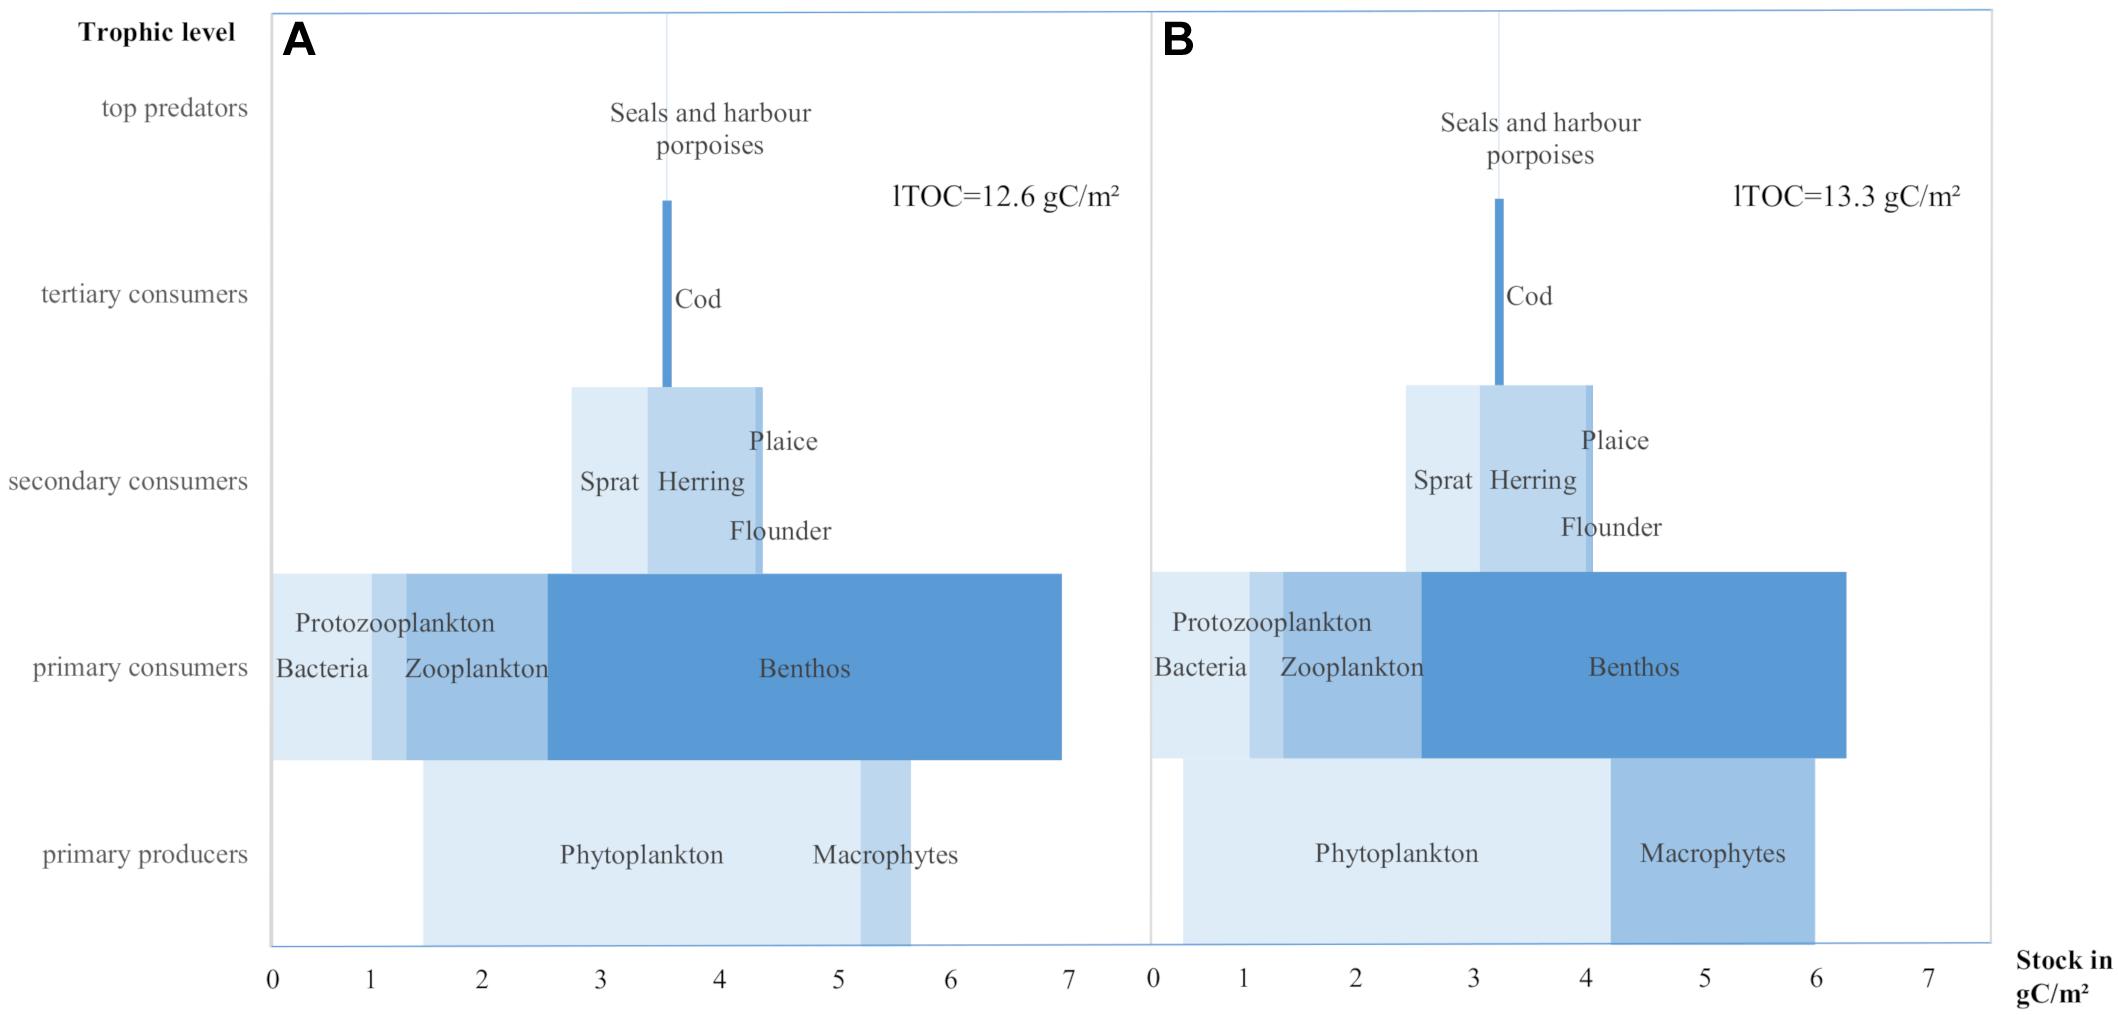
Figure 6. Carbon stocks per trophic level valid for the entire Baltic Sea area. (A) With the macrophytes covering 2,020 km2 and benthos 349,349 km2 (areas < 2 mlO2/l) and total living carbon (lTOC) of 12.6 gC/m2. (B) With macrophytes covering 8,400 km2 (2% of entire Baltic Sea area) and benthos 295,105 km2 (areas < 3 mlO2/l) and lTOC of 13.3 gC/m2.
Recent studies suggest that inverted pyramids or some kind of top-heaviness may be more common than previously thought, even in environments with which they were not originally associated (Trebilco et al., 2016; Bar-On et al., 2018; Woodson et al., 2018). Responsible for the non-Eltonian/partly inverted biomass distribution in the Baltic Sea, and in the basin-specific studies, is the magnitude of the benthic biomass. While not all benthic species belong to the second trophic level, the majority of benthic species feed on primary producers or detritus and thus belong to the primary consumers (Sokołowski et al., 2012). We assume that the huge stock of benthos and the partly inverted biomass pyramid are consequences of allochthonous subsidies of riverine organic material (Bartels et al., 2018), lower turnovers rates of benthos, access to different resources due to moderate morphological complexity and omnivores feeding modes [as described for other systems by Trebilco et al. (2013, 2016) and McCauley et al. (2018)].
Contemporary Stocks and Future Changes
The quantification of organic carbon stocks is the first step. Analyses of inorganic carbon stocks, the interplay between inorganic and organic stocks and the processes governing the cycling of these stocks must follow to further define today’s baseline of carbon stocks in the Baltic Sea. With the help of such a baseline, the impact of measures on carbon stocks can be assessed. Such carbon impact assessments are a prerequisite for identifying losses of carbon stocks, discussing possible strategies to increase total carbon stocks as a mitigation measure and increasing incentives to leave natural resources untouched (Ajani et al., 2013). However, the value of carbon stocks to society has not yet been taken into account and needs to be defined. How socio-economic objectives and the conservation of carbon stocks can be reconciled or balanced against each other remains to be discussed.
Conclusion
We present the first detailed quantification of all relevant living and non-living organic carbon stocks for the entire Baltic Sea ecosystem. In addition, we describe in detail data sources, methods and the associated uncertainties that allow reproduction and critical evaluation of our estimates.
Apart from the estimates themselves, some interesting aspects stand out. Our estimated POC stock is higher than some previous studies suggest. Whether this potential difference in magnitude has consequences for the carbon cycle of the Baltic Sea remains to be investigated. Some earlier basin-specific studies in the Baltic Proper show a higher zooplankton than phytoplankton biomass. We cannot confirm this for the entire Baltic Sea ecosystem. Besides, productive, coastal and eutrophic systems are generally not associated with inverse biomass distributions. However, we do find such a partially inverse biomass distribution if benthos is considered. Therefore, we need to rethink biomass distribution and investigate the mechanisms that can lead to such a partially inverse biomass distribution in eutrophic systems such as the Baltic Sea.
Challenges for the quantification of carbon stocks are uncertainties and data limitations. Although the Baltic Sea is well monitored, the differences in the available data are enormous and limit our estimates. In particular, data on planktonic, microbial, benthic and fish biomass as well as on macrophytes-covered areas and sediment properties need to be improved. For benthic bacteria and macrophytes-associated sediments, not sufficient data are available to avoid double counting with the sediment stock. In addition, we need to improve carbon-concentration estimates, find common reporting and calculation methods and communicate uncertainties to avoid misinterpretation of the accuracy of carbon stock estimates. Because of the variability and scarcity of data and the resulting wide range of assumptions and calculations, we do not aim for concrete numbers, nor do our estimates represent concrete numbers, but rather orders of magnitude.
The present study provides estimates of the contemporary organic carbon stock. This quantification can be seen as a baseline for further studies focusing on the stability of these stocks and their response to ongoing environmental changes. Given the ongoing anthropogenic activities and management strategies in the Baltic Sea, carbon stocks and their responses need to become more relevant for impact assessments.
Data Availability Statement
Publicly available datasets were analyzed in this study. This data can be found here: PANGAEA (https://doi.org/10.1594/PANGAEA.925062).
Author Contributions
MS conceived and designed the study, performed the research, analyzed the data, contributed new methods, and wrote the manuscript. IH conceived and designed the study, contributed new methods, and wrote the manuscript. Both authors contributed to the article and approved the submitted version.
Funding
This study has been funded by the Deutsche Forschungsgemeinsc haft (DFG, German Research Foundation) under Germany’s Excellence Strategy – EXC 2037 ‘CLICCS – Climate, Climatic Change, and Society’ – Project Number: 390683824, contribution to the Center for Earth System Research and Sustainability (CEN) of Universität Hamburg.
Conflict of Interest
The authors declare that the research was conducted in the absence of any commercial or financial relationships that could be construed as a potential conflict of interest.
Acknowledgments
Our special thanks go to Laurin Steidle, Felix Pellerin, and Rémy Asselot for their valuable feedback and to ICES and HELCOM for their quick and helpful explanations on their data. We also thank the three reviewers for their critical but helpful comments.
Supplementary Material
The Supplementary Material for this article can be found online at: https://www.frontiersin.org/articles/10.3389/fmars.2020.571956/full#supplementary-material
References
Ajani, J. I., Keith, H., Blakers, M., Mackey, B. G., and King, H. P. (2013). Comprehensive carbon stock and flow accounting: a national framework to support climate change mitigation policy. Ecol. Econ. 89, 61–72. doi: 10.1016/j.ecolecon.2013.01.010
Al-Hamdani, Z. K., and Reker, J. (2007). Towards Marine Landscapes in the Baltic Sea. BALANCE Interim Report No. 10. Available online at: http://balance-eu.org/ (accessed November 05, 2019).
Almroth-Rosell, E., Eilola, K., Hor, R., Meier, H. M., and Hall, P. O. J. (2011). Transport of fresh and resuspended particulate organic material in the Baltic Sea — a model study. J. Mar. Syst. 87, 1–12. doi: 10.1016/j.jmarsys.2011.02.005
Andersson, A., and Rudehäll, Å. (1993). Proportion of plankton biomass in particulate organic carbon in the northern Baltic Sea. Mar. Ecol. Prog. Ser. 95, 133–139. doi: 10.3354/meps095133
Arteaga, L., Pahlow, M., and Oschlies, A. (2016). Modeled Chl:C ratio and derived estimates of phytoplankton carbon biomass and its contribution to total particulate organic carbon in the global surface ocean. Glob. Biogeochem. Cycl. 30, 1791–1810. doi: 10.1002/2016GB005458
Attard, K. M., Rodil, I. F., Berg, P., Norkko, J., Norkko, A., and Glud, R. N. (2019). Seasonal metabolism and carbon export potential of a key coastal habitat: the perennial canopy-forming macroalga Fucus vesiculosus. Limnol. Oceanogr. 64, 149–164. doi: 10.1002/lno.11026
Atwood, T. B., Connolly, R. M., Ritchie, E. G., Lovelock, C. E., Heithaus, M. R., Hays, G. C., et al. (2015). Predators help protect carbon stocks in blue carbon ecosystems. Nat. Clim. Change 5, 1038–1045. doi: 10.1038/nclimate2763
Azam, F., Fenchel, T., Field, J. G., Gray, J. S., and La Meyer-Reil, and Thingstad, F. (1983). The ecological role of water-column microbes in the sea. Mar. Ecol. Prog. Ser. 10, 257–263. doi: 10.3354/meps010257
Baird, D., McGlade, J. M., and Ulanowicz, R. E. (1991). The comparative ecology of six marine ecosystems. Philos. Trans. Royal Soc. B Biol. Sci. 333, 15–29. doi: 10.1098/rstb.1991.0058
Bar-On, Y. M., Phillips, R., and Milo, R. (2018). The biomass distribution on earth. Proc. Natl. Acad. Sci. U.S.A. 115, 6506–6511. doi: 10.1073/pnas.1711842115
Bartels, P., Ask, J., Andersson, A., Karlsson, J., and Giesler, R. (2018). Allochthonous organic matter supports benthic but not pelagic food webs in shallow coastal ecosystems. Ecosystems 21, 1459–1470. doi: 10.1007/s10021-018-0233-5
Bauer, B., Meier, H. E. M., Casini, M., Hoff, A., Margoński, P., Orio, A., et al. (2018). Reducing eutrophication increases spatial extent of communities supporting commercial fisheries: a model case study. ICES J. Mar. Sci. 75, 1306–1317. doi: 10.1093/icesjms/fsy003
Benke, H., Bräger, S., Dähne, M., Gallus, A., Hansen, S., Honnef, C. G., et al. (2014). Baltic Sea harbour porpoise populations: status and conservation needs derived from recent survey results. Mar. Ecol. Prog. Ser. 495, 275–290. doi: 10.3354/meps10538
Biddanda, B., Ogdahl, M., and Cotner, J. (2001). Dominance of bacterial metabolism in oligotrophic relative to eutrophic waters. Limnol. Oceanogr. 46, 730–739. doi: 10.4319/lo.2001.46.3.0730
Bossier, S., Palacz, A. P., Nielsen, J. R., Christensen, A., Hoff, A., Maar, M., et al. (2018). The Baltic Sea Atlantis: an integrated end-to-end modelling framework evaluating ecosystem-wide effects of human-induced pressures. PLoS One 13:e0199168. doi: 10.1371/journal.pone.0199168
Boström, C., Baden, S., Bockelmann, A. -C., Dromph, K., Fredriksen, S., Gustafsson, C., et al. (2014). Distribution, structure and function of Nordic eelgrass (Zostera marina) ecosystems: implications for coastal management and conservation. Aquat. Conserv. Mar. Freshw. Ecosyst. 24, 410–434. doi: 10.1002/aqc.2424
Bunke, D., Leipe, T., Moros, M., Morys, C., Tauber, F., Virtasalo, J. J., et al. (2019). Natural and anthropogenic sediment mixing processes in the south-western Baltic Sea. Front. Mar. Sci.6:677. doi: 10.3389/fmars.2019.00677
Burrows, M. T., Hughes, D. J., Austin, W. E.N., Smeaton, C., Hicks, N., Howe, J. A., et al. (2017). Assessment of Blue Carbon Resources in Scotland’s Inshore Marine Protected Area Network. Scottish Natural Heritage Commissioned Report 957, Scottish Natural Heritage, Scotland.
Carman, R., and Cederwall, H. (2001). “Sediments and macrofauna in the Baltic Sea—characteristics, nutrient contents and distribution,” in A Systems Analysis of the Baltic Sea, eds F. V. Wulff, L. A. Rahm, and P. Larsson (Berlin: Springer-Verlag), 289–327. doi: 10.1007/978-3-662-04453-7_11
Carstensen, J., Andersen, J. H., Gustafsson, B. G., and Conley, D. J. (2014a). Deoxygenation of the Baltic Sea during the last century. Proc. Natl. Acad. Sci. U.S.A. 111, 5628–5633. doi: 10.1073/pnas.1323156111
Carstensen, J., Conley, D., and Müller-Karulis, B. (2003). Spatial and temporal resolution of carbon fluxes in a shallow coastal ecosystem, the Kattegat. Mar. Ecol. Prog. Ser. 252, 35–50. doi: 10.3354/meps252035
Carstensen, J., Conley, D. J., Bonsdorff, E., Gustafsson, B. G., Hietanen, S., Janas, U., et al. (2014b). Hypoxia in the Baltic Sea: biogeochemical cycles, benthic fauna, and management. Ambio 43, 26–36. doi: 10.1007/s13280-013-0474-7
Church, M. J. (2008). “Resource Control of Bacterial Dynamics in the Sea,” in Microbial Ecology of the Oceans, ed. D. L. Kirchman (Hoboken, NJ: Wiley-Blackwell), 335–382. doi: 10.1002/9780470281840.ch10
Cisternas-Novoa, C., Le Moigne, F. A. C., and Engel, A. (2019). Composition and vertical flux of particulate organic matter to the oxygen minimum zone of the central Baltic Sea: impact of a sporadic North Sea inflow. Biogeosciences 16, 927–947. doi: 10.5194/bg-16-927-2019
Cotner, J. B., and Biddanda, B. A. (2002). Small players, large role: microbial influence on biogeochemical processes in pelagic aquatic ecosystems. Ecosystems 5, 105–121. doi: 10.1007/s10021-001-0059-3
Dahl, M., Deyanova, D., Gütschow, S., Asplund, M. E., Lyimo, L. D., Karamfilov, V., et al. (2016). Sediment properties as important predictors of carbon storage in zostera marina meadows: a comparison of four european areas. PLoS One 11:e0167493. doi: 10.1371/journal.pone.0167493
Dahlgren, K. (2010). Food Web Structures and Carbon Transfer Efficiencies in a Brackish Water Ecosystem. Ph. D Dissertation. Umeå University, Department of Ecology and Environmental Science, Umeå.
Deutsch, B., Alling, V., Humborg, C., Korth, F., and Mörth, C. M. (2012). Tracing inputs of terrestrial high molecular weight dissolved organic matter within the Baltic Sea ecosystem. Biogeosciences 9, 4465–4475. doi: 10.5194/bg-9-4465-2012
Diaz, R. J., and Rosenberg, R. (1995). Marine benthic hypoxia: a review of its ecological effects and the behavioural responses of benthic macrofauna. Oceanogr. Mar. Biol.Annu. Rev. 33, 245-243.
Diesing, M., Kröger, S., Parker, R., Jenkins, C., Mason, C., and Weston, K. (2017). Predicting the standing stock of organic carbon in surface sediments of the North–West European continental shelf. Biogeochemistry 135, 183–200. doi: 10.1007/s10533-017-0310-4
Donali, E., Olli, K., Heiskanen, A. -S., and Andersen, T. (1999). Carbon flow patterns in the planktonic food web of the Gulf of Riga, the Baltic Sea: a reconstruction by the inverse method. J. Mar. Syst. 23, 251–268. doi: 10.1016/S0924-7963(99)00061-5
Dortch, Q., and Packard, T. T. (1989). Differences in biomass structure between oligotrophic and eutrophic marine ecosystems. Deep Sea Res. Part A. Oceanogr. Res. Papers 36, 223–240. doi: 10.1016/0198-0149(89)90135-0
Ehrnsten, E., Norkko, A., Timmermann, K., and Gustafsson, B. G. (2019). Benthic-pelagic coupling in coastal seas – Modelling macrofaunal biomass and carbon processing in response to organic matter supply. J. Mar. Syst. 196, 36–47. doi: 10.1016/j.jmarsys.2019.04.003
Elmgren, R. (1984). Trophic dynamics in the enclosed, brackish Baltic Sea. Rapp. Procès-Verbaux Des Réunions. 183, 152–169.
Feistel, R., Nausch, G., and Wasmund, N. eds (2008). State and Evolution of the Baltic Sea, 1952–2005: A Detailed 50-Year Survey of Meteorology and Climate, Physics, Chemistry, Biology, and Marine Environment. Hoboken, NJ: Wiley-Interscience.
Flemming, B. W., and Delafontaine, M. T. (2016). “Mass Physical Sediment Properties,” in Encyclopedia of Estuaries, ed. M. J. Kennish (Dordrecht: Springer Science+Business Media), 419–432. doi: 10.1007/978-94-017-8801-4_350
Fourqurean, J. W., Duarte, C. M., Kennedy, H., Marbà, N., Holmer, M., Mateo, M. A., et al. (2012). Seagrass ecosystems as a globally significant carbon stock. Nat. Geosci. 5, 505–509. doi: 10.1038/ngeo1477
Gasol, J. M., Del Giorgio, P. A., and Duarte, C. M. (1997). Biomass distribution in marine planktonic communities. Limnol. Oceanogr. 42, 1353–1363. doi: 10.4319/lo.1997.42.6.1353
Gast, V., and Gocke, K. (1988). Vertical distribution of number, biomass and size-class spectrum of bacteria in relation to oxic/anoxic conditions in the central Baltic Sea. Mar. Ecol. Prog. Ser. 45, 179–186. doi: 10.3354/meps045179
Gogina, M., Nygård, H., Blomqvist, M., Daunys, D., Josefson, A. B., Kotta, J., et al. (2016). The Baltic Sea scale inventory of benthic faunal communities. ICES J. Mar. Sci. 73, 1196–1213. doi: 10.1093/icesjms/fsv265
Green, E. P., and Short, F. T. (2003). World Atlas of Seagrasses. Berkeley: University of California Press.
Gustafsson, E., Deutsch, B., Gustafsson, B. G., Humborg, C., and Mörth, C. -M. (2014). Carbon cycling in the Baltic Sea — The fate of allochthonous organic carbon and its impact on air–sea CO2 exchange. J. Mar. Syst. 129, 289–302. doi: 10.1016/j.jmarsys.2013.07.005
Hagström, Å., Azam, F., Kuparinen, J., and Zweifel, U.-L. (2001). “Pelagic Plankton Growth and Resource Limitations in the Baltic Sea,” in A Systems Analysis of the Baltic Sea, eds F. V. Wulff, L. A. Rahm, and P. Larsson (Berlin: Springer-Verlag), 177–210. doi: 10.1007/978-3-662-04453-7_7
Hansen, I. S., Keul, N., Sørensen, J. T., Erichsen, A., and Andersen, J. H. (2007). Baltic Sea Oxygen Maps 2000- 2006: BALANCE Interim Report No. 17. Available online at: https://balance-eu.org/ (accessed June 20, 2020).
Hansson, M., Viktorsson, L., and Andersson, L. (2017). Oxygen Survey in the Baltic Sea 2017: Extent of Anoxia and Hypoxia, 1960-2017. Göteborg: SMHI.
Härkönen, T., Harding, K. C., and Lunneryd, S. G. (1999). Age- and sex-specific behaviour in harbour seals Phoca vitulina leads to biased estimates of vital population parameters. J. Appl. Ecol. 36, 825–841. doi: 10.1046/j.1365-2664.1999.00434.x
Härkönen, T., and Heide-Jørgensen, M. P. (1990). Comparative life histories of East Atlantic and other harbour seal populations. Ophelia 32, 211–235. doi: 10.1080/00785236.1990.10422032
Harvey, C. J., Cox, S. P., Essington, T. E., Hansson, S., and Kitchell, J. F. (2003). An ecosystem model of food web and fisheries interactions in the Baltic Sea. ICES J. Mar. Sci. 60, 939–950. doi: 10.1016/s1054-3139(03)00098-5
Hauge, K. H. (2011). Uncertainty and hyper-precision in fisheries science and policy. Futures 43, 173–181. doi: 10.1016/j.futures.2010.10.006
Heinänen, A. P. (1991). Bacterial numbers, biomass and productivity in the Baltic Sea: a cruise study. Mar. Ecol. Prog. Ser. 70, 283–290. doi: 10.3354/meps070283
HELCOM (2015). BALSAM Seal Count Dataset. Available online at: http://metadata.helcom.fi/geonetwork/srv/eng/catalog.search#/metadata/326a86a4-5a83-44d9-a119-70daa20495b2 (accessed July 09, 2020).
HELCOM (2017). First Version of the ‘State of the Baltic Sea’ Report-June 2017- to be Updated in 2018. Helsinki: HELCOM Baltic Marine Environment Protection Commission. Available online at: http://stateofthebalticsea.helcom.fi (accessed February 10, 2019).
Hoikkala, L., Kortelainen, P., Soinne, H., and Kuosa, H. (2015). Dissolved organic matter in the Baltic Sea. J. Mar. Syst. 142, 47–61. doi: 10.1016/j.jmarsys.2014.10.005
Holst, M., Stirling, I., and Calvert, W. (2006). Age structure and reproductive rates of ringed seals (Phoca hispida) on the northwestern coast of Hudson Bay in 1991 and 1992. Mar. Mammal Sci. 15, 1357–1364. doi: 10.1111/j.1748-7692.1999.tb00898.x
ICES (2005a). Report of the Study Group on Baltic Sea Productivity Issues in Support of the BSRP (SGPROD). Klaipeda: ICES.
ICES (2018b). Baltic Sea Ecoregion-Fisheries overview: ICES Advice. Gothenburg: ICES. doi: 10.17895/ices.pub.4389
ICES (2018c). ICES Environmental Database (DOME): Phytoplankton Data. Available online at: http://gis.ices.dk/geonetwork/srv/eng/catalog.search#/metadata/33fa648d-c4d6-4449-ac3c-dbec0f204e1d (accessed October 10, 2018).
ICES (2018d). ICES Environmental Database (DOME): Zooplankon Data. Available online at: http://gis.ices.dk/geonetwork/srv/eng/catalog.search#/metadata/33fa648d-c4d6-4449-ac3c-dbec0f204e1d (accessed October 10, 2018).
Jakobsson, M., Stranne, C., O’Regan, M., Greenwood, S. L., Gustafsson, B., Humborg, C., et al. (2019). Bathymetric properties of the Baltic Sea. Ocean Sci. 15, 905–924. doi: 10.5194/os-15-905-2019
Jankowska, E., Jankowska, K., and Włodarska-Kowalczuk, M. (2015). Seagrass vegetation and meiofauna enhance the bacterial abundance in the Baltic Sea sediments (Puck Bay). Environ. Sci. Pollut. Res. Int. 22, 14372–14378. doi: 10.1007/s11356-015-5049-7
Jankowska, E., Michel, L. N., Zaborska, A., and Włodarska-Kowalczuk, M. (2016). Sediment carbon sink in low-density temperate eelgrass meadows (Baltic Sea). Biogeosciences 121, 2918–2934. doi: 10.1002/2016JG003424
Jankowska, E., Włodarska-Kowalczuk, M., Kotwicki, L., Balazy, P., and Kuliński, K. (2014). Seasonality in vegetation biometrics and its effects on sediment characteristics and meiofauna in Baltic seagrass meadows. Estuar. Coast. Shelf Sci. 139, 159–170. doi: 10.1016/j.ecss.2014.01.003
Jarre-Teichmann, A. (1995). Seasonal mass-balance models of carbon flow in the Central Baltic Sea with emphasis on the upper trophic levels. ICES CM 6:26.
Kauhala, K., Ahola, M. P., and Kunnasranta, M. (2012). Demographic structure and mortality rate of a baltic grey seal population at different stages of population change, judged on the basis of the hunting bag in finland. Ann. Zool. Fenn. 49, 287–305. doi: 10.5735/086.049.0502
Kautsky, H., Martin, G., and Snoeijs-Leijonmalm, P. (2017). “The phytobenthic zone,” in Biological Oceanography of the Baltic Sea, eds P. Snoeijs-Leijonmalm, H. Schubert, and T. Radziejewska (Dordrecht: Springer), 387–455. doi: 10.1007/978-94-007-0668-2_11
Kautsky, H., Widbom, B., and Wulff, F. (1981). Vegetation macrofauna and benthic meiofauna in the phytal zone of the archipelago of Luleå-Bothnian Bay. Ophelia 20, 53–77. doi: 10.1080/00785236.1981.10426562
Kautsky, L., and Kautsky, N. (2000). “The Baltic sea, including Bothnian Sea and Bothnian Bay,” in Seas at the Millennium: An Environmental Evaluation, ed. C. Sheppard (Amsterdam: Pergamon), 1–14.
Kopp, D., Lefebvre, S., Cachera, M., Villanueva, M. C., and Ernande, B. (2015). Reorganization of a marine trophic network along an inshore–offshore gradient due to stronger pelagic–benthic coupling in coastal areas. Prog. Oceanogr. 130, 157–171. doi: 10.1016/j.pocean.2014.11.001
Krafft, B. A., Kovacs, K., Kristine Frie, A., Haug, T., and Lydersen, C. (2006). Growth and population parameters of ringed seals (Pusa hispida) from Svalbard, Norway, 2002 - 2004. ICES J. Mar. Sci. 63, 1136–1144. doi: 10.1016/j.icesjms.2006.04.001
Krause-Jensen, D., Lavery, P., Serrano, O., Marbà, N., Masque, P., and Duarte, C. M. (2018). Sequestration of macroalgal carbon: the elephant in the Blue Carbon room. Biol. Lett. 14:20180236. doi: 10.1098/rsbl.2018.0236
Kuliński, K., Hammer, K., Schneider, B., and Schulz-Bull, D. (2016). Remineralization of terrestrial dissolved organic carbon in the Baltic Sea. Mar. Chem. 181, 10–17. doi: 10.1016/j.marchem.2016.03.002
Kulinski, K., and Pempkowiak, J. (2011). The carbon budget of the Baltic Sea. Biogeosciences 8:3219. doi: 10.5194/bg-8-3219-2011
Kumblad, L., Gilek, M., Næslund, B., and Kautsky, U. (2003). An ecosystem model of the environmental transport and fate of carbon-14 in a bay of the Baltic Sea, Sweden. Ecol. Model. 166, 193–210. doi: 10.1016/S0304-3800(03)00135-2
Kuparinen, J., Leonardsson, K., Mattila, J., and Wikner, J. (1996). Food Web Structure and Function in the Gulf of Bothnia, the Baltic Sea. Stockholm: Kungl. Vetenskapsakademien, 13–21.
Legge, O., Johnson, M., Hicks, N., Jickells, T., Diesing, M., Aldridge, J., et al. (2020). Carbon on the northwest european shelf: contemporary budget and future influences. Front. Mar. Sci. 7:143. doi: 10.3389/fmars.2020.00143
Leipe, T., Tauber, F., Vallius, H., Virtasalo, J., Uścinowicz, S., Kowalski, N., et al. (2011). Particulate organic carbon (POC) in surface sediments of the Baltic Sea. Geo Mar. Lett. 31, 175–188. doi: 10.1007/s00367-010-0223-x
Lønborg, C., Carreira, C., Jickells, T., and Álvarez-Salgado, X. A. (2020). Impacts of global change on ocean dissolved organic carbon (DOC) cycling. Front. Mar. Sci.7:466. doi: 10.3389/fmars.2020.00466
Luisetti, T., Turner, R. K., Andrews, J. E., Jickells, T. D., Kröger, S., Diesing, M., et al. (2019). Quantifying and valuing carbon flows and stores in coastal and shelf ecosystems in the UK. Ecosyst. Serv. 35, 67–76. doi: 10.1016/j.ecoser.2018.10.013
Lundstedt-Enkel, K., Roos, A., Nylund, K., and Asplund, L. (2008). Contaminants in Baltic Sea male and female grey seals (Halichoerus grypus) of different ages. Organohalogen Compounds 70, 929–932.
Lutz, S. J., and Martin, A. H. (2014). Fish Carbon: Exploring Marine Vertebrate Carbon Services. GRID-Arendal, Arendal.
Maciejewska, A., and Pempkowiak, J. (2014). DOC and POC in the water column of the southern Baltic. SnPart SnI. Evaluation of factors influencing sources, distribution and concentration dynamics of organic matter. Oceanologia 56, 523–548. doi: 10.5697/oc.55-3.523
McCauley, D. J., Gellner, G., Martinez, N. D., Williams, R. J., Sandin, S. A., Micheli, F., et al. (2018). On the prevalence and dynamics of inverted trophic pyramids and otherwise top-heavy communities. Ecol. Lett. 21, 439–454. doi: 10.1111/ele.12900
Miller, L. A., and Wahlberg, M. (2013). Echolocation by the harbour porpoise: life in coastal waters. Front. Physiol. 4:52. doi: 10.3389/fphys.2013.00052
Naumann, M., Umlauf, L., Mohrholz, V., Kuss, J., Siegel, H., Waniek, J. J., et al. (2018). Hydrographic-Hydrochemical Assessment of the Baltic Sea 2017. Warnemünde: Leibniz-Institut für Ostseeforschung Warnemünde.
Nausch, G., Feistel, R., Lass, H., Nagel, K., and Siegel, H. (2002). Hydrographisch-chemische Zustandseinschätzung der Ostsee 2001. Warnemünde: Leibniz-Institut für Ostseeforschung Warnemünde.
Nausch, G., Feistel, R., Lass, H. U., Nagel, K., Siegel, H., Pohl, C., et al. (2005). Hydrographisch-chemische Zustandseinschätzung der Ostsee 2004. Warnemünde: Leibniz-Institut für Ostseeforschung Warnemünde.
Nausch, G., Feistel, R., Lass, H. U., Nagel, K., Siegel, H., Pohl, C., et al. (2006). Hydrographisch-chemische Zustandseinschätzung der Ostsee 2005. Warnemünde: Leibniz-Institut für Ostseeforschung Warnemünde.
Niiranen, S., Yletyinen, J., Tomczak, M. T., Blenckner, T., Hjerne, O., MacKenzie, B. R., et al. (2013). Combined effects of global climate change and regional ecosystem drivers on an exploited marine food web. Glob. Chang Biol. 19, 3327–3342. doi: 10.1111/gcb.12309
Nilsson, M. M., Kononets, M., Ekeroth, N., Viktorsson, L., Hylén, A., Sommer, S., et al. (2019). Organic carbon recycling in Baltic Sea sediments – An integrated estimate on the system scale based on in situ measurements. Mar. Chem. 209, 81–93. doi: 10.1016/j.marchem.2018.11.004
Ojaveer, H., Jaanus, A., MacKenzie, B. R., Martin, G., Olenin, S., Radziejewska, T., et al. (2010). Status of biodiversity in the Baltic Sea. PLoS One 5:e12467. doi: 10.1371/journal.pone.0012467
Österblom, H., Hansson, S., Larsson, U., Hjerne, O., Wulff, F., Elmgren, R., et al. (2007). Human-induced trophic cascades and ecological regime shifts in the Baltic Sea. Ecosystems 10, 877–889. doi: 10.1007/s10021-007-9069-0
Pante, E., and Simon-Bouhet, B. (2013). marmap: a package for importing, plotting and analyzing bathymetric and topographic data in R. PLoS One 8:e73051. doi: 10.1371/journal.pone.0073051
Purina, I., Labucis, A., Barda, I., Jurgensone, I., and Aigars, J. (2018). Primary productivity in the Gulf of Riga (Baltic Sea) in relation to phytoplankton species and nutrient variability. Oceanologia 60, 544–552. doi: 10.1016/j.oceano.2018.04.005
Risén, E., Pechsiri, J. S., Malmström, M. E., Brandt, N., and Gröndahl, F. (2013). “Natural Resource Potential of Macroalgae Harvesting in the Baltic Sea-Case Study Trelleborg, Sweden,” in Global Challenges in Integrated Coastal Zone Management, eds E. Moksness, E. Dahl, and J. Støttrup (Oxford: John Wiley & Sons, Ltd), 69–84. doi: 10.1002/9781118496480.ch6
Röhr, M. E., Boström, C., Canal-Vergés, P., and Holmer, M. (2016). Blue carbon stocks in Baltic Sea eelgrass (Zostera marina) meadows. Biogeosciences 13, 6139–6153. doi: 10.5194/bg-13-6139-2016
Sandberg, J., Andersson, A., Johansson, S., and Wikner, J. (2004). Pelagic food web structure and carbon budget in the northern Baltic Sea: potential importance of terrigenous carbon. Mar. Ecol. Prog. Ser. 268, 13–29. doi: 10.3354/meps268013
Sandberg, J., Elmgren, R., and Wulff, F. (2000). Carbon flows in Baltic Sea food webs — a re-evaluation using a mass balance approach. J. Mar. Syst. 25, 249–260. doi: 10.1016/S0924-7963(00)00019-1
Savchuk, O. P. (2005). Resolving the Baltic Sea into seven subbasins: N and P budgets for 1991–1999. J. Mar. Syst. 56, 1–15. doi: 10.1016/j.jmarsys.2004.08.005
Scheffold, M., and Hense, I. (2020). Estimates of Biomass Carbon Stocks of the Baltic Sea Ecosystem, Version 2. doi: 10.1594/PANGAEA.925062
Schmitz, O. J., Raymond, P. A., Estes, J. A., Kurz, W. A., Holtgrieve, G. W., Ritchie, M. E., et al. (2014). Animating the carbon cycle. Ecosystems 17, 344–359. doi: 10.1007/s10021-013-9715-7
Schneider, B., Nausch, G., Nagel, K., and Wasmund, N. (2003). The surface water CO2 budget for the Baltic Proper: a new way to determine nitrogen fixation. J. Mar. Syst. 42, 53–64. doi: 10.1016/S0924-7963(03)00064-2
Seidel, M., Manecki, M., Herlemann, D. P. R., Deutsch, B., Schulz-Bull, D., Jürgens, K., et al. (2017). Composition and transformation of dissolved organic matter in the Baltic Sea. Front. Earth Sci. 5:G01004. doi: 10.3389/feart.2017.00031
Snoeijs-Leijonmalm, P., and Andrén, E. (2017). “Why is the Baltic Sea so special to live in?” in Biological Oceanography of the Baltic Sea, eds P. Snoeijs-Leijonmalm, H. Schubert, and T. Radziejewska (Dordrecht: Springer), 23–84. doi: 10.1007/978-94-007-0668-2_2
Snoeijs-Leijonmalm, P., Schubert, H., and Radziejewska, T. (eds) (2017). Biological oceanography of the Baltic Sea. Dordrecht: Springer Science & Business Media.
Sokołowski, A., Wołowicz, M., Asmus, H., Asmus, R., Carlier, A., Gasiunaité, Z., et al. (2012). Is benthic food web structure related to diversity of marine macrobenthic communities? Estuar. Coast. Shelf Sci. 108, 76–86. doi: 10.1016/j.ecss.2011.11.011
Sveegaard, S. (2011). Spatial and Temporal Distribution of Harbour Porpoises in Relation to their Prey. Ph.D. dissertation, Aarhus University, National Environmental Research Institute, Aarhus.
Szymczycha, B., Winogradow, A., Kuliński, K., Koziorowska, K., and Pempkowiak, J. (2017). Diurnal and seasonal DOC and POC variability in the land-locked sea. Oceanologia 59, 379–388. doi: 10.1016/j.oceano.2017.03.008
Tamelander, T., Spilling, K., and Winder, M. (2017). Organic matter export to the seafloor in the Baltic Sea: drivers of change and future projections. Ambio 46, 842–851. doi: 10.1007/s13280-017-0930-x
Tomczak, M. T., Müller-Karulis, B., Järv, L., Kotta, J., Martin, G., Minde, A., et al. (2009). Analysis of trophic networks and carbon flows in south-eastern Baltic coastal ecosystems. Prog. Oceanogr. 81, 111–131. doi: 10.1016/j.pocean.2009.04.017
Tomczak, M. T., Niiranen, S., Hjerne, O., and Blenckner, T. (2012). Ecosystem flow dynamics in the Baltic Proper—Using a multi-trophic dataset as a basis for food–web modelling. Ecol. Model. 230, 123–147. doi: 10.1016/j.ecolmodel.2011.12.014
Trebilco, R., Baum, J. K., Salomon, A. K., and Dulvy, N. K. (2013). Ecosystem ecology: size-based constraints on the pyramids of life. Trends Ecol. Evol. 28, 423–431. doi: 10.1016/j.tree.2013.03.008
Trebilco, R., Dulvy, N. K., Anderson, S. C., and Salomon, A. K. (2016). The paradox of inverted biomass pyramids in kelp forest fish communities. Proc. Biol. Sci. 283:20160816. doi: 10.1098/rspb.2016.0816
Vanharanta, M., Elovaara, S., Franklin, D. J., Spilling, K., and Tamelander, T. (2020). Viability of pico- and nanophytoplankton in the Baltic Sea during spring. Aquat. Ecol. 54, 119–135. doi: 10.1007/s10452-019-09730-3
Vaquer-Sunyer, R., and Duarte, C. M. (2008). Thresholds of hypoxia for marine biodiversity. PNAS 105, 15452–15457. doi: 10.1073/pnas.0803833105
Virtanen, A. (1985). Bacterial numbers, biomass, activity and production at a site in the Tvärminne area of the Gulf of Finland. Aqua Fenn. 15, 143–160.
Wasmund, N., Dutz, J., Pollehne, F., Siegel, H., and Zettler, M. L. (2016). Biological Assessment of the Baltic Sea 2015. Warnemünde: Leibniz-Institut für Ostseeforschung Warnemünde.
Wasmund, N., Nausch, G., Postel, L., Witek, Z., Zalewski, M., Gromisz, S., et al. (2000). Trophic Status of Coastal and Open Areas of the South-Eastern Baltic Sea Based on Nutrient and Phytoplankton Data From 1993-1997. Warnemünde: Leibniz-Institut für Ostseeforschung Warnemünde.
Wikner, J., and Andersson, A. (2012). Increased freshwater discharge shifts the trophic balance in the coastal zone of the northern Baltic Sea. Glob. Change Biol. 18, 2509–2519. doi: 10.1111/j.1365-2486.2012.02718.x
Winogradow, A., Mackiewicz, A., and Pempkowiak, J. (2019). Seasonal changes in particulate organic matter (POM) concentrations and properties measured from deep areas of the Baltic Sea. Oceanologia 61, 505–521. doi: 10.1016/j.oceano.2019.05.004
Woodson, C. B., Schramski, J. R., and Joye, S. B. (2018). A unifying theory for top-heavy ecosystem structure in the ocean. Nat. Commun. 9, 1–8. doi: 10.1038/s41467-017-02450-y
Wulff, F., and Ulanowicz, R. E. (1989). “A Comparative Anatomy of the Baltic Sea and Chesapeake Bay Ecosystems,” in Network Analysis in Marine Ecology: Methods and Applications, eds F. Wulff, J. G. Field, and K. H. Mann (Berlin: Springer Science & Business Media), 232–256. doi: 10.1007/978-3-642-75017-5_11
Keywords: standing stocks, blue carbon, sediment carbon, macrophytes stock, inverted biomass pyramid, biomass estimates
Citation: Scheffold MIE and Hense I (2020) Quantifying Contemporary Organic Carbon Stocks of the Baltic Sea Ecosystem. Front. Mar. Sci. 7:571956. doi: 10.3389/fmars.2020.571956
Received: 12 June 2020; Accepted: 11 November 2020;
Published: 17 December 2020.
Edited by:
Christian Lønborg, Aarhus University, DenmarkReviewed by:
Oleg P. Savchuk, Stockholm University, SwedenJanusz Pempkowiak, Institute of Oceanology, Polish Academy of Sciences, Poland
Eero Asmala, University of Helsinki, Finland
Copyright © 2020 Scheffold and Hense. This is an open-access article distributed under the terms of the Creative Commons Attribution License (CC BY). The use, distribution or reproduction in other forums is permitted, provided the original author(s) and the copyright owner(s) are credited and that the original publication in this journal is cited, in accordance with accepted academic practice. No use, distribution or reproduction is permitted which does not comply with these terms.
*Correspondence: Maike Iris Esther Scheffold, bWFpa2Uuc2NoZWZmb2xkQHVuaS1oYW1idXJnLmRl