 Qurratu A’Yunin Rohmana
 Andrew M. Fischer
 John Cumming2,3
 Boyd D. Blackwell
- 1Institute of Marine and Antarctic Studies, University of Tasmania, Hobart, TAS, Australia
- 2Clean Ocean Foundation, Wonthaggi, VIC, Australia
- 3Infotech Research, South Yarra, VIC, Australia
- 4AquaEquis Consulting, Armidale, NSW, Australia
With increasing human populations in coastal regions, there is growing concern over the quality of wastewater treatment plant (WTP) discharge and its impacts on coastal biodiversity, recreational amenities, and human health. In Australia, the current system of WTP monitoring and reporting varies across states and jurisdictions leading to a lack of data transparency and accountability, leading to a reduced ability to comprehensively assess regional and national scale biodiversity impacts and health risks. The National Outfall Database (NOD) was developed to provide a centralized spatial data management system for sharing and communicating comprehensive, national-scale WTP pollutant data. This research describes the structure of the NOD and through self-organizing maps and principal component analysis, provides a comprehensive, national-scale analysis of WTP effluent. Such a broad understanding of the constituents and level of pollutants in coastal WTP effluent within a public database provides for improved transparency and accountability and an opportunity to evaluate health risks and develop national water quality standards.
Introduction
With increasing human populations in coastal regions and an increase in extreme weather events due to climate change (Meehl et al., 2000), there is growing concern over the quality of wastewater treatment plant (WTP) discharge and the impacts of effluent on coastal biodiversity and human health (Schwarzenbach et al., 2010; Jagai et al., 2015). Land-based pollutants, from sewage and storm water runoff, enter the coastal marine environment through discharge points, typically from WTPs (Carey and Migliaccio, 2009; Mallin et al., 2009). This effluent significantly increases organic and inorganic nutrients and turbidity levels in receiving waters, which can cascade across several levels of ecological organization to change the key properties of benthos and fish communities (Roberts, 1996; Burd et al., 2012; Campbell et al., 2015; Yu et al., 2016; White et al., 2018). An increase in the level of pollutants can have an impact on coastal ecology and biodiversity and affect the health of recreational water users (Reopanichkul et al., 2009; Schwarzenbach et al., 2010; Zhao et al., 2015; Boehm et al., 2017). Often the economic sector, such as aquaculture industries, are also affected due to high levels of bacterial contamination, which decrease production during the harvest season (Campos et al., 2015).
There are many ways to resolve these issues, one of them is cooperation between governments, policy makers, scientists, and civil society through data transparency and information disclosure. The concept of data transparency has played an important role across most, if not all, disciplines (Friesike et al., 2015) and it has been shown that increased transparency leads to improved accountability of industrial (López and Fontaine, 2019), corporate (Auld and Gulbrandsen, 2014) and government agencies (Harrison and Sayogo, 2014). “Openness” and information disclosure has often been associated with not only economic prosperity, but also improvements to social capital and the environment (Koltay, 2016; Lee et al., 2019). While “transparency” has multiple definitions, as well as multiple purposes, targets, and justifications, the most common one is to resolve issues that a lack of information pose (Fung, 2013). The most suitable form of transparency is constitutional transparency through freedom of information (FOI). The FOI gives citizens the right to request and access government information not exempt under the FOI Act (European Parliament, 2001; OAIC, 2013; OIP, 2019). Other initiatives to increase transparency and accountability and ensure public access to information are through e-government programs (e.g., data.gov) (Pina et al., 2007; Lourenço, 2013). Access to information, under these programs is meant to facilitate organizational accountability toward environmental and public health obligations. More importantly, accurate data and transparent methods are needed for governments to make good policy decisions and for the general public to, for example, assess health risks and make informed decisions about sustainable use of the environment (Gupta, 2010; Friess and Webb, 2011). There is further evidence that improved governance through integrated forms of civil society−led meta-governance is related to information disclosure (Schleifer et al., 2019). Therefore, transparency may lead to well-informed environmental policy, which may play a critical role in anticipating the wider impacts water quality (Fezzi et al., 2015).
Many countries have established a legal framework to protect the health of aquatic and marine environments. Australia, for example, obligated to manage resources of national interest (matters of national environmental significance) and as a signatory to the Convention on Biological Diversity, is required to safeguard its biological diversity, as well as manage the impacts of nutrients on ecosystem function and structure [Aichi Biodiversity Targets (8)] (NRMMC, 2010). The state/territory governments have each established Environment Protection Authorities (EPAs). Each EPA acts as an independent environmental protection regulator to prevent and control pollutant impacts to human health and the environments. With regards to wastewater effluent, each state or territory EPA has a role in regulating WTP discharge. Any activity that may produce a discharge of waste that by reason of volume, location or composition adversely affects the quality of any segment of the environment will require a license from the Authority (DECC NSW, 2009). Throughout each state and territory, emission sources are required to monitor their discharges and to be in compliance with the conditions set out in their licenses. Each WTP is required to conduct monitoring within the vicinity of their outfalls, analyze the samples and report the results to the EPA (DECC NSW, 2009; EPA VIC., 2009).
Monitoring of WTP effluent is managed through license conditions determined together by the EPA and the water treatment authorities (WTA), the body that manages a WTP. License conditions ultimately depend on EPA requirements, WTP treatment level, and the condition of the marine environment (EPA NSW, 2003; EPA VIC, 2017). While WTP operators are largely interested in minimizing expense and staying within their license conditions, the EPA has an interest in regulating “developments and activities that may impact on environmental quality and to promote best practice, sustainable environmental management” (EPA NSW, 2013; EPA VIC, 2017). This system of WTP effluent monitoring and reporting varies across states, jurisdictions and regions. Inconsistency in monitoring requirements, confounded by non-binding international standards for assessing pollutant risk, and a lack of national-level standards for data collection, transmission and sharing, results in a lack of transparency and a reduced ability to comprehensively assess regional and national scale biodiversity impacts and health risks (ANZECC and ARMCANZ, 2000; Reichman et al., 2011; Borgman, 2012; Gemmill et al., 2019; Rohmana et al., 2019). This can hamper the ability to adequately assess progress toward biodiversity conservation targets (Bull et al., 2018).
Through the lens of transparency and accountability, a non-government organization, the Clean Ocean Foundation (COF), with the support of National Environmental Science Program (NESP), developed the National Outfall Database (NOD, 2020)1. This initiative provides a centralized spatial data management system for sharing and communicating comprehensive, national-scale pollutant data from outfalls. It provides the potential to empower coastal communities to monitor and evaluate health risks of the outfall effluent, and for federal and state government to prioritize outfall infrastructure reform. It promotes and supports transparency as well as openness of pollutant management from WTPs and accountability of these organizations against environmental and human health obligations. The NOD also provides a baseline of information to develop national-scale monitoring and wastewater re-use.
Data-centric, e-government portals, designed with the intention developing transparency and accountability in waste water management have been developed elsewhere. The European Union (EU) built the Water Information System for Europe (WISE) which consists detailed information of the EU water policies, reported dataset for both inland and marine water, modeling, and relevant research (European Environment Agency, 2017). The notion of having a water portal is also applied in the United States. The Water Quality Exchange (WQX) under Clean Water Act was created under the sponsorship of The United States Geological Survey (USGS), Environmental Protection Agency (EPA) and National Water Quality Monitoring Council (NWQMC) to integrate publicly available any water related data, including current and historical water data as well as water quality monitoring data (NWQMC, 2016).
While these are mostly government initiatives, this work describes the development of a data portal under the direction of a non-governmental organization and outlines how the data can be used to increase transparency, accountability and guide policy development and the attainment of international goals and targets. Therefore, the purpose of this research is (1) to describe the structure of the NOD, (2) provide the first national-scale analysis of WTP effluent into the marine environment, and (3) examine the spatial patterns of water quality variables across Australia and interrelations among them. The description of the NOD and an analysis of its data is further discussed in the context of data transparency and government accountability with regards to outfall monitoring and reporting standards. The importance of this research is that it provides a comprehensive and transparent data platform to guide government accountability at a national scale through overcoming inconsistencies in data reporting methods.
Materials and Methods
Data Collection – The National Outfall Database
The NOD, currently, provides a national inventory of Australia’s 181 coastal outfalls including the volume of water and the amount of pollutants and nutrients disposed of into coastal receiving waters (Figure 1). Water quality data, recorded in the NOD, were collected from 42 WTAs around Australia. Sampling conducted by the WTAs were taken from the sampling points within the WTP premises as described in the licenses (EPA VIC., 2009; EPA NT, 2013; EPA SA, 2016). Data describing water quality parameters (Table 1) and outfall characteristics were transcribed into a database. Outfall characteristics consist of outfall name, manager, license number, WTP capacity, population serviced, treatment level, and location description.
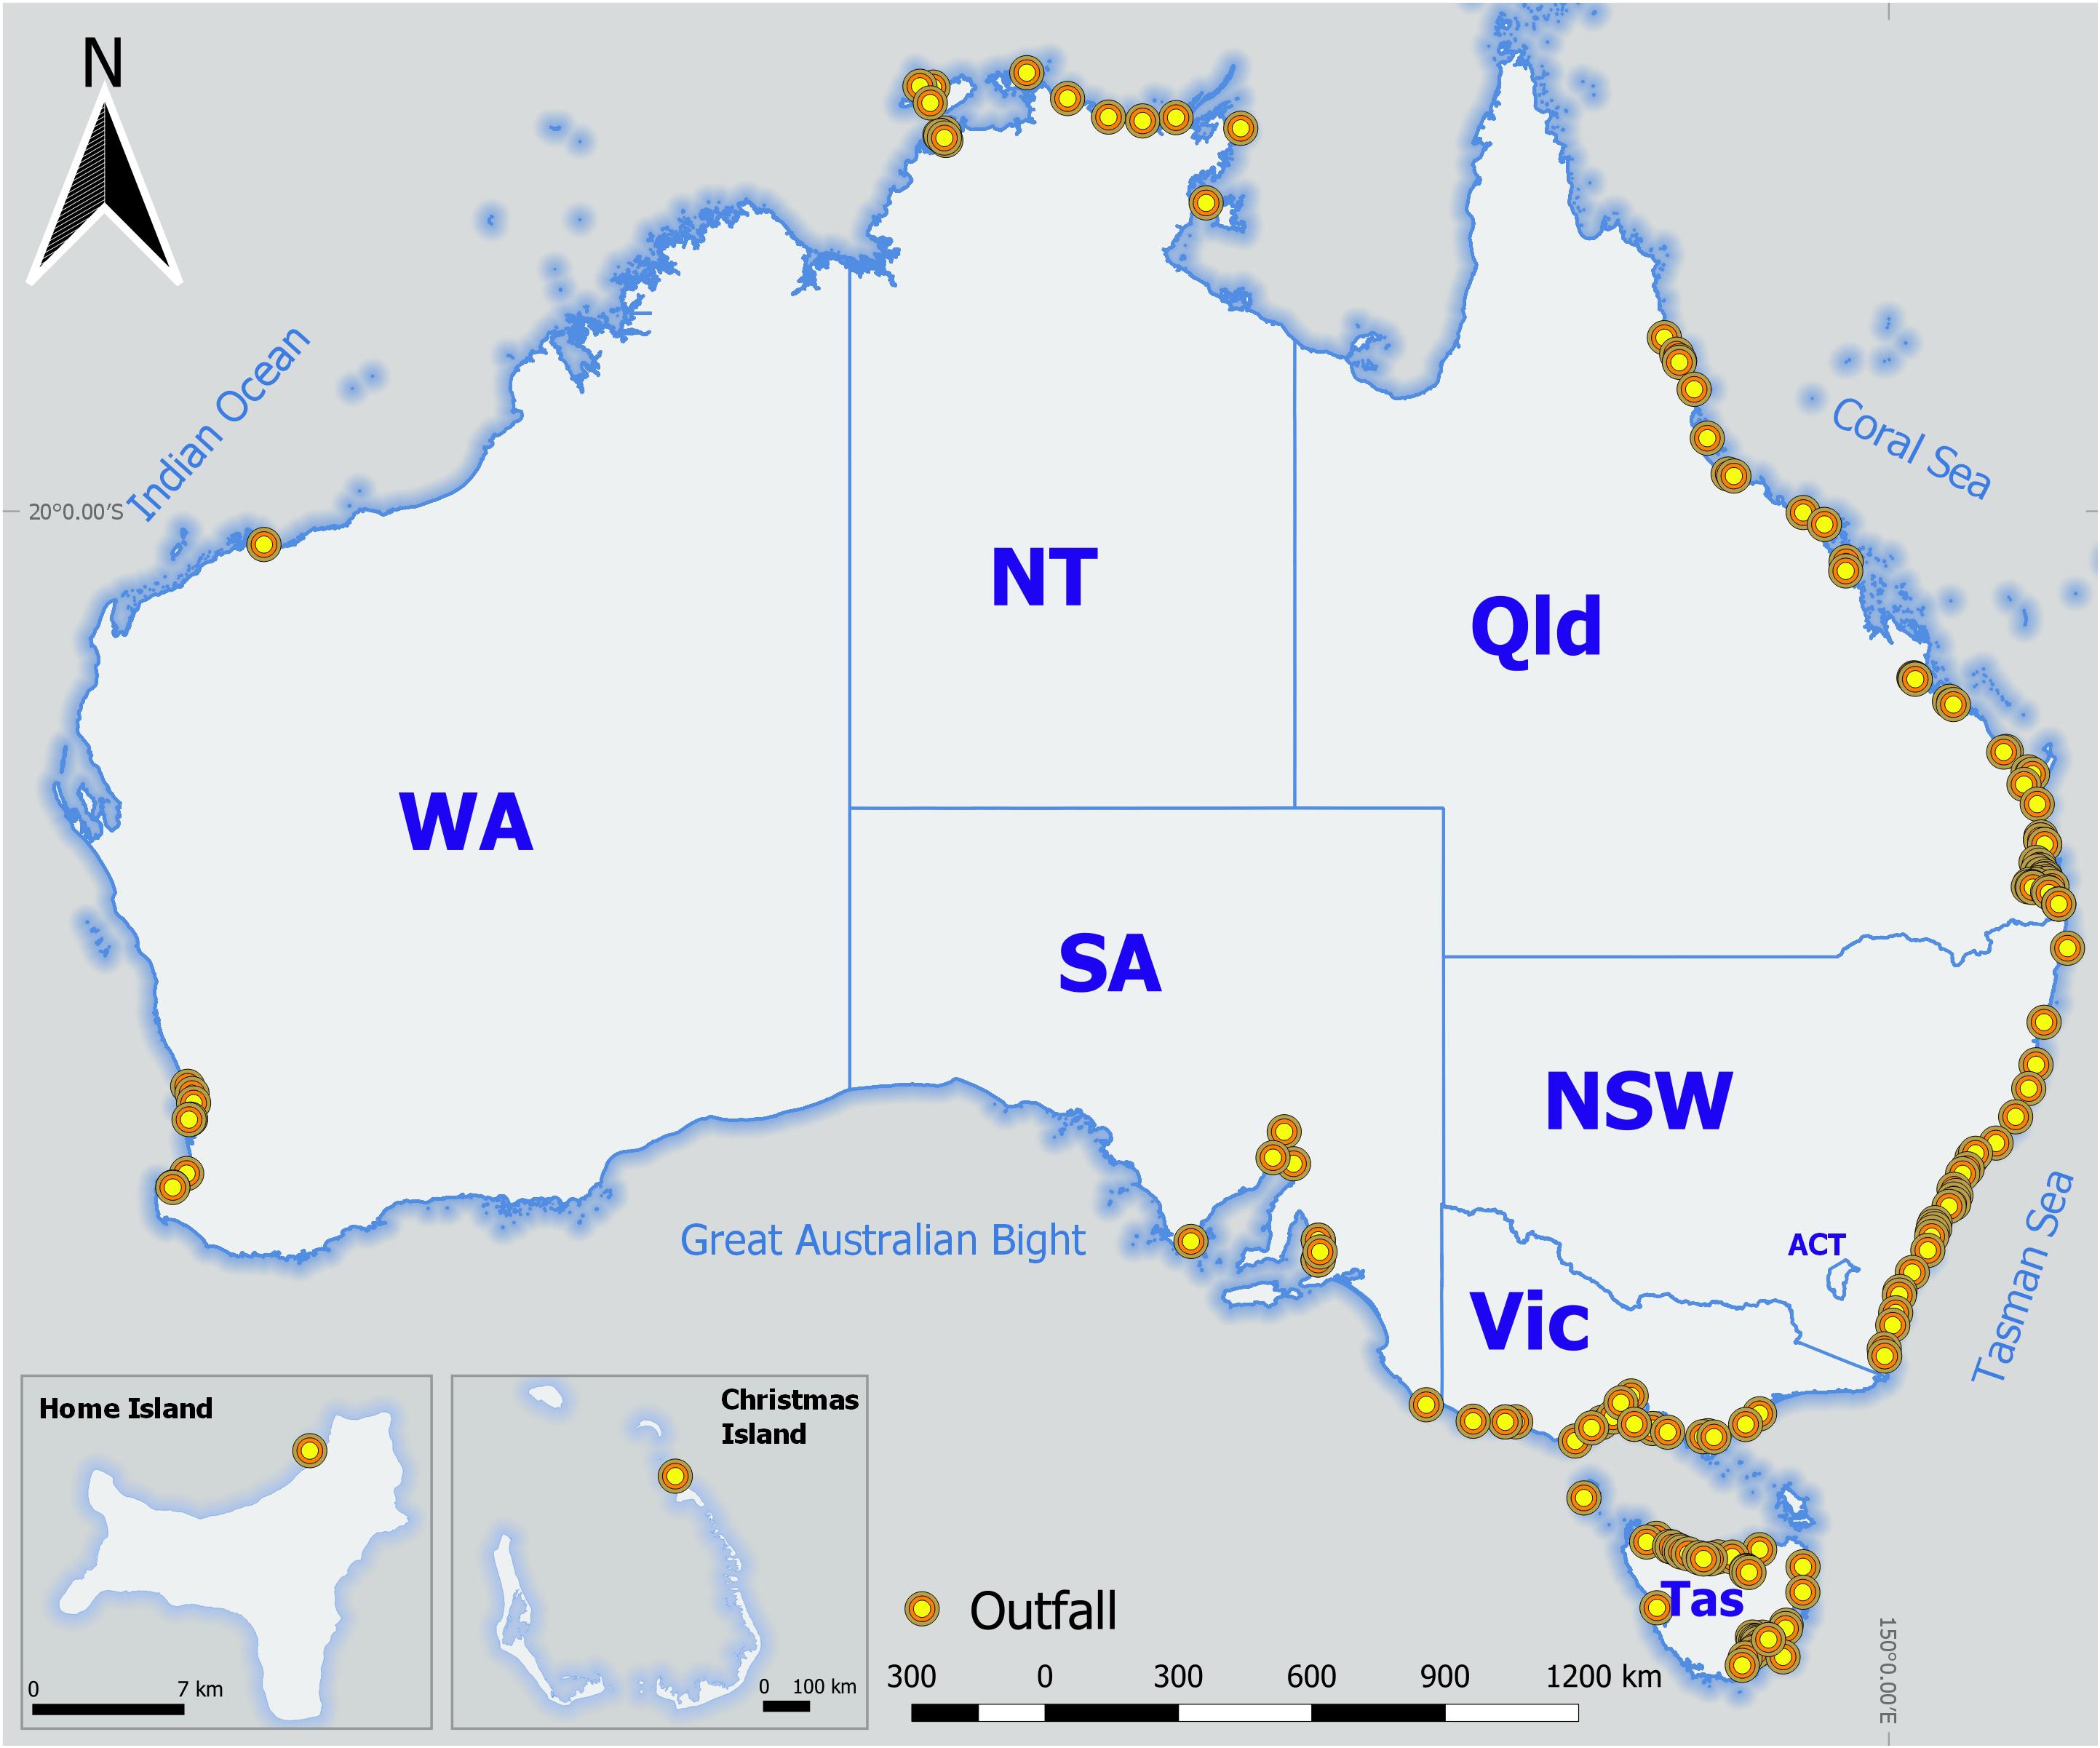
Figure 1. Australian coastal outfalls recorded in the NOD.
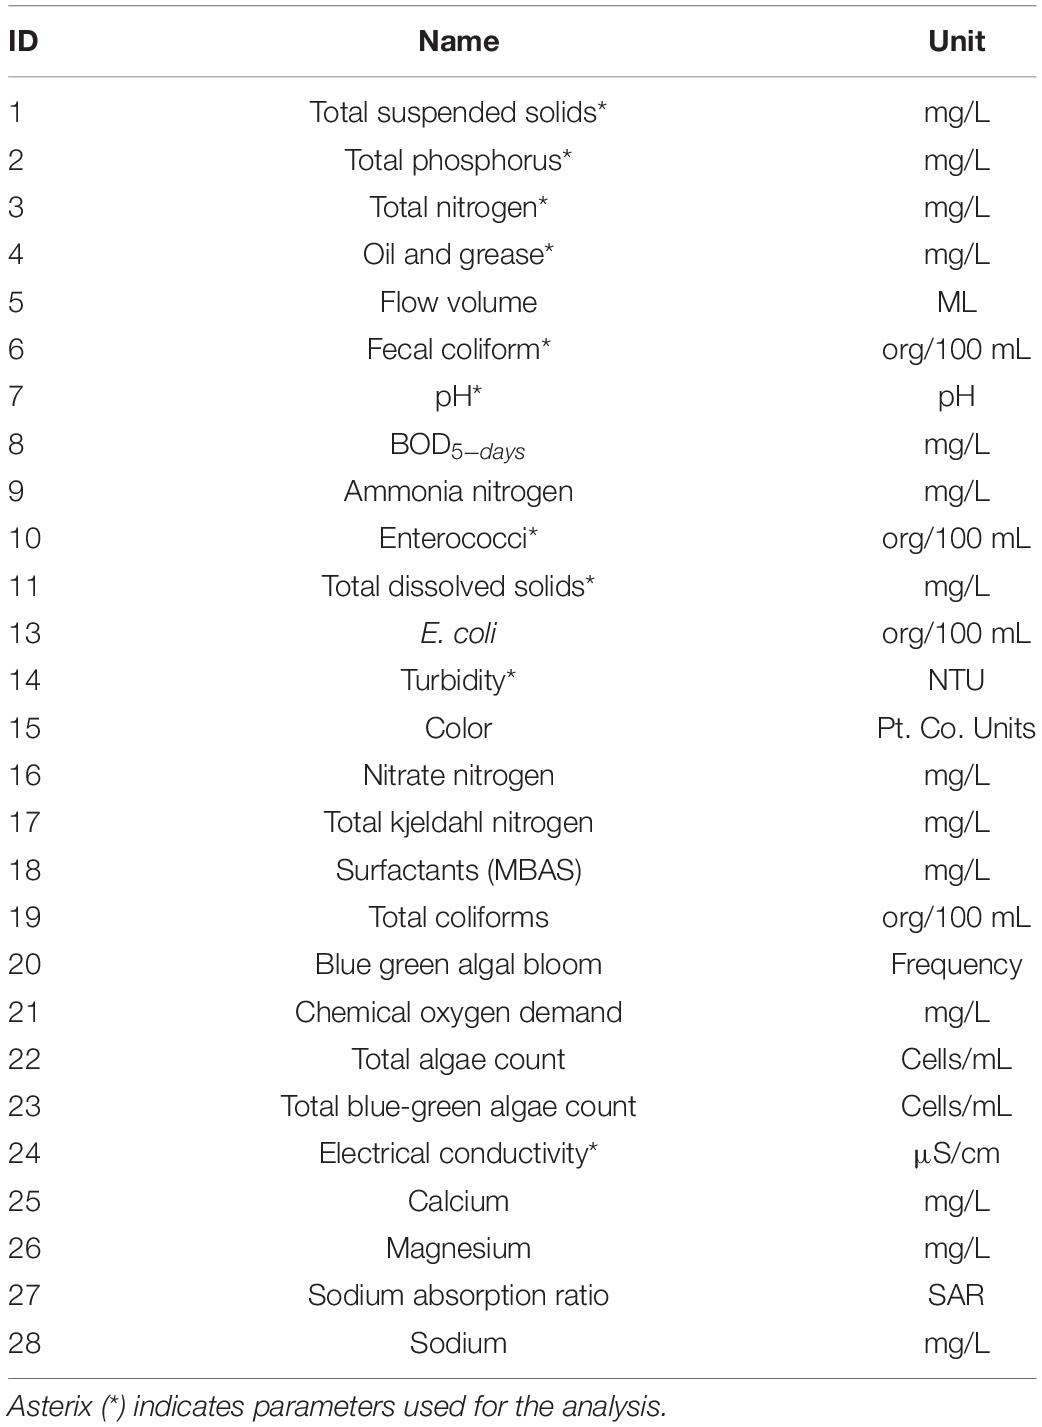
Table 1. Water quality parameters recorded in the database with their assigned database ID and units of measurement.
In order to display the data spatially, the database was equipped with a location map, pivot table and trend chart for each parameter. The descriptive statistics function was applied to each outfall to calculate the mean and standard deviation of water quality parameters and the summary of discharge volume. To ensure proper storage and use of the data, the data collected from the public agencies are treated in accordance with the objectives of the Freedom of Information Act 1999 (Cth) and equivalent legislation in each jurisdiction, which require government agencies to make information publicly available, subject to certain exceptions listed in that legislation.
Sites that monitored a consistent set of water quality parameters (n = 162) were included in the analysis. These parameters include enterococci (ENTCC), fecal coliform (FC), electrical conductivity (EC), turbidity (NTU), oil and grease (OG), alkalinity or acidity (pH), total dissolved solids (TDS), total nitrogen (TN), total phosphorus (TP), and total suspended solids (TSS) (Table 1). The remaining parameters were not analyzed due to either a lack of samples or inconsistent sampling of parameters across sites.
Data Analysis
Due to the enormity and diversity of the dataset, unsupervised machine learning methods were utilized to explore and observe hidden patterns. Firstly, self-organizing maps (SOM) approach was used because its process allowed the categorization of pollutant characteristics to a set of outfall class structures, identifying similarities and differences in class factors that may influence effluent quality between outfall sites. Secondly, the principal component analysis (PCA) was applied in order to validate the patterns in the SOM plane visualization and to help identify patterns not detected in the SOM planes. Lastly, to determine outfall grouping and support our goal of increased transparency and the establishment of standards, a cluster analysis was conducted using a gap statistics and k-means. All data analyses were conducted using MATLAB 2019a software (MATLAB, 2019). The results were plotted to identify data clusters of, or similarities, between the discharge of WTPs across Australia.
Self-Organizing Maps
The SOM is an unsupervised classification method, in which networks learn to form their own classifications of the training data without external input. The SOM detects patterns or classes in a set of data, preserving the proximity to a set of classes or neighboring relations (Kohonen, 2001). In other words, similar clusters in the multidimensional space are located together on a 2D grid allowing intuitive visualization of classes (Bação and Lobo, 2010). The process includes a self-organizing neighborhood mechanism, the neighboring clusters of the winning reference vector in the 2D lattice space are also adapted toward the sample vector through an iterative training process. Through this approach, an input vector is presented to the multi-class network and the output is compared with the target vector, projecting the topological neighborhood relationships of the high dimensional data space of the class “lattice” (Kelvin, 2006). In order to visualize the neural network map (lattice), a suitable map size was first identified. The size determination is crucial for cluster clarification. If a map is too small, patterns between the nodes are less likely to resolve important detectable differences (Céréghino and Park, 2009; Vatanen et al., 2015). The initialization and training of the input data were performed to calculate the distance of every neuron in the network. Training steps also define the SOM map quality by examining the quantization error (QE) and topograhic error (TE). QE is the average distance between each node and its best matching unit (BMU), while TE measures the wellness of the map structure by calculating the node’s first and second BMUs and their position in relation to each other (Villmann et al., 1997; Kohonen, 2001; Breard, 2017). Smaller QE and TE values indicate a better fit of the map itself (Kohonen, 2001; Breard, 2017). Once the SOM has been trained, the data was visualized into a U-matrix (unified distance matrix) along with eight component planes. The U-matrix shows the clustering structure of the SOM data by visualizing the distance between neighbors of the SOM, while the component planes represent the pattern and behavior of one parameter toward others (Kohonen, 2001; Bação and Lobo, 2010). The darker areas in the U-matrix represent shorter distances between nodes, which then forms clusters. Light areas represent longer distances, as well as borders for each cluster. In summary, similarity between clusters is measured as the minimum distance between data vectors and each node on the map (Vesanto et al., 2000). The analysis was conducted using SOM Toolbox version 2 for MATLAB by Vesanto et al. (2000).
Principal Component Analysis (PCA) and Cluster Analysis
Principal component analysis (PCA) is a technique to emphasize variation of patterns in a dataset and has been widely used across a variety of scientific areas (Abdi and Williams, 2010). It is a way of identifying patterns and expressing data to highlight similarities and differences. Since patterns can be hard to find in data of high dimensions, a PCA is a powerful tool for multivariate data analysis. PCA provides useful information to identify the relationship of similar characteristics by representing the spatial and temporal variations of wastewater parameters (Zuur et al., 2007; Abdi and Williams, 2010). Prior to deriving the principal components, Kaiser normalization and varimax rotation were used to weight the water quality samples equally and maximize the loading variances. Principal components, coefficients, scores and variance, were then calculated using the eigs function in MATLAB (Mathworks, UAS). The component coefficients represent pollutants loading while the scores represent WTP sites.
Cluster analysis was applied to the PCA score matrix using gap statistics and k-means methods. The gap statistics helps determine the optimal number of clusters (k) (Tibshirani et al., 2001), while the k-means procedure performs the grouping of water quality data according to the identified optimal k values (Hair et al., 2010). The k-means method is generally based on a proximity measure, meaning that it measures the distance and location of the mean samples and groups them accordingly (Hair et al., 2010; Jain, 2010; Härdle and Simar, 2015). Each k consists of samples that are close to each other. Due to its simplicity and quick response during the analysis for vast dataset (Hair et al., 2010), k-means was chosen as the method to analyze our data. The major challenge of k-means is determining the number of clusters (k) needed prior to conducting the analysis. In this case, a gap statistic method was used. The gap statistic evaluates the dataset and provides the highest possible number of clusters suitable for the analysis (Tibshirani et al., 2001; Brodinová et al., 2019). After the gap value was calculated, the accurate k value was, then, applied to the k-means method. The clustering results will be visualized along with the PCA plot.
Results
Monitoring Data
Of the 181 outfalls, 114 are categorized as ocean outfalls, meaning that effluent is directly discharged into the coastal marine environment. Sixty-seven of them are categorized as estuary or river outfalls. Because effluent is discharged from these WTPs into estuaries or rivers, the dilution and transport of pollutants to the coastal environment is also dependent on other variables such as rainfall, river flow, and tides. The state of Queensland had the highest number of combined (coastal and estuary/river) outfalls at 51, followed by Tasmania (41) and New South Wales (34), Victoria (19), The Northern Territory (14), Western Australia (12), and South Australia (10).
Summary statistics of the assessed parameters are presented in Table 2. EC varied between 390 and 6,700 μS/cm, with an average of 1,937 μS/cm. ENTCC and FC tended to have a wide range of values with a mean of 29,945 and 647,153 org/100mL and standard deviation (SD) of 351,951 and 8,095,710 org/100 mL, respectively. OG values ranged from 0 to 312.6 mg/L and reported pH values ranged from 3.22 to 7.8. TDS ranged from 200 to 33,000 mg/L with a mean of 2,737 mg/L. The mean values of TN, TP, and TSS were 15.9, 4.8, and 24.5 mg/L, respectively. The mean concentration value of NTU was 35.7 mg/L. The range and standard deviations values across ENTCC, FC and TDS are extremely high.
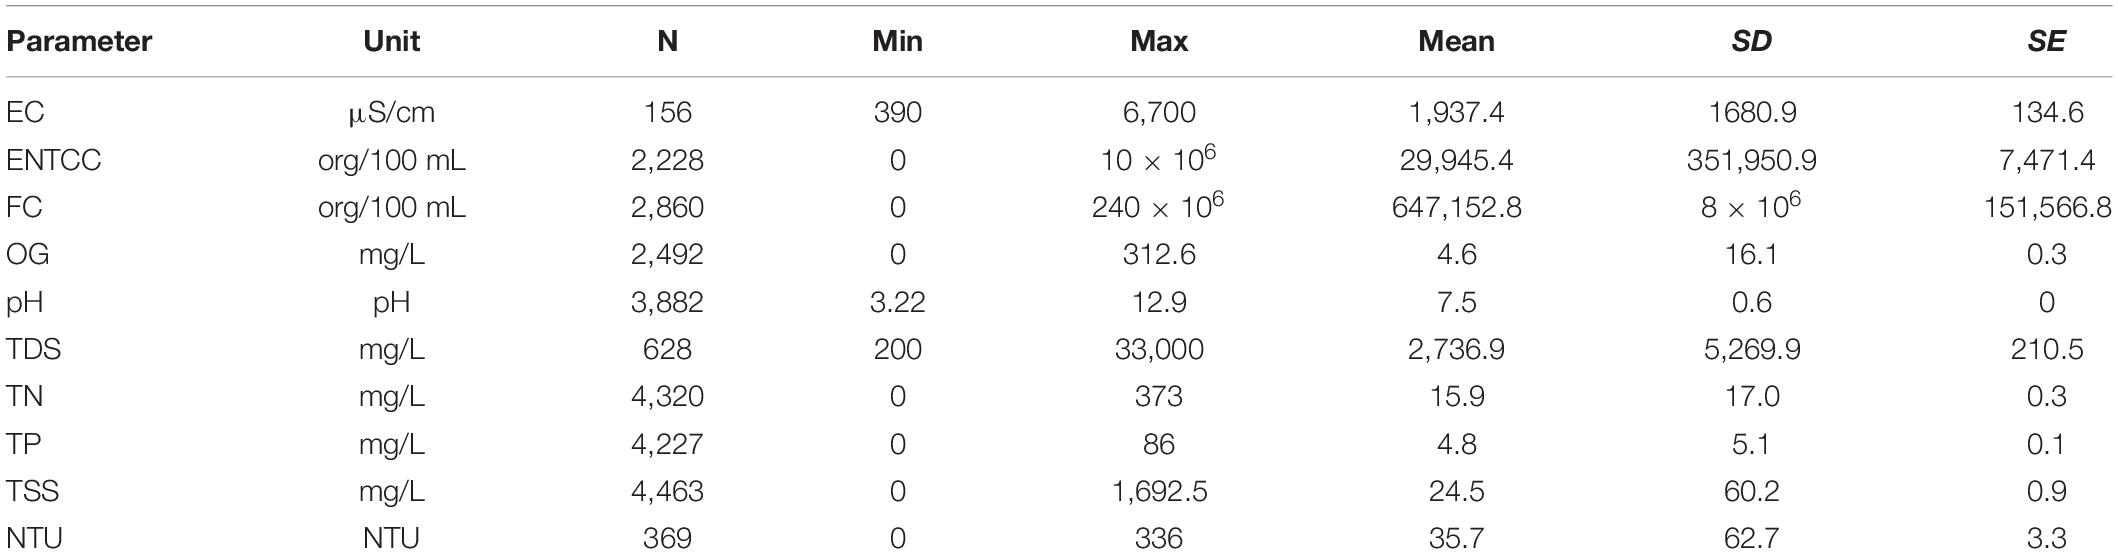
Table 2. Summary statistics of assessed parameters.
SOM, Covariance, PCA, and Clustering
The TE and QE map size for self-organizing maps is critical for the implementation and visualization of the analysis. The QE and TE were computed at different map sizes. A map size of 10 × 7 with 70 nodes was the most appropriate with the QE value of 0.624 and TE 0.049 (Table 3).
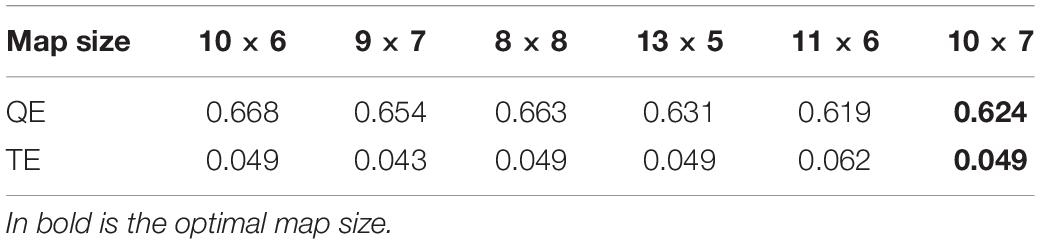
Table 3. QE and TE values for deciding the optimal map size.
The SOM component planes of each water quality parameter across the whole dataset is shown in Figure 2. It shows that all variables had a clear trend of color gradients for each parameter. The trends also reveal the correlation strength between parameters. The similar patterns of color gradients with the values increasing to the bottom left of the plane were shown on the ENTCC, FC, OG, TN, TP, TSS, and slightly on the EC. On the other hand, pH, TDS, and NTU had almost similar patterns of color gradients with lower values dominating the upper left areas and higher values on the bottom right of the map.
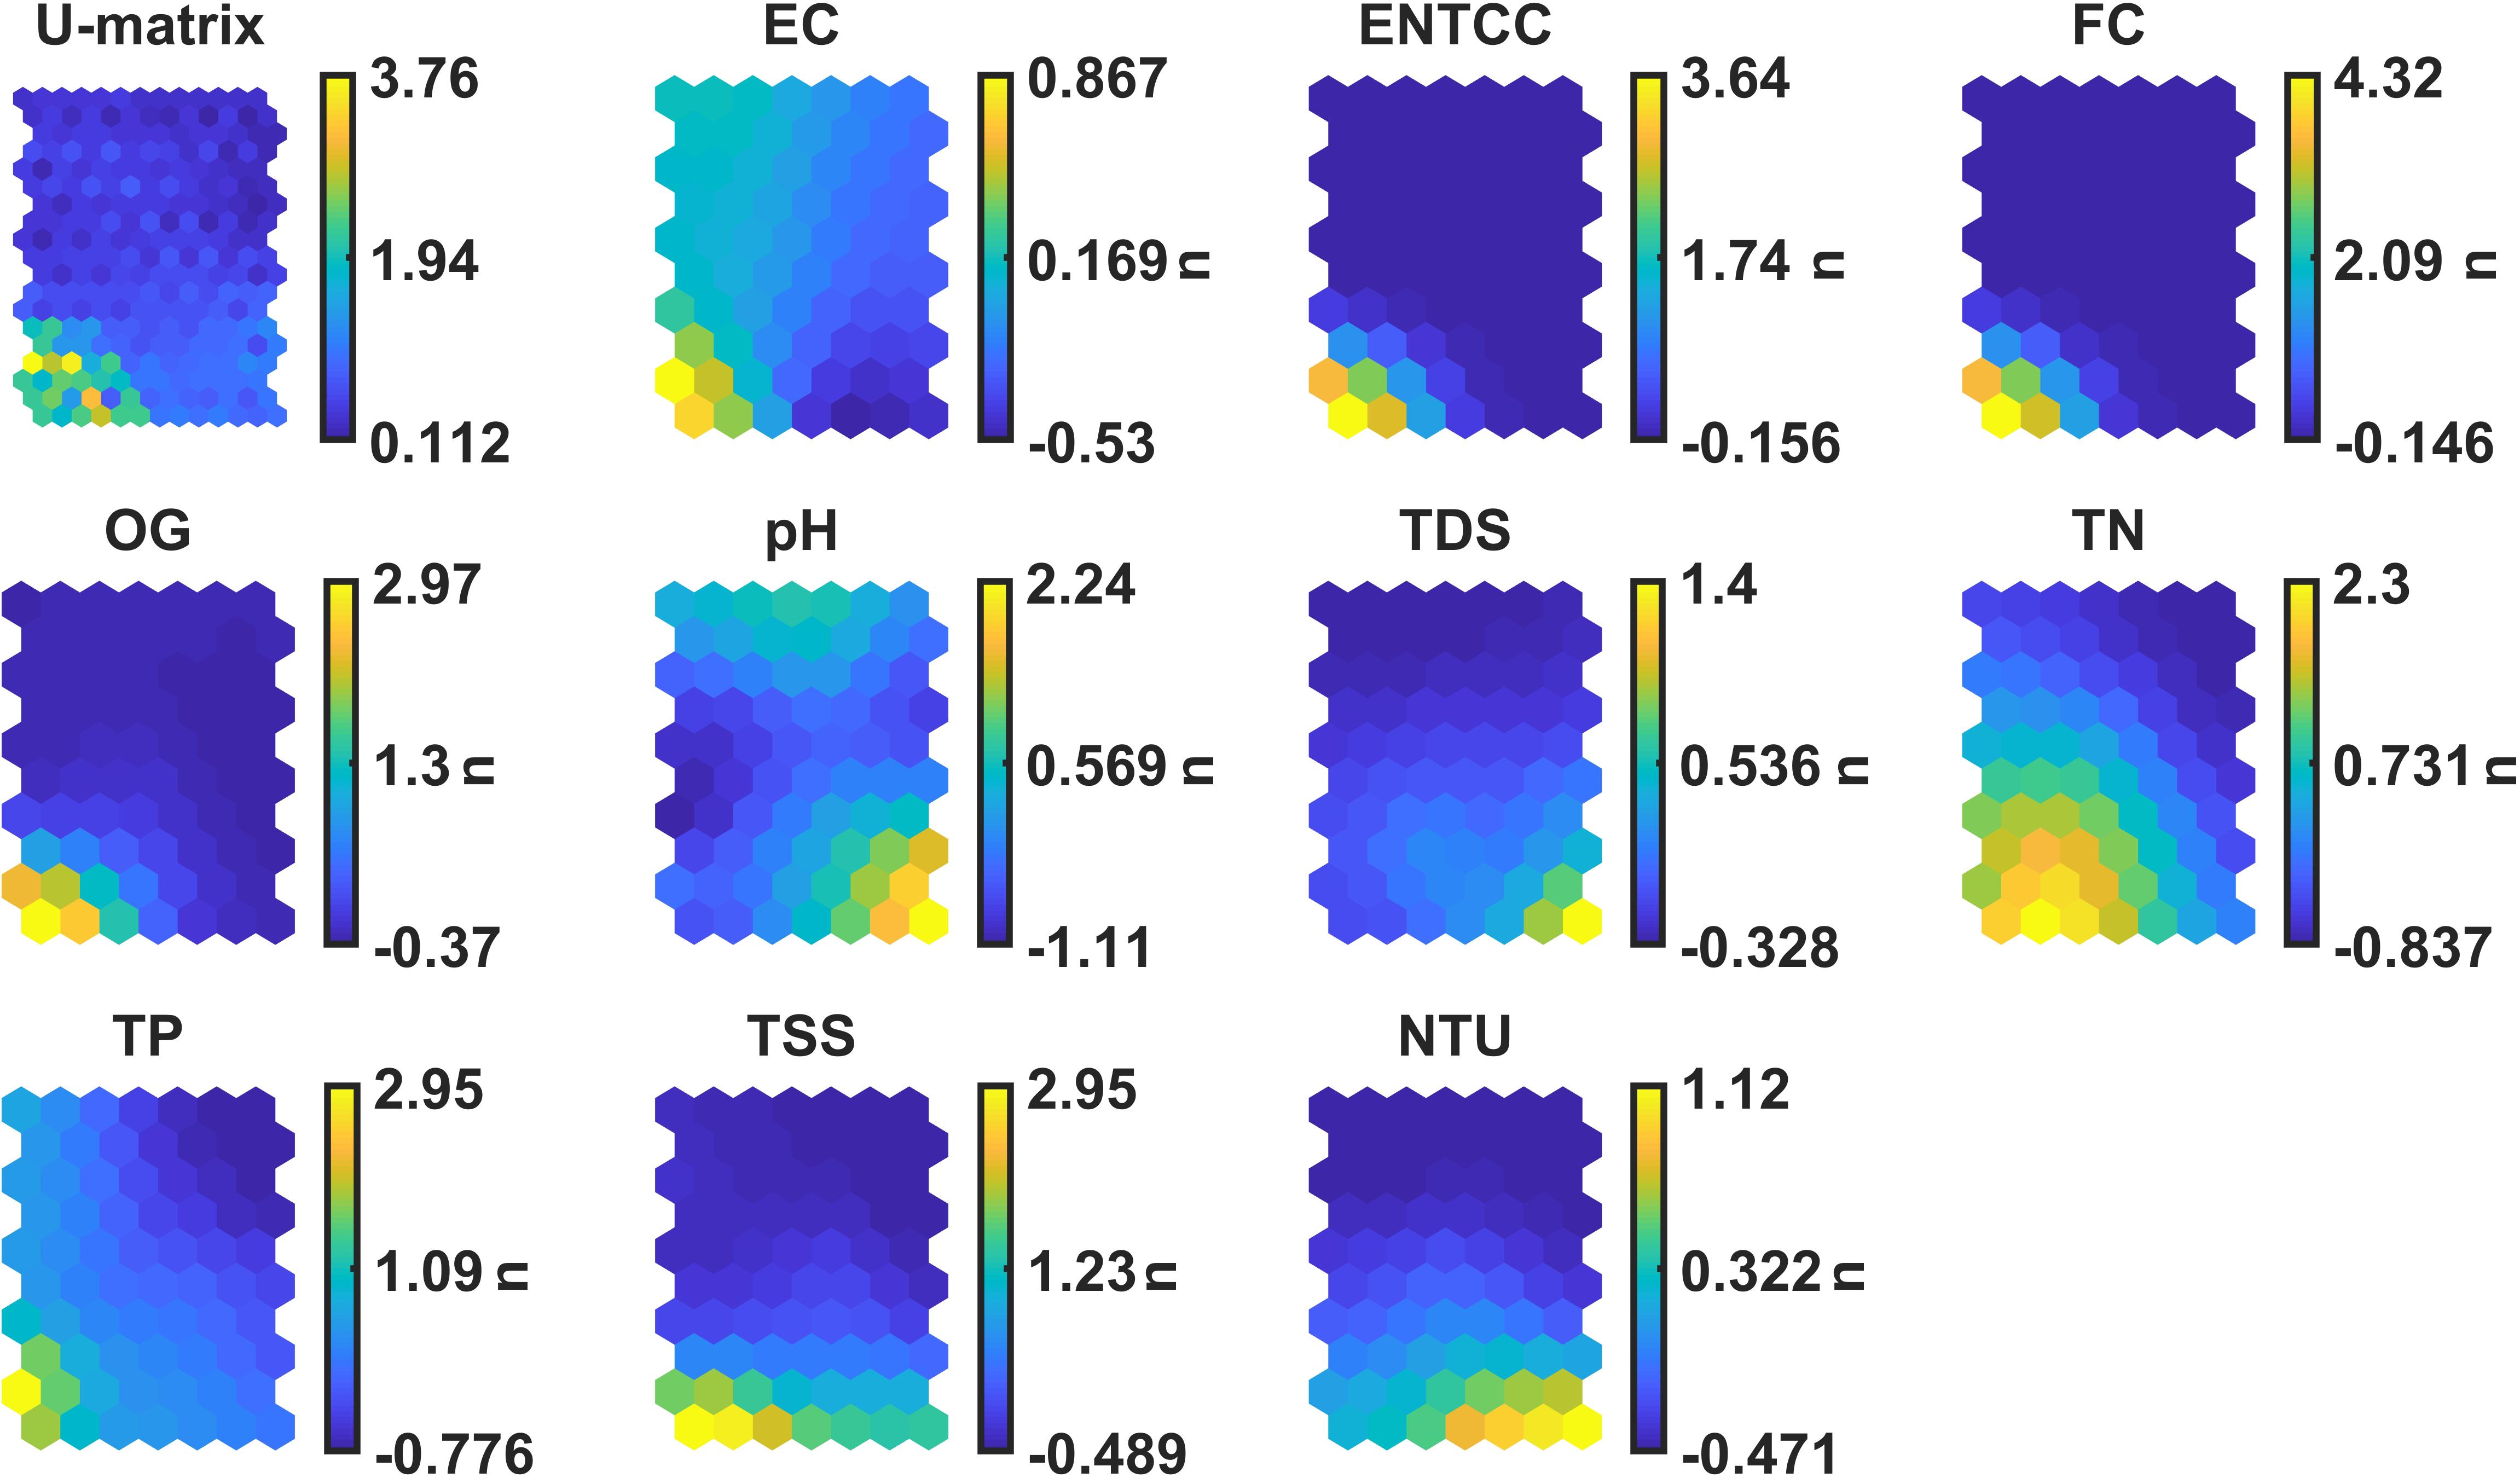
Figure 2. SOM component planes of all parameters, electrical conductivity (EC), enterococci (ENTCC), fecal coliform (FC), oil and grease (OG), pH, total dissolved solids (TDS), total nitrogen (TN), total phosphorus (TP), total suspended solids (TSS), and turbidity (NTU). Dark color indicates low values and light color means high values. n indicates that the data was normalized.
A covariance matrix was computed to corroborate these patterns (Table 4). Further, it suggests particularly strong correlations between EC and TP (r = 0.70), ENTCC and FC (r = 0.94), FC and OG (r = 0.62), OG and TSS (r = 0.74), and TN and TSS (r = 0.62). A moderate correlation also can be seen between ENTCC, OG (r = 0.47) and TSS (r = 0.53), FC and TSS (r = 0.57), and OG and TN (r = 0.53).
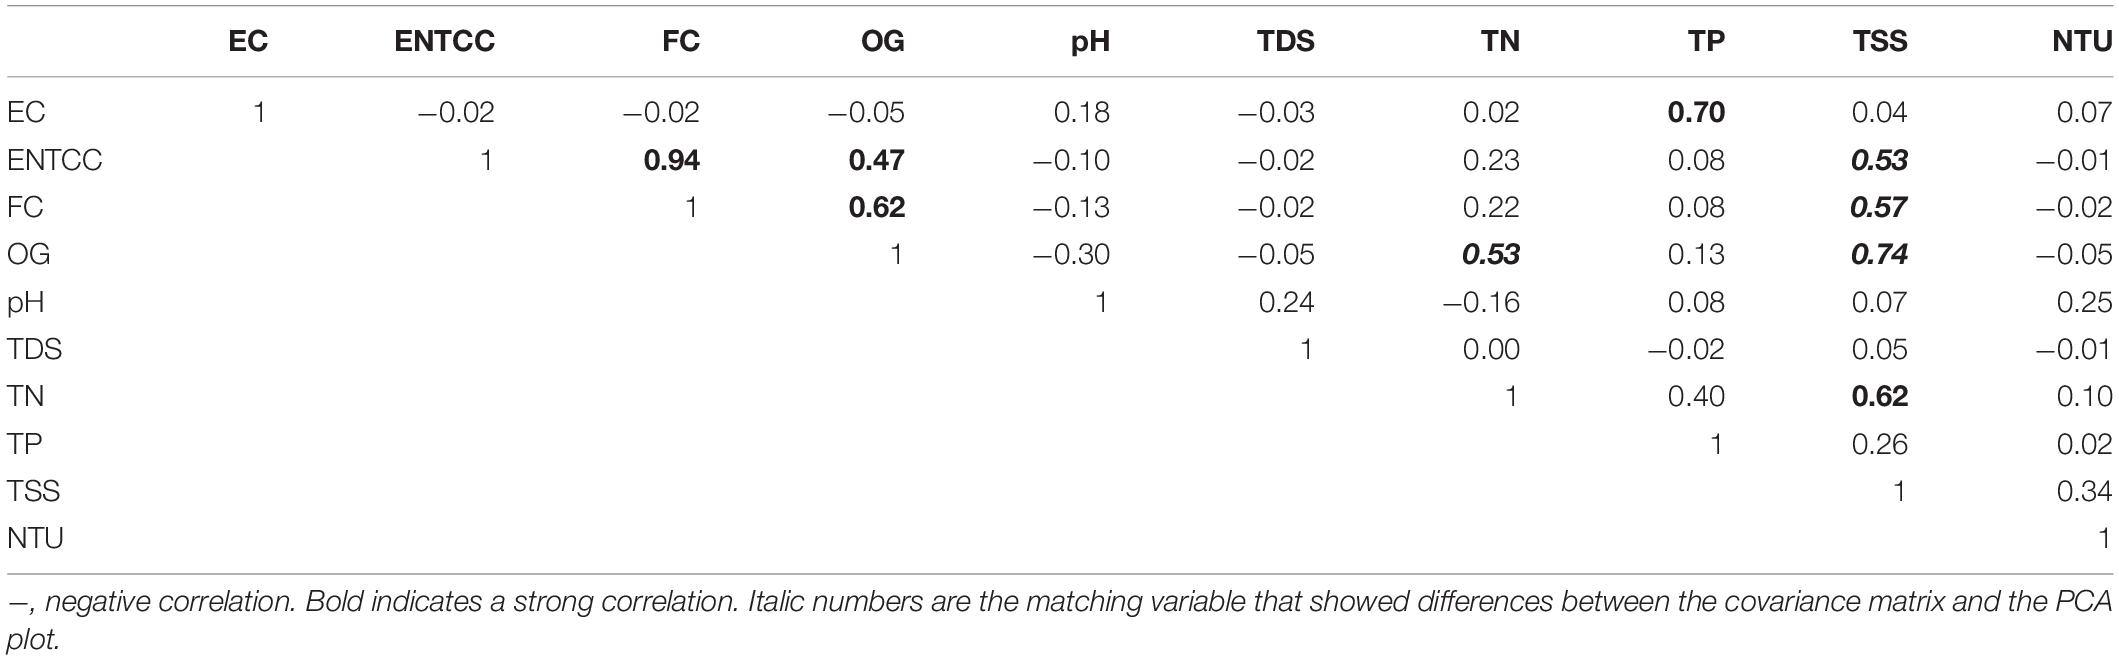
Table 4. Covariance matrix of water quality parameters (r).
Prior conducting the PCA and cluster analysis, gap statistics were applied to determine the optimal values for k-means clusters (Tibshirani et al., 2001). The result shows that a cluster of five is suitable for this research with the gap value of 0.49 (Figure 3). Results of the PCA and cluster analysis are shown in Figure 4. The first principal component, explaining 65% of the variance on the horizontal axis, has positive coefficients (right) for six parameters and slightly negative (left) for pH. TSS, OG, ENTCC, and FC have a strong influence toward PC 1. The second principal component, explaining 21% of the variance on the vertical axis, has positive coefficients (top) for six parameters, especially EC, and negative coefficients for OG, ENTCC and FC (bottom). The clusters appear to separate outfalls with extreme levels of pollutant concentrations. On the lower right, cluster two and portions of cluster five have high correlation with increased inputs of OG, ENTCC, and FC. The top right quadrant contains the majority of cluster three, four and few from cluster five. These represent high contributions of EC, TP, TN, and TSS. On the top left, pH is the only parameter which seems to be related to some outfall sites in cluster one and three.
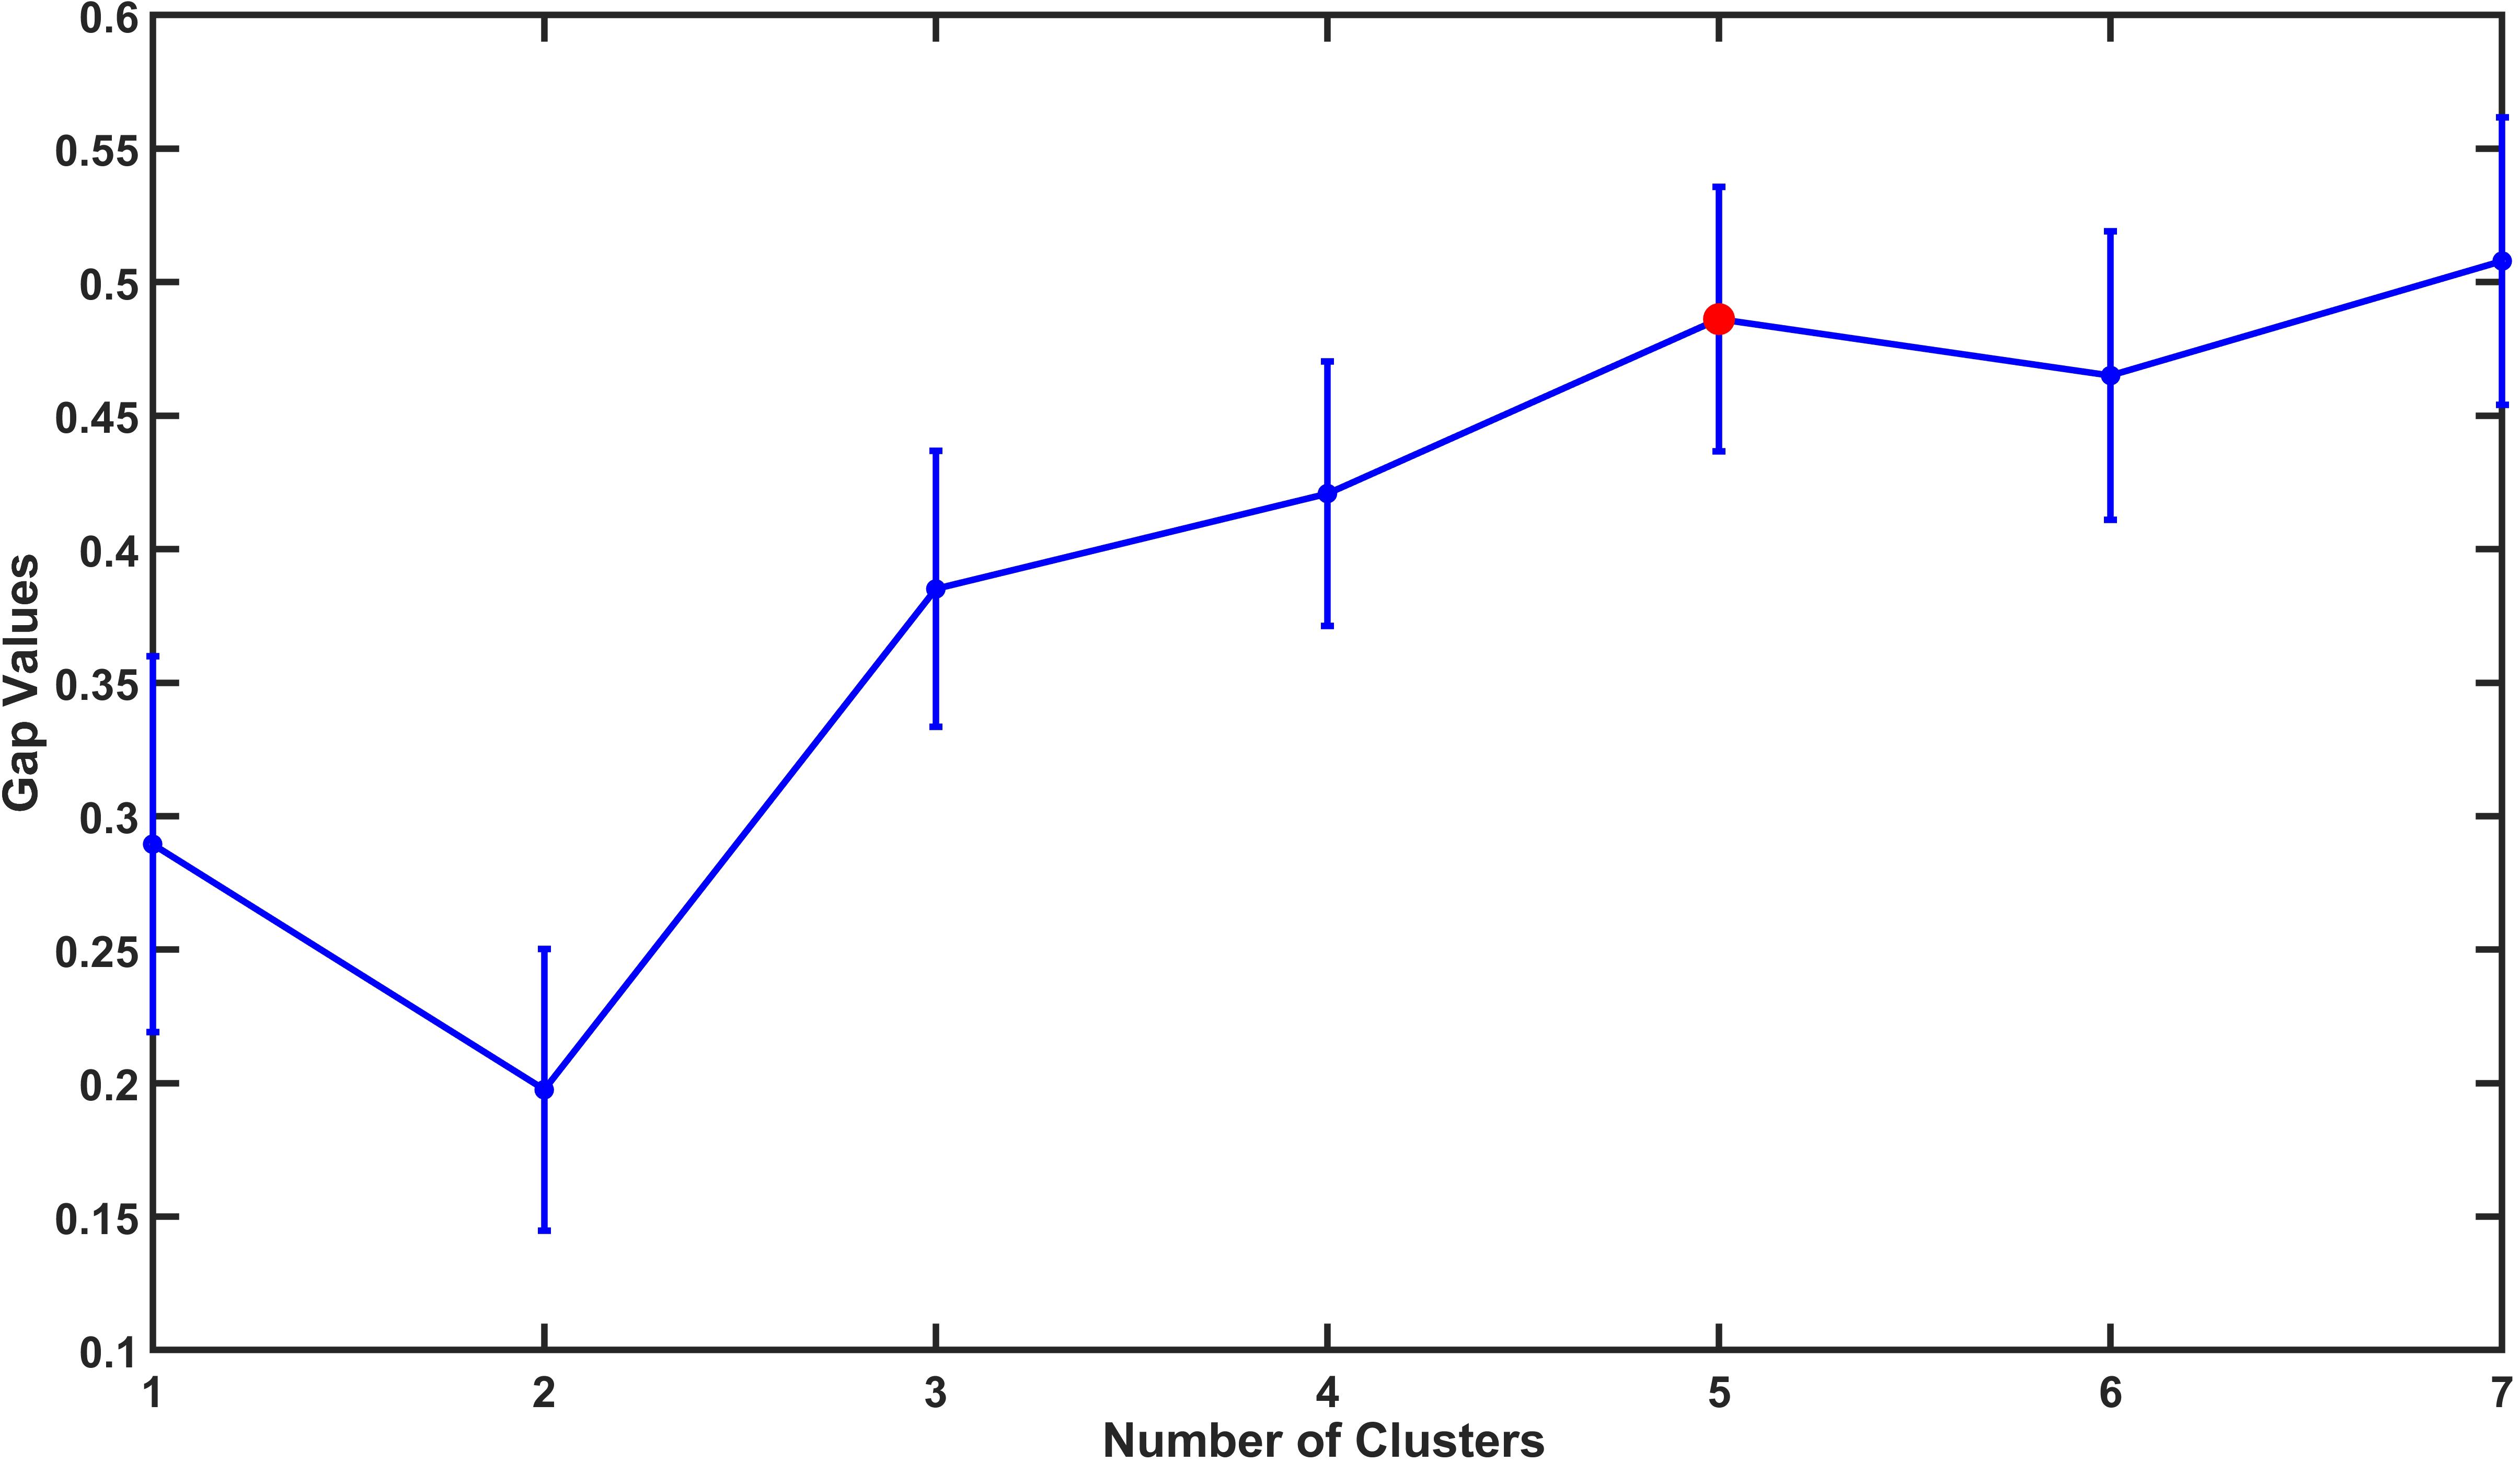
Figure 3. Gap statistics for determining optimal value of clusters. Red dot represents the optimal clusters for k-means analysis.
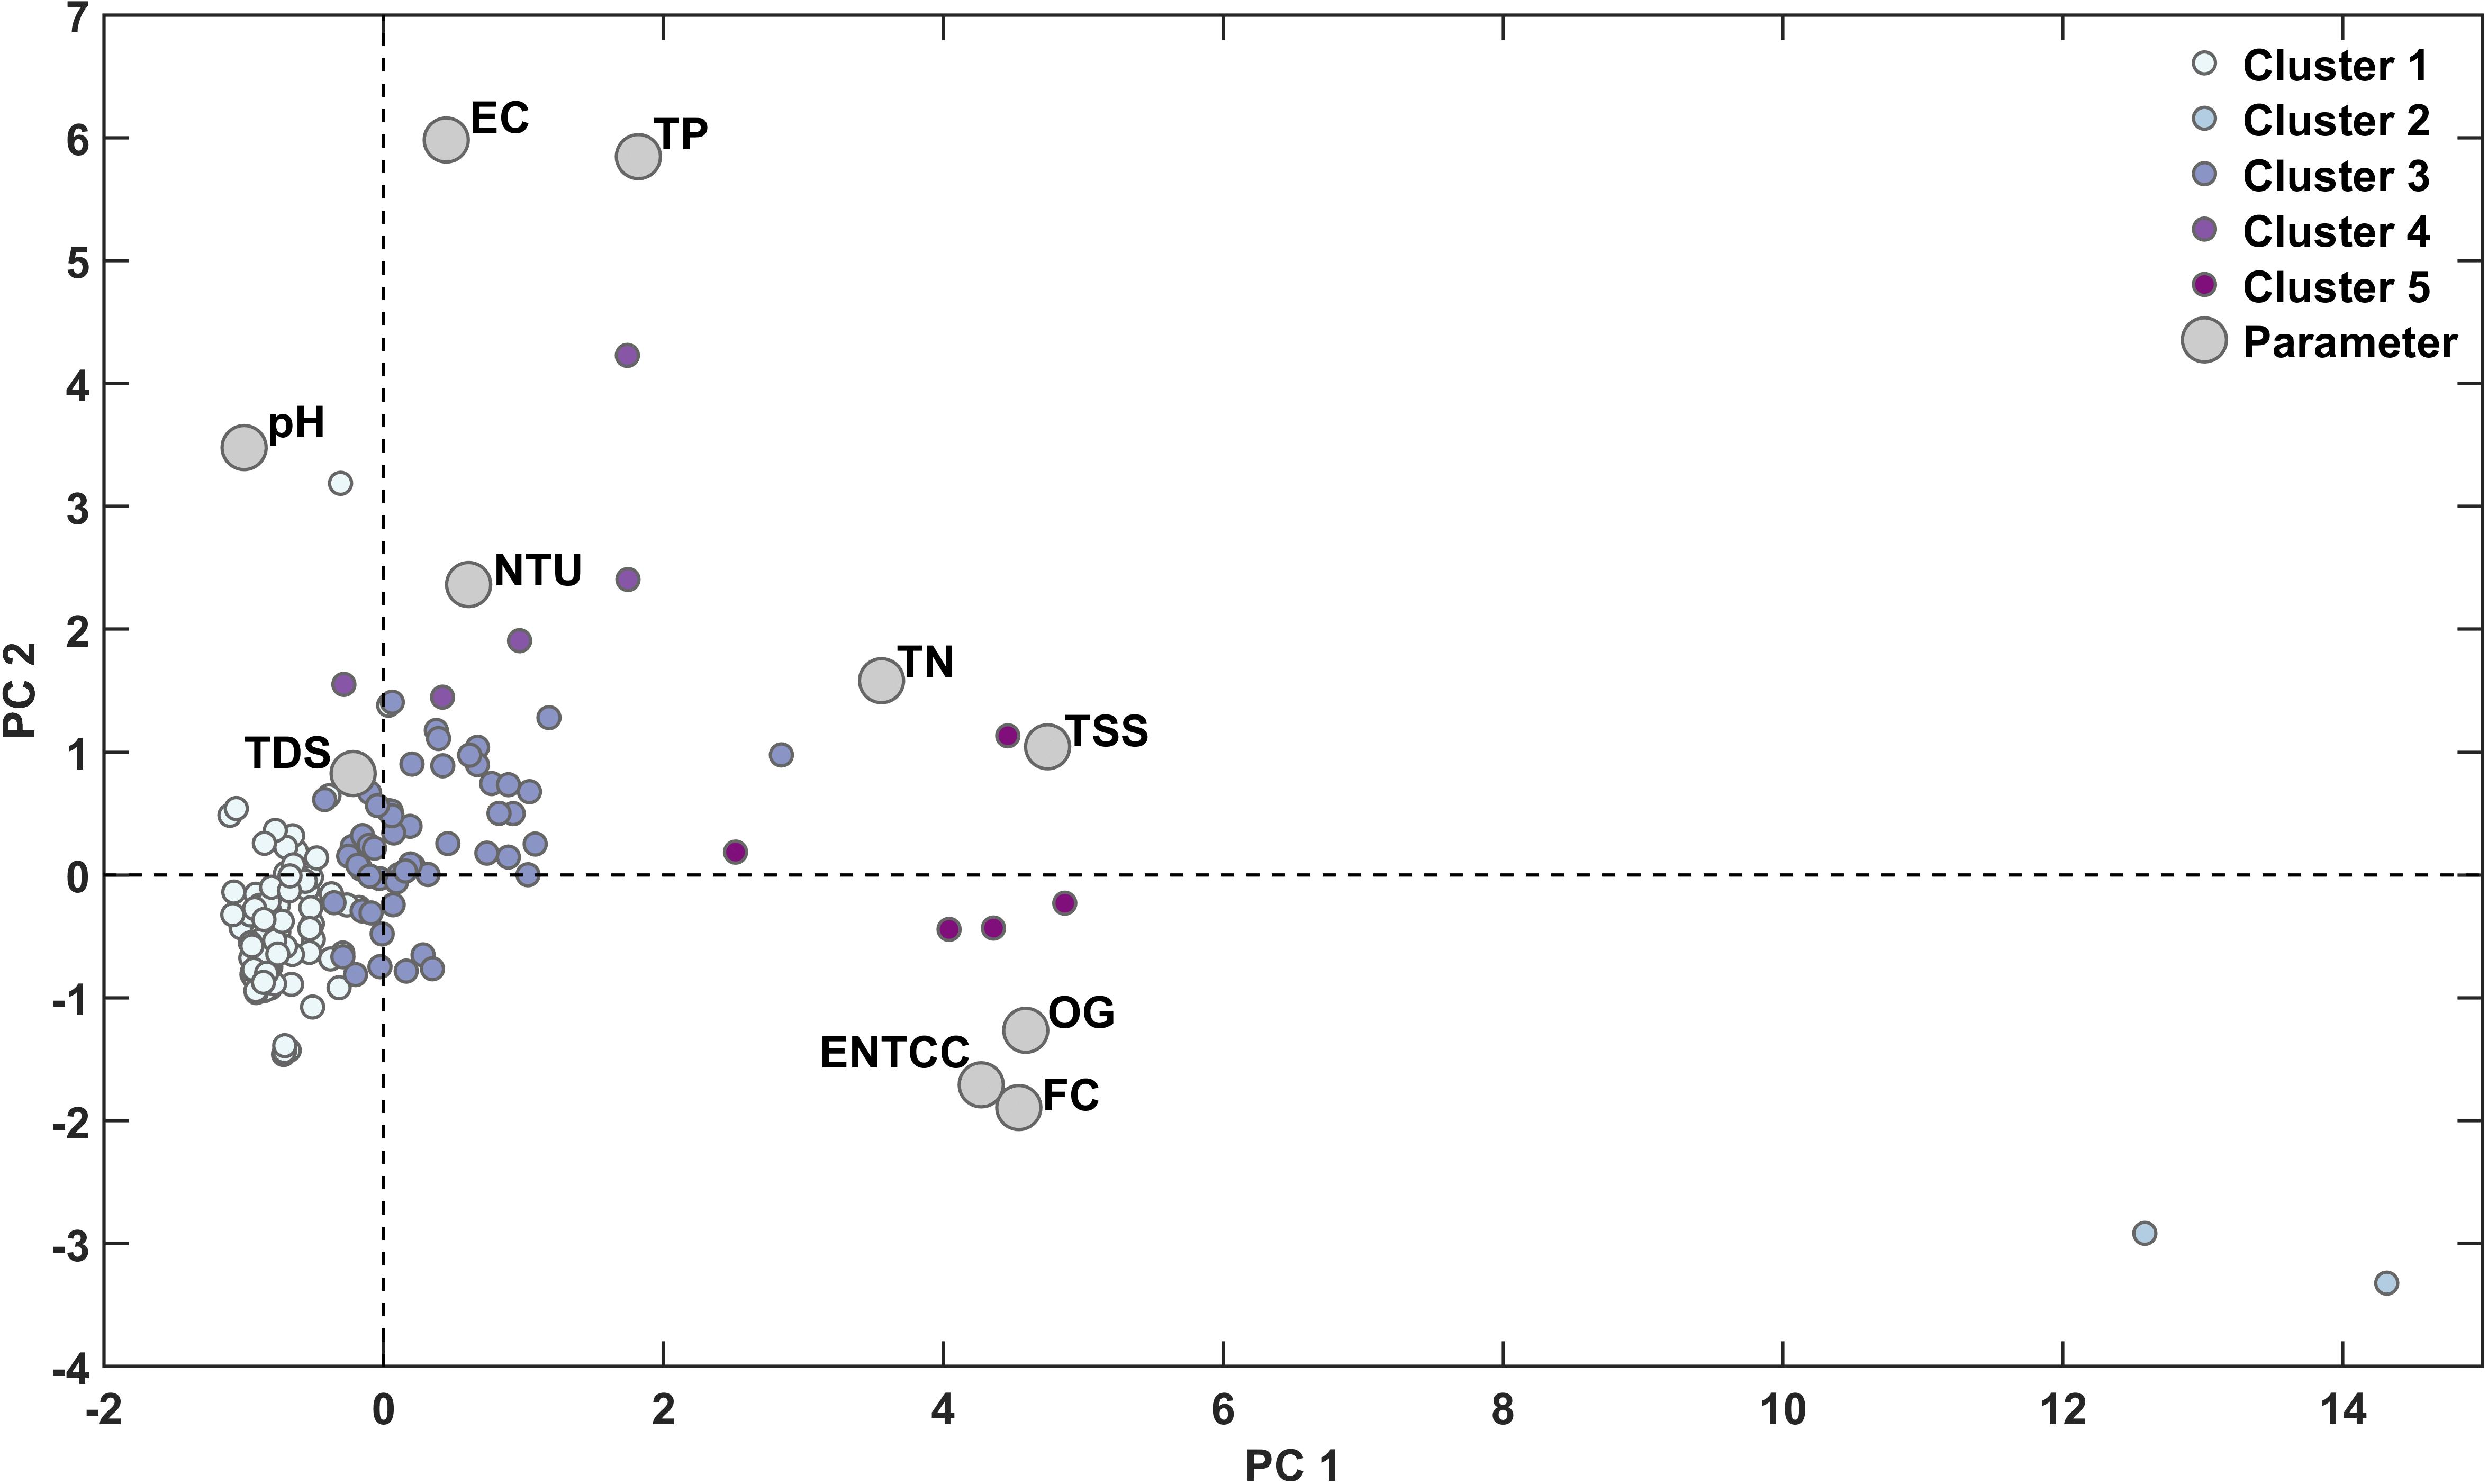
Figure 4. PCA scores in five clusters. PC1 explains 65% and PC2 21% of the variance. Coefficients or parameters illustrate how each pollutant variable contribute to the two principal components.
Not surprisingly, the cluster analysis results suggest that each outfall site did not group according to its state or territory, instead state and territory representation was spread over five clusters (Figure 5 and Table 5). Tasmania was the most diverse state with sites in four out of five clusters. The second most diverse was New South Wales and Western Australia outfall sites across three clusters. Northern Territory outfall sites were grouped into two clusters only. Cluster 3 is the only group that consists all states/territory (Table 5).
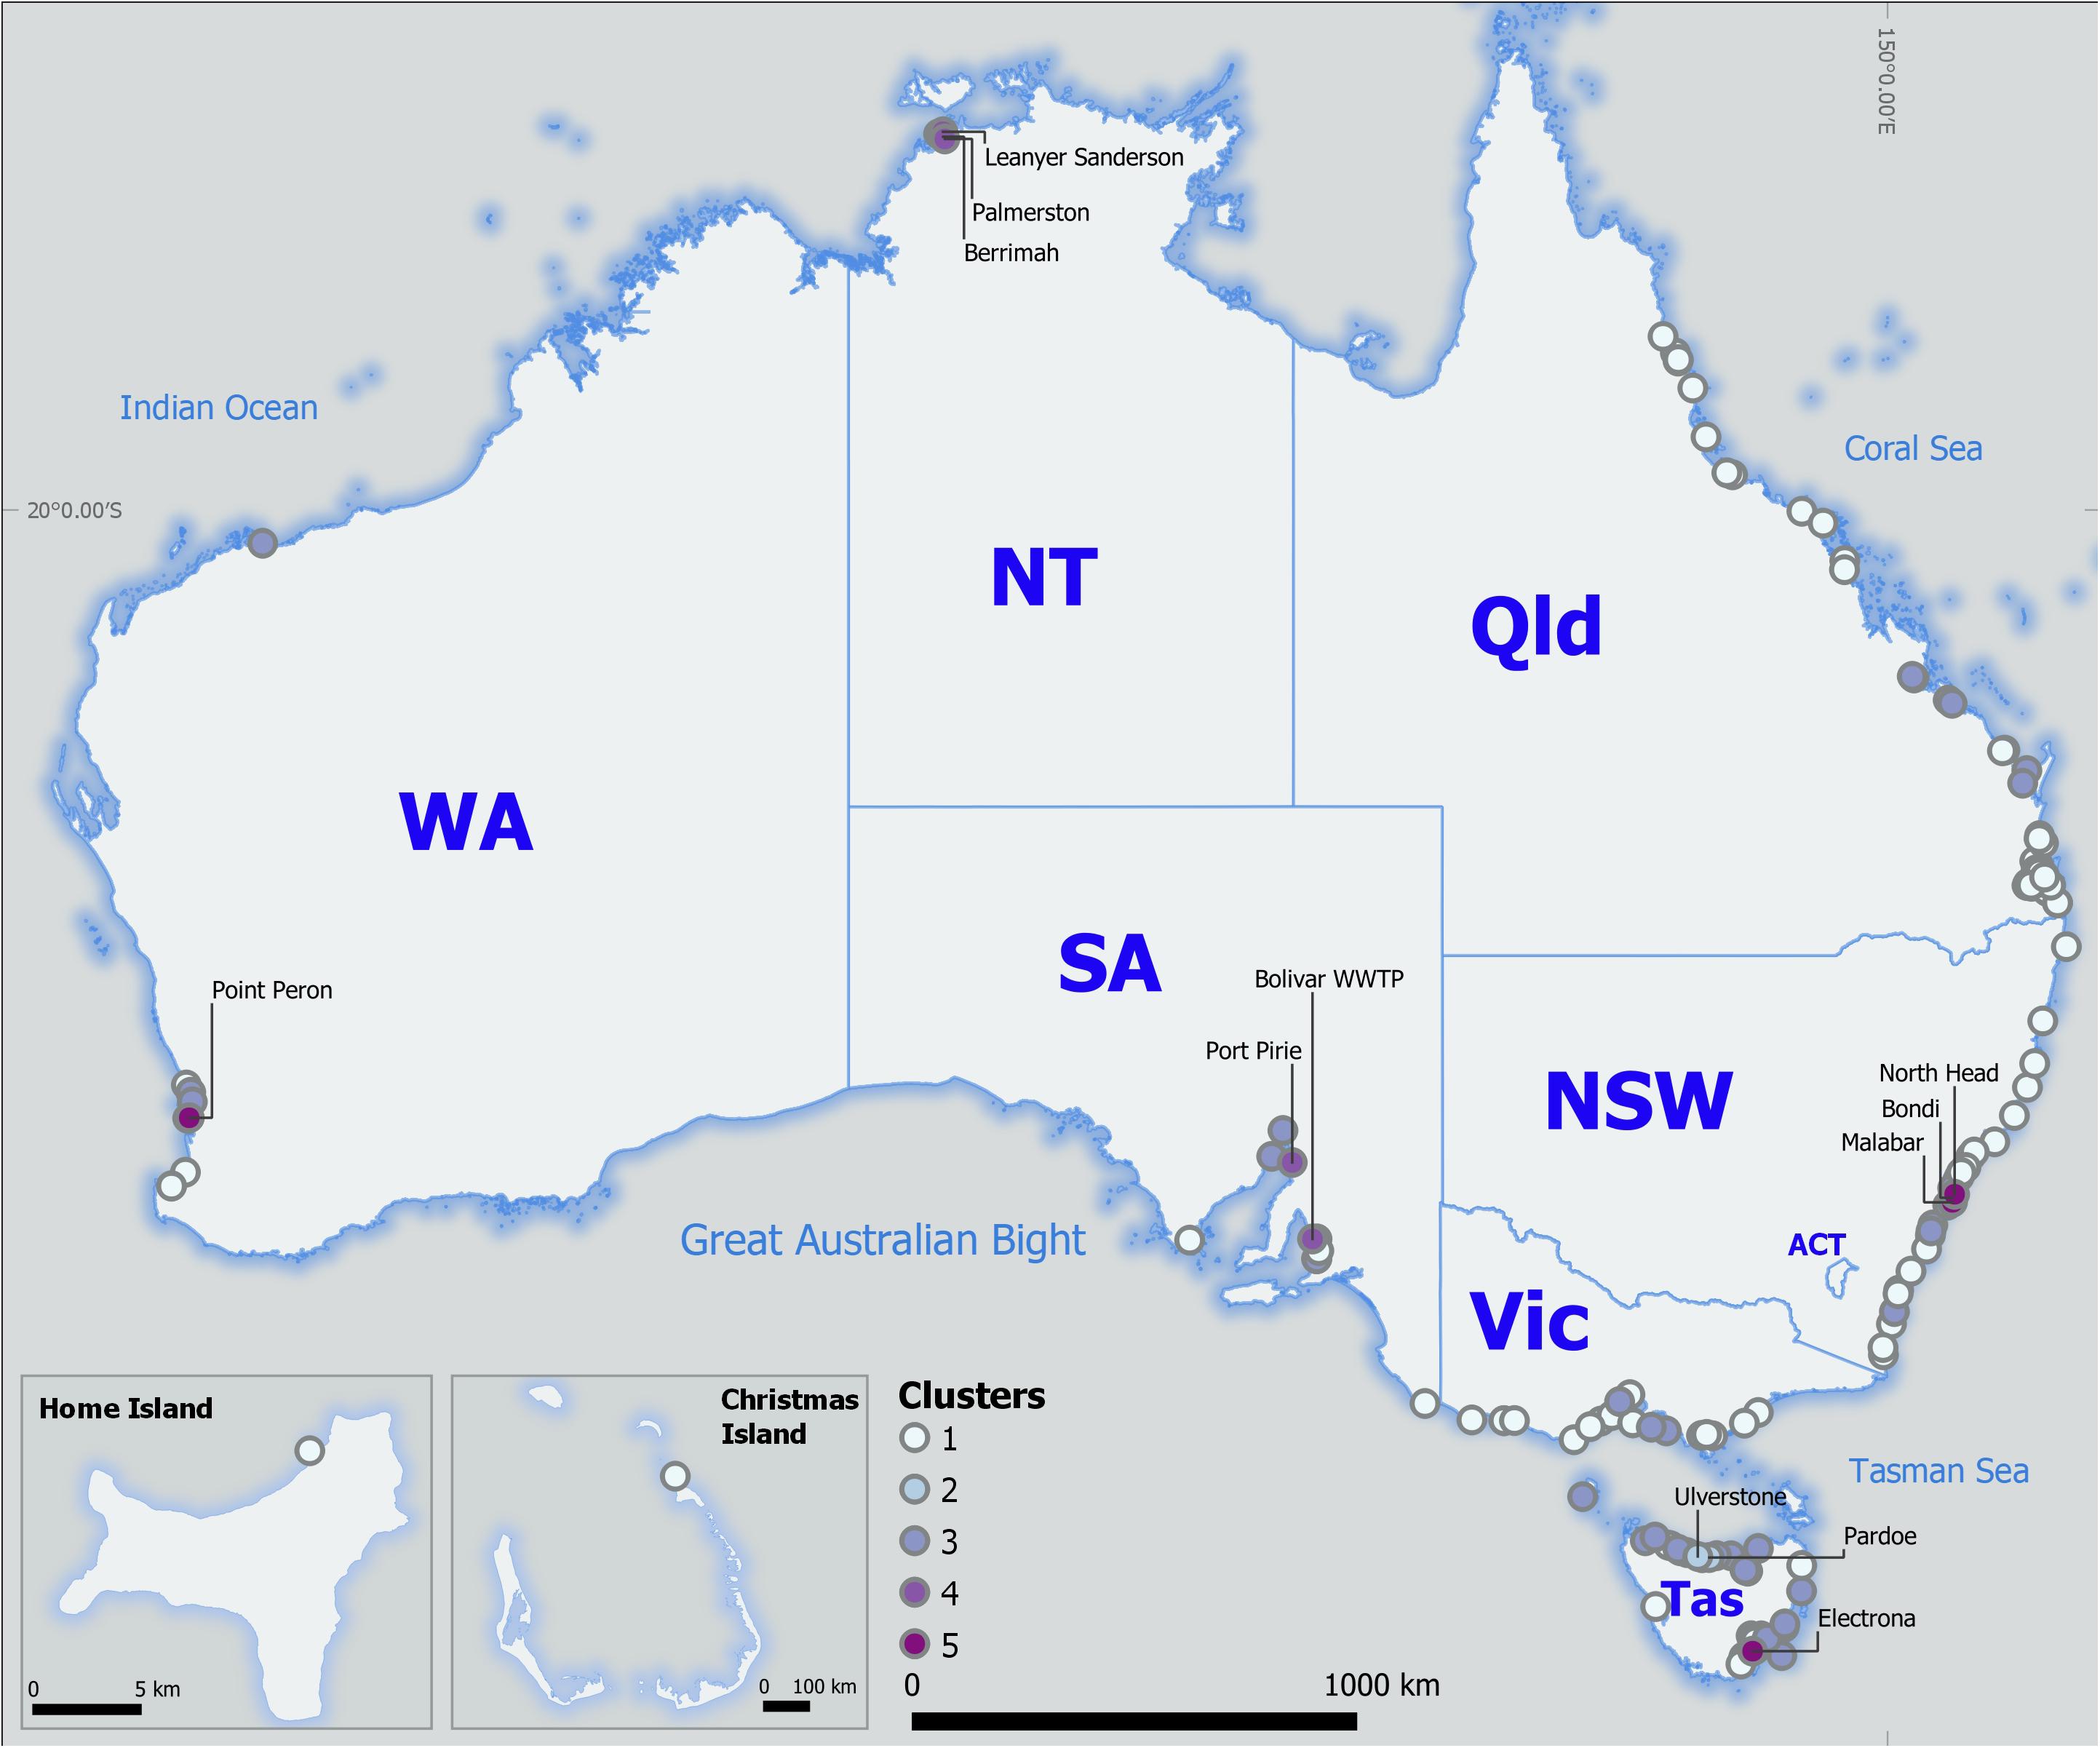
Figure 5. Cluster distribution of Australian coastal outfalls.
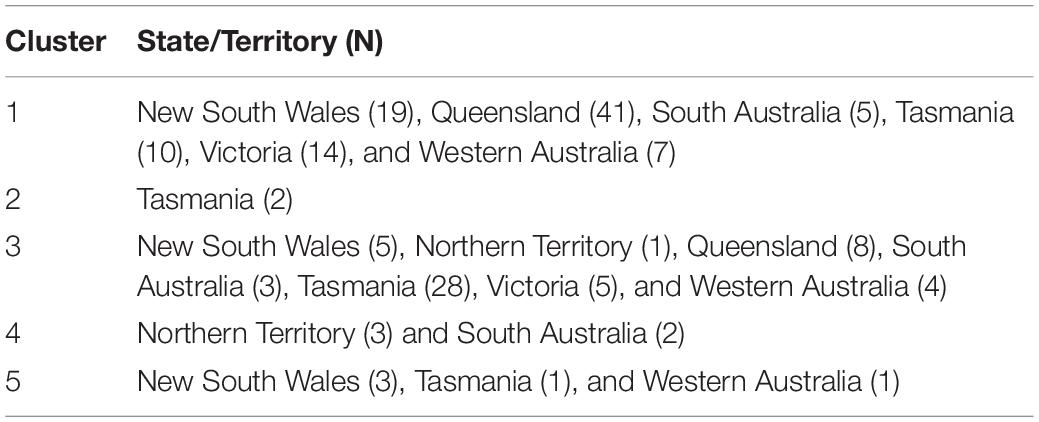
Table 5. Australian state and territory distribution over five clusters along with the number of outfalls sites in each group.
Cluster two consists two Tasmanian outfalls (Pardoe and Ulverstone), which discharge some of the highest FC and ENTCC values in the nation. Cluster four represents outfalls (Berrimah, Leanyer Sanderson, Palmerston, Port Pirie and Bolivar WTP) across the Northern Territory and South Australia, which are responsible for contributing higher concentrations of EC, TP, and NTU. Cluster five contains three of the largest outfalls in the nation, located in Sydney (Bondi, Malabar and North Head), Electrona (Tasmania) and Point Peron (Western Australia). These outfalls are responsible for contributing higher concentrations of OG, TN, and TSS.
Discussion
Water quality parameters were collected from 162 outfalls around Australia. The highest level of oil and grease were associated with highly urbanized and industrial areas, as were organic pollutants (nitrogen and phosphorous). Higher levels of N and P were not always associated with agricultural regions (Xia et al., 2016; Tromboni and Dodds, 2017; Rohmana et al., 2019), as other studies have found (Booth, 2015; Clendenon and Atkins, 2016). Clusters identify outfalls that share high fecal coliform and enterococci and discharge high levels of oil and grease and nutrients (e.g., cluster 2 and cluster 5, Figure 5). General patterns showed a strong correlation between enterococci and fecal coliform, and total nitrogen, total phosphorus, and total suspended solids (Figures 2, 4 and Table 4). These correlations were confirmed by the SOM planes, PCA, and the covariance matrix.
Enterococci and fecal coliform are the most common bacterial indicator for monitoring water quality. In order to decrease human health risk, these bacteria have been widely used to detect pathogens in marine and aquatic environments (Havelaar et al., 1986; Efstratiou, 2019). Fecal bacteria, commonly, appear within the wastewater (Ashbolt et al., 2001) and high concentrations of fecal coliform and enterococci occurs when treatment plants have inadequate processes to remove bacteria from effluent (US EPA, 1998; Adams et al., 2008). The most noticeable level of high fecal bacteria counts in cluster two were represented by two Tasmanian outfalls (Pardoe and Ulverstone) (Figures 4, 5). According to the Tasmanian emission limit guidelines for existing sewage treatment plants, fecal coliform must not exceed 1000 org/100 mL (DPIPWE, 2001). However, in this case, these two outfalls exceeded the acceptable limits and have consistently discharged high counts of fecal bacteria since 2015 (NOD, 2019a, b). The permit conditions showed that Pardoe WTP does not have any bacterial limits, although it is required to monitor levels. Ulverstone WTP has a maximum limit of 2000 org/100 mL for fecal coliform in the effluent quality. Currently, the EPA Tasmania and TasWater are in the process of upgrading Pardoe and Ulverstone WTP infrastructures (Infrastructure Tasmania, 2019; OTTER, 2019) to improve the levels of bacterial contamination in these coastal waters.
There are several outfall sites that cluster around the PCA coefficients of total phosphorus, total nitrogen and total suspended solids (Figure 4). These sites consist of outfalls in cluster three (Port Sorell, TAS), cluster four (Berrimah, NT) and cluster five (Electrona, TAS and Point Peron, WA). Those two Tasmanian outfalls tend to have slightly high total phosphorus, total nitrogen and total suspended solids, respectively, compared to the Tasmanian acceptable emission limits (DPIPWE, 2001). These elevated levels are likely due to the license conditions of each outfall. Port Sorell STP is not required to monitor the TP, TN, and TSS, while Electrona STP has maximum limit of 12, 65, and 186 mg/L for TP, TN and TSS, respectively. Despite discharging slightly higher concentrations of total nitrogen, Point Peron WTP (WA) did not exceed the 230 mg/L acceptable limit of Western Australian Environmental Quality Guidelines (ANZECC and ARMCANZ, 2000). There is no clear explanation where Berrimah WTP discharge point has a limit on these three parameters on their license, but it has four reported monitoring points limit which all says >30 μg/L (TP), >300 μg/L (TN), and >15 μg/L (TSS) (EPA NT, 2018). However, persistent elevated concentrations of nutrients will eventually affect the marine environment. The cumulative impact of nutrients and suspended solids might alter the original composition of marine environment by increasing eutrophication, algal growth, and reduce the light penetration into the waterbody which may impact marine biodiversity (ANZECC and ARMCANZ, 2000; Thompson and Waite, 2003; Beck and Birch, 2011; Clendenon and Atkins, 2016; Weerasekara et al., 2016).
Previous studies focused mainly on particular cases in certain areas (Burridge and Bidwell, 2002; Thompson and Waite, 2003; Adams et al., 2008; Manning et al., 2019) rather than across a national scale, as in this study. Considering the increasing availability of vast datasets at both national and regional scales, decision makers have the capability to conduct more comprehensive analyses to assist them in allocating limited resources to minimize the impact of wastewater on the environment (Edgar et al., 2016). There are strong relationships between ecological patterns and environmental covariates that emerge clearly when regional-to-global-scale data are considered (Kerr et al., 2007; Webb et al., 2009; Mora et al., 2011). As an unprecedented collection of nationwide water quality data, the NOD acts as a tool to facilitate cross institutional coordination across federal, state, and local authorities to integrate infrastructure planning and decision making of wastewater effluent from coastal outfalls (Marine Biodiversity Hub, 2015).
Currently, each state/territory EPA produces separate regulations and permits for WTPs to monitor their wastewater quality (EPA NSW, 2015; EPA VIC, 2017; OTTER, 2019), prohibiting a comprehensive analysis of national scale impacts. A comprehensive understanding of the constituents and level of pollutants in coastal WTP effluent within a public database provides an opportunity to apply the best possible knowledge to inform decisions in complex transboundary marine ecosystems, such as Australia. The existence of the NOD raises awareness at various scales – local, regional, state, national and international – of the extent of our wastewater effluent and provides essential information to assess the impacts on receiving waters. The ultimate outcome could be an improvement in the management of coastal biodiversity and assist agencies with their obligations to inform citizens of recreational health risks. Important environmental and human health implications are suggested by our research findings. Across Australia, discharge pollution limits appear to be set in a piecemeal and inconsistent manner, with limits being elevated where a plant simply cannot perform. This is not an appropriate way for regulating pollution discharge to limit the risks to environmental and human health and research helps to guide a more consistent and comprehensive approach to ensuring environmental and human health.
Added to this diversity of wastewater levels of quality of treatment and disposal across Australia, it can be seen that the number and type of outfalls vary considerably by jurisdiction and location. For example, Tasmania has one of the highest number of outfalls per capita, while many of the states have poorly performing outfalls. As Blackwell and Gemmill (2019) state, “these can be explained in part by the number of outfalls and size and geographical spread of relevant local populations that will benefit from the upgrades but also by the individual jurisdictional asset condition and their respective histories, evolutions and success with water and wastewater reform.” In cases such as Tasmania, where historical legacies prevail and upgrades present a net cost to society, some form of subsidization by the nation will be required to ensure that no single state falls behind others (Blackwell and Gemmill, 2019). Blackwell and Gemmill (2019) found that overall enough states gain a net benefit from upgrades to compensate those states or territories that incur a net loss and remain better-off and this presents a prima face case for some form of subsidization.
National Outfall Standards for Monitoring and Reporting
Currently, state and territory EPAs determine the monitoring parameter standards and reporting requirements. The inconsistency of reporting requirement has resulted in an ambiguous process of governing water quality in Australia’s coastal environment. This leads to a lack of clarity when assessing progress against international environmental goals and targets. Transparency equals good governance and elements of good governance include a clear enforceable reporting framework. For this reason, the Clean Ocean Foundation, using the data from the NOD, has started to establish the Standards and Guidelines for National Reporting of Outfall Data. National standards will provide a further legal directive to reduce WTP effluent impacts to the marine environment and improve health outcomes for recreational users and enhance business output (European Commission, 2017; European Commission, 2019; World Bank, 2018). This national standard is designed to redefine parameters, monitoring methods and reporting requirements in an effort to expand Australia’s efforts in enhancing biodiversity protection and achieving Sustainable Development Goal 14 and in promoting data transparency and accountability of WTPs.
Many countries have already implemented national wastewater standards in order to effectively govern their aquatic and marine environments. Many of these standards were based on the provision of large amount of water quality data across a variety of environmental conditions. For example, the U.S. Environmental Protection Agency developed a portal (WQX) to store and manage water quality data for freshwater, groundwater and coastal areas (Read et al., 2017). This portal provides a centralized data repository for WTP monitoring allowing for the centralized analysis, reporting and display of water quality across the United States. Similar to the NOD, the portal has a standardized format of data upload, presentation, analysis, and mapping. The WQX portal was established primarily to reduce inconsistency between data sets, reduce workloads, and increase time efficiency associated with data management (Read et al., 2017). While, some data from the WQX are commercialized or available upon request (Read et al., 2017), the NOD enables free access to wastewater quality not only in Australia, but also other countries. This will allow for comparisons across countries and regions in establishing the attainment of targets under SDGs. The NOD water quality data can also be evaluated along with biodiversity surveys allowing for the prioritization of biodiversity conservation, an obligation under the Convention on Biological Diversity.
The European Commission (EC) has developed the Urban Waste Water Treatment Directive (UWWTD) (91/271/EEC) in 1991 (European Commission, 1991, 2019). The Directive is directly related to Water Framework Directive (WFD) 2000/60/EC and Environmental Quality Standards Directive (EQSD) 2013/39/EU, for setting up the water quality parameter concentration limits. It lays down four main obligations, planning, regulation, monitoring and reporting. The UWWTD has helped these countries successfully to reuse the water and maintain the cleanliness of the rivers by having high rates (85%) of recycled water (European Commission, 2019; Pistocchi et al., 2019). The EC invested approximately EUR 25 million each year for the UWWTD framework development, implementation, wastewater infrastructure, drinking water supply, and water conservation (European Commission, 2017). Similar to the United States and European Union, having a standard reporting in Australia may help the relevant stakeholders including citizen science to promote healthy marine environment initiatives and play an active governance role in developing national reporting standards. In terms of accountability, the WTAs would be able to commit to fulfill their obligations toward the general public for improved management of the environment.
The research presented here is anticipated to provide support for the development the Standards and Guidelines for National Reporting of Outfall Data in Australia. Two salient points can be made about these standards. Firstly, the results showed a strong correlation between various parameters (Figures 2, 4 and Table 4). Understanding these relationships overtime may be useful for predicting the future patterns of water quality, which can also help to redefine and reduce parameter limits (Shakhari et al., 2019). Secondly, the outfall clusters will definitely help water resource managers to discover where pollution problems exist, where to focus pollution control and where water quality improvements have been made (Figure 5). Once a national standard is established, redefined monitoring and reporting may help these sites assess water quality and biodiversity impacts in achieving SDG goals. Furthermore, the improved effluent from the WTP might be fully recycled as both potable and non-potable use, which may increase the Australian water supply (NRMMC, and EPHCA, 2006). With the NOD, a centralized database would be a dynamic resource for sharing and communicating comprehensive, national scale pollutant data from outfalls, which may help to reduce the outfall emission into the environment and supporting the sustainability of Australian marine environment biodiversity (Rohmana et al., 2018).
Conclusion
The governance and performance of WTPs in Australia sits in stark contrast to the frameworks that have been established in other parts of the world. The NOD provides a comprehensive database for making outfall monitoring data easily accessible and transparent by allowing for the investigation of the general patterns of the effluent quality across Australian coastal outfalls. This research has revealed two key points, which will aid decision makers in prioritizing water pollution governance across Australian waters. Firstly, the correlation patterns of various water quality parameters support the need to redefine and reduce concentrations limit which drive water recycling. Secondly, it helps decision makers to prioritize actions to reduce water pollution and improve environmental and human health outcomes and reduce health risks. The NOD, as with other e-government data initiatives, attempts to provide accessible and transparent data to not only address international environmental obligations, but to also develop sense of transparency and accountability for Australia’s WTP stakeholders. The NOD, an NGO led initiative, was developed as a form of social reporting to help not only achieve stakeholder accountability but to guide the development of National Outfall Reporting Standards in a consistent and collaborative fashion across all Australian jurisdictions. The NOD acts as a third party between WTAs and other stakeholders and provides a neutral platform for unbiased decision making, improving governance and promoting accountability. As the National Outfall Reporting Standards is currently being developed, it is recommended that future research focuses on evaluating its implementation and furthering its potential toward advancing public accountability and improved environmental and economic outcomes. Additional research should focus on developing NOD capacity for handling those pollutants that were inconsistently measured across outfall sites and to take into consideration emerging pollutants.
Data Availability Statement
The datasets presented in this study can be found in online repositories. The names of the repository/repositories and accession number(s) can be found below: NOD data resources publication website https://www.outfalls.info/publications and Metadata UTAS https://catalogue.aodn.org.au/geonetwork/srv/eng/metadata.show?uuid=21448123-0170-4aff-9b56-2b6aa21c73.
Author Contributions
QR and AF presented the main idea. QR developed the theory, wrote the manuscript, carried out the data collection, and performed the analytical computation. AF directly supervised the findings of this work, and helped and verified the analytical methods. JC verified the numerical results on the summary statistics. BB contributed to the Tasmanian insights in the section “Discussion.” JG provided critical feedback of the manuscript. All authors contributed to the section “Discussion,” and verified and proofread the manuscript.
Funding
This research project was supported by the Marine Biodiversity Hub through funding from the Australian Government’s National Environmental Science Program.
Conflict of Interest
JC was employed by the company Infotech Research. BB was employed by the company AquaEquis Consulting.
The remaining authors declare the research was conducted in the absence of any commercial or financial relationships that could be construed as a potential conflict of interest.
Acknowledgments
We would like to show our gratitude to the Marine Biodiversity Hub, University of Tasmania, and Clean Ocean Foundation for supporting this research. We thank all the Water Authorities, EPA, and Department of Environment and Science from Northern Territory, Queensland, New South Wales, Victoria, Tasmania, South Australia, and Western Australia for providing the outfalls data into the NOD repository.
Footnotes
References
Abdi, H., and Williams, L. J. (2010). Principal Component Analysis. (Hoboken, NJ: John Wiley & Sons, Inc), 433–459. doi: 10.1002/wics.101
Adams, M. S., Stauber, J. L., Binet, M. T., Molloy, R., and Gregory, D. (2008). Toxicity of a secondary-treated sewage effluent to marine biota in Bass Strait, Australia: development of action trigger values for a toxicity monitoring program. Mar. Pollut. Bull. 57, 587–598. doi: 10.1016/j.marpolbul.2007.12.012
ANZECC, and ARMCANZ, (2000). National Water Quality Management Strategy: Australian and New Zealand Guidelines for Fresh and Marine Quality. Canberra: Australian and New Zealand Environment and Conservation Council.
Ashbolt, N. J., Grabow, W. O. K., and Snozzi, M. (2001). “Indicators of microbial water quality,” in Water quality: Guidelines, Standards and Health, eds L. Fewtrell and J. Bartram, (London: IWA Publishing).
Auld, G., and Gulbrandsen, L. H. (2014). “Learning through disclosure: the evolving importance of transparency in the practice of nonstate certification,” in Transparency in Global Environmental Governance: Critical Perspectives, eds A. Gupta and M. Mason, (Cambridge, MA: MIT Press).
Bação, F., and Lobo, V. (2010). Introduction to Kohonen’s Self-Organizing Maps. Lisbon: Universidade Nova de Lisboa.
Beck, H. J., and Birch, G. F. (2011). Metals, nutrients and total suspended solids discharged during different flow conditions in highly urbanised catchments. Environ. Monit. Assess. 184, 637–653. doi: 10.1007/s10661-011-1992-z
Blackwell, B. D., and Gemmill, J. (2019). Coastal Outfall System Upgrades in Australia: Benefits, Costs, and Improved Transparency – Final Report. Wonthaggi: Clean Ocean Foundation.
Boehm, A. B., Ismail, N. S., Sassoubre, L. M., and Andruszkiewicz, E. A. (2017). Oceans in Peril: grand challenges in applied water quality research for the 21st century. Environ. Eng. Sci. 34, 3–15. doi: 10.1089/ees.2015.0252
Booth, A. (2015). State of the bay report. “Looking ahead: nutrients and hypoxia.”. Urban Coast 5, 190–193.
Borgman, C. L. (2012). The conundrum of sharing research data. J. Am. Soc. Inf. Sci. Technol. 63, 1059–1078. doi: 10.1002/asi.22634
Breard, G. T. (2017). Evaluating Self-Organizing Map Quality Measures as Convergence Criteria. Master’s thesis, University of Rhode Island, Kingston, RI.
Brodinová, Š., Filzmoser, P., Ortner, T., Breiteneder, C., and Rohm, M. (2019). Robust and sparse k-means clustering for high-dimensional data. Adv. Data Anal. Classif. 13, 905–932. doi: 10.1007/s11634-019-00356-9
Bull, J. W., Brauneder, K., Darbi, M., Van Teeffelen, A. J., Quétier, F., Brooks, S. E., et al. (2018). Data transparency regarding the implementation of European ‘no net loss’ biodiversity policies. Biol. Conserv. 218, 64–72. doi: 10.1016/j.biocon.2017.12.002
Burd, B., Bertold, S., and Macdonald, T. (2012). Responses of infaunal composition, biomass and production to discharges from a marine outfall over the past decade. Mar. Pollut. Bull. 64, 1837–1852. doi: 10.1016/j.marpolbul.2012.06.007
Burridge, T. R., and Bidwell, J. (2002). Review of the potential use of brown algal ecotoxicological assays in monitoring effluent discharge and pollution in southern Australia. Mar. Pollut. Bull. 45, 140–147. doi: 10.1016/s0025-326x(02)00126-1
Campbell, A. M., Fleisher, J., Sinigalliano, C., White, J. R., and Lopez, J. V. (2015). Dynamics of marine bacterial community diversity of the coastal waters of the reefs, inlets, and wastewater outfalls of southeast Florida. Microbiol. Open 4, 390–408. doi: 10.1002/mbo3.245
Campos, C. J. A., Avant, J., Gustar, N., Lowther, J., Powell, A., Stockley, L., et al. (2015). Fate of human noroviruses in shellfish and water impacted by frequent sewage pollution events. Environ. Sci. Technol. 49, 8377–8385. doi: 10.1021/acs.est.5b01268
Carey, R. O., and Migliaccio, K. W. (2009). Contribution of wastewater treatment plant effluents to nutrient dynamics in aquatic systems: a review. Environ. Manage. 44, 2015–2017. doi: 10.1007/s00267-009-9309-5
Céréghino, R., and Park, Y.-S. (2009). Review of the Self-Organizing Map (SOM) approach in water resources: commentary. Environ. Model. Softw. 24, 945–947. doi: 10.1016/j.envsoft.2009.01.008
Clendenon, C., and Atkins, W. A. (2016). Pollution of the Ocean by Sewage, Nutrients, and Chemicals. Available: http://www.waterencyclopedia.com/Po-Re/Pollution-of-the-Ocean-by-Sewage-Nutrients-and-Chemicals.html (accessed April 12, 2016).
DECC NSW, (2009). Load Calculation Protocol. Sydney: Department of Environment and Climate Change NSW.
DPIPWE, (2001). Emission Limit Guidelines for Sewage Treatment Plants that Discharge Pollutants into Fresh and Marine Waters June 2001. (Hobart: EPA Tasmania).
Edgar, G. J., Bates, A. E., Bird, T. J., Jones, A. H., Kininmonth, S., Stuar-Smith, R. D., et al. (2016). New approaches to marine conservation through the scaling up of ecological data. Annu. Rev. Mar. Sci. 8, 435–461. doi: 10.1146/annurev-marine-122414-033921
Efstratiou, M. A. (2019). “Microorganisms in Beach Sand: Health Implications,” in Encyclopedia of Environmental Health, 2nd Edn, ed. J. Nriagu, (Amsterdam: Elsevier).
EPA NSW, (2003). Licensing Guidelines for Sewage Treatment Systems. Sydney: Environment Protection Authority.
EPA NSW, (2013). Using Environment Protection Licensing to Control Water Pollution. Sydney: Environment Protection Authority.
EPA NSW. (2015). Policies, Guidelines and Programs. Available: http://www.epa.nsw.gov.au/Water_pollution/policy.htm (accessed March 27, 2016).
EPA NT, (2013). Waste Discharge License - WDL 148-04. Darwin: Environmental Protection Authority Northern Territory.
EPA NT, (2018). Waste Discharge Licence WDL 146-08. Darwin: Environment Protection Authority, Northern Territory.
EPA SA, (2016). Regulatory Monitoring and Testing – Monitoring Plans Requirements. Adelaide: South Australian Environmental Protection Authority.
EPA VIC. (2009). Industrial Waste Resource Guidelines: Sampling and Analysis of Waters, Wastewaters, Soils and Wastes. Carlton: Environment Protection Authority Victoria.
European Commission, (2017). Report From The Commission To The European Parliament, The Council, The European Economic And Social Committee And The Committee Of The Regions Ninth Report on the Implementation Status and the Programmes for Implementation (as required by Article 17) of Council Directive 91/271/EEC Concerning Urban Waste Water Treatment”. Brussels: European Commission.
European Environment Agency, (2017). WISE - Water Information System for Europe is the European Information Gateway to Water Issues. Copenhagen: European Environment Agency.
European Parliament, (2001). REGULATION (EC) No 1049/2001 OF THE EUROPEAN PARLIAMENT AND OF THE COUNCIL of 30 May 2001 Regarding Public Access to European Parliament, Council and Commission Documents. Brussels: European Parliament.
Fezzi, C., Harwood, A. R., Lovett, A. A., and Bateman, I. J. (2015). The environmental impact of climate change adaptation on land use and water quality. Nat. Clim. Change 5, 255–260. doi: 10.1038/nclimate2525
Friesike, S., Widenmayer, B., Gassmann, O., and Schildhauer, T. (2015). Opening science: towards an agenda of open science in academia and industry. J. Technol. Transf. 40, 581–601. doi: 10.1007/s10961-014-9375-6
Friess, D. A., and Webb, E. L. (2011). Bad data equals bad policy: How to trust estimates of ecosystem loss when there is so much uncertainty? Environ. Conserv. 38, 1–5. doi: 10.1017/s0376892911000026
Fung, A. (2013). Infotopia: unleashing the democratic power of transparency. Polit. Soc. 41, 183–212. doi: 10.1177/0032329213483107
Gemmill, J., Fischer, A. M., and Rohmana, Q. A. (2019). Australian Coastal Sewage Outfalls and Data Transparency: Public Access to Government Information. Canberra: Marine Biodiversity Hub.
Gupta, A. (2010). Transparency in global environmental governance: a coming of age? Glob. Environ. Polit. 10, 1–9. doi: 10.1162/GLEP_e_00011
Hair, J. F., Black, W. C., Babin, B. J., and Anderson, R. E. (2010). Multivariate Data Analysis, 7th Edn. London: Pearson Education Limited.
Härdle, W. K., and Simar, L. (2015). Applied Multivariate Statistical Analysis, 4th Edn. Berlin: Springer-Verlag.
Harrison, T. M., and Sayogo, D. S. (2014). Transparency, participation, and accountability practices in open government: a comparative study. Gov. Inf. Q. 31, 513–525. doi: 10.1016/j.giq.2014.08.002
Havelaar, A. H., Furuse, K., and Hogeboom, W. M. (1986). Bacteriophages and indicator bacteria in human and animal faeces. J. Appl. Bacteriol. 60, 255–262. doi: 10.1111/j.1365-2672.1986.tb01081.x
Infrastructure Tasmania, (2019). Infrastructure Project Pipeline 2019. Hobart: Department of State Growth, Tasmania.
Jagai, J. S., Li, Q., Wang, S., Messier, K. P., Wade, T. J., and Hilborn, E. D. (2015). Extreme precipitation and emergency room visits for gastrointestinal illness in areas with and without combined sewer systems: an analysis of Massachusetts data 2003–2007. Environ. Health Perspect. 123, 873–879. doi: 10.1289/ehp.1408971
Jain, A. K. (2010). Data clustering: 50 years beyond K-means. Pattern Recognit. Lett. 31, 651–666. doi: 10.1016/j.patrec.2009.09.011
Kelvin, S. S. H. (2006). Using Self-Organizing Maps (SOM) to Cluster Stocks and Financial Ratios. Available at: https://pdfs.semanticscholar.org/7355/bacd962fd50bfbabdfb22305418e1236c395.pdf?_ga=2.22211643.1483287584.1599412619-401219961.1590039705 (accessed October 8, 2018).
Kerr, J. T., Kharouba, H. M., and Currie, D. J. (2007). The macroecological contribution to global change solutions. Science 316, 1581–1584.
Koltay, T. (2016). Data governance, data literacy and the management of data quality. IFLA J. 42, 303–312. doi: 10.1177/0340035216672238
Lee, S. Y., Díaz-Puente, J. M., and Martin, S. (2019). The contribution of open government to prosperity of society. Int. J. Public Adm. 42, 144–157. doi: 10.1080/01900692.2017.1405446
López, L., and Fontaine, G. (2019). How transparency improves public accountability: the extractive industries transparency initiative in Mexico. Extr. Ind. Soc. 6, 1156–1167. doi: 10.1016/j.exis.2019.09.008
Lourenço, R. P. (2013). “Open government portals assessment: a transparency for accountability perspective,” in International Conference on Electronic Government, eds M. A. Wimmer, M. Janssen, and H. J. Scholl, (Berlin: Springer).
Mallin, M. A., Johnson, V. L., and Ensign, S. H. (2009). Comparative impacts of stormwater runoff on water quality of an urban, a suburban, and a rural stream. Environ. Monit. Assess. 159, 475–491. doi: 10.1007/s10661-008-0644-4
Manning, S. S., Dixon, J. P., Birch, G. F., and Besley, C. H. (2019). Deepwater ocean outfalls: a sustainable solution for sewage discharge for mega-coastal cities (Sydney, Australia): influences on beach water quality. Mar. Pollut. Bull. 145, 691–706. doi: 10.1016/j.marpolbul.2019.05.010
Marine Biodiversity Hub, (2015). Project C4 - National Outfall Database. Canberra: NESP Marine Biodiversity Hub.
Meehl, G. A., Zwiers, F., Evans, J., Knutson, T., Mearns, L., and Whetton, P. (2000). Trends in extreme weather and climate events: issues related to modeling extremes in projections of future climate change. Bull. Am. Meteorol. Soc. 81, 427–436. doi: 10.1175/1520-0477(2000)081<0427:tiewac>2.3.co;2
Mora, C., Aburto-Oropeza, O., Ayotte, P. M., Banks, S., and Bauman, A. G. (2011). Global human footprint on the linkage between biodiversity and ecosystem functioning in reef fishes. PLoS Biol. 9:e1000606. doi: 10.1371/journal.pbio.1000606
NRMMC, (2010). Australia’s Biodiversity Conservation Strategy 2010-2030”. Canberra: Australian Government.
NRMMC, and EPHCA, (2006). National Guidelines for Water Recycling: Managing Health and Environmental Risks. Canberra: NRMMC.
OAIC, (2013). What is Freedom of Information? Sydney: Office of the Australian Information Commissioner.
OTTER, (2019). Tasmanian Water and Sewerage State of the Industry Report 2017-18. Hobart: Office of The Tasmanian Economic Regulator (OTTER).
Pina, V., Torres, L., and Royo, S. (2007). Are ICTs improving transparency and accountability in the Eu regional and local governments? An empirical study. Public Adm. 85, 449–472. doi: 10.1111/j.1467-9299.2007.00654.x
Pistocchi, A., Dorati, C., Grizzetti, B., Udias, A., Vigiak, O., and Zanni, M. (2019). Water Quality in Europe: Effects of the Urban Wastewater Treatment Directive. A Retrospective and Scenario Analysis of Dir. 91/271/EEC, EUR 30003 EN. doi: 10.2760/303163
Read, E. K., Carr, L., De Cicco, L., Dugan, H. A., Hanson, P. C., Hart, J. A., et al. (2017). Water quality data for national-scale aquatic research: the water quality portal. Water Resour. Res. 53, 1735–1745. doi: 10.1002/2016WR019993
Reichman, O. J., Jones, M. B., and Schildhauer, M. P. (2011). Challenges and opportunities of open data in ecology. Science 331, 703–705. doi: 10.1126/science.1197962
Reopanichkul, P., Schlacher, T. A., Carter, R. W., and Worachananant, S. (2009). Sewage impacts coral reefs at multiple levels of ecological organization. Mar. Pollut. Bull. 58, 1356–1362. doi: 10.1016/j.marpolbul.2009.04.024
Roberts, D. E. (1996). Effects of the north head deep-water sewage outfall on nearshore coastal reef Macrobenthic assemblages. Mar. Pollut. Bull. 33, 303–308. doi: 10.1016/s0025-326x(96)00123-3
Rohmana, Q. A., Fischer, A., Gemmill, J., and Cumming, J. (2019). National Outfall Database: Outfall Ranking Report 2017-2018. Canberra: Marine Biodiversity Hub.
Rohmana, Q. A., Gemmill, J., and Fischer, A. (2018). Preliminary Transparency Report 2018. Hobart: University of Tasmania.
Schleifer, P., Fiorini, M., and Auld, G. (2019). Transparency in transnational governance: the determinants of information disclosure of voluntary sustainability programs. Regul. Gov. 13, 488–506. doi: 10.1111/rego.12241
Schwarzenbach, R. P., Egli, T., Hofstetter, T. B., Gunten, U. V., and Wehrli, B. (2010). Global water pollution and human health. Annu. Rev. Environ. Resour. 35, 109–136. doi: 10.1146/annurev-environ-100809-125342
Shakhari, S., Verma, A. K., Ghosh, D., Bhar, K. K., and Banerjee, I. (2019). “Diverse water quality data pattern study of the Indian River Ganga: correlation and cluster analysis,” in Proceedings of the 2019 17th International Conference on ICT and Knowledge Engineering (ICT&KE), Bangkok, 1–7. doi: 10.1109/ICTKE47035.2019.8966913
Thompson, P., and Waite, A. (2003). Phytoplankton responses to wastewater discharges at two sites in Western Australia. Mar. Freshw. Res. 54, 721–735. doi: 10.1071/MF02096
Tibshirani, R., Walther, G., and Hastie, T. (2001). Estimating the number of clusters in a data set via the gap statistic. J. R. Stat. Soc. Ser. B. 63, 411–423. doi: 10.1111/1467-9868.00293
Tromboni, F., and Dodds, W. K. (2017). Relationships between land use and stream nutrient concentrations in a highly urbanized tropical region of Brazil: thresholds and riparian zones. Environ. Manage. 60, 30–40. doi: 10.1007/s00267-017-0858-8
US EPA, (1998). How Wastewater Treatment Works: The Basics. Washington, DC: Environmental Protection Agency of United States.
Vatanen, T., Osmala, M., Raiko, T., Lagus, K., Sysi-Aho, M., Orešič, M., et al. (2015). Self-organization andmissingvaluesinSOMandGTM. Neurocomputing 147, 60–70. doi: 10.1016/j.neucom.2014.02.061
Vesanto, J., Himberg, J., Alhoniemi, E., and Parhankangas, J. (2000). SOM Toolbox for Matlab 5. Available: http://www.cis.hut.fi/projects/somtoolbox/package/papers/techrep.pdf (accessed March 14, 2016).
Villmann, T., Der, R., Herrmann, M., and Martinetz, T. M. (1997). Topology preservation in self-organizing feature maps: exact definition and measurement. IEEE Trans. Neural Netw. 8, 256–266. doi: 10.1109/72.557663
Webb, T. J., Tyler, E. H. M., and Somerfield, P. J. (2009). Life history mediates large-scale population ecology in marine benthic taxa. Mar. Ecol. Prog. Ser. 396, 293–306. doi: 10.3354/meps08253
Weerasekara, A. W., Jenkins, S., Abbott, L. K., Waite, I., McGrath, J. W., Larma, I., et al. (2016). Microbial phylogenetic and functional responses within acidified wastewater communities exhibiting enhanced phosphate uptake. Bioresour. Technol. 220, 55–61. doi: 10.1016/j.biortech.2016.08.037
White, S. A., Santos, I. R., Conrad, S. R., and Sanders, C. J. (2018). Investigating Water Quality in Coffs Coastal Estuaries and the reLationship to Adjacent Land Use. Part 2: Water Quality. Coffs Harbour: National Marine Science Centre, Southern Cross University.
World Bank, (2018). “Is the UWWTD Implementation Delivering Results for the People, the Economy, and the Environment of the Danube Region?: A Wastewater Management Assessment Based on the World Bank’s Engagement. Washington, DC: World Bank.
Xia, Y., Ti, C., She, D., and Yan, X. (2016). Linking river nutrient concentrations to land use and rainfall in a paddy agriculture–urban area gradient watershed in southeast China. Sci. Total Environ. 566–567, 1094–1105. doi: 10.1016/j.scitotenv.2016.05.134
Yu, S., Xu, Z., Wu, W., and Zuo, D. (2016). Effect of land use types on stream water quality under seasonal variation and topographic characteristics in the Wei River basin, China. Ecol. Indic. 60, 202–212. doi: 10.1016/j.ecolind.2015.06.029
Zhao, J., Lin, L., Yang, K., Liu, Q., and Qian, G. (2015). Influences of land use on water quality in a reticular river network area: a case study in Shanghai, China. Landsc. Urban Plan. 137, 20–29. doi: 10.1016/j.landurbplan.2014.12.010
Keywords: effluent, outfalls, pollutants, spatial data management, impacts, human health, environment
Citation: Rohmana QA, Fischer AM, Cumming J, Blackwell BD and Gemmill J (2020) Increased Transparency and Resource Prioritization for the Management of Pollutants From Wastewater Treatment Plants: A National Perspective From Australia. Front. Mar. Sci. 7:564598. doi: 10.3389/fmars.2020.564598
Received: 22 May 2020; Accepted: 02 September 2020;
Published: 22 September 2020.
Edited by:
Simone Libralato, Istituto Nazionale di Oceanografia e di Geofisica Sperimentale (OGS), ItalyReviewed by:
Rachel Gjelsvik Tiller, SINTEF, NorwayChristian T. K. -H. Stadtlander, Independent Researcher, St. Paul, United States
Copyright © 2020 Rohmana, Fischer, Cumming, Blackwell and Gemmill. This is an open-access article distributed under the terms of the Creative Commons Attribution License (CC BY). The use, distribution or reproduction in other forums is permitted, provided the original author(s) and the copyright owner(s) are credited and that the original publication in this journal is cited, in accordance with accepted academic practice. No use, distribution or reproduction is permitted which does not comply with these terms.
*Correspondence: Qurratu A’Yunin Rohmana, cXVycmF0dUB1dGFzLmVkdS5hdQ==