
94% of researchers rate our articles as excellent or good
Learn more about the work of our research integrity team to safeguard the quality of each article we publish.
Find out more
ORIGINAL RESEARCH article
Front. Mar. Sci., 09 October 2020
Sec. Marine Ecosystem Ecology
Volume 7 - 2020 | https://doi.org/10.3389/fmars.2020.00521
This article is part of the Research TopicAdvances and Challenges in Microphytobenthos Research: From Cell Biology to Coastal Ecosystem FunctionView all 22 articles
 Raphaël Savelli1*
 Vona Méléder2
 Philippe Cugier3Pierre Polsenaere4Christine Dupuy1
 Johann Lavaud1,5
 Alexandre Barnett1,2
 Vincent Le Fouest1
Microphytobenthos (MPB) at the sediment surface of intertidal mudflats are known to show a high spatial and temporal variability in response to the biotic and abiotic conditions prevailing at the mud surface. It makes long-term and large-scale monitoring of MPB Gross Primary Production (GPP) difficult to set up. In this study, we developed the first 3D physical-biological coupled model (MARS-3D) that explicitly simulates GPP of intertidal MPB at the mudflat scale, and we compared the outputs with in situ and space remote sensing MPB GPP data. We discuss the sources of discrepancies between the modeling and the remote sensing approach in the light of future developments to be done. For instance, the remote sensing algorithm provides a very synoptic view of the mudflat GPP. It is well-suited to achieve diagnostic estimates of MPB GPP at the synoptic spatial and temporal scale. By contrast, the MARS-3D model provides a more dynamic representation of the MPB activity and prognostic estimates of MPB GPP over the mudflat. It is very relevant to resolve the seasonal and inter-annual dynamics of MPB. Getting comparable GPP estimates derived from the remote sensing algorithm and 3D physical-biological coupled model will further require a better convergence in terms of equations structure, biological constants parameterization, and source data used (i.e., vegetation index vs. chlorophyll a). Setting a common parameterization in both the numerical model and remote sensing algorithm might be challenging in a perspective of mapping MPB PP over large mudflats from a synoptic to inter-annual time scale, but it could open the door to a new way of quantifying MPB GPP over large intertidal mudflats.
Benthic microalgae or microphytobenthos (MPB) inhabiting the sediment surface sustain a high biological production in intertidal mudflats (MacIntyre et al., 1996; Underwood and Kromkamp, 1999). As the main primary producers on intertidal mudflats, MPB are of key importance for higher trophic levels from benthic fauna to birds (Herman et al., 2000; Kang et al., 2006; Jardine et al., 2015) and for pelagic organisms that benefit MPB locally resuspended by tides and waves (Perissinotto et al., 2003; Krumme et al., 2008) but also exported to adjacent ecosystems (Saint-Béat et al., 2013). With a global annual Primary Production (PP) estimated to ~500 million tons of Carbon (C; Cahoon, 1999), MPB also participate in the Blue Carbon (Otani and Endo, 2019). Guarini et al. (2008) suggested that MPB PP could represent a significant amount of carbon not considered in the global carbon cycle. However, their contribution to the global carbon budget remains unknown.
The spatial and temporal distribution of MPB over mudflats is highly variable, as it is driven by highly variable physical [light, mud surface temperature (MST), tides, waves, and current] and biological (grazing, biostabilization, and bioturbation) conditions (e.g., Admiraal, 1984; Blanchard et al., 1996; MacIntyre et al., 1996; Underwood, 2001; Morris and Kromkamp, 2003; Sahan et al., 2007; Salleh and McMinn, 2011; Kwon et al., 2014; Orvain et al., 2014a,b; Savelli et al., 2019). Such a variability impedes any accurate and robust assessment of the role played by MPB at the scale of the whole mudflat ecosystem and of its contribution to the carbon cycle. MPB PP and biomass measurements are usually limited to single-point sampling (e.g., Vieira et al., 2013; Orvain et al., 2014a; Cartaxana et al., 2015; Pniewski et al., 2015). This approach succeeds in capturing the MPB temporal dynamics but is rapidly limited when dealing with spatial and temporal variations of MPB PP and biomass at the scale of an entire mudflat. Only a few studies resolved the MPB spatial variability at the mudflat scale, as time and important logistical resources are required to meet this goal (e.g., Guarini et al., 1998; Ubertini et al., 2012). Remote sensing and physical-biological coupled modeling are then relevant and non-invasive approaches to infer on MPB dynamics (e.g., Guarini et al., 2000; Combe et al., 2005; van der Wal et al., 2010; Brito et al., 2013).
Jobson et al. (1980) initiated the use of remote sensing to assess the MPB biomass from a tower-mounted sensor designed to scan a mudflat of South Carolina (USA). Since then, airborne and space remote sensing methods were increasingly developed and more widely used in MPB studies (e.g., Méléder et al., 2003a; Brito et al., 2013; Benyoucef et al., 2014; Daggers et al., 2018). Remote sensing data can cover large spatial scales (~ from one meter to several kilometers), and multispectral broadband sensors promise high quality data to map MPB biomass and PP over entire mudflats. Daggers et al. (2018) first coupled in situ measurements, satellite remote sensing data, and observed tidal heights to map synoptic MPB PP in spring at the scale of the Oosterschelde and Westerschelde estuaries (The Netherlands). Méléder et al. (2020) coupled in situ measurements, satellite remote sensing data, and data simulated (light, MST, and tidal height) by a 3D physical-biological coupled model to map synoptic MPB PP at three seasons over the large intertidal Brouage mudflat on the French Atlantic Coast.
Recently, remotely sensed estimates of vegetation index and of in water MPB chlorophyll a (Chl a) concentration were compared to model outputs in order to assess the model ability to simulate realistic MPB biomass levels over the Brouage mudflat (Savelli et al., 2018, 2019). Such a comparison does not exist for MPB PP. The recent development for the Brouage mudflat of a regional MPB Gross Primary Production (GPP) algorithm (Méléder et al., 2020) and of a 1D MPB GPP physical-biological coupled model (Savelli et al., 2018) allows for the comparison of MPB GPP estimates derived from space remote sensing and a prognostic modeling approach. The objective of this study is to infer the capacity of remote sensing and prognostic modeling to converge toward realistic MPB GPP estimates over the large Brouage mudflat. In this paper, we describe first the physical-biological coupled model developed in 3D in order to simulate the spatial and temporal dynamics of intertidal MPB. Second, we compare the model outputs with remotely sensed MPB GPP estimates coincident in space and time. Finally, we discuss the sources of discrepancies between the two approaches in the light of future developments to be done.
The Pertuis Charentais Sea is a shallow semi-enclosed sea where develops one of the biggest shellfish farming activity in Europe (Goulletquer, 1998). It receives riverine inputs originating from the agricultural watersheds of the Sèvre, Charente, and Seudre rivers (Figure 1). Located in the southern part of the Pertuis Charentais, the Brouage intertidal mudflat is a 42-km2 intertidal mudflat composed of fine cohesive sediments (Bocher et al., 2007) distributed over a gentle slope (~ 1/1,000; Le Hir et al., 2000). As in many other mudflats along the northern European Atlantic coast, a dense MPB biofilm develops at the sediment surface at low tide with Chl a concentrations reaching up to 25 mg Chl a m−2 (Guarini, 1998). The Brouage mudflat is responsible for a large part of the high PP reported in the Marennes-Oléron Bay (Struski and Bacher, 2006).
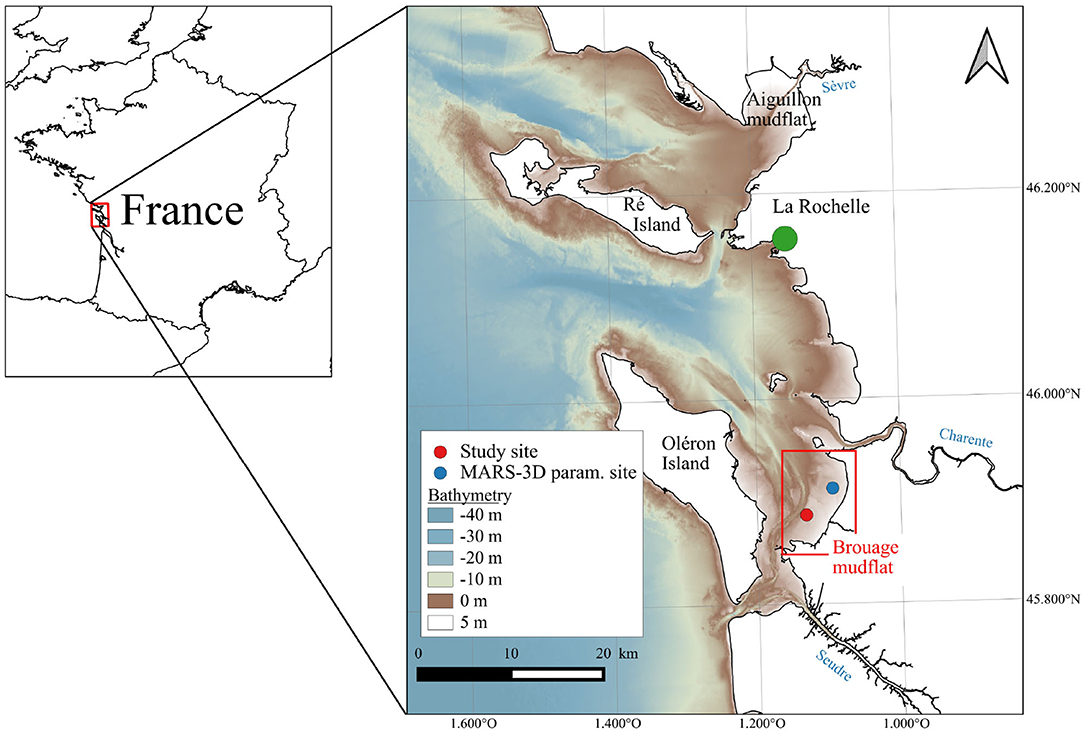
Figure 1. Bathymetry of the model domain covering the Pertuis Charentais Sea (source: SHOM).
Field campaigns were conducted during spring and daytime low tides on 5–6 May and 2–3 July 2015. A total of 9 GPP estimates were derived from carbon fluxes at the air-sediment interface measured with benthic chambers. The CO2 concentration was measured in the chambers continuously over a period of 20 to 30 min using an infrared gas analyzer (IRGA). At the same time, incident photosynthetically active radiation (400 to 700 nm; PAR, μmol photons m−2 s−1) and temperature (°C) were measured (LS-C planar sensor plugged to a ULM-500 data-logger, Walz, Effeltrich, Germany) at the sediment surface near the chambers at a 30-s frequency. The MPB biomass was estimated continuously (every 5–10 min) by sediment sampling of the upper 250 μm layer by the “crème brulée” method (Laviale et al., 2015). 43 biomass samples were taken from the sediment surface. The Chl a content of sediment was determined by reversed phase HPLC (Hitachi High Technologies Co., Japan) calibrated for Chl a. The Chl a concentration was normalized to the sampled surface (1.5 cm2) to be expressed in mg Chl a m−2. The sampling protocol is fully detailed in Méléder et al. (2020).
The MARS-3D model (3D hydrodynamical Model for Applications at Regional Scale) is a regional ocean model that simulates the ocean physics (Lazure and Dumas, 2008). In this study, we used the regional configuration set up for the Pertuis Charentais area, including the Brouage mudflat. The model was discretized into 100 m by 100 m horizontal grid cells and 20 sigma-levels over depth. The model was run for the same domain as in Polsenaere et al. (2017) (Figure 1). The MARS-3D model is fully detailed in Lazure and Dumas (2008). Atmospheric forcings (10 m winds, air temperature, atmospheric pressure at sea level, nebulosity fraction, relative humidity, and downwelling solar fluxes) were provided by the Meteo France AROME model (https://donneespubliques.meteofrance.fr). At the open boundaries of the numerical grid, the MARS-3D model was forced by tidal amplitudes and phases of 115 harmonic constituents from the cstFRANCE tidal model developed by the French marine service for hydrography and oceanography (SHOM; Simon and Gonella, 2007). Initial and boundary conditions of seawater temperature, salinity, current velocity, and sea surface height were derived from the MANGAE 2500 Ifremer model (Lazure et al., 2009).
The mud surface temperature model used in Savelli et al. (2018) was coupled to MARS-3D. Thermodynamic equations detailed in Savelli et al. (2018) simulated heat fluxes within a 1 cm deep sediment layer. No horizontal fluxes were considered. In their study, Savelli et al. (2018) successfully compared the simulated MST with 1 min MST data measured in situ on the Brouage mudflat. The differential equation of heat energy balance was solved by the MARS-3D numerical scheme. The MST model is fully detailed in Savelli et al. (2018).
The MPB model used in Savelli et al. (2018) was also coupled to MARS-3D. The MPB model simulated the MPB biomass in both the surface biofilm (S, mg Chl a m−2) and sediment first centimeter (F, mg Chl a m−2), and the grazer biomass (Peringia ulvae, Z, and mg C m−2) at the sediment surface. The MPB model accounted for vertical MPB migrations driven by diurnal and tidal cycles through exchanges of MPB biomass between S and F (Guarini et al., 2000). The P. ulvae growth was sustained by grazing on the MPB biofilm. It was controlled by the MST and MPB biomass in the biofilm. The biomass-specific photosynthetic rate Pb [mg C (mg Chl a)−1 h−1] was regulated by MST and PAR according to the models of Blanchard et al. (1996) and Platt and Jassby (1976), respectively. In the present study, the MPB biomass in the biofilm referred to the variable S* introduced by Savelli et al. (2018) that represented the S compartment that incorporated the S instantaneous production of biomass [mg Chl a m−2], which is directly transferred to F. The MPB model and differential equations are fully detailed in Savelli et al. (2018).
The physical-biological coupled model was initialized with a spin-up starting from 12 September 2014 00:00:00 UTC to 1 January 2015 00:00:00 UTC. The variables F, S, and Z were initially set to 100 mg Chl a m−2, 0 mg Chl a m−2 and 1,000 mg C m−2, respectively. The physical-biological coupled model was then run from 1 January 2015 00:00:00 UTC to 1 January 2016 00:00:00 UTC.
The MPB GPP algorithm developed by Méléder et al. (2020; GPP-algo) coupled Normalized Difference Vegetation Index data (NDVI; Tucker, 1979) derived from the SPOT and Pléiades satellite sensors with MARS-3D derived forcings. In the GPP-algo, the remotely sensed GPP was obtained by constraining with tidal heights, light levels and mud surface temperature simulated by MARS-3D the horizontal distribution of MPB biomass estimated from the NDVI data and modulated by MPB vertical migration. The photosynthetic rate of MPB in the GPP-algo [Pb, mg C (NDVI)−1 m−2 h−1] was estimated by the temperature and light-related production models of Blanchard et al. (1996) and Eilers and Peeters (1988) parameterized with photophysiological parameters fitted on the laboratory measured light curves (α the initial slope of the curve, Eopt the optimum irradiance for photosynthesis, and the photosynthetic capacity). The GPP-algo is fully detailed in Méléder et al. (2020).
We compared the MPB GPP remotely sensed and simulated by MARS-3D on satellite acquisition matching days in May and July 2015. We ran two model setups. In the first run, the maximum photosynthetic capacity [, mg C (mg Chl a)−1 h−1] was seasonally estimated by Blanchard et al. (1997; MARS-3Dseason run). In a second run, was set from in situ GPP measurements in May and July 2015 (MARS-3Dsynoptic run). was estimated from the measured biomass-specific production rate Pb [mg C (mg Chl a)−1 h−1], light, and MST from which we retrieved values of with the models of Blanchard et al. (1996) and Platt and Jassby (1976) parameterized with photophysiological parameters (β the shape parameter of the production-temperature relationship, Topt the temperature optimum for MPB photosynthesis, Tmax the maximum temperature for MPB photosynthesis and Ek the light saturation parameter) from Savelli et al. (2018). We iterated values of by a dichotomous analysis based on the intermediate value theorem (Bolzano, 1817). In MARS-3Dsynoptic, the MPB GPP was simulated in days matching the in situ measurements with MARS-3D parameterized with the mean value of iterated during in situ measurements in May and July 2015.
First, we took advantage of the MARS-3Dseason model to investigate the seasonal dynamics of MPB biomass and GPP (Figure 2). Second, we explored the spatial distribution of MPB biomass and GPP simulated by MARS-3Dseason (Figure 2). Then, we compared, in a single-point approach, and GPP extracted from the MARS-3Dseason and MARS-3Dsynoptic grid cell corresponding to the sampling site with in situ measurements and GPP-algo (Figure 2). Finally, we compared fields of MPB GPP obtained with MARS-3Dsynoptic and GPP-algo (Figure 2).
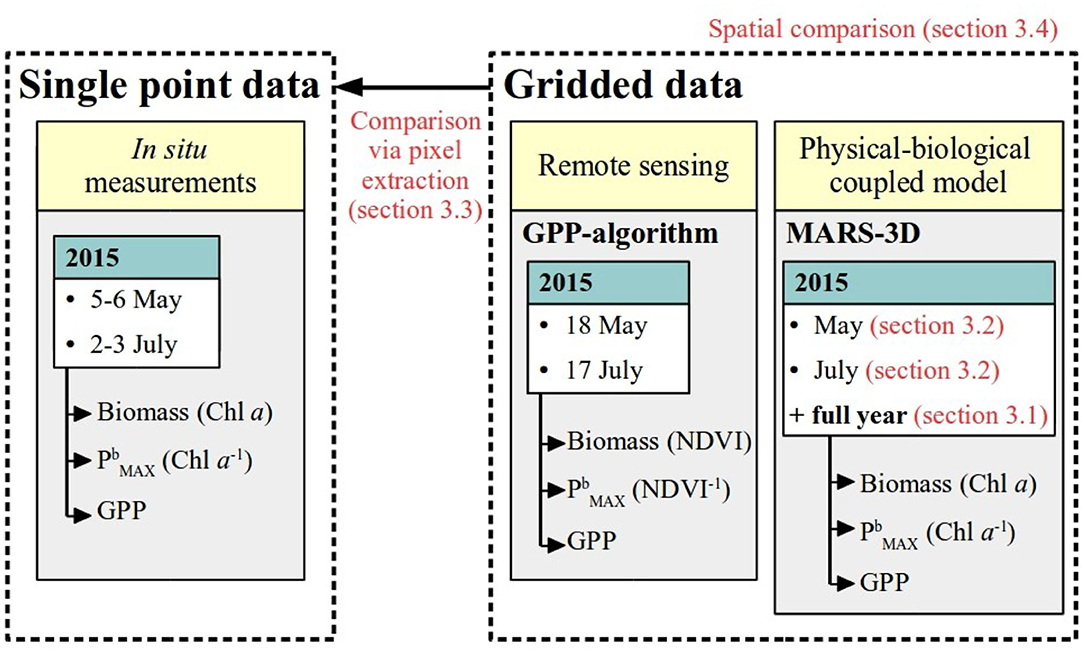
Figure 2. Methods for MPB GPP estimation used in this study.
PAR and MST data simulated by MARS-3D were validated with in situ MST and PAR data at the study site (Figures 3A,B). In May, the simulated PAR (1404.9 ± 101.3 μmol photons m−2 s−1) was significantly different than the measured PAR (1514.7 ± 532.4 μmol photons m−2 s−1; Mann–Whitney test, p < 0.01; Figure 3A). In July, the simulated PAR (1195.1 ± 305 μmol photons m−2 s−1) was not significantly different from the measured PAR (1230 ± 306 μmol photons m−2 s−1; Mann–Whitney test, p = 0.04). With respect to MST, with 20.7 ± 0.6°C in May, the simulated MST was significantly different than the MST measurements (19.5 ± 1.8°C; Mann–Whitney test, p < 0.01). In July, the simulated MST (31.2 ± 5°C) was not significantly different from the measured one (31.4 ± 3.4°C; Mann–Whitney test, p = 0.1; Figure 3B).
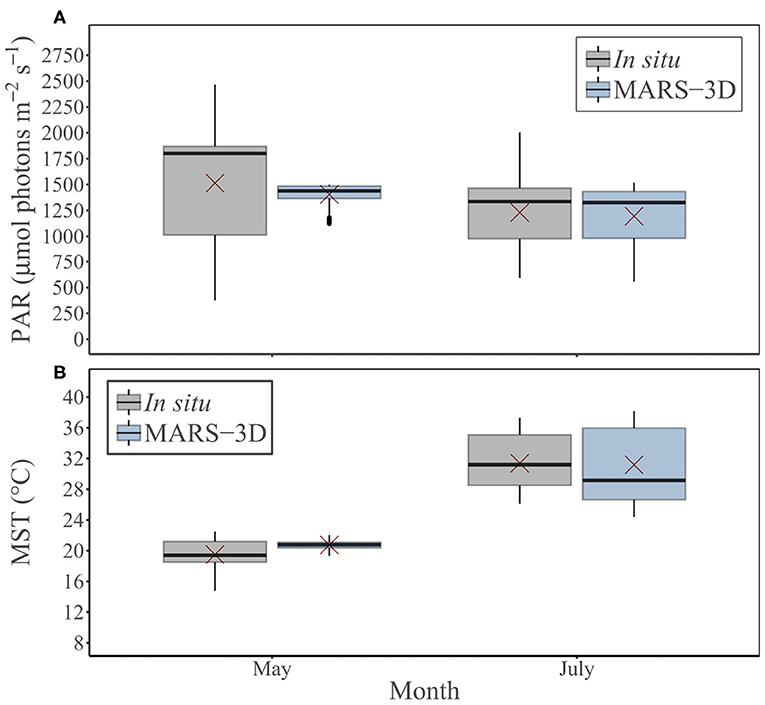
Figure 3. Measured and simulated (A) PAR (μmol photons m−2 s−1) and (B) MST (°C) by MARS-3D during in situ sampling days in May and July 2015. Red crosses correspond the mean value of PAR and MST for the corresponding period.
In the MARS-3Dseason run, the MPB biomass simulated in the sediment 1st cm reached one seasonal maximum on 25 February and 30 December with ~190 mg Chl a m−2 in 2015 (Figure 4A). The seasonal minimum of MPB biomass simulated in the sediment occurred on 22 August with 34.2 mg Chl a m−2 (Figure 4A). The MPB biomass in the biofilm simulated in the MARS-3Dseason run was 20.6 ± 11.25 mg Chl a m−2 at the study site and varied from 0 to 44.3 mg Chl a m−2 (Figure 4B). The mean hourly GPP during daytime emersion simulated in the MARS-3Dseason run was 71.3 ± 65.4 mg C m−2 h−1 (Figure 4C and Table 1). Similarly to MPB biomass simulated in the biofilm, it was highly variable ranging from 0 to 278.8 mg C m−2 h−1 and often reached GPP levels similar to those measured in May and July 2015 (Figure 4C). The mean daily GPP simulated in the MARS-3Dseason run at the study site was 359.9 ± 229.5 mg C m−2 d−1 (Table 1). Such simulated GPP rates resulted in an annual GPP at the study site of 131 g C m−2 yr−1 (Table 1).
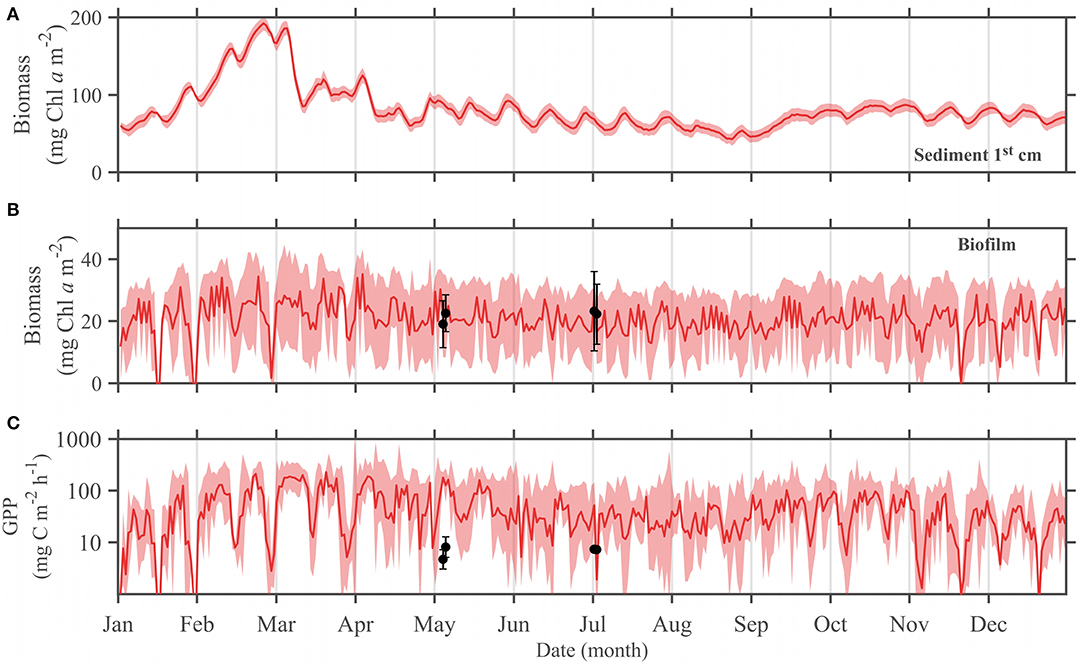
Figure 4. Simulated mean seasonal cycle (MARS-3Dseason run) of the 2015 (A) daily mean MPB biomass in the sediment 1st cm, (B) daily mean MPB biomass in the biofilm (mg Chl a m−2) and (C) hourly GPP (mg C m−2 h−1; log scale) averaged during daytime low tides at the sampling site. The bold line is the temporal mean over the respective periods and shaded areas correspond to the temporal standard deviation. Black dots and error bars correspond to the mean and standard deviation of the Chl a (mg Chl a m−2) and GPP measured in situ.
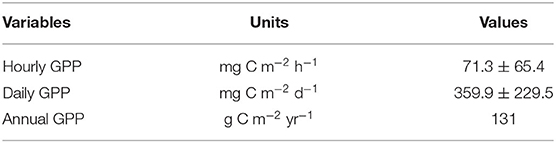
Table 1. Simulated GPP estimates (MARS-3Dseason run) at the sampling site in 2015.
The MPB biomass in the biofilm simulated in MARS-3Dseason on satellite acquisition matching days in May 2015 was ~40 and 35 mg Chl a m−2 on the upper and lower shore, respectively (Figure 5A). The MPB biomass simulated in the biofilm on satellite acquisition matching days in July 2015 was relatively homogeneous over the mudflat and was lower than in May 2015 with ~25 and 20 mg Chl a m−2 (Figure 5B). In May 2015, the hourly GPP simulated in the MARS-3Dseason run on satellite acquisition matching days was relatively homogeneous over the mudflat with values of 130 mg C m−2 h−1 (Figure 6A). In July 2015, the hourly GPP simulated in the MARS-3Dseason run on satellite acquisition matching days was higher on the southern part of the mudflat (~ 40 mg C m−2 h−1) than on the northern part (~ 20 mg C m−2 h−1; Figure 6B). In May 2015, the daily integrated GPP simulated in MARS-3Dseason was higher on the upper shore (~900 mg C m−2 d−1) than on the lower shore (~700 mg C m−2 d−1; Figure 6C). Integrated over the mudflat, GPP simulated in MARS-3Dseason during satellite acquisition matching day in May 2015 was 19.5 t C (Figure 6C). In July 2015, similarly to the hourly GPP, the daily GPP simulated in the MARS-3Dseason run on satellite acquisition matching days was higher on the southern part of the mudflat (~ 250 mg C m−2 d−1) than on the northern part (~ 100 mg C m−2 d−1; (Figure 6C). It represented 3.8 t C, once integrated over the mudflat (Figure 6D).
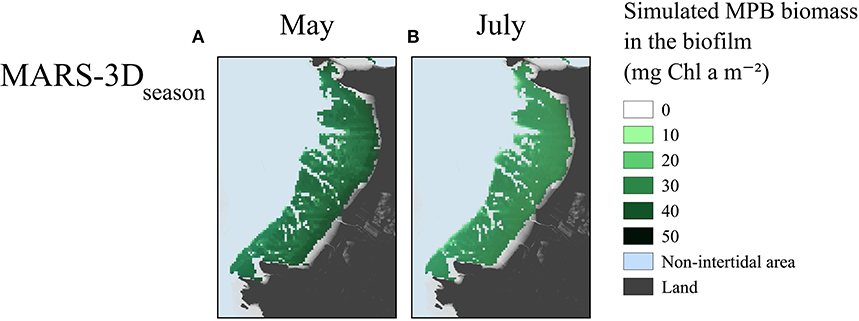
Figure 5. Maximum MPB biomass simulated in the biofilm (mg Chl a m−2) on satellite acquisition matching days in (A) May and (B) July 2015.
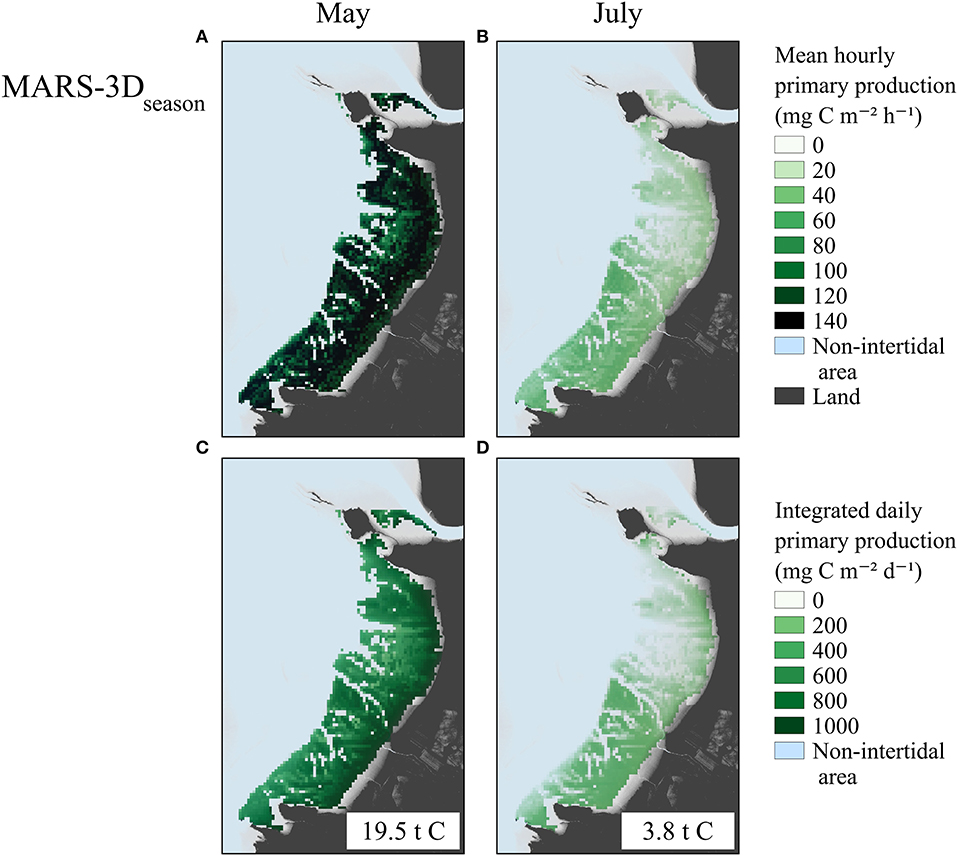
Figure 6. Mean hourly (mg C m−2 h−1) and daily integrated (mg C m−2 d−1) GPP simulated in the MARS-3Dseason run on satellite acquisition matching days in May (A,C) and July 2015 (B,D). Values indicated in white frames in (C,D) correspond to the GPP spatially integrated over the mudflat in t C.
retrieved from iterations on in situ measurements was in average 0.26 ± 0.11 and 0.67 ± 0.30 mg C (mg Chl a)−1 h−1 in May and July 2015, respectively (Figure 7A and Table 2). In the MARS-3Dseason run, was ~9.4 and 6.4 mg C (mg Chl a)−1 h−1 in days matching the in situ measurements in May and July 2015, respectively (Figure 7A and Table 2). It was hence 36- and 9-fold higher than retrieved from in situ measurements in May and July 2015, respectively (Figure 7A and Table 2). In the MARS-3Dseason run, the MPB biomass simulated in the biofilm during the field campaign was on average 21.7 ± 12.5 and 21.1 ± 9.5 mg Chl a m−2 in May and July 2015, respectively (Figure 7B). It was not significantly different than the measured MPB biomass in the biofilm in May and July 2015 (Mann–Whitney test: p = 0.31 and 0.95, respectively; Figure 7B). The simulated GPP in the MARS-3Dseason run in days matching the in situ measurements (164.8 ± 66.7 mg C m−2 h−1) was on average 29- to 40-fold higher than the measured (5.69 ± 3.22 mg C m−2 h−1) and remotely sensed (4.13 ± 2.22 mg C m−2 h−1) GPP in May 2015, respectively (Mann–Whitney test: p < 0.01; Figure 7C and Table 2). In July 2015, GPP simulated in the MARS-3Dseason run (41.3 ± 43.6 mg C m−2 h−1) was significantly different than in situ (6.3 ± 0.3 mg C m−2 h−1) and remotely sensed GPP (2.2 ± 1.4 mg C m−2 h−1; Mann–Whitney test: p < 0.01; Figure 7C and Table 2).
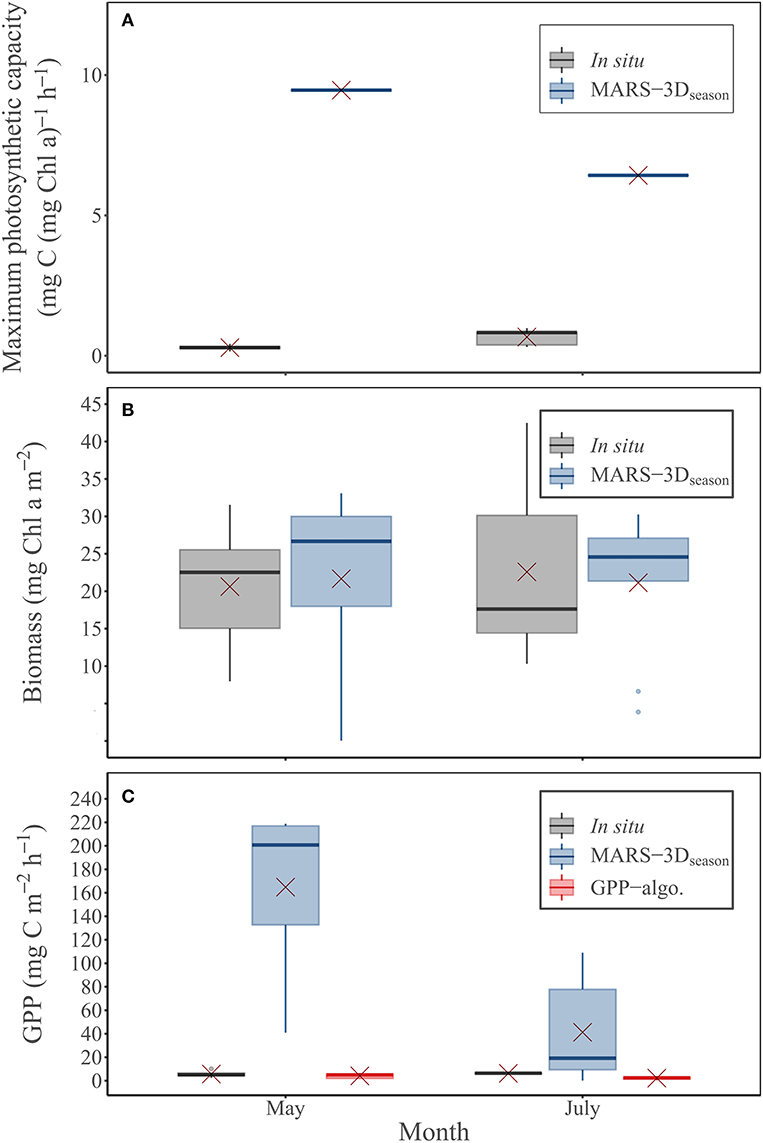
Figure 7. Measured and simulated (MARS-3Dseason run) (A) maximum photosynthetic capacity (, mg C (mg Chl a)−1 h−1) and (B) MPB biomass in the biofilm (mg Chl a m−2) during in situ sampling days in May and July 2015. (C) MPB GPP (mg C m−2 h−1) measured and predicted by the MARS-3Dseason run and the GPP-algo during in situ sampling days in May and July 2015. Red crosses correspond the mean value of PAR and MST for the corresponding period.
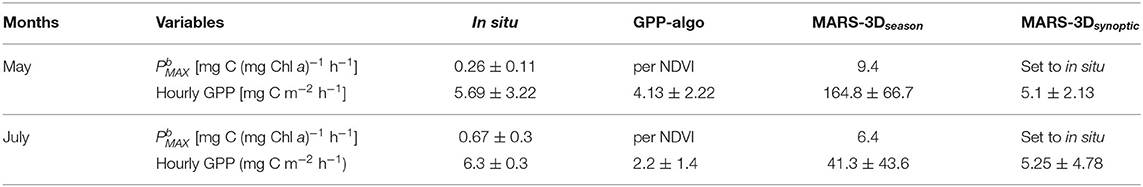
Table 2. Measured and simulated maximum photosynthetic capacity () and hourly GPP in May and July 2015.
In the MARS-3Dsynoptic run, i.e., with a mean based on in situ measurements in May and July 2015 (0.26 ± 0.11 and 0.67 ± 0.30 mg C (mg Chl a)−1 h−1, respectively; Figure 8A), the MPB biomass simulated in the biofilm was consistent with the estimates measured in situ (Mann–Whitney test: p = 0.6 and 0.62, respectively; Figure 8B). The mean MPB biomass simulated in the MARS-3Dsynoptic run on in situ sampling days in May 2015 was 17.8 ± 9.9 mg Chl a m−2 (Figure 8B). In July 2015, it was 17.3 ± 9.9 mg Chl a m−2 (Figure 8B). In the MARS-3Dsynoptic run, the simulated GPP compared to GPP measured in situ and derived from GPP-algo on in situ sampling days. With values of 5.1 ± 2.13 mg C m−2 h−1 in May 2015, GPP simulated in the MARS-3Dsynoptic run was not significantly different than GPP measured in situ and derived from GPP-algo (Mann–Whitney test: p = 0.9 and 0.5; Figure 8C and Table 2). In July 2015, GPP simulated in the MARS-3Dsynoptic run (5.25 ± 4.78 mg C m−2 h−1) was not significantly different than GPP measured in situ and derived from GPP-algo (Mann–Whitney test: p = 0.6 and 0.08, respectively in July 2015; Figure 8C and Table 2).
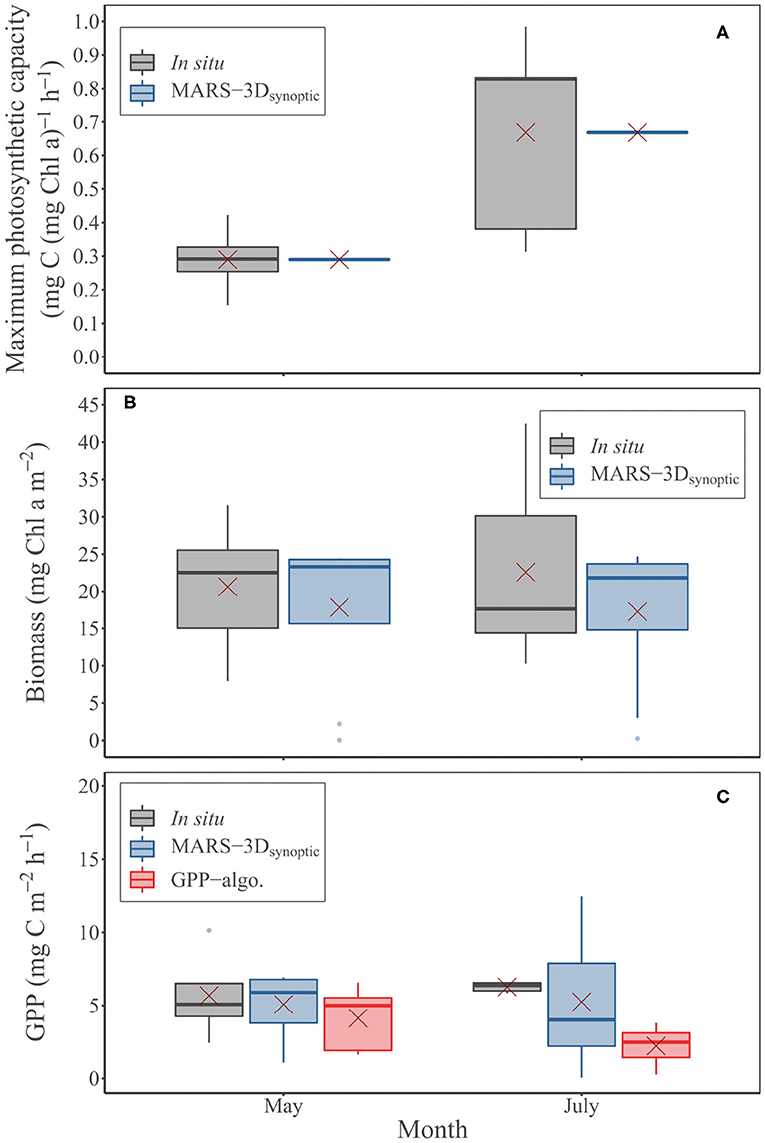
Figure 8. Measured and simulated (MARS-3Dsynoptic run) (A) maximum photosynthetic capacity (, mg C (mg Chl a)−1 h−1) and (B) MPB biomass in the biofilm (mg Chl a m−2) during in situ sampling days in May and July 2015. (C) MPB GPP (mg C m−2 h−1) measured and predicted by the MARS-3Dsynoptic run and GPP-algo during in situ sampling days in May and July 2015. Red crosses correspond the mean value of PAR and MST for the corresponding period.
The parametrization of in the MARS-3Dsynoptic run resulted in much lower simulated GPP values over the whole mudflat on satellite acquisition matching days in May and July 2015 than in the MARS-3Dseason run (Figure 9). In May 2015, the daily integrated GPP simulated in MARS-3Dsynoptic was homogeneous over the mudflat reaching value of ~22 mg C m−2 d−1 (Figure 9A). Integrated over the whole mudflat, GPP was 0.54 t C in the MARS-3Dsynoptic run. In July 2015, the daily integrated GPP simulated in the MARS-3Dsynoptic run was higher on the upper shore (~24 mg C m−2 d−1) than on the lower shore (~15 mg C m−2 d−1; Figure 9B). It resulted in a simulated spatially integrated GPP of 0.40 t C in the MARS-3Dsynoptic run (Figure 9A).
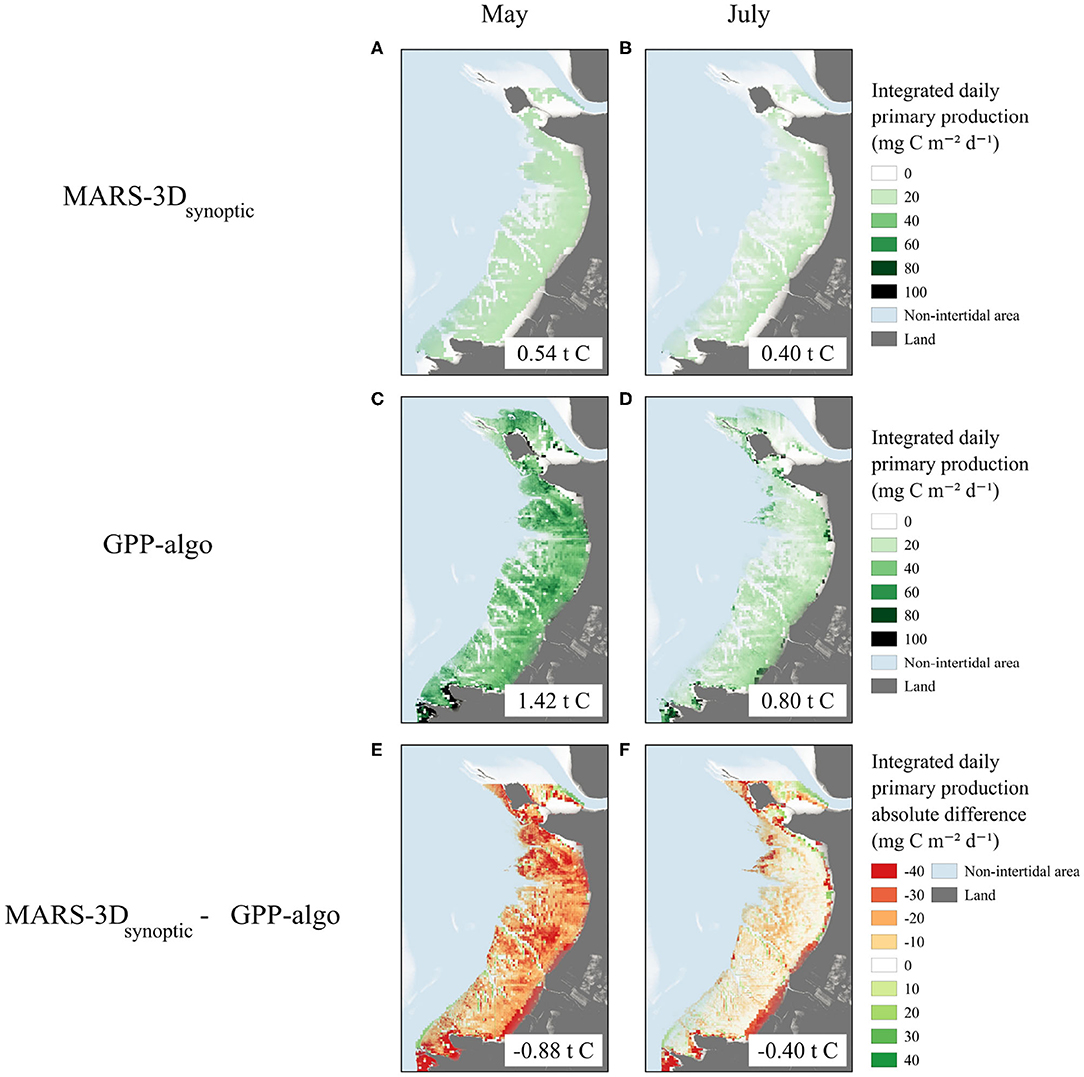
Figure 9. Daily integrated GPP (mg C m−2 d−1) (A,B) simulated in the MARS-3Dsynoptic run on satellite acquisition matching days, (C,D) computed with the GPP-algo developed by Méléder et al. (2020), and (E,F) absolute differences of daily integrated GPP between MARS-3Dsynoptic and GPP-algo in May and July 2015. Values indicated in white frames correspond to the GPP spatially integrated over the mudflat in t C.
Compared to the remotely sensed GPP data, the use of based on synoptic field data in the MARS-3Dsynoptic run resulted into slightly lower daily integrated GPP simulated over the mudflat in May 2015 (−21.2 ± 58.2 mg C m−2 d−1; Figure 9E). Integrated over the mudflat, the simulated GPP decreased by 0.88 t C compared to the remotely sensed GPP estimate (Figure 9E). Aside from the extreme upper shore of the southern part of the mudflat where MARS-3D did not simulate MPB, the GPP differences were particularly high on patches in the central and northern part of the mudflat with differences up to 40 mg C m−2 d−1 in May 2015 (Figure 9E). The GPP differences between the MARS-3Dsynoptic run and the GPP-algo were lower in July 2015 than in May 2015. The mean GPP difference was −3.82 ± 15.7 mg C m−2 d−1 in July 2015 (Figure 9F). The MARS-3Dsynoptic/GPP-algo difference of mudflat-integrated GPP in July 2015 was −0.40 t C (Figure 9F). The high temporal variability of impeded therefore a convergence of its estimation between the modeling and space remote sensing approach. Consequently, it was a very sensitive parameter in the model as it mediated strong differences in GPP estimates between the MARS-3Dsynoptic and MARS-3Dseason runs.
The GPP simulated in the MARS-3Dseason run model is much higher than GPP measured in situ. Over the mudflat, the GPP simulated in the MARS-3Dseason run is also higher than the GPP derived from the GPP-algo developed by Méléder et al. (2020) for the whole mudflat. However, both the model (MARS-3Dseason) and the remote sensing algorithm provide hourly and daily GPP rates in the range of GPP values reported in the literature (Cahoon, 1999; Underwood and Kromkamp, 1999; Daggers et al., 2018).
Given that the MARS-3D model is constrained by simulated water height and meteorological parameters, it is sensitive to likely inaccuracies in the forcings that might impede the model to resolve the high temporal variability of the physical environment. Nevertheless, simulated PAR and MST data lie within the range of in situ measurements and the impact of such inaccuracies on GPP estimates may be limited. As the MPB biomass simulated in the biofilm in the MARS-3Dseason run is also consistent with in situ measurements, the MARS-3Dseason run-observations GPP discrepancies can be attributed to differences in the MPB maximum photosynthetic capacity () used in the MARS-3Dseason run and estimated in the field in May and July 2015 at the study site. When set up with comparable to the measured values, the GPP simulated in the MARS-3Dsynoptic run better compared to in situ GPP measurements. This suggests that, at the mudflat scale, MPB GPP estimates derived from remote sensing and the model are sensitive to the MPB photophysiological parameters ( but also the other temperature and light-related photosynthesis parameters such as the temperature optimum and maximum for MPB photosynthesis, the shape parameter of the production-temperature relationship and the light saturation parameter) and their spatio-temporal variability.
The GPP-algo developed by Méléder et al. (2020) is parameterized with synoptic measurements of the photosynthetic activity and the related photophysiological parameters ( and also the optimal irradiance for photosynthesis and the initial slope of the production-irradiance relationship) of MPB cells collected during the field campaigns. It is therefore well-suited to depict the high temporal variability of the MPB photosynthetic response to the physical environment. However, GPP estimates from space remote sensing are restricted to the satellite data availability, which depends on the satellite revisit time, the cloud cover and the time window of acquisition during the day (Daggers et al., 2018; Méléder et al., 2020). Despite this limitation, remote sensing GPP algorithms are relevant to estimate MPB GPP at the synoptic time scale (Daggers et al., 2018; Méléder et al., 2020).
When parameterized with synoptic in situ estimate of , the MARS-3D model simulates GPP values that also compare to the in situ estimates. However, such a parametrization does only apply to a specific location at a specific time. Despite GPP simulated in MARS-3Dseason on in situ sampling days depart from measured GPP, daily and annual GPP simulated at the study site in 2015 (359.9 ± 229.5 mg C m−2 d−1 and 131 g C m−2 yr−1, respectively) are consistent with the literature (Cahoon, 1999; Underwood and Kromkamp, 1999; Savelli et al., 2018, 2019). Annual MPB GPP estimates can be obtained from extrapolation of daily GPP (3.65 to 93.99 g C m−2 yr−1; Méléder et al., 2020) derived from GPP-algo. However, the high MPB GPP variability at the hourly scale makes such extrapolations to be considered with caution. In contrast, the relatively consistent GPP values simulated at high frequency (12 s time step) in MARS-3Dseason over a year are likely to be used with more confidence for estimating GPP at the seasonal scale. The MPB model used in this study is adapted from the 1D model developed and validated in Savelli et al. (2018), which reasonably simulates the MPB dynamics in the Brouage mudflat for the year 2008. Similarly to Savelli et al. (2018), the seasonal cycle of MPB biomass simulated at the study site in 2015 is characterized by a spring bloom, a summer depression and a fall bloom. The fair agreement between the MPB biomass in the biofilm simulated in MARS-3D with the time-coincident observations suggests that overall the model simulates with some confidence the MPB dynamics at the seasonal scale in 2015.
MPB GPP estimates derived from remote sensing algorithms and physical-biological coupled models depend on the photophysiological parameters values and as such, on their sampling location on the mudflat. On a sandflat of the Bay of Paranaguá (Brazil), Fonseca et al. (2008) measured with benthic chambers higher PP rates in the upper and middle shores (1.9–2.1 g C m−2 d−1 and 1.3–2.2 g C m−2 d−1, respectively) than in the lower shore (0.24–0.27 g C m−2 d−1). Cook et al. (2004) measured CO2 fluxes at the air-sediment interface at two tidal levels of a mudflat located in Tasmania. The uptake of inorganic carbon (total CO2) at the benthic interface was higher on the upper shore (up to 15,000 μmol m−2 h−1) than on the lower shore (up to 6,000 μmol m−2 h−1), suggesting a higher benthic GPP on the upper shore than on the lower shore. On the Brouage mudflat, the relatively low GPP over the whole area depicted by the GPP-algo (Méléder et al., 2020) may be the result of a parametrization of the algorithm based on photophysiological parameters estimated on potentially low-productive MPB cells collected on the lower shore. Conversely, the photophysiological parameters used in the MARS-3D parameterization were derived from MPB cells collected on the middle shore of the Brouage mudflat (Figure 1; Blanchard et al., 1997). Consequently, when applied to the entire mudflat, such a parametrization may result in a GPP overestimation, especially on the lower shore as suggested by the MARS-3Dseason-in situ measurements mismatch reported in the lower shore. Such a model-data mismatch is reduced in the MARS-3Dsynoptic run when the MARS-3D model is parameterized using MPB photophysiological parameters estimated on mud samples gathered on the lower Brouage shore.
Remote sensing algorithms and physical-biological coupled model GPP estimates rely on the photosynthetically active MPB biomass at the mud surface. While the remote sensing algorithm uses NDVI data, the MARS-3D model uses Chl a concentration simulated in the biofilm to infer on the horizontal distribution of MPB biomass at the mud surface. NDVI data provide a synoptic view of the MPB activity for a given time. Combining these NDVI snapshots over time (i.e., a diurnal cycle) requires us to account for the MPB vertical migration scheme during daytime low tides. Daggers et al. (2018) introduced the MPB vertical migrations in their remote sensing algorithm by modulating the PP rate during the first hour of the daytime emersion period. In their algorithm (GPP-algo), Méléder et al. (2020) assumed that the MPB biomass detected by satellite corresponds to the fully-established biofilm during the daytime low tide (total photosynthetically active biomass). Méléder et al. (2020) considered therefore a progressive establishment of the total photosynthetically active biomass at the sediment surface. In the MARS-3D model, the MPB biomass simulated in the biofilm follows the MPB vertical scheme described by Guarini et al. (2000). MPB cells migrate upward from the lower 1st cm sediment to the sediment surface during daytime low tides. At nightfall or at the time the flood begins, MPB cells migrate back downward. As the MPB biomass simulated in the biofilm in the MARS-3D model compares to the time-coincident field measurements, the model can resolve with some confidence the temporal variability of the MPB biomass in the biofilm. However, no gridded data of benthic Chl a are available to assess the ability of the MARS-3D model to resolve the spatial variability of the MPB biomass in the biofilm. In the MARS-3D model (MARS-3Dseason), the MPB biomass simulated in the biofilm is slightly higher on the upper shore than on the lower shore on satellite acquisition matching days. However, the time-coincident NDVI data suggest a higher MPB biomass on the lower and middle shores than on the upper shore (Méléder et al., 2020). Comparing the MARS-3D model (Chl a) and GPP-algo (NDVI) is difficult as the NDVI-Chl a relationship is not linear, especially at high values of Chl a (Méléder et al., 2003a,b; Serôdio et al., 2009). The remote sensing of the MPB biomass in Chl a units from hyperspectral imaging might overcome the MPB biomass units mismatch (Kazemipour et al., 2012; Launeau et al., 2018).
The horizontal resolution of satellite data and 3D regional models is also a critical issue when estimating GPP of patchy-distributed MPB. Méléder et al. (2020) report high differences in the NDVI signal between in situ and satellite observations and between different satellite sensors due to the dilution of the NDVI signal with the increasing pixel size and the patchiness distribution of the biofilm (Saburova et al., 1995; Spilmont et al., 2011). As the horizontal resolution of the MARS-3D model (100 m) and the remote sensing algorithm developed by Méléder et al. (2020) (from 2 to 6 m) differs, confronting quantitatively remotely sensed and simulated GPP per unit of surface must be considered with caution. The high horizontal resolution of remote sensing data is appropriate to monitor the MPB patchiness, which is not the case of the MARS-3D model. For this reason, remotely sensed GPP estimates are more suitable for comparison with synoptic in situ measurements.
This study is a first attempt to simulate the 3D MPB dynamics at the scale of an entire intertidal mudflat. Combined with a novel space remote sensing approach to assess MPB GPP, it allows for a first comparison of MPB GPP estimates derived from a remote sensing algorithm (GPP-algo) and a regional 3D physical-biological coupled model. The remote sensing algorithm provides a very synoptic view of the mudflat GPP. It is well-suited to achieve diagnostic estimates of MPB GPP at the synoptic spatial and temporal scale. By contrast, the 3D physical-biological model provides a more dynamic representation of the MPB activity as well as prognostic estimates of MPB GPP over the mudflat. It is very relevant to resolve the seasonal and inter-annual dynamics of MPB. Furthermore, the coupling of the intertidal and pelagic domains in the regional 3D model could be envisaged in the future to assess the fate in the coastal ocean of fresh organic carbon resulting from MPB GPP. However, a refinement of its horizontal numerical mesh is required to resolve the MPB patchiness and to allow a better comparison with high resolution remote sensing data in the future. With respect to remote sensing, GPP algorithms are still limited by the too low spectral resolution of the multispectral (3–10 bands) satellite sensors and by the data availability. Hyperspectral remote sensing is able to capture photosynthetic capabilities and GPP, as recently proposed for terrestrial vegetation (DuBois et al., 2018; Lees et al., 2018). This approach starts to be develop successfully on MPB by Méléder et al. (2018). Furthermore, airborne hyperspectral data (hundreds of bands) could complement space satellite remote sensing data in an era of remote sensing drone aircraft democratization (Launeau et al., 2018). The start-up of the Deutsches Zentrum für Luft- und Raumfahrt Earth Sensing Imaging Spectrometer (DESIS) on-board of the International Space Station could also enable the development of Earth Observation algorithms based on hyperspectral images from space. Confronting GPP derived from remote sensing algorithms and 3D physical-biological models will require a better convergence in terms of equations structure, biological constants parameterization, and source data used (i.e., NDVI vs. Chl a). Such a convergence would provide very complementary tools for diagnostic and prognostic analyses of the MPB GPP evolution at mudflat scales. While space remote sensing algorithms may provide a more realistic view of the MPB dynamics at the mudflat scale, 3D coupled physical-biological models can fill the gap left by space remote sensing strongly impacted at these latitudes by cloud cover, hence allowing for an annual budget of MPB GPP. Consequently, remote sensing algorithms and 3D coupled physical-biological models can be combined to monitor in an operational way MPB GPP from the synoptic to the annual scale and to achieve annual MPB GPP budget for large intertidal mudflats. Such a convergence was acclaimed in Babin et al. (2015) for phytoplankton in remote environments, whereas, for mudflats, remote sensing is pivotal for PP monitoring. Such an achievement will however require spatial and temporal surveys of the MPB photophysiological parameters across tidal heights in order to better assess the MPB photosynthetic response in time and space and better parameterize the remote sensing algorithms and models. Assessing the photosynthetic response of MPB to its highly variable environment is a challenge for the coming years in a perspective of quantifying MPB PP over large productive mudflats from a synoptic to inter-annual time scale.
Several chapters of RS.'s PhD thesis will use the model presented in this study. As a consequence, the model data presented in this study were archived in a ZENODO repository (https://zenodo.org/record/4022383), which will be available after an embargo period corresponding to the completion of this PhD thesis (December 2020).
RS, VM, VL, PC, PP, CD, and JL set the conceptual framework of this study. RS, PC, VL, and PP coupled the MPB model to MARS-3D. VM, RS, AB, PP, and JL carried out the experiments. RS, AB, and JL analyzed the data. RS wrote the manuscript. RS, VM, VL, PC, PP, CD, JL, and AB reviewed the manuscript. All authors contributed to the final version of the manuscript.
This work was supported by (i) the DYCOFEL project, funded through the 2015 Fondation de France call Quels littoraux pour demain?; (ii) the MIMOSA project, funded through the 2018 CNRS EC2CO-LEFE call; (iii) the HYPEDDY project, funded through the 2018–2020 Tosca-CNES call; (iv) the BIO-Tide project, funded through the 2015–2016 BiodivERsA COFUND call for research proposals, with the national funders BelSPO, FWO, ANR, and SNSF; (v) the public funds received in the framework of GEOSUD, a project (ANR-10-EQPX-20) of the program Investissements d'Avenir, managed by the French National Research Agency; and (vi) the projects Littoral 1 and ECONAT funded by the Contrat de Plan Etat-Région (CPER) and the CNRS and the European Regional Development Fund. Pléiades and SPOT images were acquired by CNES's ISIS program, facilitating scientific access to imagery. Pléiades CNES 2015, 2018, Distribution Airbus DS, all rights reserved. Commercial uses forbidden. This research was part of fulfillment of the requirements for a Ph.D. degree (RS) at the Université de La Rochelle, France. RS was supported by a Ph.D. fellowship from the French Ministry of Higher Education, Research and Innovation.
The authors declare that the research was conducted in the absence of any commercial or financial relationships that could be construed as a potential conflict of interest.
The authors acknowledge Meteo France for providing meteorological data and the Institut National de l'Information Géographique et Forestière (IGN) and the Service Hydrographique et Océanographique de la Marine (SHOM) for providing the digital elevation model of Charente Maritime LITTO3D®. The authors acknowledge the Pôle de Calcul et de Données Marines (PCDM) for providing DATARMOR storage, data access and computational resources.
Admiraal, W. (1984). The ecology of estuarine sediment inhabiting diatoms. Prog. Phycol. Res. 3, 269–314.
Babin, M., Bélanger, S., Ellingsen, I., Forest, A., Le Fouest, V., Lacour, T., et al. (2015). Estimation of primary production in the Arctic Ocean using ocean colour remote sensing and coupled physical-biological models: strengths, limitations and how they compare. Prog. Oceanog. 139, 197–220. doi: 10.1016/j.pocean.2015.08.008
Benyoucef, I., Blandin, E., Lerouxel, A., Jesus, B., Rosa, P., Méléder, V., et al. (2014). Microphytobenthos interannual variations in a north-European estuary (Loire estuary, France) detected by visible-infrared multispectral remote sensing. Estuar. Coast. Shelf Sci. 136, 43–52. doi: 10.1016/j.ecss.2013.11.007
Blanchard, G. F., Guarini, J.-M., Gros, P., and Richard, P. (1997). Seasonal effect on the relationship between the photosynthetic capacity of intertidal microphytobenthos and temperature. J. Phycol. 33, 723–728. doi: 10.1111/j.0022-3646.1997.00723.x
Blanchard, G. F., Guarini, J.-M., Richard, P., Gros, P., and Mornet, F. (1996). Quantifying the short-term temperature effect on light- saturated photosynthesis of intertidal microphytobenthos. Mar. Ecol. Prog. Ser. 134, 309–313. doi: 10.3354/meps134309
Bocher, P., Piersma, T., Dekinga, A., Kraan, C., Yates, M. G., Guyot, T., et al. (2007). Site-and species-specific distribution patterns of molluscs at five intertidal soft-sediment areas in northwest Europe during a single winter. Mar. Biol. 151, 577–594. doi: 10.1007/s00227-006-0500-4
Bolzano, B. (1817). Analytischer Beweis des Lehrsatzes, daß zwischen je zwey Werthen, die ein entgegensetztes Resultat gew ähren, wenigstens eine reelle Wurzel der Gleichung liege. Gedruckt bei Gottlieb Haase.
Brito, A. C., Benyoucef, I., Jesus, B., Brotas, V., Gernez, P., Mendes, C. R., et al. (2013). Seasonality of microphytobenthos revealed by remote-sensing in a South European estuary. Continent. Shelf Res. 66, 83–91. doi: 10.1016/j.csr.2013.07.004
Cahoon, L. (1999). The role of benthic microalgae in neritic ecosystems. Oceanogr. Mar. Biol. 37, 47–86.
Cartaxana, P., Vieira, S., Ribeiro, L., Rocha, R. J., Cruz, S., Calado, R., et al. (2015). Effects of elevated temperature and CO 2 on intertidal microphytobenthos. BMC Ecol. 15:10. doi: 10.1186/s12898-015-0043-y
Combe, J.-P., Launeau, P., Carrère, V., Despan, D., Méléder, V., Barillé, L., et al. (2005). Mapping microphytobenthos biomass by non-linear inversion of visible-infrared hyperspectral images. Remote Sens. Environ. 98, 371–387. doi: 10.1016/j.rse.2005.07.010
Cook, P. L., Butler, E. C., and Eyre, B. D. (2004). Carbon and nitrogen cycling on intertidal mudflats of a temperate Australian estuary. I. Benthic metabolism. Mar. Ecol. Prog. Ser. 280, 25–38. doi: 10.3354/meps280025
Daggers, T. D., Kromkamp, J. C., Herman, P. M., and Van Der Wal, D. (2018). A model to assess microphytobenthic primary production in tidal systems using satellite remote sensing. Remote Sens. Environ. 211, 129–145. doi: 10.1016/j.rse.2018.03.037
DuBois, S., Desai, A. R., Singh, A., Serbin, S. P., Goulden, M. L., Baldocchi, D. D., et al. (2018). Using imaging spectroscopy to detect variation in terrestrial ecosystem productivity across a water-stressed landscape. Ecol. Appl. 28, 1313–1324. doi: 10.1002/eap.1733
Eilers, P., and Peeters, J. (1988). A model for the relationship between light intensity and the rate of photosynthesis in phytoplankton. Ecol. Modell. 42, 199–215. doi: 10.1016/0304-3800(88)90057-9
Fonseca, A., Brandini, N., da Costa Machado, E., and Brandini, F. P. (2008). Variação espacial e sazonal da produção primária microfitobêntica em uma planície entremarés subtropical, baía de paranaguá, paraná-Brasil. INSULA Rev. Bot. 37:19. doi: 10.5007/2178-4574.2008v37p19
Goulletquer, P. (1998). “Shellfish culture in France: present status and new approaches to optimise production,” in Proceedings of the Twenty-Ninth annual Shellfish Conference, 69–80. Available online at: https://archimer.ifremer.fr/doc/00000/3094/
Guarini, J.-M. (1998). Modélisation de la dynamique du microphytobenthos des vasieres intertidales du bassin de Marennes-Oléron. Effets des synchroniseurs physiques sur la régulation de la production (Ph.D. thesis). Université Pierre & Marie Curie, Paris.
Guarini, J.-M., Blanchard, G. F., Bacher, C., Gros, P., Riera, P., Richard, P., et al. (1998). Dynamics of spatial patterns of microphytobenthic biomass: inferences from a geostatistical analysis of two comprehensive surveys in Marennes-Oléron Bay (France). Mar. Ecol. Prog. Ser. 166, 131–141. doi: 10.3354/meps166131
Guarini, J.-M., Blanchard, G. F., Gros, P., Gouleau, D., and Bacher, C. (2000). Dynamic model of the short-term variability of microphytobenthic biomass on temperate intertidal mudflats. Mar. Ecol. Prog. Ser. 195, 291–303. doi: 10.3354/meps195291
Guarini, J.-M., Chauvaud, L., and Coston-Guarini, J. (2008). Can the intertidal benthic microalgal primary production account for the “Missing Carbon Sink”? J. Oceanogr. Res. Data 1, 12–19.
Herman, P. M. J., Middelburg, J. J., Widdows, J., Lucas, C. H., and Heip, C. H. R. (2000). Stable isotopes as trophic tracers: combining field sampling and manipulative labelling of food resources for macrobenthos. Mar. Ecol. Prog. Ser. 204, 79–92. doi: 10.3354/meps204079
Jardine, C. B., Bond, A. L., Davidson, P. J., Butler, R. W., and Kuwae, T. (2015). Biofilm consumption and variable diet composition of Western Sandpipers (Calidris mauri) during migratory stopover. PLoS ONE 10:e0124164. doi: 10.1371/journal.pone.0124164
Jobson, D. J., Zingmark, R. G., and Katzberg, S. J. (1980). Remote sensing of benthic microalgal biomass with a tower-mounted multispectral scanner. Remote Sens. Environ. 9, 351–362. doi: 10.1016/0034-4257(80)90039-5
Kang, C., Lee, Y., Eun, J. C., Shin, J., Seo, I., and Hong, J. (2006). Microphytobenthos seasonality determines growth and reproduction in intertidal bivalves. Mar. Ecol. Prog. Ser. 315, 113–127. doi: 10.3354/meps315113
Kazemipour, F., Launeau, P., and Méléder, V. (2012). Microphytobenthos biomass mapping using the optical model of diatom biofilms: application to hyperspectral images of bourgneuf bay. Remote Sens. Environ. 127, 1–13. doi: 10.1016/j.rse.2012.08.016
Krumme, U., Keuthen, H., Barletta, M., Saint-Paul, U., and Villwock, W. (2008). Resuspended intertidal microphytobenthos as major diet component of planktivorous Atlantic anchoveta Cetengraulis edentulus (Engraulidae) from equatorial mangrove creeks. Ecotropica 14, 121–128.
Kwon, B.-O., Koh, C.-H., Khim, J. S., Park, J., Kang, S.-G., and Hwang, J. H. (2014). The relationship between primary production of microphytobenthos and tidal cycle on the Hwaseong mudflat, west coast of Korea. J. Coast. Res. 30, 1188–1196. doi: 10.2112/JCOASTRES-D-11-00233.1
Launeau, P., Méléder, V., Verpoorter, C., Barillé, L., Kazemipour-Ricci, F., Giraud, M., et al. (2018). Microphytobenthos biomass and diversity mapping at different spatial scales with a hyperspectral optical model. Remote Sens. 10:716. doi: 10.3390/rs10050716
Laviale, M., Barnett, A., Ezequiel, J., Lepetit, B., Frankenbach, S., Méléder, V., et al. (2015). Response of intertidal benthic microalgal biofilms to a coupled light-temperature stress: evidence for latitudinal adaptation along the Atlantic coast of Southern Europe. Environ. Microbiol. 17, 3662–3677. doi: 10.1111/1462-2920.12728
Lazure, P., and Dumas, F. (2008). An external-internal mode coupling for a 3d hydrodynamical model for applications at regional scale (MARS). Adv. Water Resour. 31, 233–250. doi: 10.1016/j.advwatres.2007.06.010
Lazure, P., Garnier, V., Dumas, F., Herry, C., and Chifflet, M. (2009). Development of a hydrodynamic model of the bay of biscay. Validation of hydrology. Continent. Shelf Res. 29, 985–997. doi: 10.1016/j.csr.2008.12.017
Le Hir, P., Roberts, W., Cazaillet, O., Christie, M., Bassoullet, P., and Bacher, C. (2000). Characterization of intertidal flat hydrodynamics. Continent. Shelf Res. 20, 1433–1459. doi: 10.1016/S0278-4343(00)00031-5
Lees, K., Quaife, T., Artz, R., Khomik, M., and Clark, J. (2018). Potential for using remote sensing to estimate carbon fluxes across northern peatlands-a review. Sci. Tot. Environ. 615, 857–874. doi: 10.1016/j.scitotenv.2017.09.103
MacIntyre, H. L., Geider, R. J., and Miller, D. C. (1996). Microphytobenthos: the ecological role of the “secret garden” of unvegetated, shallow-water marine habitats. I. Distribution, abundance and primary production. Estuaries 19, 186–201. doi: 10.2307/1352224
Méléder, V., Barillé, L., Launeau, P., Carrere, V., and Rincé, Y. (2003b). Spectrometric constraint in analysis of benthic diatom biomass using monospecific cultures. Remote Sens. Environ. 88, 386–400. doi: 10.1016/j.rse.2003.08.009
Méléder, V., Jesus, B., Barnett, A., Barillé, L., and Lavaud, J. (2018). Microphytobenthos primary production estimated by hyperspectral reflectance. PLoS ONE 5:e0197093. doi: 10.1371/journal.pone.0197093
Méléder, V., Launeau, P., Barillé, L., and Rincé, Y. (2003a). Cartographie des peuplements du microphytobenthos par télédétection spatiale visible-infrarouge dans un écosystème conchylicole. Comptes Rendus Biologies 326, 377–389. doi: 10.1016/S1631-0691(03)00125-2
Méléder, V., Savelli, R., Barnett, A., Polsenaere, P., Gernez, P., Cugier, P., et al. (2020). Mapping the intertidal microphytobenthos gross primary production part I: coupling multispectral remote sensing and physical modeling. Front. Mar. Sci. 7:520. doi: 10.3389/fmars.2020.00520
Morris, E. P., and Kromkamp, J. C. (2003). Influence of temperature on the relationship between oxygen-and fluorescence-based estimates of photosynthetic parameters in a marine benthic diatom (Cylindrotheca closterium). Eur. J. Phycol. 38, 133–142. doi: 10.1080/0967026031000085832
Orvain, F., De Crignis, M., Guizien, K., Lefebvre, S., Mallet, C., Takahashi, E., et al. (2014a). Tidal and seasonal effects on the short-term temporal patterns of bacteria, microphytobenthos and exopolymers in natural intertidal biofilms (Brouage, France). J. Sea Res. 92, 6–18. doi: 10.1016/j.seares.2014.02.018
Orvain, F., Guizien, K., Lefebvre, S., Bréret, M., and Dupuy, C. (2014b). Relevance of macrozoobenthic grazers to understand the dynamic behaviour of sediment erodibility and microphytobenthos resuspension in sunny summer conditions. J. Sea Res. 92, 46–55. doi: 10.1016/j.seares.2014.03.004
Otani, S., and Endo, T. (2019). “Co2 flux in tidal flats and salt marshes,” in Blue Carbon in Shallow Coastal Ecosystems, eds T. Kuwae and M. Hori (Singapore: Springer), 223–250. doi: 10.1007/978-981-13-1295-3_8
Perissinotto, R., Nozais, C., Kibirige, I., and Anandraj, A. (2003). Planktonic food webs and benthic-pelagic coupling in three South African temporarily-open estuaries. Acta Oecol. 24(Suppl 1), S307–S316. doi: 10.1016/S1146-609X(03)00028-6
Platt, T., and Jassby, A. D. (1976). The relationship between photosynthesis and light for natural assemblages of coastal marine phytoplankton. J. Phycol. 12, 421–430. doi: 10.1111/j.1529-8817.1976.tb02866.x
Pniewski, F. F., Biskup, P., Bubak, I., Richard, P., Latała, A., and Blanchard, G. F. (2015). Photo-regulation in microphytobenthos from intertidal mudflats and non-tidal coastal shallows. Estuar. Coast. Shelf Sci. 152, 153–161. doi: 10.1016/j.ecss.2014.11.022
Polsenaere, P., Soletchnik, P., Le Moine, O., Gohin, F., Robert, S., Pépin, J.-F., et al. (2017). Potential environmental drivers of a regional blue mussel mass mortality event (winter of 2014, Breton sound, France). J. Sea Res. 123, 39–50. doi: 10.1016/j.seares.2017.03.005
Saburova, M. A., Polikarpov, I. G., and Burkovsky, I. V. (1995). Spatial structure of an intertidal sandflat microphytobenthic community as related to different spatial scales. Mar. Ecol. Prog. Ser. 129, 229–239. doi: 10.3354/meps129229
Sahan, E., Sabbe, K., Creach, V., Hernandez-Raquet, G., Vyverman, W., Stal, L. J., et al. (2007). Community structure and seasonal dynamics of diatom biofilms and associated grazers in intertidal mudflats. Aquat. Microb. Ecol. 47, 253–266. doi: 10.3354/ame047253
Saint-Béat, B., Dupuy, C., Bocher, P., Chalumeau, J., De Crignis, M., Fontaine, C., et al. (2013). Key features of intertidal food webs that support migratory shorebirds. PLoS ONE 8:e76739. doi: 10.1371/journal.pone.0076739
Salleh, S., and McMinn, A. (2011). The effects of temperature on the photosynthetic parameters and recovery of two temperate benthic microalgae, Amphora cf. Coffaeformis and Cocconeis cf. sublittoralis (bacillariophycae)1. J. Phycol. 47, 1413–1424. doi: 10.1111/j.1529-8817.2011.01079.x
Savelli, R., Bertin, X., Orvain, F., Gernez, P., Dale, A., Coulombier, T. et al. (2019). Impact of chronic and massive resuspension mechanisms on the microphytobenthos dynamics in a temperate intertidal mudflat. J. Geophys. Res. 124, 3752–3777. doi: 10.1029/2019JG005369
Savelli, R., Dupuy, C., Barillé, L., Lerouxel, A., Guizien, K., Philippe, A., et al. (2018). On biotic and abiotic drivers of the microphytobenthos seasonal cycle in a temperate intertidal mudflat: a modelling study. Biogeosciences 15, 7243–7271. doi: 10.5194/bg-15-7243-2018
Serôdio, J., Cartaxana, P., Coelho, H., and Vieira, S. (2009). Effects of chlorophyll fluorescence on the estimation of microphytobenthos biomass using spectral reflectance indices. Remote Sens. Environ. 113, 1760–1768. doi: 10.1016/j.rse.2009.04.003
Spilmont, N., Seuront, L., Meziane, T., and Welsh, D. T. (2011). There's more to the picture than meets the eye: sampling microphytobenthos in a heterogeneous environment. Estuar. Coast. Shelf Sci. 95, 470–476. doi: 10.1016/j.ecss.2011.10.021
Struski, C., and Bacher, C. (2006). Preliminary estimate of primary production by phytoplankton in Marennes-Oléron Bay, France. Estuar. Coast. Shelf Sci. 323–334. doi: 10.1016/j.ecss.2005.09.007
Tucker, C. J. (1979). Red and photographic infrared linear combinations for monitoring vegetation. Remote Sens. Environ. 8, 127–150. doi: 10.1016/0034-4257(79)90013-0
Ubertini, M., Lefebvre, S., Gangnery, A., Grangeré, K., Le Gendre, R., and Orvain, F. (2012). Spatial variability of benthic-pelagic coupling in an estuary ecosystem: consequences for microphytobenthos resuspension phenomenon. PLoS ONE 7:e44155. doi: 10.1371/journal.pone.0044155
Underwood, G. J. C. (2001). “Microphytobenthos,” in Encyclopedia of Ocean Sciences, ed J. H. Steele (Oxford: Academic Press), 1770–1777. doi: 10.1006/rwos.2001.0213
Underwood, G. J. C., and Kromkamp, J. C. (1999). “Primary production by phytoplankton and microphytobenthos in estuaries,” in Estuaries, Volume 29 of Advances in Ecological Research, eds D. Nedwell and D. Raffaelli (Academic Press), 93–153. doi: 10.1016/S0065-2504(08)60192-0
van der Wal, D., Wielemaker-van den Dool, A., and Herman, P. M. J. (2010). Spatial synchrony in intertidal benthic algal biomass in temperate coastal and estuarine ecosystems. Ecosystems 13, 338–351. doi: 10.1007/s10021-010-9322-9
Keywords: microphytobenthos, intertidal mudflat, gross primary production, remote sensing, physical-biological modeling
Citation: Savelli R, Méléder V, Cugier P, Polsenaere P, Dupuy C, Lavaud J, Barnett A and Le Fouest V (2020) Mapping the Intertidal Microphytobenthos Gross Primary Production, Part II: Merging Remote Sensing and Physical-Biological Coupled Modeling. Front. Mar. Sci. 7:521. doi: 10.3389/fmars.2020.00521
Received: 20 December 2019; Accepted: 08 June 2020;
Published: 09 October 2020.
Edited by:
Christian Grenz, UMR7294 Institut Méditerranéen d'océanographie (MIO), FranceReviewed by:
Vanda Brotas, University of Lisbon, PortugalCopyright © 2020 Savelli, Méléder, Cugier, Polsenaere, Dupuy, Lavaud, Barnett and Le Fouest. This is an open-access article distributed under the terms of the Creative Commons Attribution License (CC BY). The use, distribution or reproduction in other forums is permitted, provided the original author(s) and the copyright owner(s) are credited and that the original publication in this journal is cited, in accordance with accepted academic practice. No use, distribution or reproduction is permitted which does not comply with these terms.
*Correspondence: Raphaël Savelli, cmFwaGFlbC5zYXZlbGxpMUB1bml2LWxyLmZy
Disclaimer: All claims expressed in this article are solely those of the authors and do not necessarily represent those of their affiliated organizations, or those of the publisher, the editors and the reviewers. Any product that may be evaluated in this article or claim that may be made by its manufacturer is not guaranteed or endorsed by the publisher.
Research integrity at Frontiers
Learn more about the work of our research integrity team to safeguard the quality of each article we publish.