 Karina Scavo Lord1,2Kathryn C. Lesneski1,2
 Zachary A. Bengtsson1Kirsten M. Kuhn1,2Joshua Madin3Beatrice Cheung1,2Roseline Ewa2Jacob F. Taylor1,2Elizabeth M. Burmester1,4Joshua Morey5
 Les Kaufman1,2
 John R. Finnerty1,2*
- 1Department of Biology, Boston University, Boston, MA, United States
- 2Marine Program, Boston University, Boston, MA, United States
- 3Hawai’i Institute of Marine Biology, University of Hawai’i at Mânoa, Kaneohe, HI, United States
- 4Billion Oyster Project, New York, NY, United States
- 5Environmental Research Institute, University of Belize, Belmopan, BZ, United States
Half of coral species that occur on Caribbean reefs have also been reported living in mangroves. Given the vulnerability of corals living on reefs to environmental change, populations of the same species living in mangroves may prove critical to long-term survival of these coral species and the resilience of nearby reefs. To date, few studies have addressed the health and viability of mangrove coral populations, which is necessary if we are to understand their role in the broader meta-community. Here we present the first longitudinal study of the distribution, survival, growth, and recruitment of a mangrove coral population over multiple years. From 2014 to 2018, we fully censused a population of Porites divaricata along 640 meters of a mangrove-lined channel at Calabash Caye, Belize, and beginning in 2015, we tagged individual colonies for longitudinal monitoring. Year-to-year survivorship averaged 66.6% (±3.9 SE), and of the surviving colonies, on average, 72.7% (±2.5 SE) experienced net growth. The number of colonies, their spatial distribution, and population size-structure were essentially unchanged, except for an unusually high loss of larger colonies from 2016 to 2017, possibly the result of a local disturbance. However, each annual census revealed substantial turnover. For example, from 2016 to 2017, the loss or death of 72 colonies was offset by the addition of 89 recruits. Integral projection models (IPM) for two consecutive one-year intervals implicated recruitment and the persistence of large colonies as having the largest impacts on population growth. This 5-year study suggests that the P. divaricata population in the mangroves is viable, but may be routinely impacted by disturbances that cause the mortality of larger colonies. As many corals occur across a mosaic of habitat types, understanding the population dynamics and life-history variability of corals across habitats, and quantifying genetic exchange between habitats, will be critical to forecasting the fate of individual coral species and to maximizing the efficacy of coral restoration efforts.
Introduction
Throughout the tropics and subtropics, reef-building corals are in a precarious state of decline driven primarily by the direct and indirect impacts of climate change: increased sea surface temperatures and the coral epizootics they can promote, ocean acidification, aggravated cyclonic storms, and sea level rise (Aronson and Precht, 2001; Pandolfi et al., 2003, 2011; Van Hooidonk et al., 2016; Hughes et al., 2017). Given that climate change is not reversible in the short term, and there may be “insufficient time for substantial evolutionary responses,” such as the origin of novel adaptive phenotypes (Pandolfi et al., 2011), the immediate future of coral reefs will depend to a great extent on the existing capacity of corals to survive these environmental challenges (Vollmer and Palumbi, 2007). Resilience to the impacts of climate change varies within and between coral species, populations, and habitats (Oliver and Palumbi, 2011). Indeed, some habitats not normally regarded as “core habitat” for corals could be increasingly important to the survival of corals if they temper stressors that are more pronounced in typical reef environments or if they harbor particularly resilient individuals. Potential coral refugia or resilience reservoirs include areas of upwelling (Jimenez et al., 2001), mesophotic reefs (Bongaerts et al., 2010), high latitude reefs (Beger et al., 2014), and mangrove forests (Rogers and Herlan, 2012).
Mangroves have generally not been regarded as suitable habitat for corals due to high fluctuations of temperature and light, high turbidity, and high nutrient loads (Rogers and Herlan, 2012; Yates et al., 2014; Hernández-Fernández, 2015). However, coral assemblages comprising as few as two or as many as 34 species have been documented in mangrove habitats in the Atlantic, Pacific, and Indian Ocean basins (Rogers and Herlan, 2012; Hernández-Fernández, 2015; Camp et al., 2016; Bengtsson et al., 2019).
Increasing interest in the relationship between mangrove forests and coral populations is being motivated by the suggestion that mangroves may serve as either coral refugia (Yates et al., 2014) or as reservoirs of particularly stress-tolerant individuals (Camp et al., 2018a, b, 2016). For example, in Hurricane Hole, United States Virgin Islands, many decades-old corals found living in mangrove habitats in 2010–2012 had survived a bleaching event that caused mass mortality of the same species living on reefs in 2005–2006; at this site shading from the mangrove canopy was strongly associated with a reduction in bleaching (Yates et al., 2014). However, mangroves can also expose corals to greater environmental stress than reef habitats, such as lower pH and greater variations in temperature (Camp et al., 2016). Long term exposure to such seemingly detrimental environmental conditions has been shown to confer greater resistance to thermally induced bleaching in corals (Castillo and Helmuth, 2003; Oliver and Palumbi, 2011; Palumbi et al., 2014). It may therefore be the case that corals in the mangroves survive conditions that reef conspecifics cannot tolerate not because the mangrove is a refuge, but because they are adapted or acclimated to more stressful conditions (Yates et al., 2014; Camp et al., 2016).
If mangrove forests are to contribute significantly to coral survival, whether by serving as refugia or resilience reservoirs, coral populations in the mangroves must be self-sustaining and able to survive periods of high mortality in nearby reefs (Yates et al., 2014). Demonstrating this will require demographic studies on mangrove coral populations using cross-sectional (i.e., single timepoint) and/or longitudinal (i.e., over time) approaches. Cross-sectional studies on the size structure of mangrove coral populations can provide insights into the recent history of coral populations and predict future population trends (Bak and Meesters, 1998). Longitudinal monitoring of individual colonies in particular mangrove populations is much more labor intensive, but it provides direct evidence of coral viability over time including the degree of variation among individual colonies in growth and survival (Bak and Meesters, 1998; Vermeij and Bak, 2000; Meesters et al., 2001; Miller et al., 2016). Here, we describe results of a longitudinal study on a finger coral (Porites divaricata) occupying the prop roots of red mangroves (Rhizophora mangle) at Calabash Caye, Turneffe Atoll, Belize.
Three attributes of P. divaricata make it an ideal model system for understanding the importance of mangrove coral populations for the viability of Caribbean coral reefs during this period of rapid environmental change: (1) P. divaricata appears to be the most consistent member of mangrove coral assemblages in this region (Rogers and Herlan, 2012; Yates et al., 2014; Hernández-Fernández, 2015; Camp et al., 2016; Bengtsson et al., 2019), (2) it is a “weedy” coral whose abundance relative to historically dominant Caribbean corals appears to be increasing on the reef as these habitats become increasingly degraded (Darling et al., 2012, 2013), and (3) it plays an important role in past and present ecological succession on Caribbean reefs (Knowlton, 2001; Green et al., 2008; Darling et al., 2012). P. divaricata has been one of the dominant species at depths of 1 m or less in lee habitats (lagoonal and well-protected embayments) along the Belizean Barrier Reef since at least the 1980s (Aronson et al., 1998), perhaps because of its stress tolerance (Crook et al., 2012; Grottoli et al., 2014). This historical pattern of succession in disturbed environments and tolerance to anticipated stressors has led to the view that future reefs will be composed of corals capable of existing as small, patchy colonies with weedy life histories (like P. divaricata), which could entirely replace the major reef framework-builders (Crook et al., 2012). Therefore, the demographic dynamics of species like P. divaricata in these non-reefal habitats could be one key to the seeding and re-establishment of future coral reefs.
We employed both longitudinal and cross-sectional approaches to assess the population dynamics of a mangrove associated population of P. divaricata, tracking recruitment, growth, mortality, and size structure. Our data will allow us to infer whether the mangrove population was viable and to determine which size classes have the greatest impact on population viability.
Materials and Methods
Study Site
Our study was conducted at Calabash Caye on the eastern edge of Turneffe Atoll, approximately 33 km off the coast of Belize (Figure 1A). To the north of this main island, separated by a channel approximately 26 m wide at its narrowest point (Calabash Channel) is “Little Calabash.” We monitored coral colonies inhabiting the prop roots of red mangrove (Rhizophora mangle) fringing portions of Calabash Channel (17°17′12.88″N, 87°48′41.86″W) and a small creek leading from Calabash Channel to an interior lagoon in the center of Calabash Caye—we will refer to this creek as Calabash Creek (17°17′10.50″N, 87°48′44.94″W). No coral colonies were observed attached on the bottom substrate of the mangrove channel.
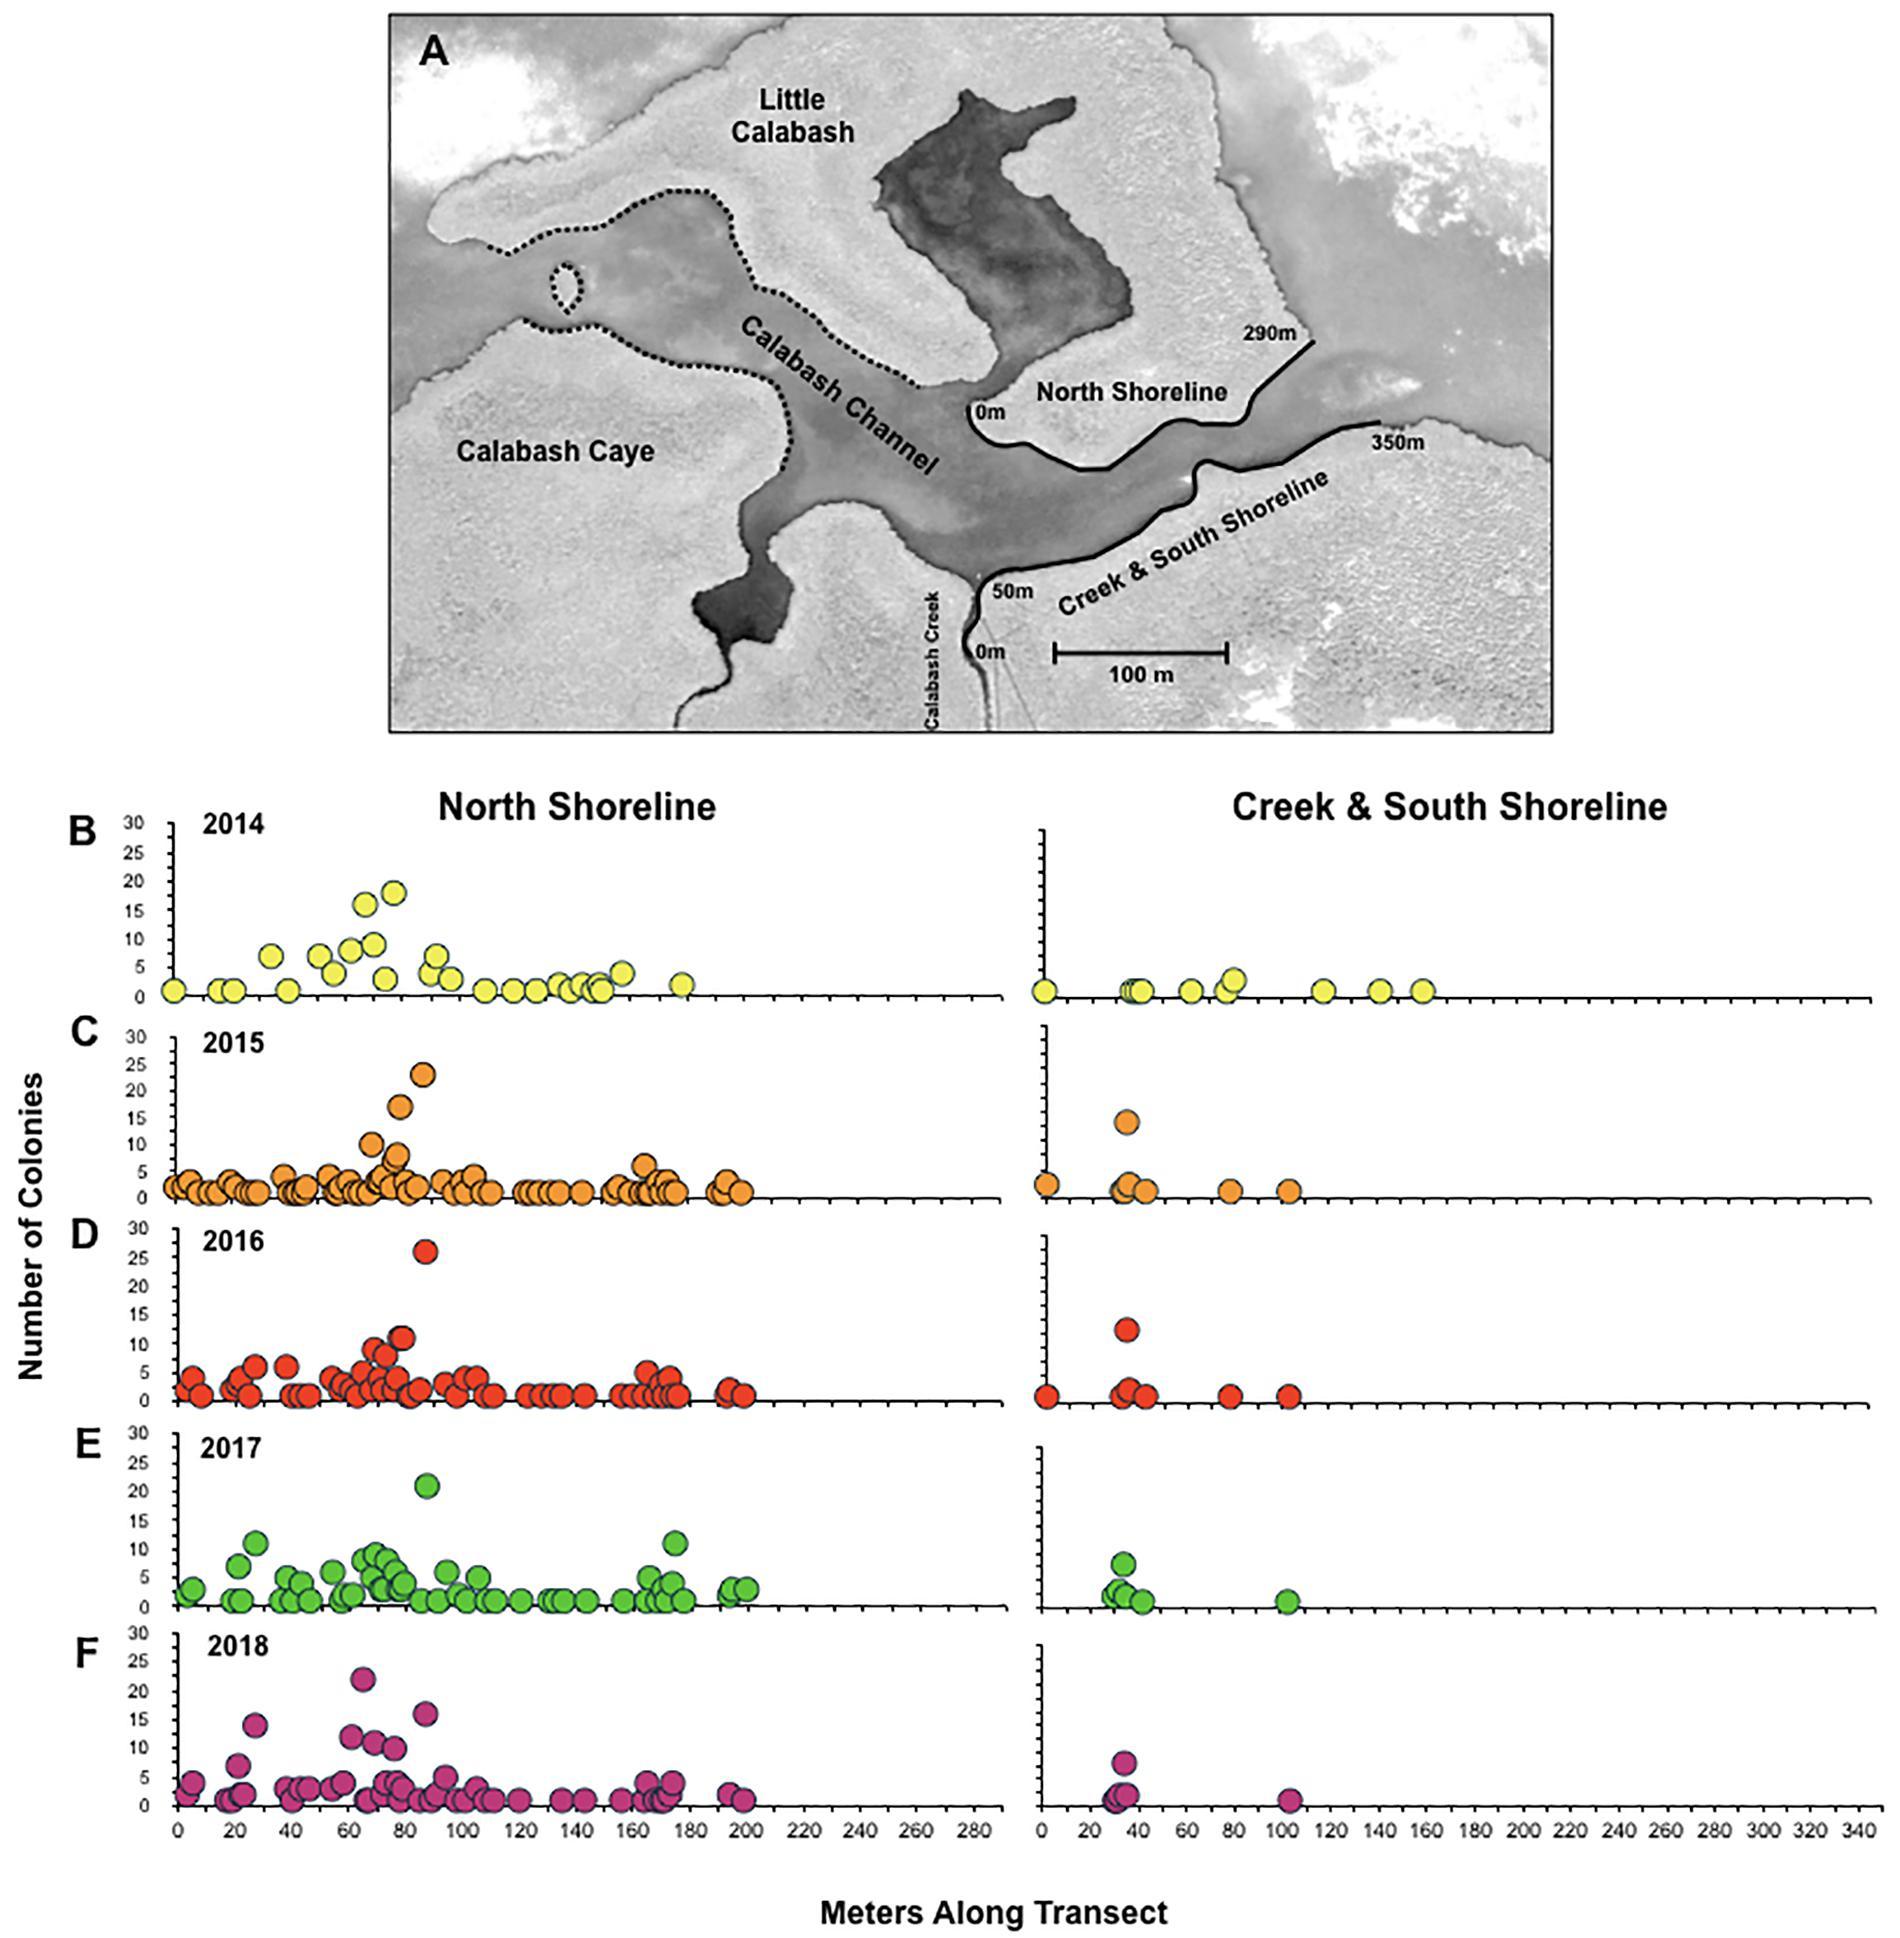
Figure 1. Coral abundance and geographic distribution. A map of particular locations within the study area is shown in panel (A). The black solid lines along the north (0–290 m), creek and south shorelines (0–350 m) represent the area surveyed for the study from 2014 to 2018. The black dashed lines represent the area surveyed for colonies for independent size data. The spatial distribution of individual coral colonies along the study locations is shown for 2014 (A), 2015 (B), 2016 (C), and 2017 (D). The number of colonies found at a particular location along the north shoreline and the south shoreline are shown for 2014 (B), 2015 (C), 2016 (D), 2017 (E), and 2018 (F). The map was obtained from Google Earth (image© 2017 DigitalGlobe).
Coral Monitoring and Demographic Data Collection
In November and December of 2014, we conducted an initial survey of three locations in Calabash Creek (Figure 1A): (1) a 290 m stretch of shoreline on the north side of the channel; (2) a 300 m stretch of shoreline on the south side of the channel; and (3) a 50 m stretch of shoreline along the eastern and western sides of Calabash Creek, on the south side of the channel. We captured high resolution photos of each colony, and from these photos, the species identity of each colony was confirmed by Dr. Ernesto Weil (University of Puerto Rico, Mayagüez), an expert on branching Porites in the Caribbean. For each colony, we used calipers to obtain field measurements of length, width, and height. From these linear dimensions, we calculated ecological volume as πHr2 where H is equal to colony height, and r is equal to (width + length)/4 (Shaish et al., 2006). For colonies that consisted of single branches, their volume was approximated as a cylinder (V = πr2h), with r = 0.5 × branch diameter and h = branch length. The number of branch tips was recorded for each colony.
In November and December of 2015, we tagged and recorded GPS coordinates of each individual coral colony identified during an exhaustive census of the same three stretches of shoreline in Calabash Channel described above. Each tagged colony was photographed and measured as described above. In November and December of 2016, 2017, and 2018, we revisited the three transects, and we tagged and recorded GPS coordinates of all new colonies that we observed. These new colonies were designated as “recruits.” All colonies were photographed and measured as described above, including those tagged in a previous year. We reported a colony as dead if there was no living tissue on the skeleton, if the colony was missing from the root, or if the portion of the root bearing the colony had broken off.
In addition to monitoring the tagged colonies along our three principal transects (Figure 1A), in 2017, we identified and measured 209 P. divaricata colonies inhabiting prop roots in the western section of Calabash Channel. As we have only one year’s data on these corals, we did not track their year-to-year growth and survival, and we did not include them directly in our population modeling. However, we did use data from these colonies to estimate the size structure of the entire population in order to calculate the recruitment parameter used in the integral projection models (IPM) (Supplementary Datasheet S1).
Population Size-Frequency Distributions
Size-frequency distributions were generated for the population in 2014, 2015, 2016, 2017, and 2018 using logarithmically transformed values for ecological volume (Bak and Meesters, 1998; Vermeij and Bak, 2000; Meesters et al., 2001; Miller et al., 2016). For each size-frequency distribution, we calculated the geometric mean and standard deviation, skewness (g1), and kurtosis (g2). The size distributions were compared across years using a 2-sample Kolmogorov-Smirnov test.
Modeling Growth and Survival as a Function of Size
Linear models were fit to estimates of ecological volume of colonies at one point in time as a function of ecological volume the year before using the “lm” function in the statistical software R (R Core Team., 2018). Period (2015–2016 or 2016–2017) was included as a co-factor, but was dropped from the model because it had no significant effect on growth.
Logistic regression models were used to model survival (0: dead, 1: alive) as a function of size using the “glm” function of R with a binomial error distribution (R Core Team., 2018). We included both volume and volume squared as fixed effects in order to capture both monotonic and quadratic effects of size (e.g., hump-shaped relationships). We also included census period as a factor (2015–2016 vs. 2016–2017). It was highly significant, indicating that the relationship between size and survival differed between periods. We therefore analyzed each period separately.
Population Modeling
For two time periods, 2015–2016 and 2016–2017, we developed IPM to relate the number of coral colonies n(y; t + 1) exhibiting size distribution y at time t + 1 to the number of coral colonies n(x; t) exhibiting size distribution x at time t (Easterling et al., 2000; Madin et al., 2012). The IPM “kernel” representing transitions from state x to state y incorporated colony survival (s), growth (g) and reproduction (r) as follows.
This approach has recently been used to model the demographics of other coral species (Bruno et al., 2011; Burgess, 2011; Madin et al., 2012; Elahi et al., 2016; Montero-Serra et al., 2017). Separate IPM were constructed using demographic data collected in 2015–2016 and 2016–2017 because the relationship between size and survival differed between these two census years (Supplementary Datasheet S2 and Table 2).
The survival function, s(x), relates the probability of surviving to time t+1 based on size x at time t as follows:
where b is the size-independent survival probability (with error, ε). The size-dependent survival probability derives from the logistic regression analysis described above, with coefficients m, n, and c estimated from the best fitting models based on empirical data. Ecological volume (cm3) was used to represent colony size, and all values were natural log-transformed before being incorporated in the model as previously suggested (Edmunds et al., 2014).
The growth function, g(x,y), describes the probability that an individual of size x at time t will grow to y at time t + 1. In both census periods, colony growth was modeled as y (size at t + 1) regressed against x (size at t) using a generalized least squares method to incorporate growth variance at different colony sizes into the model. We capture this probability using the normal probability function (see Madin et al., 2012 for details):
The recruitment function r(x,y) was used in place of the standard fecundity function because empirical data relating fecundity to colony size were not collected in this study. This recruitment function is commonly used in coral IPM studies when modeling a closed population where the number of recruits depends on the summed size of the individuals in the population (Madin et al., 2012; Edmunds et al., 2014).
We modeled the population as a closed system for several reasons. Geographically, the population in the mangrove-lined channel appears to be isolated. The nearest known reef population of P. divaricata is more than 1.5 km away (personal observation). While a thorough survey of nearby seagrass beds has not been conducted, we observed no P. divaricata inhabiting the seagrass beds adjacent to either the eastern or the western openings of the channel. Biologically, P. divaricata is a brooding coral, and recruitment in brooding corals is typically highly localized (Harrison and Wallace, 1990; Harii et al., 2002; Underwood et al., 2007; Jones et al., 2009), although some propagules can travel large distances (Underwood et al., 2007). Practically, modeling the population as a closed system allows us to assess the local dynamics within the mangrove environment provided that the population is no longer supported by recruitment from outside of the population (Madin et al., 2012; Edmunds et al., 2014). Like many colonial organisms, fecundity in P. divaricata is a function of colony size x, and therefore recruitment was modeled in the following way (Madin et al., 2012; Edmunds et al., 2014):
Where q is equal to the number of recruits that enter the population per unit colony volume. In modeling recruitment in this way, the number of individuals entering the population at t+1 was estimated to be a function of the size of all colonies in the population at time t (Hall and Hughes, 1996; Madin et al., 2012; Edmunds et al., 2014). These recruits are assumed to enter the population below the smallest size class observed, less than 0.02 cm3.
For each year, the survival, growth, and recruitment functions were combined according to Eq. 1 to create the model kernels. We used a 100 × 100 matrix for the kernel ranging from ∼1.3× the smallest observed colony volume (in natural log space) to 1.2× the largest observed colony to prevent individuals from being evicted from the model. We allowed for one recruitment size class that was >−4 (i.e., the natural log of the smallest size class, 0.02 cm3; see Eq. 4). To estimate q (recruits per unit colony volume), we used maximum log-likelihood to find the best match between the model’s stable size distribution (the dominant eigenvector) and the empirical size distribution from all tagged colonies, including the additional colonies outside of the population that were measured in 2017 (Supplementary Datasheet S1); the analysis was performed using the mle function from the stats4 package in R (R Core Team., 2018), and confint was used to calculate the 95% confidence intervals associated with q.
For both IPMs, we used a single estimate of q based upon the 2015–2016 sampling interval (q = 0.83 recruits per cm3 of colony volume; 95% confidence interval: 0.63 to 1.1). The recruitment parameter is sensitive to population size structure, and we obtained different estimates of q for 2015–2016 (0.83) and 2016–2017 (9.3). Biologically, there is no reason to suspect that the recruitment parameter would vary over 10-fold from year-to-year. We chose to use the smaller recruitment value (2015–2016 interval) in both IPMs because we believe that the 2015–2016 interval better represented the typical population size structure, i.e., with an approximately normal size distribution of colonies (Figure 2C).
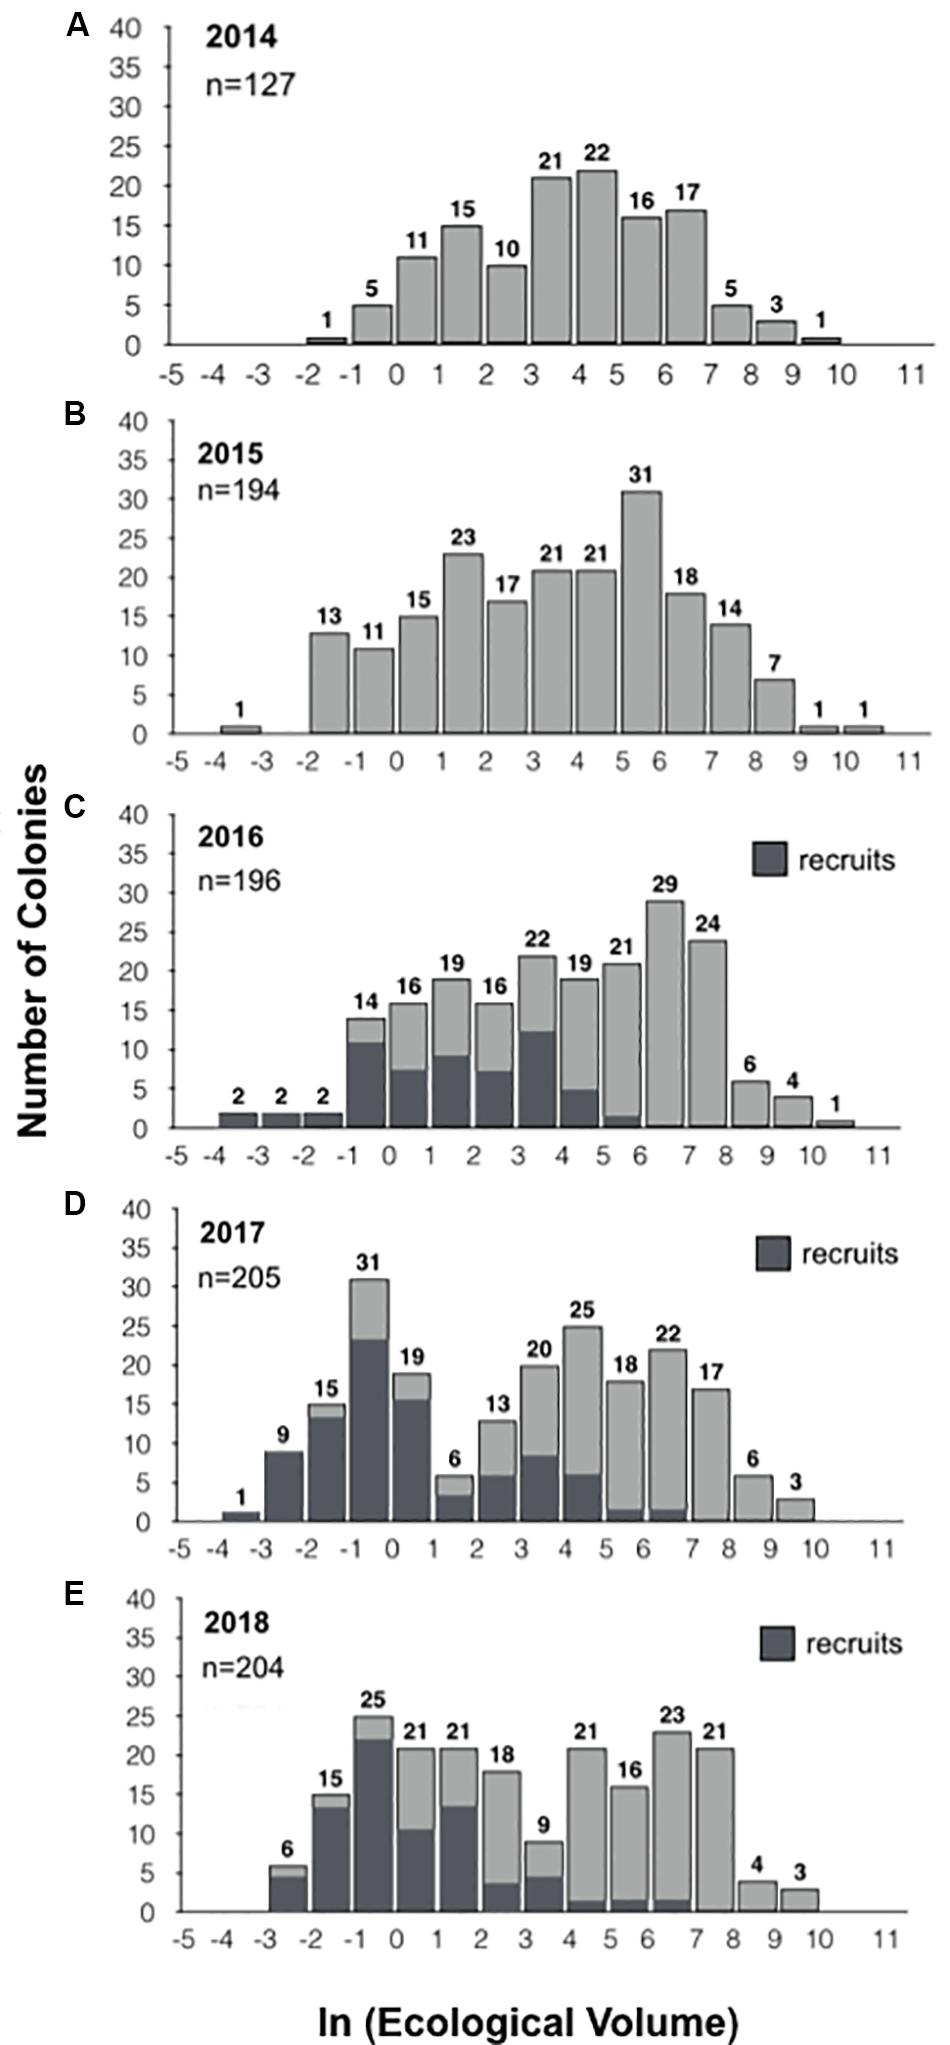
Figure 2. Population size frequency distributions. The size frequency distributions for the populations in 2014, 2015, 2016, 2017, and 2018 are displayed in panels (A–E), respectively. Colonies were binned by size based on the natural log of their ecological volume. The number of colonies is represented above each bar. New recruits identified from 2016 to 2018 are represented in dark gray (C–E). In 2018, we inadvertently neglected to measure a single individual, so while 204 colonies were found, size is provided for 203 individuals.
Based on the estimate of q, we then calculated the asymptotic growth rates or dominant eigenvalues (λ) and corresponding 95% confidence intervals. Additionally, we calculated the percentage of local recruitment necessary for the population to be self-sustaining (λ > 1) by lowering q until λ = 1. Sensitivity and elasticity analyses were also conducted on the model kernels in order to determine the relative contribution of colony sizes to the asymptotic growth rates (λ) using the sensitivity and elasticity function from the popbio package in R (Stubben and Milligan, 2007).
Resident and Recruit Distribution Analysis
To determine if new colonies (recruits) were spatially clustered in relation to established colonies (which would be expected if recruitment is highly localized), we compared the observed distances between recruits and established colonies to randomly generated distances. We used the “Generate Near Table” tool in ArcGISTM (Version 10.5, Esri Inc.) to determine the shortest distance between new colonies found in both 2016 and 2017 and the closest resident colony from the prior year. Resident colonies below 10 cm3 were not included in the analyses due to the low likelihood that they would have produced recruits in the respective time interval. We then used the “Create Random Points” tool in ArcGISTM to place randomly located “recruits” within the boundaries of the 2015 or 2016 resident colony distributions, while holding the number and locations of the resident colonies fixed. In 100 random trials for each of the two 1-year intervals, we matched the number of random points used in each trial to the number of recruits found in 2016 or 2017. The average nearest-neighbor distance between randomly located recruits and resident colonies from each trial over each year was calculated and compared to the actual distance between recruits and residents in 2016 and 2017, respectively.
Results
Coral Abundance and Geographic Distribution
Along the 690 m of shoreline surveyed for this study, the number of coral colonies identified through exhaustive censuses conducted in 2014 through 2018 was 127, 194, 196, 205, and 204, respectively. Based on the relative scarcity of small colonies discovered in 2014 (see below), we suspect that the low population count obtained during the study’s initial census was due to undercounting recruits that have not yet developed branches. Within the study site, the geographic distribution of coral colonies was essentially unchanged from year to year, despite substantial turnover in the population (Figure 1). For example, along the north shoreline of Calabash Channel, corals were most abundant in the same 50 m stretch (∼45–95 m; Figure 1D) and were completely absent near the eastern opening of the channel during all five annual censuses.
Population Size-Frequency Distributions
The size-frequency distributions (Figure 2) and their corresponding parameters (Table 1) reveal slight changes in the proportion of larger and smaller colonies, but no significant change in population size-structure from 2014–2016 to 2017–2018. However, the population size-structure in 2017 was significantly different than that observed in 2014–2016 (two-sample Kolmogorov-Smirnov test; Figure 2), and the population structure in 2018 differed from that observed in 2014 and 2016, but not 2015. The size-distribution in 2014 was approximately symmetric with a slightly negative skew, indicating a greater proportion of larger colonies (g1 = −0.198). It shifted slightly toward a more positive skew in 2015, indicating an increase in the number of smaller colonies (g1 = −0.166) (Figures 2A,B). This shift toward smaller colonies is reflected by a decrease in the geometric mean volume from 48.9 cm3 in 2014 (SD = 10.1) to 35.0 cm3 in 2015 (SD = 18.0). The higher proportion of smaller colonies is attributable mainly to the influx of new recruits (n = 67), and not to loss or shrinkage of large colonies (see below). In 2016, the distribution became more negatively skewed (g1 = −0.267), indicating that there was a slight increase in the proportion of larger colonies, but the population distribution was still approximately symmetric (Figure 2C). This geometric mean volume increased from 35.0 cm3 in 2015 to 58.4 cm3 in 2016 (SD = 18.9). In 2017, the skewness shifted in the positive direction (g1 = −0.025) due to the influx of recruits and the loss of larger individuals (Figure 2D). Mean volume decreased from 58.4 cm3 in 2016 to 20.3 cm3 in 2017 (SD = 26.5) (Table 1). In 2018, the skewness shifted even more in the positive direction (g1 = 0.057) with the loss of moderately sized individuals as well as the substantial influx of recruits (Figure 2E). Mean colony volume stayed relatively constant from 2017 averaging approximately 21.3 cm3 (SD = 23.8).
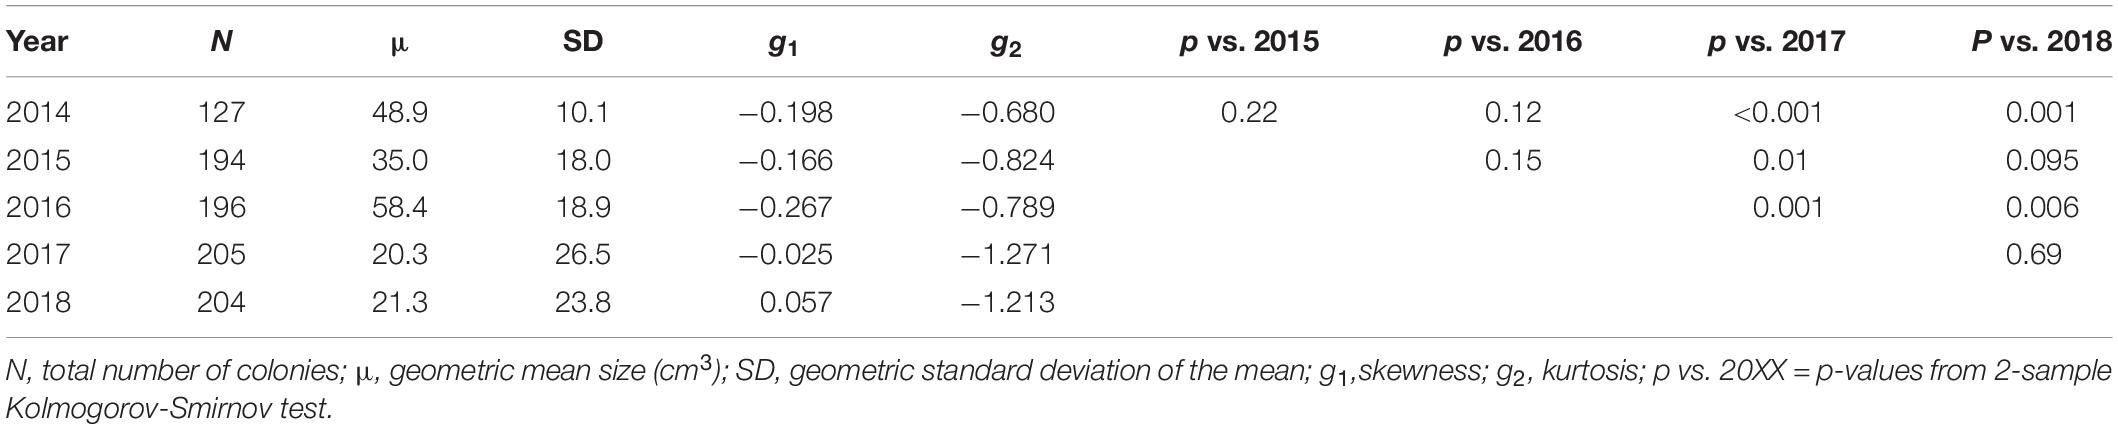
Table 1. Distribution parameters of the population size-frequency distributions.
Survival and Recruitment of Individual Colonies
In each of the three intervals from 2015 through 2018, we observed an increase in the population, ranging from 1.5 to 9.0% (Figure 3A). On average, two-thirds of the colonies survived from each year to the next, while the loss of the remaining colonies was exceeded by the addition of new recruits to the population in each year (Figure 3B). For example, from a baseline of 191 colonies in 2015, 142 (74%) survived to 2016, while 49 (26%) were recorded as dead or missing in 2016. Fifty-four new colonies, either not present or not found in 2015, were identified. As a class, these putative recruits represent the lower end of the size distribution for all of the colonies measured in the 2016 population, consistent with them being the youngest colonies in the population (Figure 2C)—the geometric mean size of these newly tagged colonies was 3.7 cm3 (SD = 8.8; range = 0.04–268.05 cm3) and the mean tip number was 1.4 (SD = 2.1; range = 0–9).
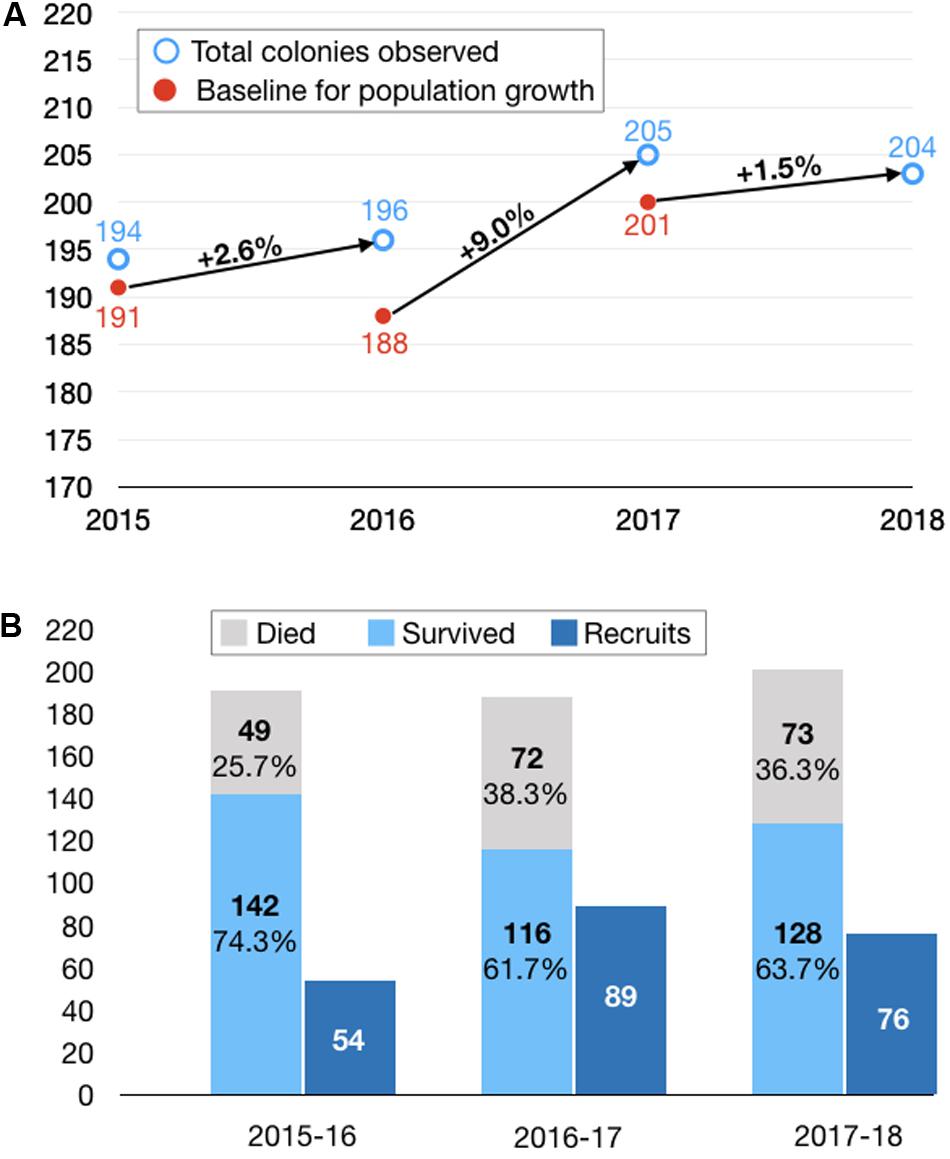
Figure 3. Net population change broken down by survival, mortality and recruitment. (A) Net population changes over three 1-year intervals. In calculating the percentage population changes, we adjusted the baseline at the start of each interval to eliminate colonies that were inadvertently dislodged from a root during the course of measuring them (n = 4) or small colonies that were suspected of merging with larger adjacent colonies and thus could not be counted in the subsequent population census (n = 11). This resulted in a downward adjustment of the baseline from 194 (open blue circle) to 191 (closed red circle) in 2015, from 196 to 188 in 2016, and from 205 to 200 in 2017. We did not calculate a population change from 2014 to 2015 because we could not ascribe the overall change in population to contributions from mortality and recruitment (because we did not tag individual colonies in 2014). Furthermore, we suspect we may have undercounted the recruits in the pilot year of the study. (B) Breakdown of population changes by survival and mortality of colonies present at the start of each interval and recruits identified at the end of each interval.
The cause of colony mortality was difficult to discern, but in a handful of cases, full or partial mortality could be associated with: (1) detachment of the colony from the mangrove root, (2) breakage or detachment of the mangrove root, or (3) overgrowth by competitors such as sponges and macroalgae (Figure 4). In 2017 and 2018, we documented the potential cause of mortality for all colonies that did not survive from 2016 (n = 72) and 2017 (n = 73). A majority of the colonies, 81.9% (n = 59) in 2017 and 94.5% (n = 69) in 2018, were documented as missing, because we found the tag but not the colony itself (which suggests that the colony became dislodged from the root), or we found neither the colony nor its tag (which suggests that the root itself became dislodged). In 16.7% (n = 12) of instances in 2017 and 4.1% (n = 3) in 2018, we found a dead but not completely overgrown colony attached to the root, and in one case (1.4%) in 2017 (1.4%) and 2018 (1.4%), the deceased coral was completely overgrown by sponges. Of note, the sponges that we observed overgrowing P. divaricata are mangrove-restricted species (Clathria venosa, Lissodendoryx isodictyalis; Figure 4), indicating that the biotic interactions of P. divaricata differ across the habitats where it occurs.
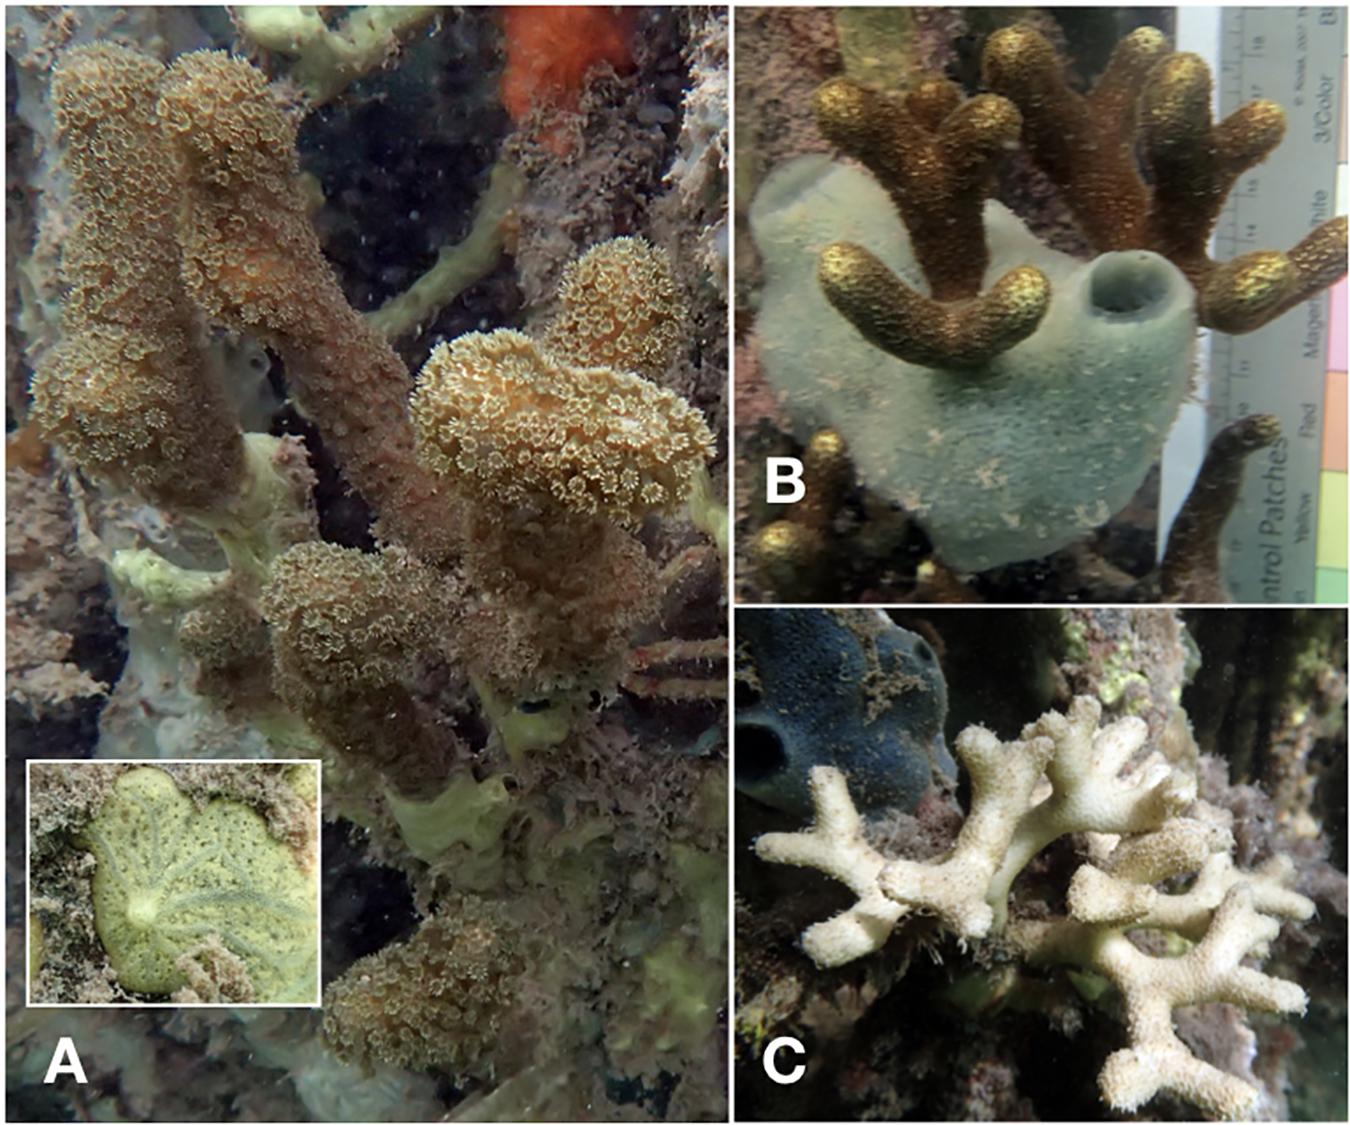
Figure 4. Representative colonies exhibiting partial or complete mortality. Overgrowth of P. divaricata by sponges (A,B). Based on the grayish canals, which radiate from the protruding oscules, the yellow sponge in panel (A) appears to be Clathria venosa Alcolado 1984 (Collin et al., 2005; Diaz and Rützler, 2009). This encrusting species has previously been recorded on mangroves prop roots in Belize, Cuba and Panama (Diaz and Rützler, 2009). The turquoise sponge in panel (B) is possibly Lissodendoryx isodictyalis, a shallow-water mangrove sponge that is known to overgrow Porites (Laubenfels, 1950; Rutzler et al., 2007). Further analyses (e.g., characterization of spicules and DNA sequences) will be required to confirm species identity. An apparently intact skeleton lacking any live coral tissue is shown in panel (C).
Growth of Individual Colonies
In each year from 2016 to 2018, the majority of colonies that survived the previous year experienced net growth. From 2016 to 2018, 77.5% (n = 110), 69% (n = 80), and 71.7% (n = 91) increased in volume, while 22.5% (n = 32), 31% (n = 36), and 28.3% (n = 36) decreased in volume or underwent partial mortality, respectively (Figure 5). The average change in ecological volume from 2016 to 2018 was 448.8 cm3 (SD = 1169.1), 197.4 cm3 (SD = 880.8), and 204.6 cm3 (SD = 1596.3), while the average change in tip number was 4.3 (SD = 10.6), 2.3 (SD = 9.7), and 3.0 (SD = 11.5), respectively. Representative photos of colonies that underwent net positive growth or partial mortality are shown in Figure 6.
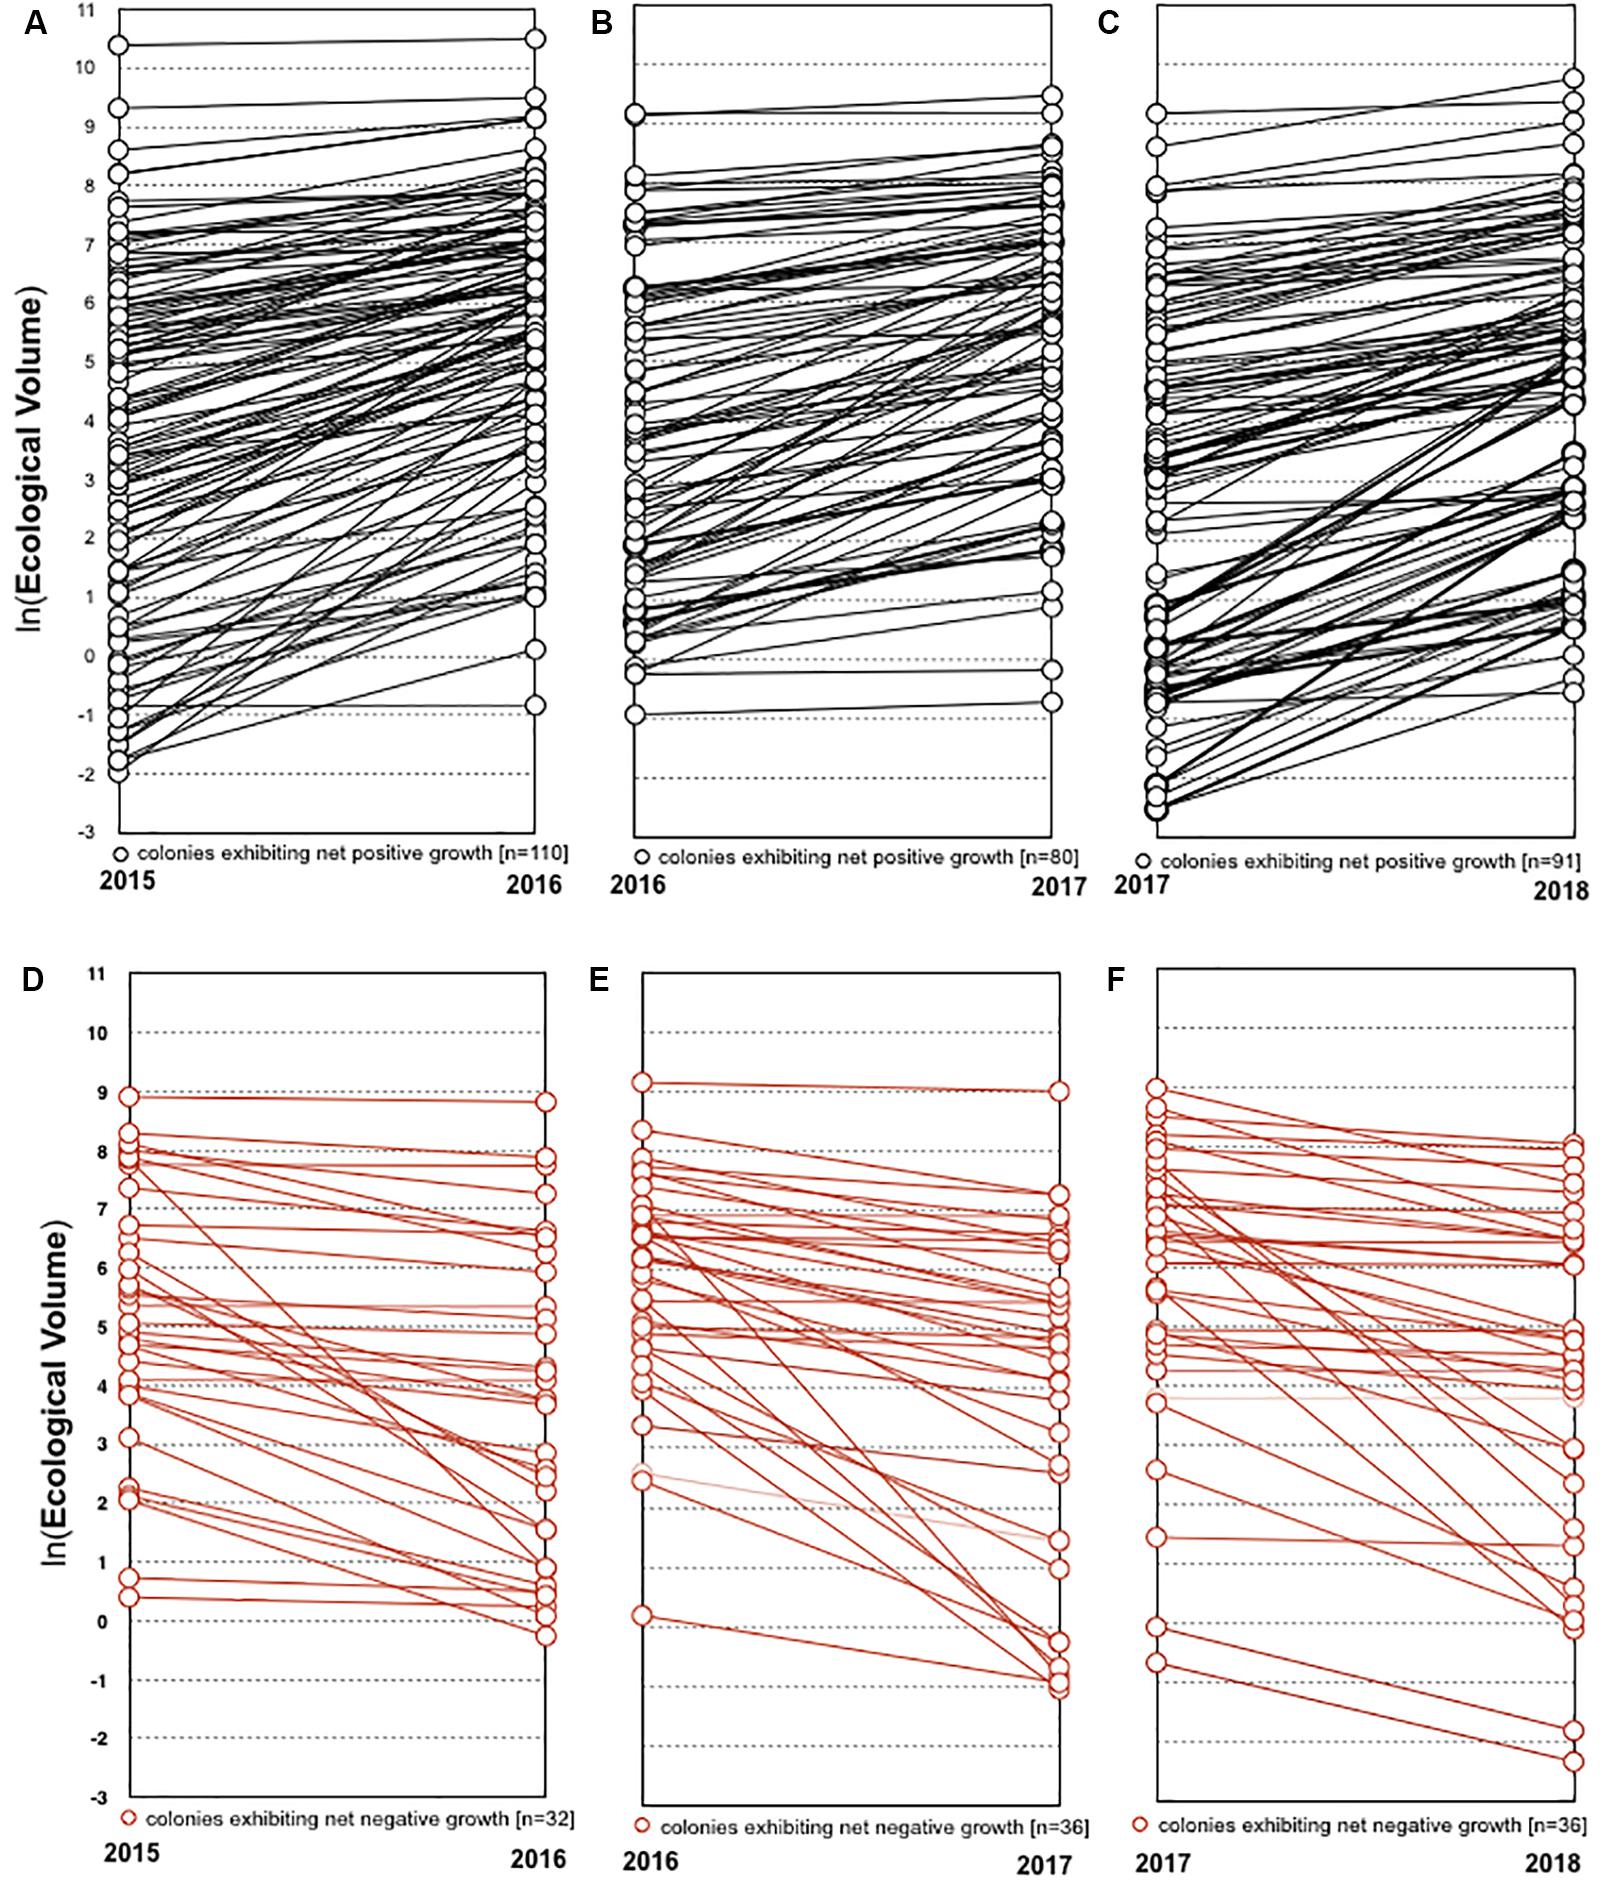
Figure 5. Growth of individual colonies. Colonies that exhibited net positive growth in 2015–2016, 2016–2017, and 2017–2018 are represented in panels (A–C), respectively. Colonies that exhibited net negative growth in 2015–2016, 2016–2017, and 2017–2018 are represented in panels (D–F), respectively.
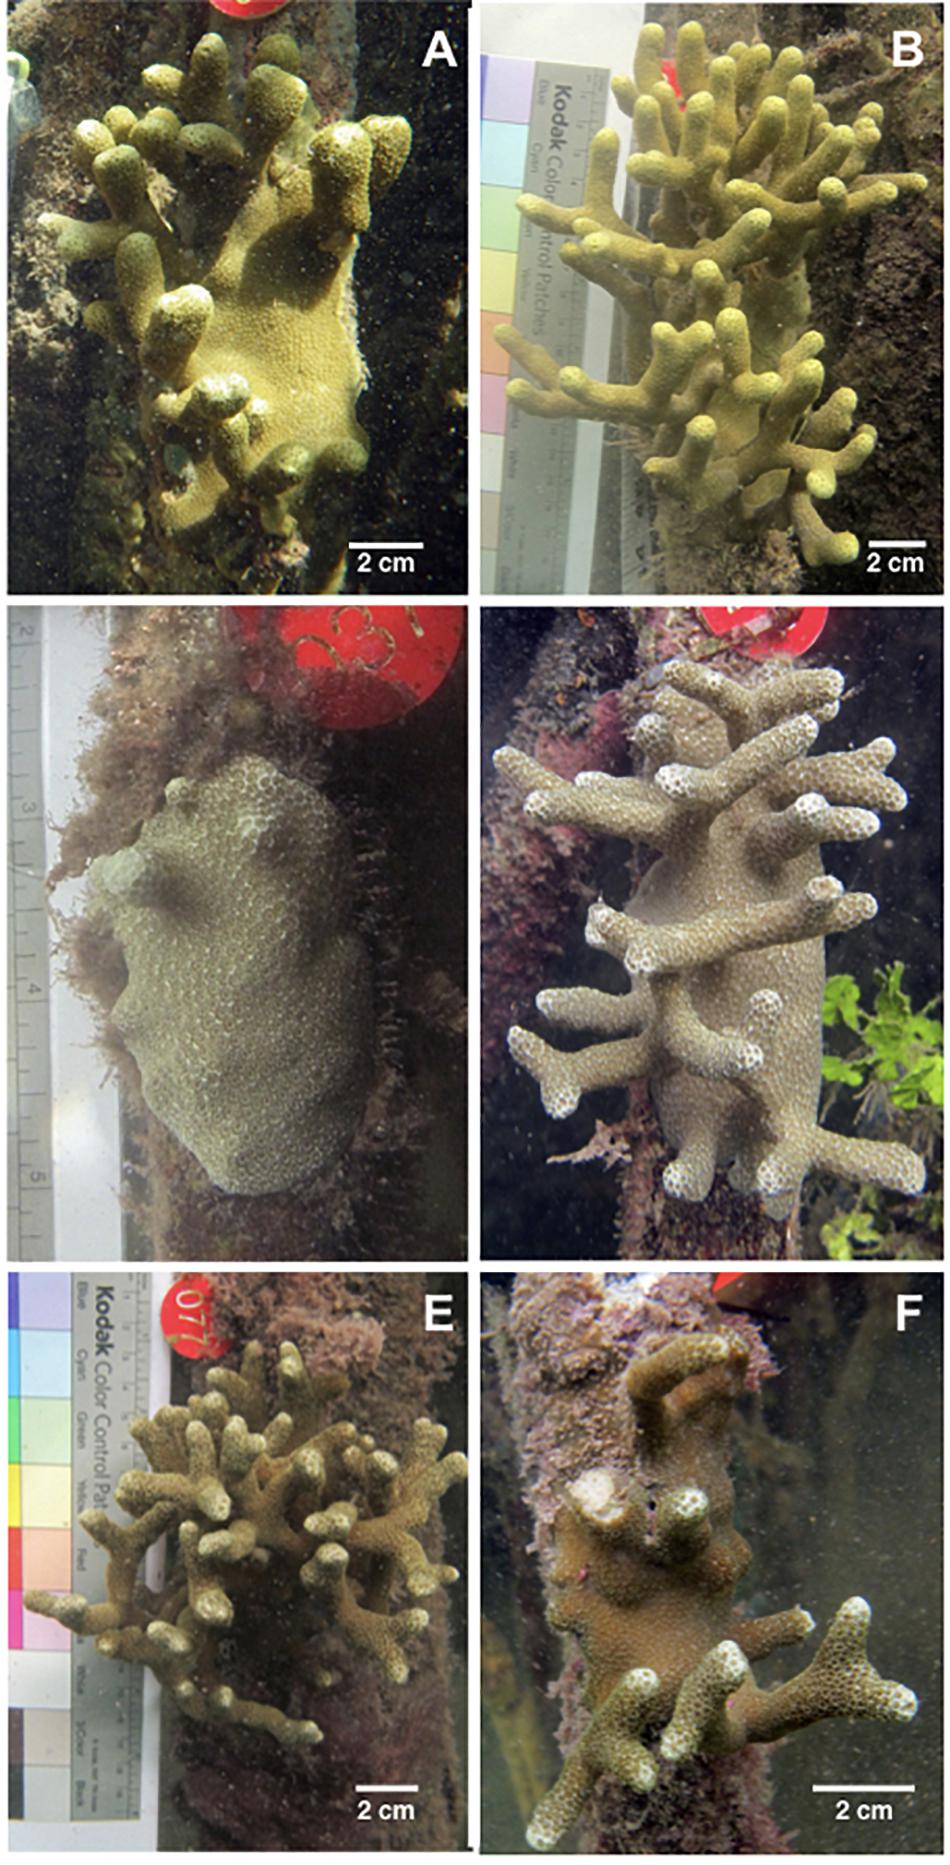
Figure 6. Examples of colony growth and shrinkage. (A) Colony #97 in 2015. (B) The same colony in 2016 after adding 35 branch tips and increasing 1084 cm3 in ecological volume. (C) Colony #37 in 2016. (D) The same colony in 2017 after adding 23 branch tips and increasing 326.7 cm3 in ecological volume. (E) Colony #77 in 2016. (F) The same colony in 2017 after losing 32 branch tips and decreasing by 1798.8 cm3 in ecological volume. Of note, the three colonies shown here vary in color, and the general hue of each coral remains constant from year-to-year.
The Effect of Size on Growth and Mortality
Colony size did not exhibit a consistent relationship to survival across census intervals. There was a significant positive relationship between colony size in 2015 and the probability of survival to 2016, such that larger colonies had a higher probability of survival than smaller colonies (Table 2 and Figure 7A, black symbols). However, during the 2016–2017 period, many large colonies died (Table 2 and Figure 7A, red symbols), resulting in a hump-shaped survival curve, where peak survivorship was exhibited by colonies of intermediate size. The relationship between colony size and colony growth was consistent between census periods (Figure 7B).
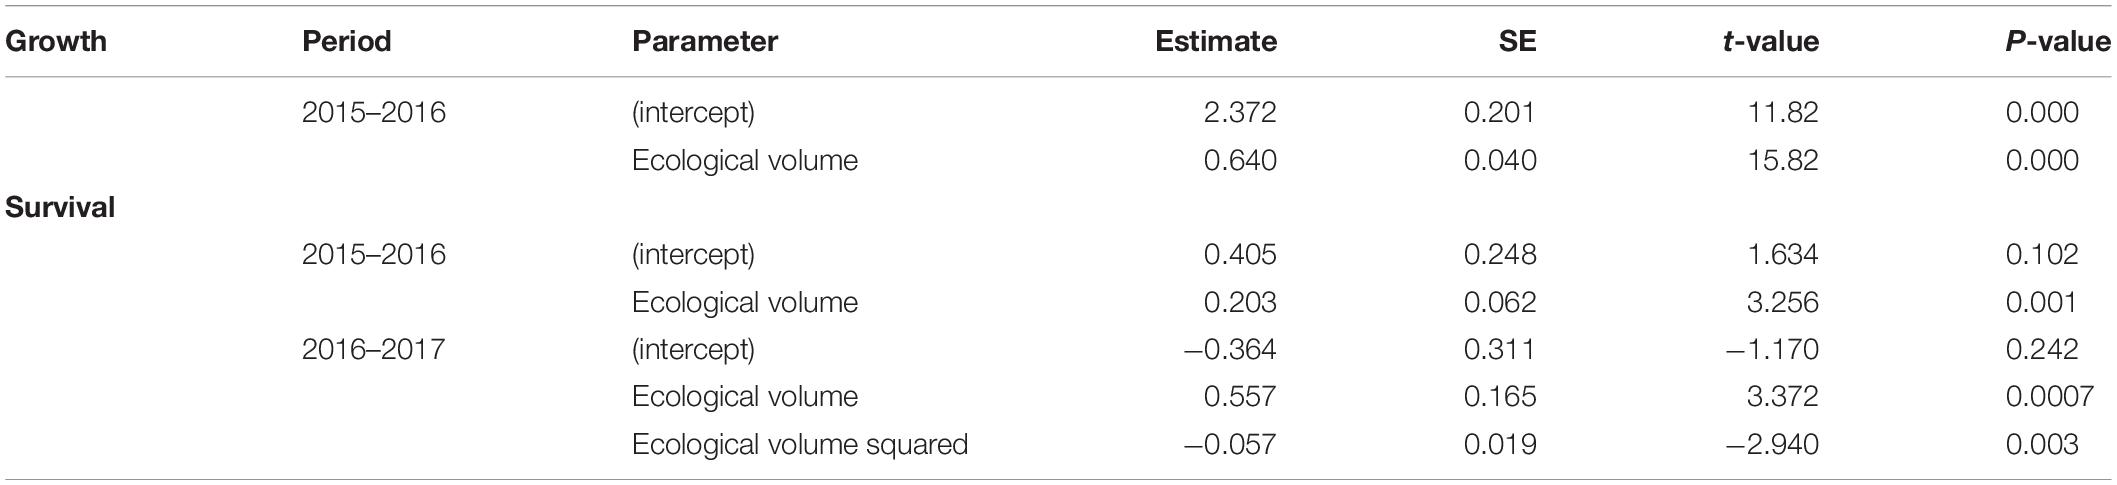
Table 2. Best fit regression models for growth and survival.
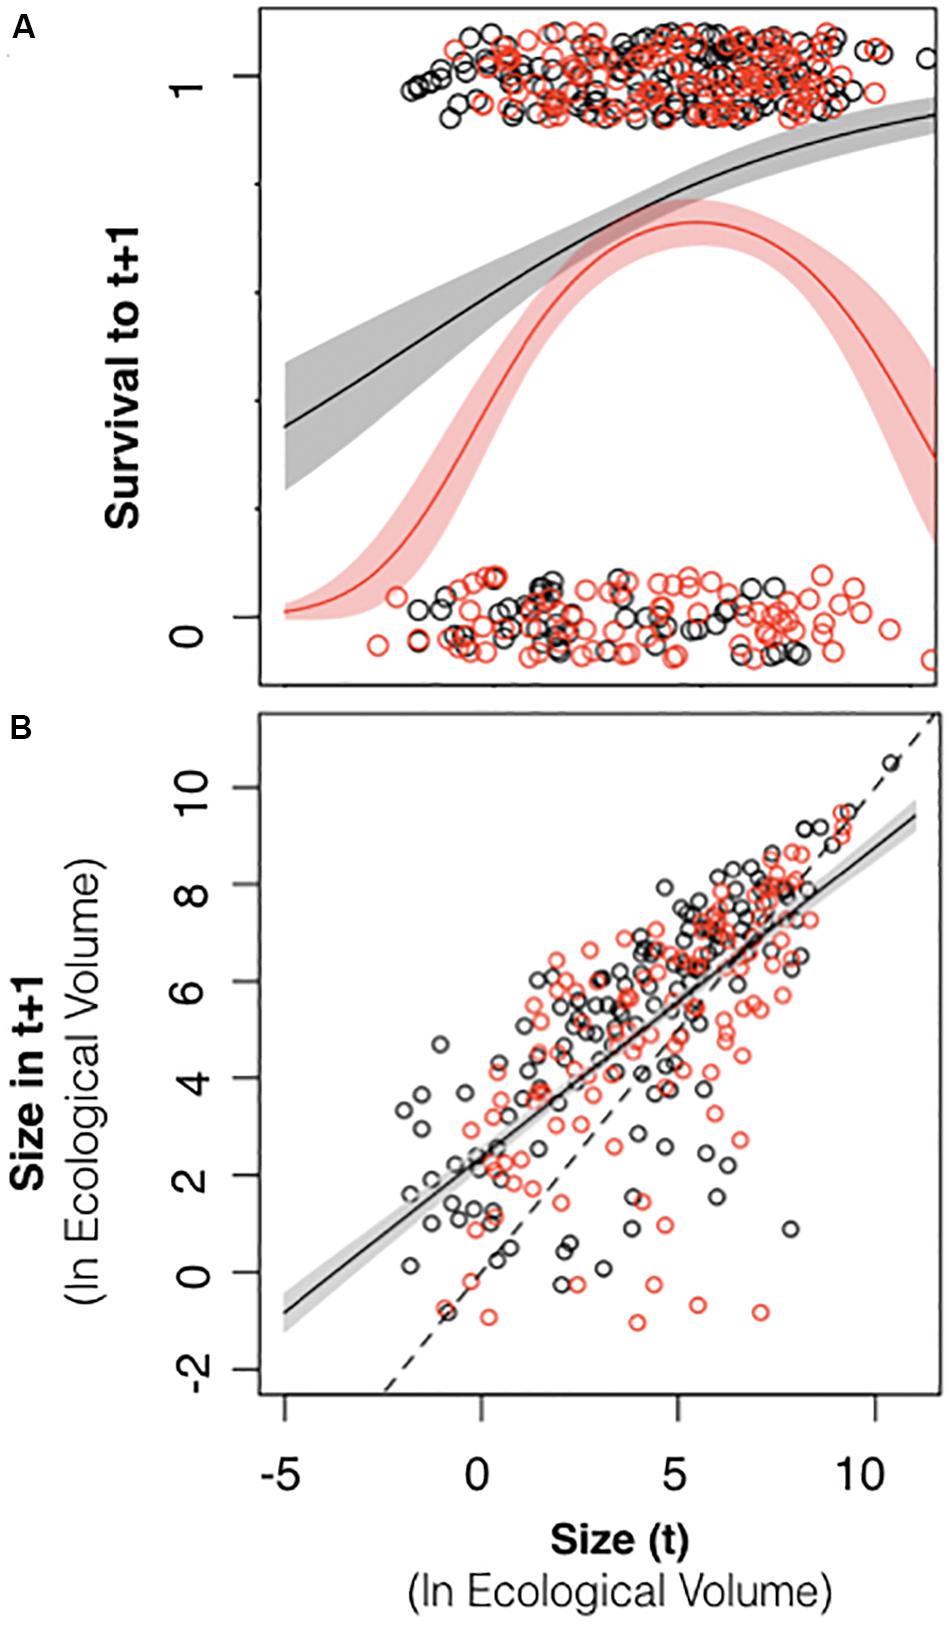
Figure 7. Relationship between colony size and colony survival and growth. (A) Black symbols relate colony size in 2015 to the probability of surviving to 2016 (0 or 1). Red symbols relate colony size in 2016 to the probability of surviving to 2017. In 2015–2016, larger colonies exhibited higher survival across the entire size range (black line with 95% confidence intervals depicted in gray). In 2016–2017, colonies of an intermediate size exhibited the highest survival (red line with 95% confidence intervals depicted in pink). (B) Black symbols relate colony size in 2015 to colony size in 2016. Red symbols relate colony size in 2016 to colony size in 2017. The dashed line represents unity. The R function jitter was used to display overlapping data values (R Core Team., 2018).
Population Growth Projections Based on IPM
Due to the differing mortality of large colonies observed over our two census intervals, we developed separate IPM based on the data from 2015–2016 to 2016–2017, and those two models yielded different population growth projections (Figure 8). The 2015–2016 model projected modest population growth (λ = 1.047; 95% confidence interval = 1.012–1.089), which, if it held constant, would cause the population to double in 15 years. The 2016–2017 model forecasts a population decrease (λ = 0.682; 95% confidence interval = 0.675–0.691). In both years, sensitivity and elasticity analyses revealed that recruitment was the biggest contributor to population growth rate (λ) followed by colonies of larger sizes (Figure 9), likely due to increased survival (Figure 7A) and reproduction by larger colonies.
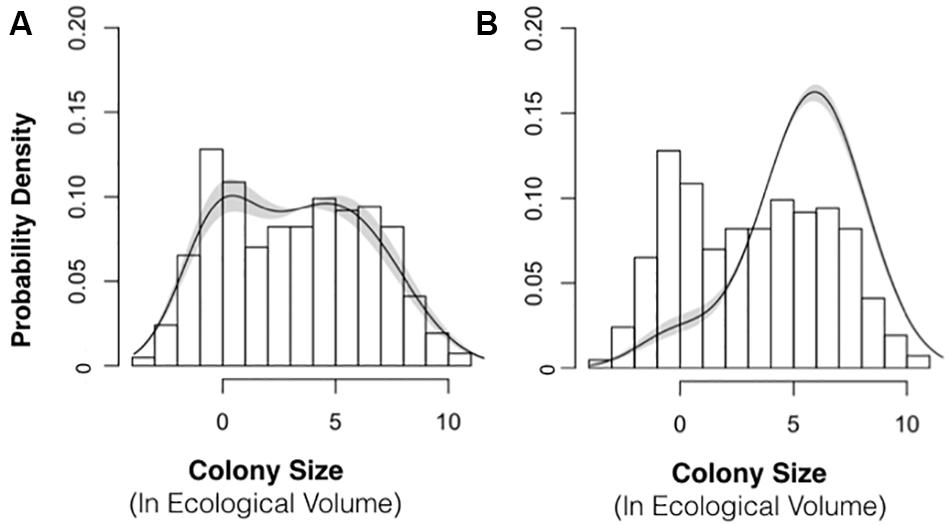
Figure 8. Population Density Distribution with Best-Fit Model Stable Size Distribution. The best-fit model (lines) for the stable size distribution is shown next to the empirical size distribution (bars) of P. divaricata for 2015 (A) and 2016 (B). The shading depicts 95% confidence intervals. This best-fit model of the size distribution was incorporated into the IPM models for 2015–2016 and 2016–2017.
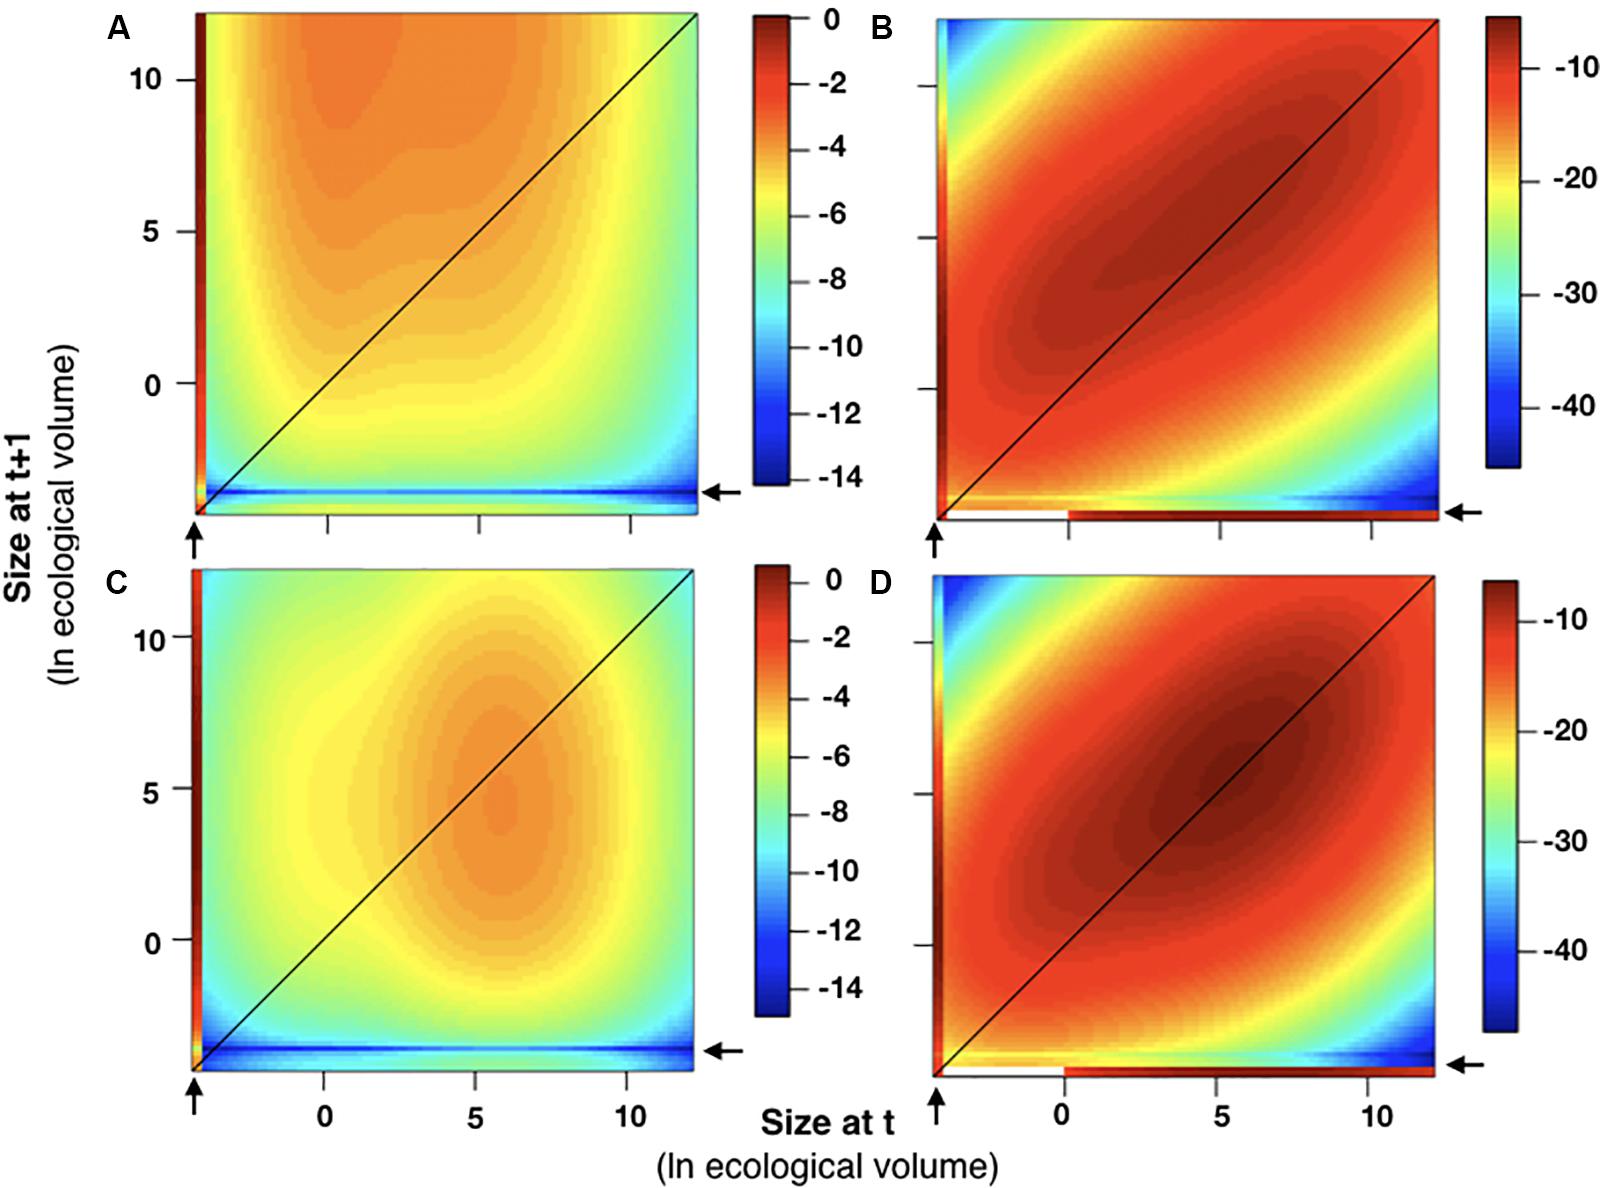
Figure 9. Sensitivity and elasticity analyses. The sensitivity and elasticity of the integral projection model in 2015–2016 (A,B) and 2016–2017 (C,D) are plotted relative to colony size. In all graphs, colony size was plotted as ln(ecological volume). As described in the methods, all recruits were assumed to enter the population below the smallest size class [ln(ecological volume) < –4]. Areas on the plot exhibiting higher sensitivity and elasticity values, which indicates a greater contribution to λ, are associated with recruits (indicated by arrows) and with individuals of larger sizes for both years.
Potential sources of error in our demographic data collection methods were used to test the robustness of the model. First, it is probable that some of the colonies that were marked as missing or dead may have simply been missed or unnoticed by a researcher along the transect. Algal and sponge overgrowth on the roots can conceal tags as well as a majority of the colony which may render it nearly invisible. Second, while careful attention was given to searching for recruits each year, it is probable that the number of recruits was underestimated each year given the difficulty of seeing small recruits on the epibiont covered mangrove roots. In few cases, these instances can be used to test the robustness of the model; for example, when adding two colonies that were recorded as missing but found in the subsequent year, as well as an individual that had been missed as recruit in one year to the model, there were no significant changes in the model parameters and overall model output.
Resident and Recruit Distribution Analysis
In each year that we scored their locations (2016–2018), recruits were located significantly closer to resident colonies than expected by chance. In 2016, recruits were located 0.25 m (SD = 1.0) from resident colonies on average. By contrast, in 100 trials using randomly generated locations for recruits, the mean distance from the resident colonies was over 8× as great (mean = 2.1 m, SD = 2.2). Similarly, in 2017, the randomly generated distance was almost 5.7× greater (2.1 ± 2.4 vs. 0.37 ± 1.1 m), while in 2018, it was 5.3× greater (2.5 ± 3.6 vs. 0.47 ± 1.3 m).
Discussion
Several observations suggest that the population of P. divaricata in the mangroves at Calabash Caye is viable and relatively stable. First, we observed a general stability in population size, where recruitment slightly exceeded colony mortality. This was true despite the fact that Calabash Caye was hit by Hurricane Earl in August 4, 2016 (Stewart, 2017), and hurricanes can be extremely destructive to mangrove corals (Rogers, 2019). Second, the size-frequency distributions are generally consistent with those found in other self-sustaining populations which tend to exhibit approximately log-normal size distributions and moderate (usually slightly negative) values of skewness (Meesters et al., 2001). The stability of the population is also supported by the integral projection model for the 2015–2016 time period, which projected an annual population growth rate of 4.6% (log of λ = 1.047). Because the population was modeled as closed, λ > 1 indicates that the population is capable of self-replenishment in the absence of recruits from other local populations. This is likely for a population of a brooding coral considering the high degree of local recruitment associated with its life history (Harrison and Wallace, 1990; Harii et al., 2002; Underwood et al., 2007; Jones et al., 2009).
However, the integral projection model for the 2016–2017 time period projected a fairly substantial population decline (λ < 1) that can be attributed largely to relatively high mortality of the largest colonies during the preceding interval. Large colonies contribute significantly to population growth because they are more fecund and generally have a higher probability of survival than smaller colonies [as described in Edmunds (2010)].
While the model’s projected population decline was strongly influenced by the reduced survivorship of larger colonies in the 2016–2017 interval, we suspect that the loss of large colonies in this interval was due to an unusual disturbance, and larger colonies generally exhibit higher survivorship. The mortality of larger colonies over 2016–2017 may be the result of one or more of the following three possibilities. First, larger colonies, which present greater projected area to flow and therefore experience increased drag, may have been dislodged from the root due to a wave action associated with passing storms. Alternatively, larger colonies may simply grow too heavy to be supported by their point of attachment on the root. This phenomenon, where large corals are more likely to fall from mangrove roots or to cause the root itself to snap, could be a general feature of mangrove coral life histories, as it appears to be with mangrove sponges (Bingham and Young, 1995). Third, larger (and presumably older) colonies may generally be associated with older roots, which are more likely to experience age-related degeneration or damage from isopod borers or marine fungi (Ellison and Farnsworth, 1990). However, despite the model’s projection of population decline post 2017, our final survey in the mangroves revealed net population growth of 1.5% from 2017 to 2018. Additionally, we documented a change in the population size-frequency from 2017 to 2018 that is more indicative of a stable population, as medium-sized and large colonies increased in frequency (Edmunds, 2010). Of note, the individual growth trajectories depicted in Figure 5 reveal that the smallest recruits can achieve moderate size within a single year, and moderate colonies can achieve large size within a single year, indicating the potential to replace large colonies in as little as 1–2 years.
In the population described here, recruitment contributed the most to population growth (λ) and appeared critical to population sustainability, e.g., in two of three study years, the number of recruits exceeded 50% of the number of surviving colonies. While there are no comparable studies of mangrove coral populations available for comparison, demographic studies on Caribbean corals in reef environments have not identified such a prominent contribution by recruitment to the intrinsic rate of population growth (Edmunds, 2010; Soto-Santiago et al., 2017). However, given the high turnover rate observed in our population, as well as the short life cycle and high fecundity of brooding, weedy corals, we would expect recruitment to play a more prominent role in maintaining populations. With respect to larval recruitment, a critical unanswered question is the degree of local recruitment and connectivity between mangroves and other habitats. We can use the IPM to determine the percentage of local recruitment necessary for the mangrove population to be self-sustaining, (λ > 1). In 2015–2016, ≥68% local recruitment (95% confidence interval: 51–89%) was necessary for the population to be self-sustaining. During the 2016–2017 interval, when we witnessed an unusual loss of large colonies from the population, the model projected a population decline even with 100% local recruitment.
As a brooding coral, we would expect a high degree of local recruitment (Harrison and Wallace, 1990; Harii et al., 2002; Underwood et al., 2007; Jones et al., 2009) and episodic recruitment throughout the year (Harii et al., 2002). In both 2016 and 2017, new recruits were located significantly closer to resident colonies than expected based on random chance (Figure 10). This clustered distribution is characteristic of local recruitment in brooding coral species, where larvae commonly settle within meters of parent colonies (Harii et al., 2002; Vermeij, 2005; Underwood et al., 2007), however this pattern could result from environmental heterogeneity or from environmental cues that promote settlement of recruits to the same areas as existing colonies. The recruits identified in this study span a wide size range, from 0.04 to 626.4 cm3, and from zero to 32 branch tips. This is consistent with episodic recruitment throughout the year, so that the new recruits that we identified in November-December may represent a nearly 12-month range in age (Harii et al., 2002). Alternatively, there could be a high degree of micro-environmental variation within the mangroves so that the potential for growth varies substantially among recruits depending on the light, flow and turbidity where they settle (Bengtsson et al., 2019). While there have been no published studies on the size or age at first reproduction in P. divaricata, a study of the closely related P. furcata found colonies with three or more branches to be reproductive, suggesting the corals in this study could become reproductive within their first year (Schlöder and Guzman, 2008).
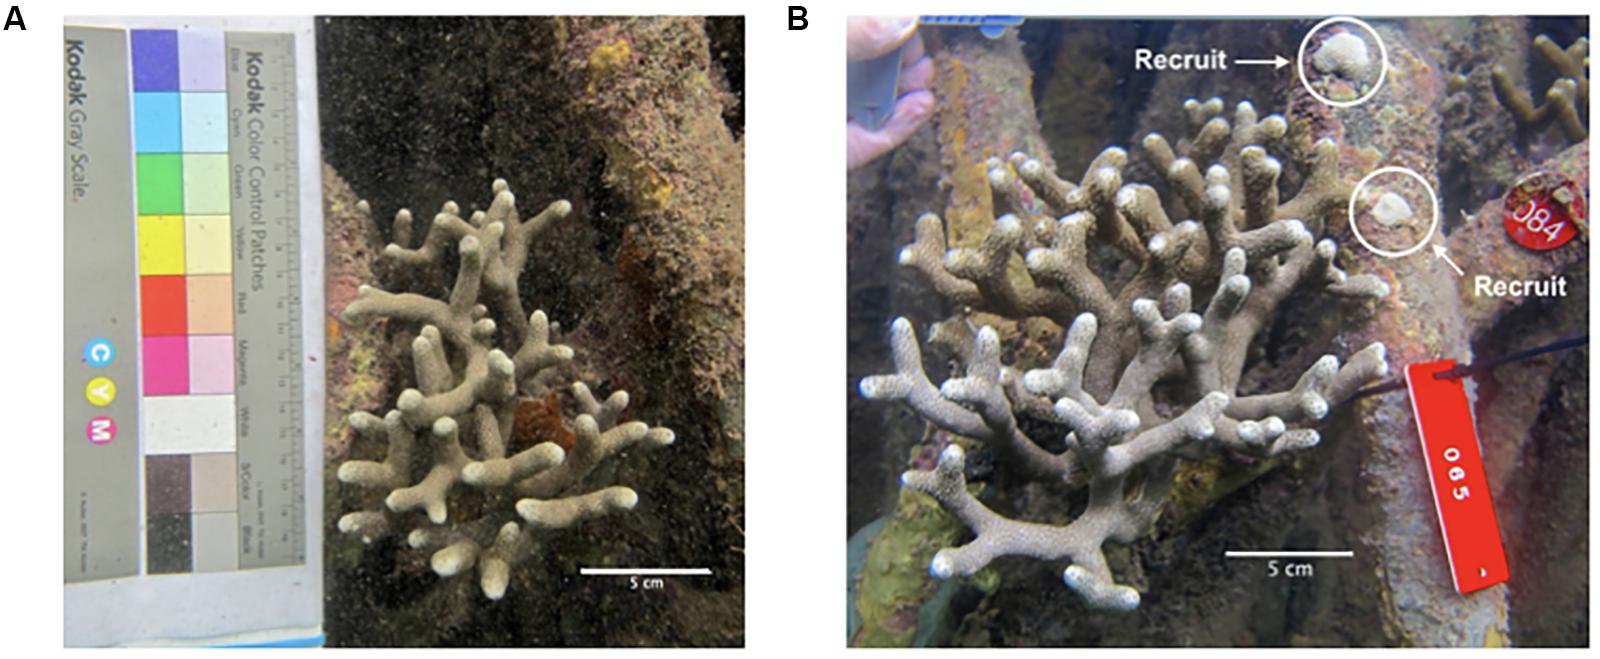
Figure 10. New recruits located adjacent to a resident colony. A representative photograph of a larger resident colony in 2016 (A) that was found the following year (2017) with recruits that settled within inches of the branches (B).
Just as the mangrove habitat may impact mortality differently than other habitats, we expect it to impact recruitment differently as well. For example, given that the substrate being utilized by the corals in this study is physically isolated and suspended in the water column, recruitment by asexual fragmentation is not possible. Fragments that break off from existing colonies will fall to the soft, flocculent sediment lying beneath the overhanging mangrove roots, and we have observed no viable colonies living on this substrate in 2014–2018, only the occasional dead or dying colony. So, unlike the situation in reef habitats where P. divaricata has been shown to undergo substantial propagation by colony fragmentation (McDermond, 2014), we can assume that recruits to the mangrove roots represent larval settlement.
While P. divaricata is not a major coral reef framework builder, its widespread occurrence in both mangroves and reefs makes it a good model system for investigating the importance of mangrove populations in the broader habitat mosaic of corals. P. divaricata has been recorded in every Caribbean mangrove coral community studied to date (Rogers and Herlan, 2012; Hernández-Fernández, 2015; Camp et al., 2016; Bengtsson et al., 2019), and it is often accompanied by three other species in the genus Porites: P. furcata and P. porites, which have a branching habit similar to P. divaricata, as well as P. astreoides, which has a mounding habit. These weedy, opportunistic corals are known for their ability to colonize recently disturbed habitats (Darling et al., 2012, 2013). A diverse collection of additional coral species have also been documented in mangrove habitats, including “stress tolerant” species like Siderastrea siderea, Colpophyllia natans, Orbicella annularis, and Pseudodiploria strigosa, and “generalist species” like Orbicella faveolata and O. franksi (Rogers and Herlan, 2012; Hernández-Fernández, 2015; Camp et al., 2016; Bengtsson et al., 2019). Going forward, it will be important to distinguish between “mangrove corals” living (1) directly attached to prop roots (Yates et al., 2014; Hernández-Fernández, 2015; Bengtsson et al., 2019), (2) on benthic substrates under the mangrove canopy (Rogers and Herlan, 2012; Yates et al., 2014; Rogers, 2017), or (3) in mangrove lagoons but not under the canopy (Yates et al., 2014). As described above, for mangrove root epibionts, asexual reproduction by fission will be severely limited if not impossible, whereas this strategy of asexual propagation is readily available to corals living on benthic substrates under or adjacent to mangroves. The epibiont may also face a limit on its size imposed by the lifespan of the root and the increasing likelihood of falling off the root at larger colony sizes. Furthermore, corals living under the canopy, whether as mangrove epibionts or on benthic substrates beneath the mangroves will experience extensive shading from the canopy, where mangrove lagoon corals may never be shaded by the canopy.
The research described here is the first longitudinal study of a mangrove coral population to track location, survivorship, health, growth, and recruitment of specific coral colonies over time. By monitoring individual colonies, this study provides insights that are not possible from a strictly cross-sectional approach, and it enables the construction of population models that project future trends. If we are to understand the extent to which mangrove habitats may serve as ecological refugia and/or resilience reservoirs for corals facing global climate change, it will be important to (1) continue longitudinal studies on the handful of already identified mangrove coral populations to understand their longer-term population dynamics, (2) more thoroughly document the location, extent, and environmental features of mangrove habitats that can support coral communities, (3) fully characterize which coral taxa can effectively exploit mangroves as habitat, (4) identify the phenotypic traits that allow these corals to exploit mangroves, in addition to the genetic and molecular basis of such traits, and (5) determine the extent of connectivity between mangrove coral populations and non-mangrove populations. The current study did not examine the potential for larvae released in the mangrove to recruit to nearby reefs. We would expect a brooding coral to exhibit a low potential for long-distance recruitment. However, a larval period of up to 30 days has been reported in the closely related brooding coral, P. furcata (Schlöder and Guzman, 2008). If P. divaricata exhibits a similar maximum larval period, there could be a high degree of connectivity between this mangrove and nearby reefs, although the relative frequency of recruitment across these habitats will need to be examined using genetic data. This is not to say that recruitment from the mangrove could, by itself, sustain nearby reefs, but it could represent an important source of recruits, particularly in the event of a massive die-off on the reef.
If mangroves are important to the survival of some coral species, then the prognosis for coral-hosting mangrove forests emerges as a critical question for coral conservation. As of yet, the spatial extent, environmental health, and ecological diversity of coral-hosting mangroves are not well known for any region, but in recent decades, an increasing number of studies have focused on the future of mangroves generally. In the closing decades of the 20th century, the loss of mangroves was so dire that experts pondered “a world without mangroves” (Duke et al., 2007). Some 35% of the world’s mangrove forests were estimated to have been lost (Valiela et al., 2001), with much of the loss occurring between 1970 and 2005, mainly from local anthropogenic impacts, specifically deforestation for aquaculture, agriculture, and coastal development (Gilman et al., 2008). More recently, the loss of mangroves has been slowed or even reversed in some localities through a combination of human-assisted restoration, natural re-colonization of deforested areas, and more stringent legal protections (Friess et al., 2016, 2019). With respect to global climate change, a principal focus of research is how mangroves will respond to sea level rise (Feller et al., 2017). A recent review concluded that “more accurate projections of mangrove resilience to sea-level are required” (Friess et al., 2019), but the existing forecasts vary depending upon local hydrodynamics and geomorphology. It is generally thought that mangroves can adjust to moderate changes in sea level through vertical building (i.e., accumulation of refractory mangrove roots) where sedimentation exceeds relative sea level rise, or by landward retreat where such movements are not impeded by the coastline topography or coastal development (McKee et al., 2007). The latter would apply to coastal mangroves but not the mangroves of an oceanic atoll such as Turneffe. Importantly, mangrove degradation and the associated loss of ecosystem services such as biodiversity support, could prove just as detrimental for corals as a reduction in the areal extent of mangroves, and this is an area where more study is urgently needed (Friess et al., 2019).
Data Availability Statement
The datasets generated for this study are available on request to the corresponding author.
Author Contributions
JF and KSL conceived the original study design. KSL, KCL, ZB, KK, JM, BC, RE, JT, EB, JM, and JF refined the study design and collected data. All authors participated in data analysis, figure production, and writing the manuscript.
Funding
This research was supported by National Science Foundation grants IOS-1354935 to JF and DGE-1247312 to KSL as well as a Munge Family Foundation grant to LK. Additional support for fieldwork conducted in 2016 was provided by National Geographic Young Explorers Grants Program (Grant 9963-16), the Lerner Gray Memorial Grants Program, and the Boston University Graduate Student Organization. Support for fieldwork conducted in 2017 was provided by Sigma Xi Grants-In-Aid, American Marine Laboratories of the Caribbean, and PADI Foundation. Fieldwork in 2018 was supported by Boston University through the Graduate Research Abroad Fellowship. The research was conducted under Aquatic Scientific Research Permits #000047-13 (2014), #0000053-15 (2015), #000053-16 (2016), #000056-17 (2017), #0041-18 (2018) issued by the Belize Fisheries Department.
Conflict of Interest
The authors declare that the research was conducted in the absence of any commercial or financial relationships that could be construed as a potential conflict of interest.
Acknowledgments
We are grateful to J. Azueta and I. Majil at the Belize Fisheries Department for assistance in obtaining these research permits, and staff of the Boston University Marine Program (J. Hammer-Mendez, J. Perry, and J. Scace) for their logistical and technical support of the Marine Semester. Some of the data described here were collected by graduate and undergraduate students participating in Boston University’s Marine Semester. This research could not have been conducted without the expert technical assistance and natural history knowledge of boat captains, staff, and researchers at Calabash Caye Field Station and the University of Belize [M. Alamina, V. Alamina, A. Cherrington, L. Cho-Ricketts, N. Craig, C. Encalada, and E. Garcia (currently at the University of North Carolina Wilmington), and J. Hall]. We thank the Bertarelli Foundation and the Oak Foundation for their contributions to the research infrastructure at Calabash Caye Field Station, which facilitated the marine conservation related research described here. We are also grateful to Dr. Peter Buston for helpful discussions on data analysis and Nathan Stewart for assistance in the field. The clarity and quality of the manuscript benefited significantly from the suggestions of two reviewers.
Supplementary Material
The Supplementary Material for this article can be found online at: https://www.frontiersin.org/articles/10.3389/fmars.2020.00377/full#supplementary-material
DATASHEET S1 | Ecological volume of corals measured in 2017 residing outside the main study transect. These data were incorporated into the estimate of the population size distribution used in the integral projection models.
DATASHEET S2 | Input data for the 2015–16 and 2016–17 integral projection models. The dataset consists of size and survivorship of coral colonies from the main study transect in 2015, 2016, and 2017.
References
Aronson, R. B., and Precht, W. F. (2001). White-band disease and the changing face of Caribbean coral reefs. Hydrobiologia 460, 25–38. doi: 10.1007/978-94-017-3284-0_2
Aronson, R. B., Precht, W. F., and Macintyre, I. G. (1998). Extrinsic control of species replacement on a Holocene reef in Belize: the role of coral disease. Coral Reefs 17, 223–230. doi: 10.1007/s003380050122
Bak, R. P. M., and Meesters, E. H. (1998). Coral population structure: the hidden information of colony size-frequency distributions. Mar. Ecol. Prog. Ser. 162, 301–306. doi: 10.3354/meps162301
Beger, M., Sommer, B., Harrison, P. L., Smith, S. D. A., and Pandolfi, J. M. (2014). Conserving potential coral reef refuges at high latitudes. Divers. Distrib. 20, 245–257. doi: 10.1111/ddi.12140
Bengtsson, Z. A., Kuhn, K. M., Battaglino, A. T., Li, A. S., Talbot, M. N., Wafapoor, M., et al. (2019). Corals of the genus Porites are a locally abundant component of the epibiont community on mangrove prop roots at Calabash Caye, Turneffe Atoll, Belize. PeerJ 3:e1453v1.
Bingham, B. L., and Young, C. M. (1995). Stochastic events and dynamics of a mangrove root epifaunal community. Mar. Ecol. 16, 145–163. doi: 10.1111/j.1439-0485.1995.tb00401.x
Bongaerts, P., Ridgway, T., Sampayo, E. M., and Hoegh-Guldberg, O. (2010). Assessing the ‘deep reef refugia’ hypothesis: focus on Caribbean reefs. Coral Reefs 29, 309–327. doi: 10.1007/s00338-009-0581-x
Bruno, J. F., Ellner, S. P., Vu, I., Kim, K., and Harvell, C. D. (2011). Impacts of aspergillosis on sea fan coral demography: modeling a moving target. Ecol. Monogr. 81, 123–139. doi: 10.1890/09-1178.1
Burgess, H. R. (2011). Integral Projection Models and Analysis of Patch Dynamics of the Reef Building coral Monstastraea Annularis. Ph. D. Thesis, University of Exeter, Exeter.
Camp, E. F., Schoepf, V., and Suggett, D. J. (2018b). How can “Super Corals” facilitate global coral reef survival under rapid environmental and climatic change? Glob. Change Biol. 24, 2755–2757. doi: 10.1111/gcb.14153
Camp, E. F., Schoepf, V., Mumby, P. J., and Suggett, D. J. (2018a). The future of coral reefs subject to rapid climate change: lessons from natural extreme environments. Front. Mar. Sci. 5:433. doi: 10.3389/fmars.2018.00433
Camp, E. F., Suggett, D. J., Gendron, G., Jompa, J., Manfrino, C., and Smith, D. J. (2016). Mangrove and seagrass beds provide different biogeochemical services for corals threatened by climate change. Front. Mar. Sci. 3:52. doi: 10.3389/fmars.2016.00052
Castillo, K. D., and Helmuth, B. (2003). Effects of elevated seawater temperature on photosynthesis and respiration in scelractinian coral Montastraea annularis - Southern Belize. Integr. Comp. Biol. 43, 819–819.
Collin, R., Diaz, M. C., Norenburg, J., Rocha, R. M., Sanchez, J. A., Schulze, A., et al. (2005). Photographic identification guide to some common marine invertebrates of Bocas del Toro, Panama. Caribb. J. Sci. 41, 638–707.
Crook, E. D., Potts, D., Rebolledo-Vieyra, M., Hernandez, L., and Paytan, A. (2012). Calcifying coral abundance near low-pH springs: implications for future ocean acidification. Coral Reefs 31, 239–245. doi: 10.1007/s00338-011-0839-y
Darling, E. S., Alvarez-Filip, L., Oliver, T. A., Mcclanahan, T. R., Cote, I. M., and Bellwood, D. (2012). Evaluating life-history strategies of reef corals from species traits. Ecol. Lett. 15, 1378–1386. doi: 10.1111/j.1461-0248.2012.01861.x
Darling, E. S., Mcclanahan, T. R., and Cote, I. M. (2013). Life histories predict coral community disassembly under multiple stressors. Glob. Change Biol. 19, 1930–1940. doi: 10.1111/gcb.12191
Diaz, M. C., and Rützler, K. (2009). Biodiversity and abundance of sponges in Caribbean mangrove: indicators of environmental quality. Smithson Contrib. Mar. Sci. 38, 151–172. doi: 10.5479/si.01960768.38.151
Duke, N. C., Meynecke, J. O., Dittmann, S., Ellison, A. M., Anger, K., Berger, U., et al. (2007). A world without mangroves? Science 317, 41–42.
Easterling, M. R., Ellner, S. P., and Dixon, P. M. (2000). Size-specific sensitivity: applying a new structured population model. Ecology 81, 694–708. doi: 10.1890/0012-9658(2000)081[0694:sssaan]2.0.co;2
Edmunds, P. J. (2010). Population biology of Porites astreoides and Diploria strigosa on a shallow Caribbean reef. Mar. Ecol. Prog. Ser. 418, 87–104. doi: 10.3354/meps08823
Edmunds, P. J., Burgess, S. C., Putnam, H. M., Baskett, M. L., Bramanti, L., Fabina, N. S., et al. (2014). Evaluating the causal basis of ecological success within the scleractinia: an integral projection model approach. Mar. Biol. 161, 2719–2734. doi: 10.1007/s00227-014-2547-y
Elahi, R., Sebens, K. P., and De Leo, G. A. (2016). Ocean warming and the demography of declines in coral body size. Mar. Ecol. Prog. Ser. 560, 147–158. doi: 10.3354/meps11931
Ellison, A. M., and Farnsworth, E. J. (1990). The ecology of Belizean mangrove-root fouling communities. 1. Epibenthic fauna are barriers to isopod attack of red mangrove roots. J. Exp. Mar. Biol. Ecol. 142, 91–104. doi: 10.1016/0022-0981(90)90139-4
Feller, I. C., Friess, D. A., Krauss, K. W., and Lewis, R. R. (2017). The state of the world’s mangroves in the 21st century under climate change. Hydrobiologia 803, 1–12. doi: 10.1007/s10750-017-3331-z
Friess, D. A., Lee, S. Y., and Primavera, J. H. (2016). Turning the tide on mangrove loss. Mar. Pollut. Bull. 109, 673–675. doi: 10.1016/j.marpolbul.2016.06.085
Friess, D. A., Rogers, K., Lovelock, C. E., Krauss, K. W., Hamilton, S. D., Lee, S. Y., et al. (2019). The state of the world’s mangrove forests: past, present, and future. Annu. Rev. Environ. Resour. 44, 89–115.
Gilman, E. L., Ellison, J., Duke, N. C., and Field, C. (2008). Threats to mangroves from climate change and adaptation options: A review. Aquat. Bot. 89, 237–250. doi: 10.1016/j.aquabot.2007.12.009
Green, D. H., Edmunds, P. J., and Carpenter, R. C. (2008). Increasing relative abundance of Porites astreoides on Caribbean reefs mediated by an overall decline in coral cover. Mar. Ecol. Prog. Ser. 359, 1–10. doi: 10.3354/meps07454
Grottoli, A. G., Warner, M. E., Levas, S. J., Aschaffenburg, M. D., Schoepf, V., Mcginley, M., et al. (2014). The cumulative impact of annual coral bleaching can turn some coral species winners into losers. Glob. Change Biol. 20, 3823–3833. doi: 10.1111/gcb.12658
Hall, V. R., and Hughes, T. P. (1996). Reproductive strategies of modular organisms: comparative studies of reef-building corals. Ecology 77, 950–963. doi: 10.2307/2265514
Harii, S., Kayanne, H., Takigawa, H., Hayashibara, T., and Yamamoto, M. (2002). Larval survivorship, competency periods and settlement of two brooding corals, Heliopora coerulea and Pocillopora damicornis. Mar. Biol. 141, 39–46. doi: 10.1007/s00227-002-0812-y
Harrison, P. L., and Wallace, C. C. (1990). “Reproduction, dispersal and recruitment of scleractininan corals,” in Ecosystems of the World, 25. Coral Reefs, ed. Z. Dubinsky (Amsterdam: Elsevier Science), 133–207.
Hernández-Fernández, L. (2015). Stony corals on submerged mangrove roots of Rhizophora mangle L. in Jardines de la Reina National Park, Cuba. Revist. Invest. Mar. 35, 17–21.
Hughes, T. P., Barnes, M. L., Bellwood, D. R., Cinner, J. E., Cumming, G. S., Jackson, J. B. C., et al. (2017). Coral reefs in the Anthropocene. Nature 546, 82–90.
Jimenez, C., Cortes, J., Leon, A., and Ruiz, E. (2001). Coral bleaching and mortality associated with the 1997-98 El Nino in an upwelling environment in the Eastern Pacific (Gulf of Papagayo, Costa Rica). Bull. Mar. Sci. 69, 151–169.
Jones, G. P., Almany, G. R., Russ, G. R., Sale, P. F., Steneck, R. S., Van Oppen, M. J. H., et al. (2009). Larval retention and connectivity among populations of corals and reef fishes: history, advances and challenges. Coral Reefs 28, 307–325. doi: 10.1007/s00338-009-0469-9
Laubenfels, M. W. (1950). The Porifera of the Bermuda archipelago. Trans. Linn. Soc. Lond. 27, 1–54.
Madin, J. S., Hughes, T. P., and Connolly, S. R. (2012). Calcification, storm damage and population resilience of tabular corals under climate change. PLoS One 7:e46637. doi: 10.1371/journal.pone.0046637
McDermond, J. (2014). Reproduction and Population of Porites divaricata at Rodriguez Key: The Florida Keys, USA. Ph. D. Thesis, Nova Southestern University Fort, Lauderdale, FL.
McKee, K. L., Cahoon, D. R., and Feller, I. C. (2007). Caribbean mangroves adjust to rising sea level through biotic controls on change in soil elevation. Glob. Ecol. Biogeogr. 16, 545–556. doi: 10.1111/j.1466-8238.2007.00317.x
Meesters, E. H., Hilterman, M., Kardinaal, E., Keetman, M., De Vries, M., and Bak, R. P. M. (2001). Colony size-frequency distributions of scleractinian coral populations: spatial and interspecific variation. Mar. Ecol. Prog. Ser. 209, 43–54. doi: 10.3354/meps209043
Miller, M., Williams, D. E., Huntington, B. E., Piniak, G. A., and Vermeij, M. J. A. (2016). Decadal comparison of a diminishing coral community: a study using demographics to advance inferences of community status. PeerJ 4:e1643. doi: 10.7717/peerj.1643
Montero-Serra, I., Garrabou, J., Doak, D. F., Figuerola, L., Hereu, B., Jean-Baptiste, L., et al. (2017). Accounting for life-history strategies and timescales in marine restoration. Conserv. Lett. 11:e12341. doi: 10.1111/conl.12341
Oliver, T. A., and Palumbi, S. R. (2011). Do fluctuating temperature environments elevate coral thermal tolerance? Coral Reefs 30, 429–440. doi: 10.1371/journal.pone.0179753
Palumbi, S. R., Barshis, D. J., Traylor-Knowles, N., and Bay, R. A. (2014). Mechanisms of reef coral resistance to future climate change. Science 344, 895–898. doi: 10.1126/science.1251336
Pandolfi, J. M., Bradbury, R. H., Sala, E., Hughes, T. P., Bjorndal, K. A., Cooke, R. G., et al. (2003). Global trajectories of the long-term decline of coral reef ecosystems. Science 301, 955–958. doi: 10.1126/science.1085706
Pandolfi, J. M., Connolly, S. R., Marshall, D. J., and Cohen, A. L. (2011). Projecting coral reef futures under global warming and ocean acidification. Science 333, 418–422. doi: 10.1126/science.1204794
R Core Team. (2018). R: A Language and Environment for Statistical Computing. Vienna: R Foundation for Statistical Computing.
Rogers, C. S. (2017). A unique coral community in the mangroves of Hurricane Hole, St. John, US Virgin Islands. Diversity 9:29. doi: 10.3390/d9030029
Rogers, C. S. (2019). Immediate effects of hurricanes on a diverse coral/mangrove eEcosystem in the U.S. Virgin Islands and the potential for recovery. Diversity 11:130. doi: 10.3390/d11080130
Rogers, C. S., and Herlan, J. J. (2012). “Life on the edge: corals in mangroves and climate change,” in Proceedings of the 12th International Coral Reef Symposium, (Cairns, QLD: James Cook University).
Rutzler, K., Piantoni, C., and Diaz, M. C. (2007). Lissodendoryx: rediscovered type and new tropical western Atlantic species (Porifera: Demospongiae: Poecilosclerida: Coelosphacridae). J. Mar. Biol. Assoc. UK 87, 1491–1510. doi: 10.1017/s0025315407059243
Schlöder, C., and Guzman, H. M. (2008). Reproductive patterns of the Caribbean coral Porites furcata (Anthozoa, Scleractinia, Poritidae) in Panama. Bull. Mar. Sci. 82, 107–117.
Shaish, L., Abelson, A., and Rinkevich, B. (2006). Branch to colony trajectory in a modular organism: pattern formation in the Indo-Pacific coral Stylophora pistillata. Dev. Dyn. 235, 2111–2121. doi: 10.1002/dvdy.20861
Soto-Santiago, F. J., Mercado-Molina, A., Reyes-Maldonado, K., Velez, Y., Ruiz-Diaz, C. P., and Sabat, A. (2017). Comparative demography of two common scleractinian corals: Orbicella annularis and Porites astreoides. PeerJ 5:e3906. doi: 10.7717/peerj.3906
Stewart, S. R. (2017). “Hurricane earl,” in National Hurricane Center Tropical Cyclone Report, ed. National Hurricane Center, (Miami, FL: National Hurricane Center).
Stubben, C., and Milligan, B. (2007). Estimating and analyzing demographic models using the popbio package in R. J. Stat. Softw. 22, 1–23. doi: 10.1002/ece3.722
Underwood, J. N., Smith, L. D., Van Oppen, M. J., and Gilmour, J. P. (2007). Multiple scales of genetic connectivity in a brooding coral on isolated reefs following catastrophic bleaching. Mol. Ecol. 16, 771–784. doi: 10.1111/j.1365-294X.2006.03187.x
Valiela, I., Bowen, J. L., and York, J. K. (2001). Mangrove forests: one of the world’s threatened major tropical environments. Bioscience 51, 807–815.
van Hooidonk, R., Maynard, J., Tamelander, J., Gove, J., Ahmadia, G., Raymundo, L., et al. (2016). Local-scale projections of coral reef futures and implications of the Paris agreement. Sci. Rep. 6:39666. doi: 10.1038/srep39666
Vermeij, M. J. A. (2005). Substrate composition and adult distribution determme recruitment patterns in a Caribbean brooding coral. Mar. Ecol. Prog. Ser. 295, 123–133. doi: 10.3354/meps295123
Vermeij, M. J. A., and Bak, R. P. M. (2000). “Inferring demographic processes from population size structure in corals,” in Proceedings of the 9th International Coral Reef Symposium, (Bali: Netherlands Institute for Sea Research).
Vollmer, S. V., and Palumbi, S. R. (2007). Restricted gene flow in the Caribbean staghorn coral Acropora cervicornis: implications for the recovery of endangered reefs. J. Hered. 98, 40–50. doi: 10.1093/jhered/esl057
Keywords: coral, mangrove, epibiont, Porites divaricata, IPM models
Citation: Scavo Lord K, Lesneski KC, Bengtsson ZA, Kuhn KM, Madin J, Cheung B, Ewa R, Taylor JF, Burmester EM, Morey J, Kaufman L and Finnerty JR (2020) Multi-Year Viability of a Reef Coral Population Living on Mangrove Roots Suggests an Important Role for Mangroves in the Broader Habitat Mosaic of Corals. Front. Mar. Sci. 7:377. doi: 10.3389/fmars.2020.00377
Received: 05 February 2020; Accepted: 04 May 2020;
Published: 03 June 2020.
Edited by:
Yehuda Benayahu, Tel Aviv University, IsraelReviewed by:
Lyndon Mark DeVantier, Coral Reef Research, AustraliaCaroline Eve Dubé, Laval University, Canada
Copyright © 2020 Scavo Lord, Lesneski, Bengtsson, Kuhn, Madin, Cheung, Ewa, Taylor, Burmester, Morey, Kaufman and Finnerty. This is an open-access article distributed under the terms of the Creative Commons Attribution License (CC BY). The use, distribution or reproduction in other forums is permitted, provided the original author(s) and the copyright owner(s) are credited and that the original publication in this journal is cited, in accordance with accepted academic practice. No use, distribution or reproduction is permitted which does not comply with these terms.
*Correspondence: John R. Finnerty, anJmM0BidS5lZHU=