 Anna-Lucia Buer1*
 Marie Maar2
 Mark Nepf1
 Lukas Ritzenhofen1,3
 Sven Dahlke4
 René Friedland1
 Peter Krost5
 Florian Peine6,7
 Gerald Schernewski1,3
- 1Leibniz-Institute for Baltic Sea Research Warnemünde, Rostock, Germany
- 2Department of Bioscience, Faculty of Science and Technology, Aarhus University, Aarhus, Denmark
- 3Marine Research Institute, Klaipeda University, Klaipeda, Lithuania
- 4Biological Station Hiddensee, University of Greifswald, Greifswald, Germany
- 5Coastal Research & Management, Kiel, Germany
- 6Marine Biology, University of Rostock, Rostock, Germany
- 7State Research Institute of Agriculture and Fishery Mecklenburg Vorpommern, Institute of Fishery, Rostock, Germany
Mussel farming, compared to marine finfish aquaculture, represents an environmentally friendly alternative for a high quality protein source and can at the same time be a measure to remove excess nutrients in eutrophic areas. As such, it is considered as a promising “blue growth” potential and promoted within the European Union. To expand mussel aquaculture, new regions have to be considered because there are multiple marine usages, and spatial limitations occur in coastal areas. The brackish Baltic Sea might be considered for expansion of mussel aquaculture. This study focusses on estimated production potential, economic profitability and nutrient remediation potential of mussel farming at different salinities. Four experimental mussel farms were set up along the German Baltic coast at salinities ranging from 7 to 17 psu. Collected growth data was used to calibrate and validate a Dynamic Energy Budget model and to predict the potential mussel production at 12 sites along the German coast. The estimated production and nutrient removal was used to assess economic profitability, assuming two usages of the harvest: human consumption and mussel meal production. Measured mussel specific growth rates increased with salinity from 0.05 mm d–1 in Greifswald Bay to 0.11 mm d–1 in Kiel Fjord. Within 6 months, a 1-ha farm could produce from 1 t (Darss-Zingst-Bodden-Chain) to 51 t (Flensburg) fresh mussels and remove 1.1 to 27.7 kg P and 24.7 to 612.7 kg N, respectively. Mussel farms at sites west of Rostock at salinities >10 psu could produce 5 cm mussels within 18 months, but only farms at Flensburg, Eckernförde and Kiel Fjord became profitable at a farm size of 4 ha (160,000 m3) at current market prices of 2.2 € kg–1. Regardless of the farm size, none of the farm sites could operate profitable if fresh mussels were sold for animal feeding at sales price of 0.06 € kg–1. Yearly nutrient removal costs at a small-scale farm (1 ha) ranged between 162 € (Flensburg) and 4,018 € (Darss-Zingst-Bodden-Chain) kg–1 nitrogen, and 3,580 € and 88,750 € kg–1 phosphorus, respectively.
Introduction
Mollusk aquaculture plays an important role across the globe. Its production in Asia rose up to 16,000,000 t in 2017, while European production stagnated at 630,000 t. Mytilus edulis is the main species in European mollusks production (22%), followed by M. galloprovincialis (16%). Nonetheless, the total production quantity of M. edulis decreased from 190,000 t in 2,000 to 140,000 t in 2017 (FAO Database, 20191). As a consequence, the European Union (EU) has developed strategies to support mussel cultivation, which include cultivation in regions with sub-optimal growing conditions, like the brackish Baltic Sea (Blue Growth Strategy; European Comission [EC] 2013, 2014, 2017; Beyer et al., 2017). So far, low salinities, ice occurrence, little or no legislation and a lack of tradition in mussel cultivation (EUMOFA, 2019) have limited the expansion of blue mussel aquaculture in the Baltic Sea.
In the Baltic Sea, two species of blue mussels, M. edulis and M. trossulus, as well as hybrids of these, occur naturally (Peine et al., 2005; Klamt and Schernewski, 2013; Darr et al., 2014; Schiele et al., 2014, 2015; Larsson et al., 2017). As the species distribution boarders within the Baltic Sea are not clearly defined and study sites are located within a mixture zone of Mytilus species (Väinölä and Hvilsom, 1991; Larsson et al., 2017; Stuckas et al., 2017), it will further be referred to as Mytilus spp. or blue mussels as common name, combining M. edulis, M. trossulus, and potential hybrids.
Mytilus spp. are osmo-conformers and short-term osmo-regulators (Davenport, 1979). Numerous studies have found that low salinity bears the largest impact on mussel growth rates (Bøhle, 1972; Westerbom et al., 2002; Wing and Leichter, 2011; Riisgård et al., 2012, 2014; Landes et al., 2015; Maar et al., 2015). Growth rates reduce with lower salinity due to the hypo-osmotic stress with high metabolic cost, which leaves less energy for growth (Hawkins and Hilbish, 1992; Neufeld and Wright, 1996). Optimal growth is considered around 20–32 psu (Almada-Villela, 1984; Riisgård et al., 2014) and below 8 psu, mussels become dwarfed (Kautsky, 1982; Kautsky et al., 1990; Riisgård et al., 2013a). However, little is known about mussel larvae occurrences and settling densities, mussel growth rates in suspended cultures and potential mussel farm production at lower salinities in the Baltic Sea. As a result, there is a need to further explore the potential of mussel farming in the Baltic Sea, taking into account environmental and economic aspects.
To serve this need, several mussel farm trials throughout the Baltic Sea (Sweden, Denmark, Germany, Poland, Latvia, Estonia, and Finland) have been carried out within various research projects. Results of these studies are mainly published in reports, rather than scientific, peer-reviewed publications (e.g., Tørring et al., 2008; CRM, 2011; Diaz and Kraufvelin, 2013; Palm et al., 2015; Minnhagen, 2017; Lyngsgaard et al., 2019; Kotta et al., 2020). The different usages of mussel yield, besides human consumption, are under constant debate. They focus especially on mussel meal production for husbandry, poultry or aquaculture feeding (Berge and Austreng, 1989; Lindahl, 2013; McLaughlan et al., 2014). The calcareous mussel shells, commonly known as waste product, have recently been evaluated as part of the carbon trading system (Filgueira et al., 2015; Morris et al., 2018). Furthermore, mussel farming is highly discussed as nutrient remediation measure to combat eutrophication (Lindahl and Kollberg, 2008; Petersen et al., 2014, 2016, 2019; Gren and Elofsson, 2017; Hedberg et al., 2018; Taylor et al., 2019; Kotta et al., 2020; Holbach et al., 2020), to improve water transparency (Lindahl et al., 2005; Schröder et al., 2014; Timmermann et al., 2019), and to provide ecosystem services (e.g., habitat provision for other species) (Nielsen et al., 2016; van der Schatte Olivier et al., 2018; Petersen et al., 2019). Combined with other trophic levels, such as finfish and macro- or micro-algae, mussels can be part of a so-called multi-trophic aquaculture (MTA). Hereby, particulate organic matter, such as fish feed waste, fish faces and an increased phytoplankton production, will serve as feed for the filtering organisms (Holdt and Edwards, 2014).
The present study evaluates the feasibility and profitability of implementing mussel aquaculture along the German Baltic Sea coast. Therefore, four mussel farm trials were set up under differing environmental conditions, to compare mussel densities and growth. Further, a calibrated eco-physiological model was used to predict mussel growth under different environmental conditions of salinity, temperature and chlorophyll-a provided by monitoring data. Predicted mussel growth was used to determine farm harvest yields at selected sites and profit according to two harvest products (mussels for human consumption and mussels for animal feeds). In addition, the nutrient remediation potential at each site was assessed, based on known nitrogen and phosphorus contents and predicted mussel biomass. The obtained results were finally used to compare the feasibility between different sites and to make recommendations for future mussel aquaculture activities in the region.
Study Sites and Methods
Environmental Data
Long term (2007–2017) monitoring data were collected by the Federal State Agency for the Environment in Schleswig-Holstein (LLUR) and Mecklenburg Western-Pomerania (LUNG). Coastal stations (Figure 1) were sampled on a monthly basis, including measurements for salinity, water temperature, and chlorophyll a (chl-a). Water samples were taken near the surface form 0.5 to 1 m depth. Chl-a was determined fluorometric (665 nm) after filtration (GF/F, 0.7 μm), extraction with ethanol and acidification (ISO 10260:19922). Monitoring sites closest to the mussel farms (Figure 1) were chosen to compare long-term environmental conditions (salinity, chl-a, and water temperature) between sites and to force the mussel growth model.
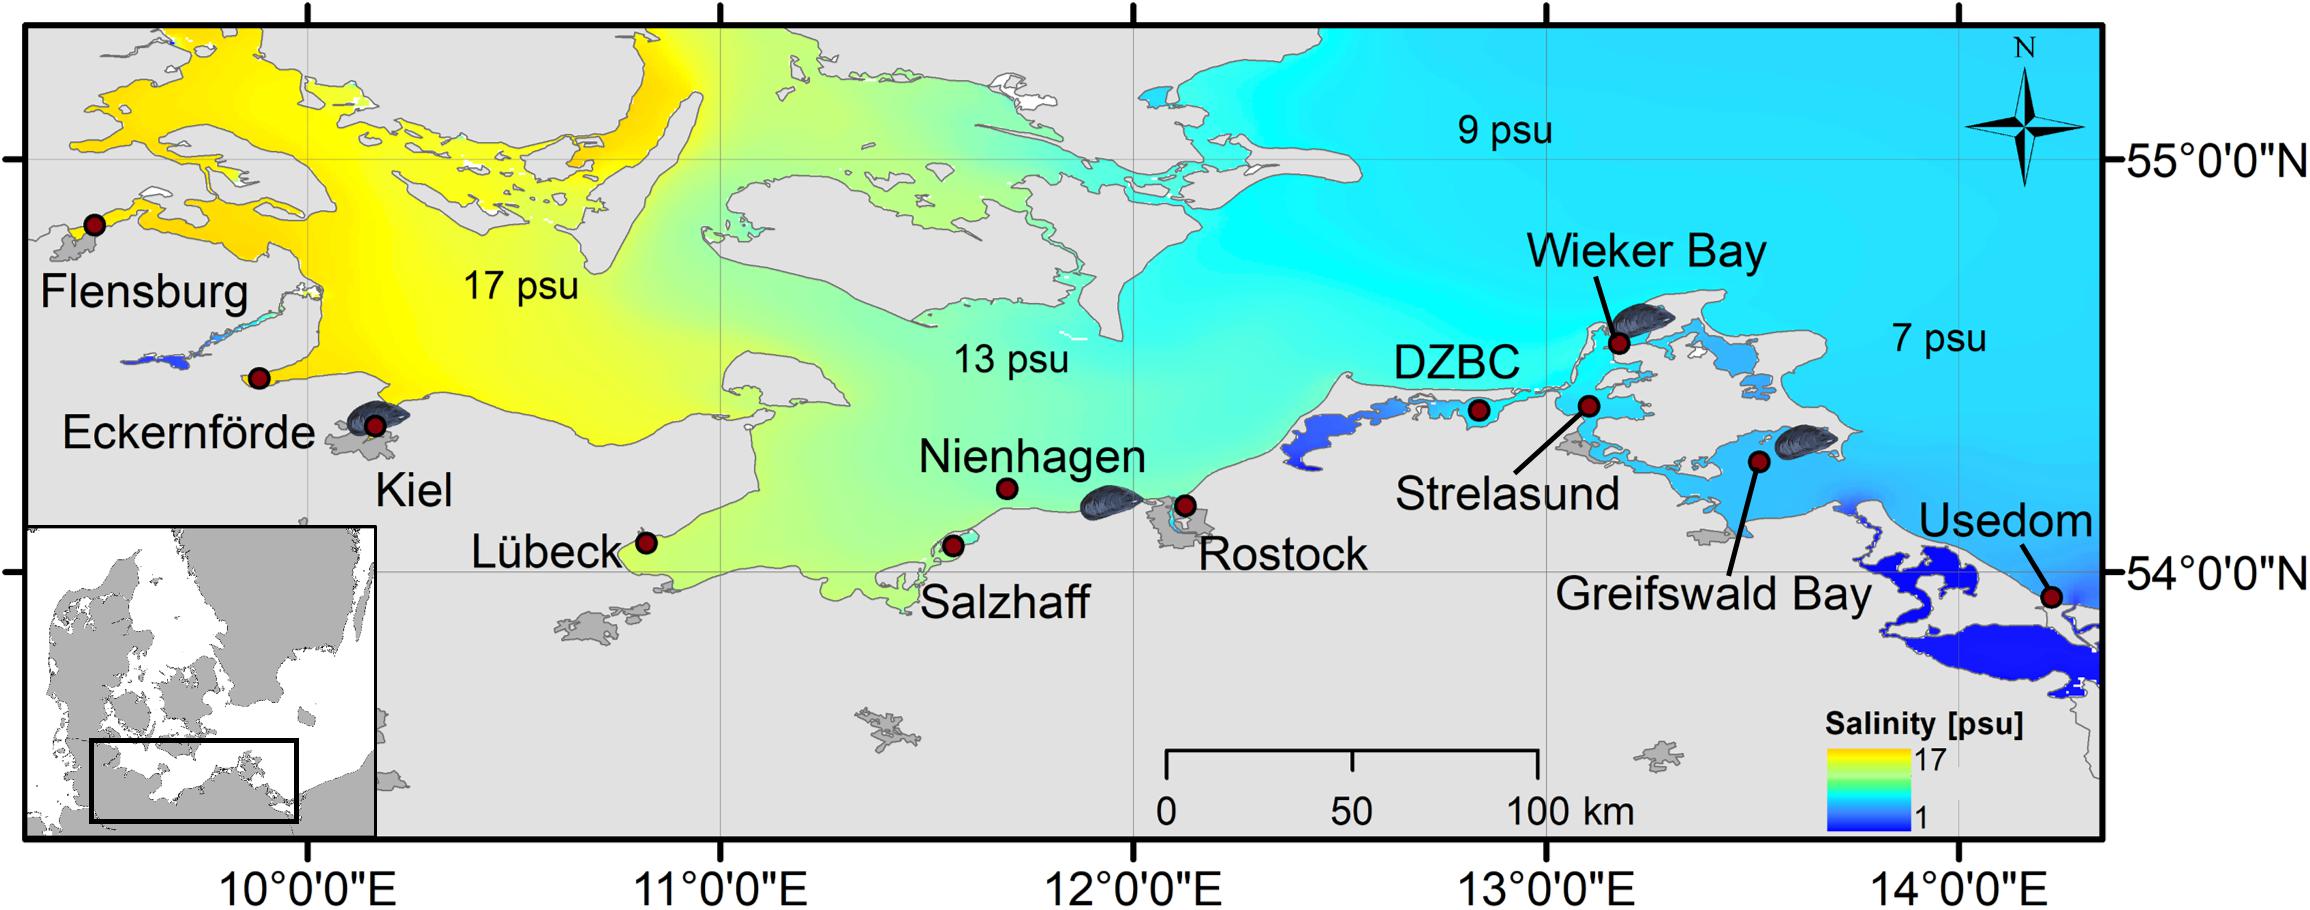
Figure 1. The four study sites with mussel farms (mussel-symbol) and the 12 stations for environmental data extraction and modeled mussel growth (red circle, labeled) along the salinity gradient of the Baltic Sea. DZBC, Darss-Zingst-Bodden-Chain.
Blue Mussel Farms in the German Baltic Sea
Trials were established at four sites along the German coast: Kiel Fjord, Nienhagen, Wieker Bay (WB) and Greifswald Bay (GWB) (Figure 1 and Table 1). At all sites, polypropylene belt spat collectors were used as a substrate for mussel settlement. In Kiel Fjord and Nienhagen, additional socking took place after 6 months. This means that mussels are stripped off the collectors, graded and transferred into so-called mussel-socks made out of a mixture of plastic and biodegradable cotton allowing mussels to grow out of the socks over time. To avoid ice damages during the winter season (November to March), farms in GWB and WB were submerged 0.5 m below the water surface.
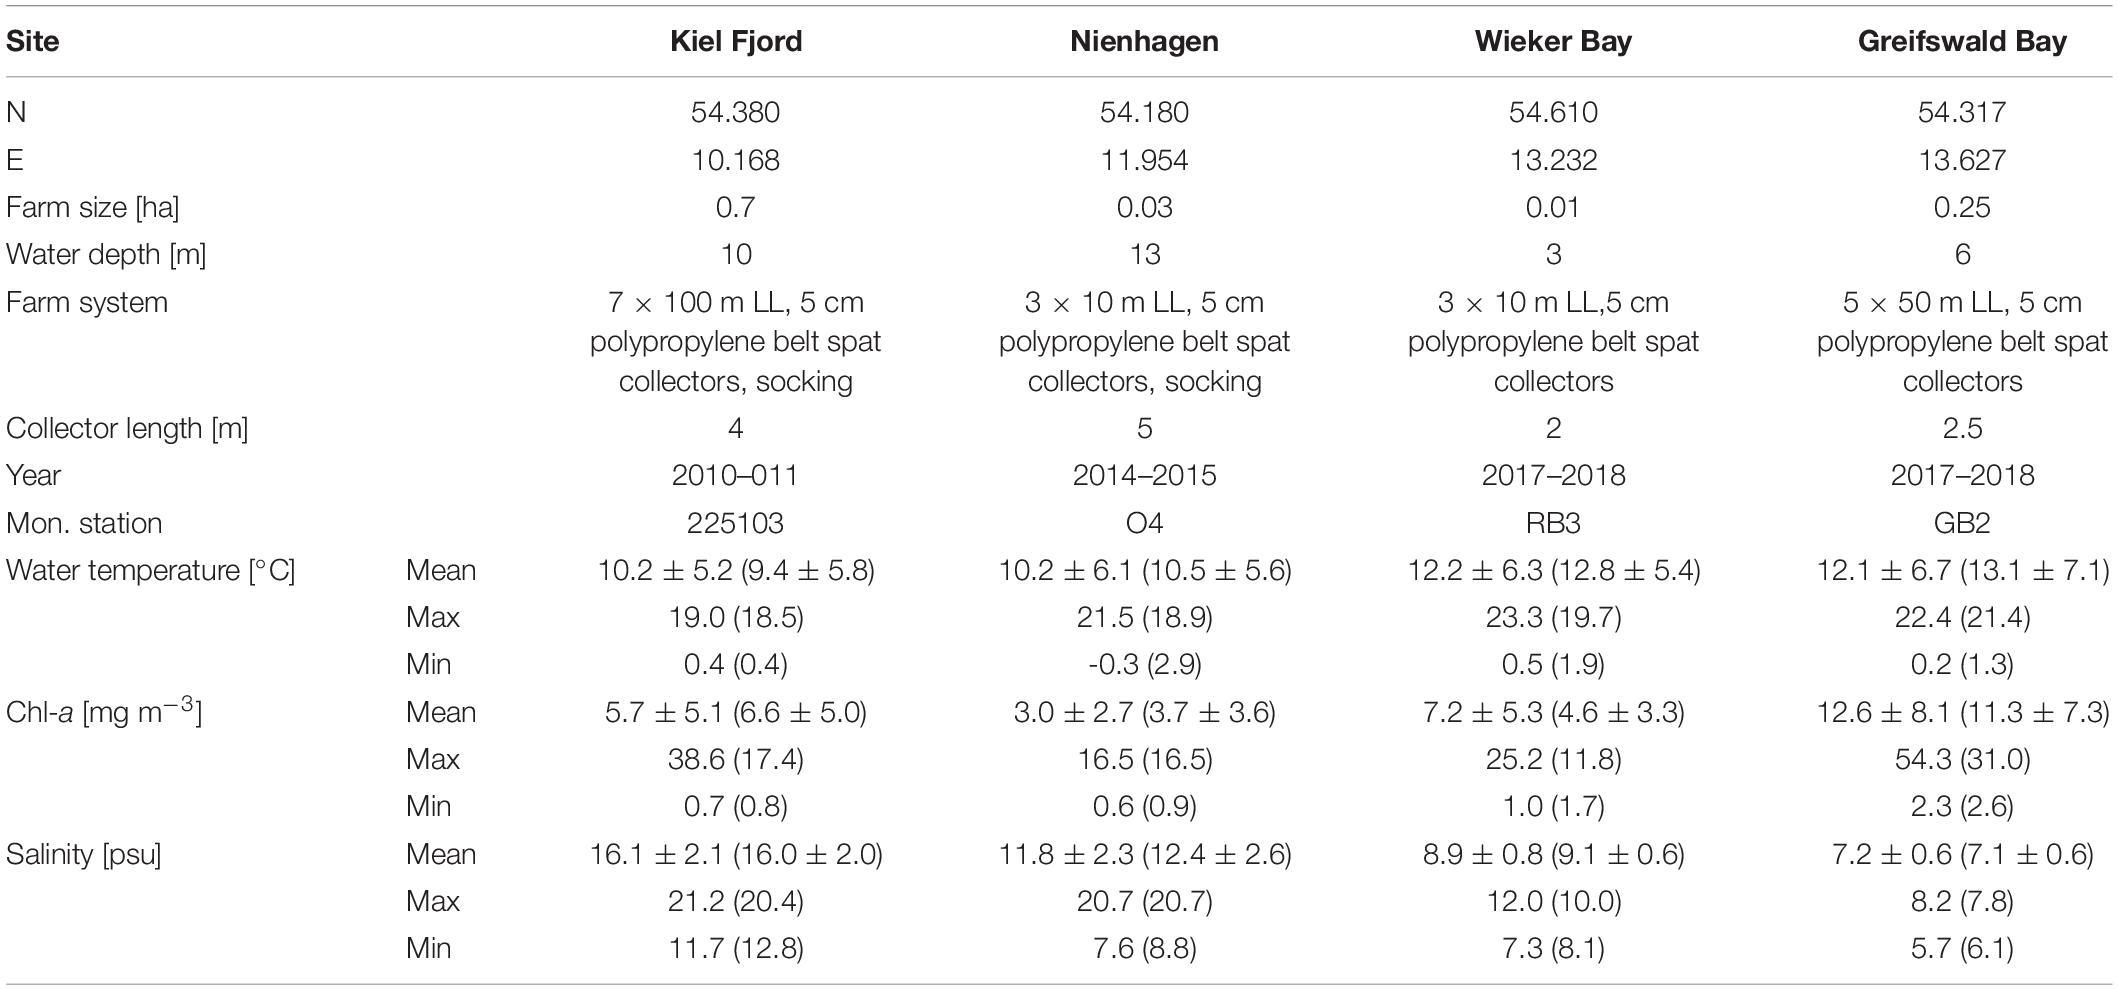
Table 1. Farm details and respective monitoring station (Mon. station) providing the environmental surface parameters for water temperature, chl-a and salinity from 2007 to 2017. Values for the respective study period are indicated in brackets.
In order to compare growth data of Baltic Sea mussels with that of North Sea mussels, data from Walter and De Leeuw (2007) was used and illustrated in the results, but not further considered, as focus lies on Baltic Sea mussels.
Growth Measurements
During each study period, mussel-sampling took place monthly except during winter for all sites and late summer 2015 for Nienhagen as well as gaps for WB samples. The amount of mussel individuals per given collector substrate was counted for density calculations. Shell lengths (SL) were measured using a digital caliper. Wet weights (WW) of mussel shells and tissue were measured using an electronic micro-scale at a minimum sample size of 10. After drying for a minimum of 24 h at 60°C, dry weights (DW) were weighted. Growth (G) was calculated from the SL increase (ΔSL, mm) divided by the number of days (Δt, d) between sampling events:
The specific growth rate (μ,% d–1) was calculated from the difference in tissue DW between number of sampling days (t) assuming exponential growth (Landes et al., 2015):
The mussel condition index (CI, mg cm–3) was assessed according to Landes et al. (2015):
To compare growth at the different study sites, an ANOVA on ranks (Kruskal–Wallis, SigmaPlot 13.0) was conducted, comparing SLs at three periods after settling. Since samples were not consistently taken at the same days at all sites, a range of up to 24 days between sampling dates for each period was accepted. The WB site was not always included due to a lack of data.
Modeling of Mussel Growth
Model Parametrization
A dynamic energy budget (DEB) model was used to predict mussel growth at for a wide range of salinities using MATLAB version R2019a (Maar et al., 2015). The DEB model is a deterministic, eco-physiological model describing the energy flow through the mussel in response to temperature, salinity and chl-a concentrations (proxy for available food) (Supplementary Figure S1). The DEB theory was originally developed by Kooijman (1986, 2010) and the applied DEB model for blue mussels is parameterized according to previous studies (van der Veer et al., 2006; Saraiva et al., 2011; Maar et al., 2015). The DEB model was applied because it has the highest physiological complexity including a salinity response and high accuracy in predicting mussel growth in comparison with other mussel growth models (Beadman et al., 2002). Phytoplankton is considered as the main food source for mussels in micro-tidal, eutrophic coastal areas with high chl-a concentrations (Petersen et al., 2013). Particulate organic carbon (POC) is another potential food source for mussels (Navarro et al., 1996) and highly correlated to the chl-a concentrations in the southern Baltic Sea (Maciejewska and Pempkowiak, 2014). Nevertheless, the food preference and assimilation efficiency of POC is lower than for phytoplankton food and POC was shown to be less important for mussel growth compared to phytoplankton biomass in a similar eutrophic system (Filgueira et al., 2018). Chl-a concentrations were therefore used as a proxy for available food in the calibration of the DEB model. Mussel ingestion follows a Holling type II saturation function versus chl-a concentrations and ceases at chl-a concentrations <0.5 mg m–3 due to valve closure (Dolmer, 2000; Maar et al., 2018). Filtration was not affected by salinity assuming local adaptation (Riisgård et al., 2013a), although abrupt changes in salinity has been observed to induce short-term valve-closure (Almada-Villela, 1984). The ingested food is assimilated by a constant assimilation efficiency up to 17 mg-chl-a m–3, where upon it decreases exponentially due to oversaturation of the digestive system (Riisgård et al., 2013a). The exponential function [KA = exp(−0.03 × (chl-a − 17) for chl-a > 17 mg m−3)] is based on net growth efficiency data from Riisgård et al. (2013b) with chl-a concentrations varying from 4.1 to 67.8 mg m–3 (n = 7, R2 = 0.85, their Figure 5, ignoring one value at low salinity). The assimilated food goes to the reserve density (mol-C cm–3). Energy is allocated from the reserve density with the fraction κ = 0.7 to somatic growth (expressed as structural volume, cm3) and somatic maintenance, whereas the fraction (1-κ) is allocated to maturity or reproduction (mol-C) and the related maintenance. Maintenance costs were described as a function of structural volume and temperature (Supplementary Table S1). The somatic maintenance cost was increased from the value applied in Maar et al. (2015) to get more realistic maximum SLs (∼15 cm at salinity >16.2) for the applied longer growth period of 1–2 years (Dolmer, 1998; van der Veer et al., 2006). The growth response to low salinities is described as an extra maintenance cost due to osmoregulation (Maar et al., 2015). Osmoregulation is assumed to be proportional to mussel surface area and salinity (Kooijman, 2010; Maar et al., 2015). The extra maintenance cost is added to the energy allocation from reserves and distributed to somatic growth and reproduction using the κ-rule. This approach was slightly different from Maar et al. (2015), where only structural growth paid for the extra maintenance cost based on one month of mussel growth data. However, the old approach gave an imbalance between somatic and reproductive tissue for a longer growth period >1 year, including too much spawning. Ingestion and assimilation rates are modified by the Arrhenius dome-shaped temperature function with maximum rates at 20°C (van der Veer et al., 2006; Maar et al., 2018), whereas the maintenance rate is modified by the standard Arrhenius exponential temperature response (Teal et al., 2012). Spawning takes place above a temperature threshold of 9.6°C and above the gonado-somatic index of 0.25. During severe starvation, the somatic and reproductive tissue can pay for somatic maintenance. SL was estimated from the structural volume and a constant shape factor except that SL is not reduced during severe starvation. DEB parameters and equations can be found in Supplementary Material (Supplementary Tables S1, S2).
Model Calibration and Validation
The salinity response in the model was re-calibrated against Nienhagen mussel growth data for the sampling period 5th Nov, 2014 to 1st Oct, 2015. The salinity maintenance cost coefficient was estimated by an iterative process until the lowest root-mean-square difference (RMSD) between measured and modeled tissue biomass was obtained. The resulting maintenance cost coefficient was adjusted from 1.8 × 10⁻⁵ mol-C cm–2 d–1 to 2.9 × 10⁻⁵ mol-C cm–2 d–1 in the modified salinity response and we applied a threshold <16.2 for the salinity effect (Almada-Villela, 1984). Regression analysis of measured versus modeled SLs and tissue biomass was used to evaluate the calibration results. Initial mussel data was obtained from the measured SL on 5th Nov (26 mm) converted to structural tissue using the DEB model shape-factor and reserves were assumed to be 50% of maximum. The mussels were assumed not to have developed reproductive tissue. The farm was very small and no severe food depletion was detected within the farm. Time-series of temperature, salinity, and chl-a were obtained from monitoring data (Table 1) and interpolated linearly over time. Missing values during winter were obtained from monthly means (2007–2017) from the same monitoring station.
The DEB model was validated against measured mussel biomass and SL from the mussel farms in Kiel Fjord 2010–2011 and GWB 2017–2018 using regression analysis. WB could not be modeled for the entire sampling period, because there was a drop in SLs over winter 2017–2018 probably due to a loss of larger mussels. Additionally, new settlements of mussel spat occurred in August 2018. The DEB model was therefore applied from April to July 2018 in WB, assuming to follow the same cohort of mussels over time. Initial SL was based on the first field measurement (5.3 mm 6th Sep, 2010 for Kiel Fjord farm, 1.5 mm 12th Jul, 2017 for GWB, and 11 mm for WB 9th Apr, 2018) converted to biomass as described for Nienhagen. Forcing data of temperature, salinity and chl-a concentrations was obtained from monitoring data (Table 1). Missing values (2 months in Kiel and 5 months in GWB) were replaced by monthly means (2007–2017) from the same monitoring station. Monthly monitoring data did not capture the heat wave during summer 2018 (up to 25°C in July), probably due to the coarse temporal resolution. We therefore applied modeled daily temperatures from the Saltbaltyk database3 as forcing data to GWB. The Kiel farm is bigger than the other farms and an average chl-a depletion of 20% was applied according to observations (Schröder et al., 2014). No severe depletion was detected in the smaller farm of GWB.
The uncertainty related to the threshold for food over-saturation was tested by changing the applied threshold of 17 mg m–3 in the standard run to 10, 12, 14, and 20 mg m–3 in GWB with the highest food concentrations. We further tested the model sensitivity to the environmental forcing variables and selected DEB parameters by changing the values ± 10% for the GWB, Kiel Fjord, and Nienhagen models for a growth period of 1 year. The sensitivity index, SI (%), was estimated as (Bacher and Gangnery, 2006):
where n is the total number of time-steps, t is the time-step number, is the tissue biomass at time t predicted by the standard run and is the tissue biomass at time t predicted by the sensitivity run. The SI was estimated as the mean value for each parameter and site. The tested DEB parameters were the Arrhenius temperature coefficient, the salinity maintenance cost coefficient, the half-saturation food coefficient (all three related to the environmental forcing variables), the somatic maintenance cost coefficient (which was changed from previous version) and the initial weight of mussel tissue.
Application of the DEB Model
The DEB model was finally applied to twelve monitoring stations at a salinity gradient (7–17 psu) along the German coastline using long-term monthly means of temperature, salinity and chl-a concentrations based on monitoring data (years 2007–2017) from each station (Table 1). Modeled tissue DWs were transformed into total WWs by the factor 0.086 (Nielsen et al., 2016; Taylor et al., 2019; data of this study) for economic evaluation. The heat wave in summer 2018 was not included in the forcing data period, because it was considered as a special event. We assumed a farm size similar to the Kiel farm with 20% chl-a depletion (Schröder et al., 2014). Initial mussel SL was 3.2 mm (GWB 3rd Aug) and the growth period was 18 months until final harvest. Modeled data combined with former studies on mussel farm densities were used to estimate production capacity along the German Baltic Sea as well as generating an outlook of mussel farming in low saline waters.
Economic Profitability
To compare potential mussel harvest and profit, a uniform, 1-ha longline system was adopted, with 10 longlines at a distance of 10 m to each other. A total of 5 cm polypropylene belts served as spat collectors with 0.5 m gaps in between. Collector length varied from 2 to 4 m, depending on the water depth. An average mussel density of 1,700 Ind m–1 after 6 months and 280 Ind m–1 after 18 months was used based on Taylor et al. (2019) and Haas et al. (2015). Additionally, a mussel loss of 10% was applied throughout the growing period due to natural loss (self-thinning), handling (maintenance, grading, socking, and cleaning), and non-marketable sizes (for human consumption mussels) (Frechette et al., 2010; Cubillo et al., 2015; Haas et al., 2015; Nielsen et al., 2016; Taylor et al., 2019). This might change with salinity, but was not evaluated in former studies or this study. Furthermore, for the production of mussels for human consumption, only half of the farm area can be harvested each year, because new spat is already collected within the other half to ensure a continuous production cycle. Mussels above 45 mm SL are assumed as suitable for human consumption in Denmark (personal communication Petersen and Taylor, 2019) and were adjusted to 50 mm for the German marked, orientated after Krost et al. (2011).
Yearly running costs were defined based on Krost et al. (2011), and separated into pre- and post-initial investment costs. Initial investment costs were divided into the first 5 years of production, following the depreciation rate of a mussel farm outlined by Krost et al. (2011). After the first five years, annual costs were only a function of the running costs (Table 2). Costs were differentiated between mussel production for human consumption and for animal feed. The latter is associated with lower production costs, as there is no longer a need for certain materials and machinery (e.g., socks) and the labor is halved (Haas et al., 2015).
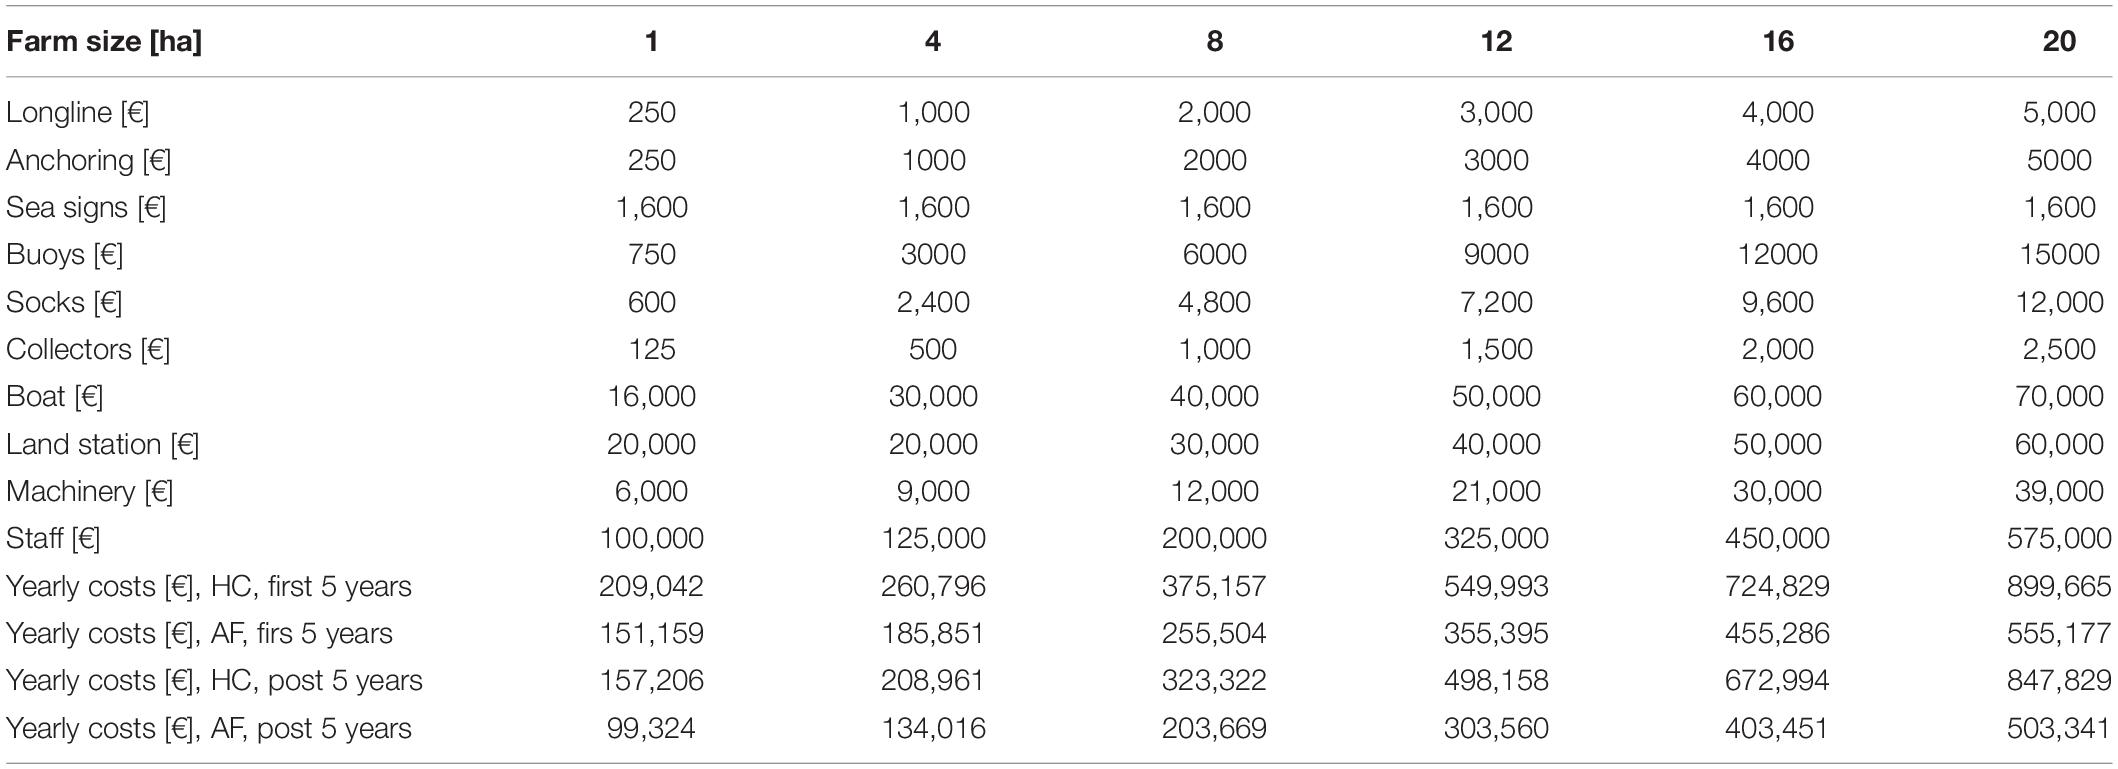
Table 2. Yearly costs [EUR, €] for mussel farms of different size and usages: human consumption (HC) and animal feed (AF); divided into running costs including (first 5 years) and excluding (post 5 years) investment cost.
In a second step, an increase in farm size was applied to reduce production costs and again estimate profitability (Table 2). Subsequently, farm size [ha] was converted into cultivation volume [m3] to compare 1 ha farms at different cultivation depths, hence, length of collector lines (2, 3, or 4 m), depending on the regional water depth. At water depths <6 m, collector length was set to 2 m, at 6 to 8 m water depth to 3 m, and >8 m water depth, collector length was set to 4 m.
To assess profitability, a sales price of 0.06 € kg–1 was assumed for fresh animal feed mussels (Haas et al., 2015; Schernewski et al., 2018). How companies proceed with the feed mussels and which further costs occur by this process was not included in this study. For human consumption mussels, high- and low-end estimates were obtained from existing industry data: Kieler mussels are sold for 11 € kg–1 (Kieler Meeresfarm GmbH, 20194) while mussels from the North Sea are sold for 2.19 € kg–1 (SH, 20185). The cost-efficiency of mussel farming as a nutrient reduction measure was evaluated by comparison with other mitigation measures studied by Gren et al. (2008). For mussel farming, an average nutrient uptake of 1.2% N and 0.05% P of total WW was assumed based on Petersen et al. (2014). Different from many other measures, mussel farming reduces N and P at the same time. For comparison, all cost and revenue data has been converted into 2018 EUR.
More details on the methodology to assess economic profitability can be found in the Supplementary Material (see section “Methodology to Assess Economic Profitability”).
Results
Environmental Data
Environmental parameters of the different study sites and years are presented in Figure 2 (lower graphs). Salinities during the study period were highest in Kiel Fjord (17.0 ± 2.3 psu) and lowest in GWB (7.10 ± 0.6 psu) (Table 1 and Figure 2). Salinities in Kiel and Nienhagen had a higher variability due to saltwater inflows from the North Sea and their open coast location. Chl-a and water temperature varied naturally throughout the year, but were highest in the shallow and semi-enclosed bays WB and GWB (Table 1 and Figure 2).
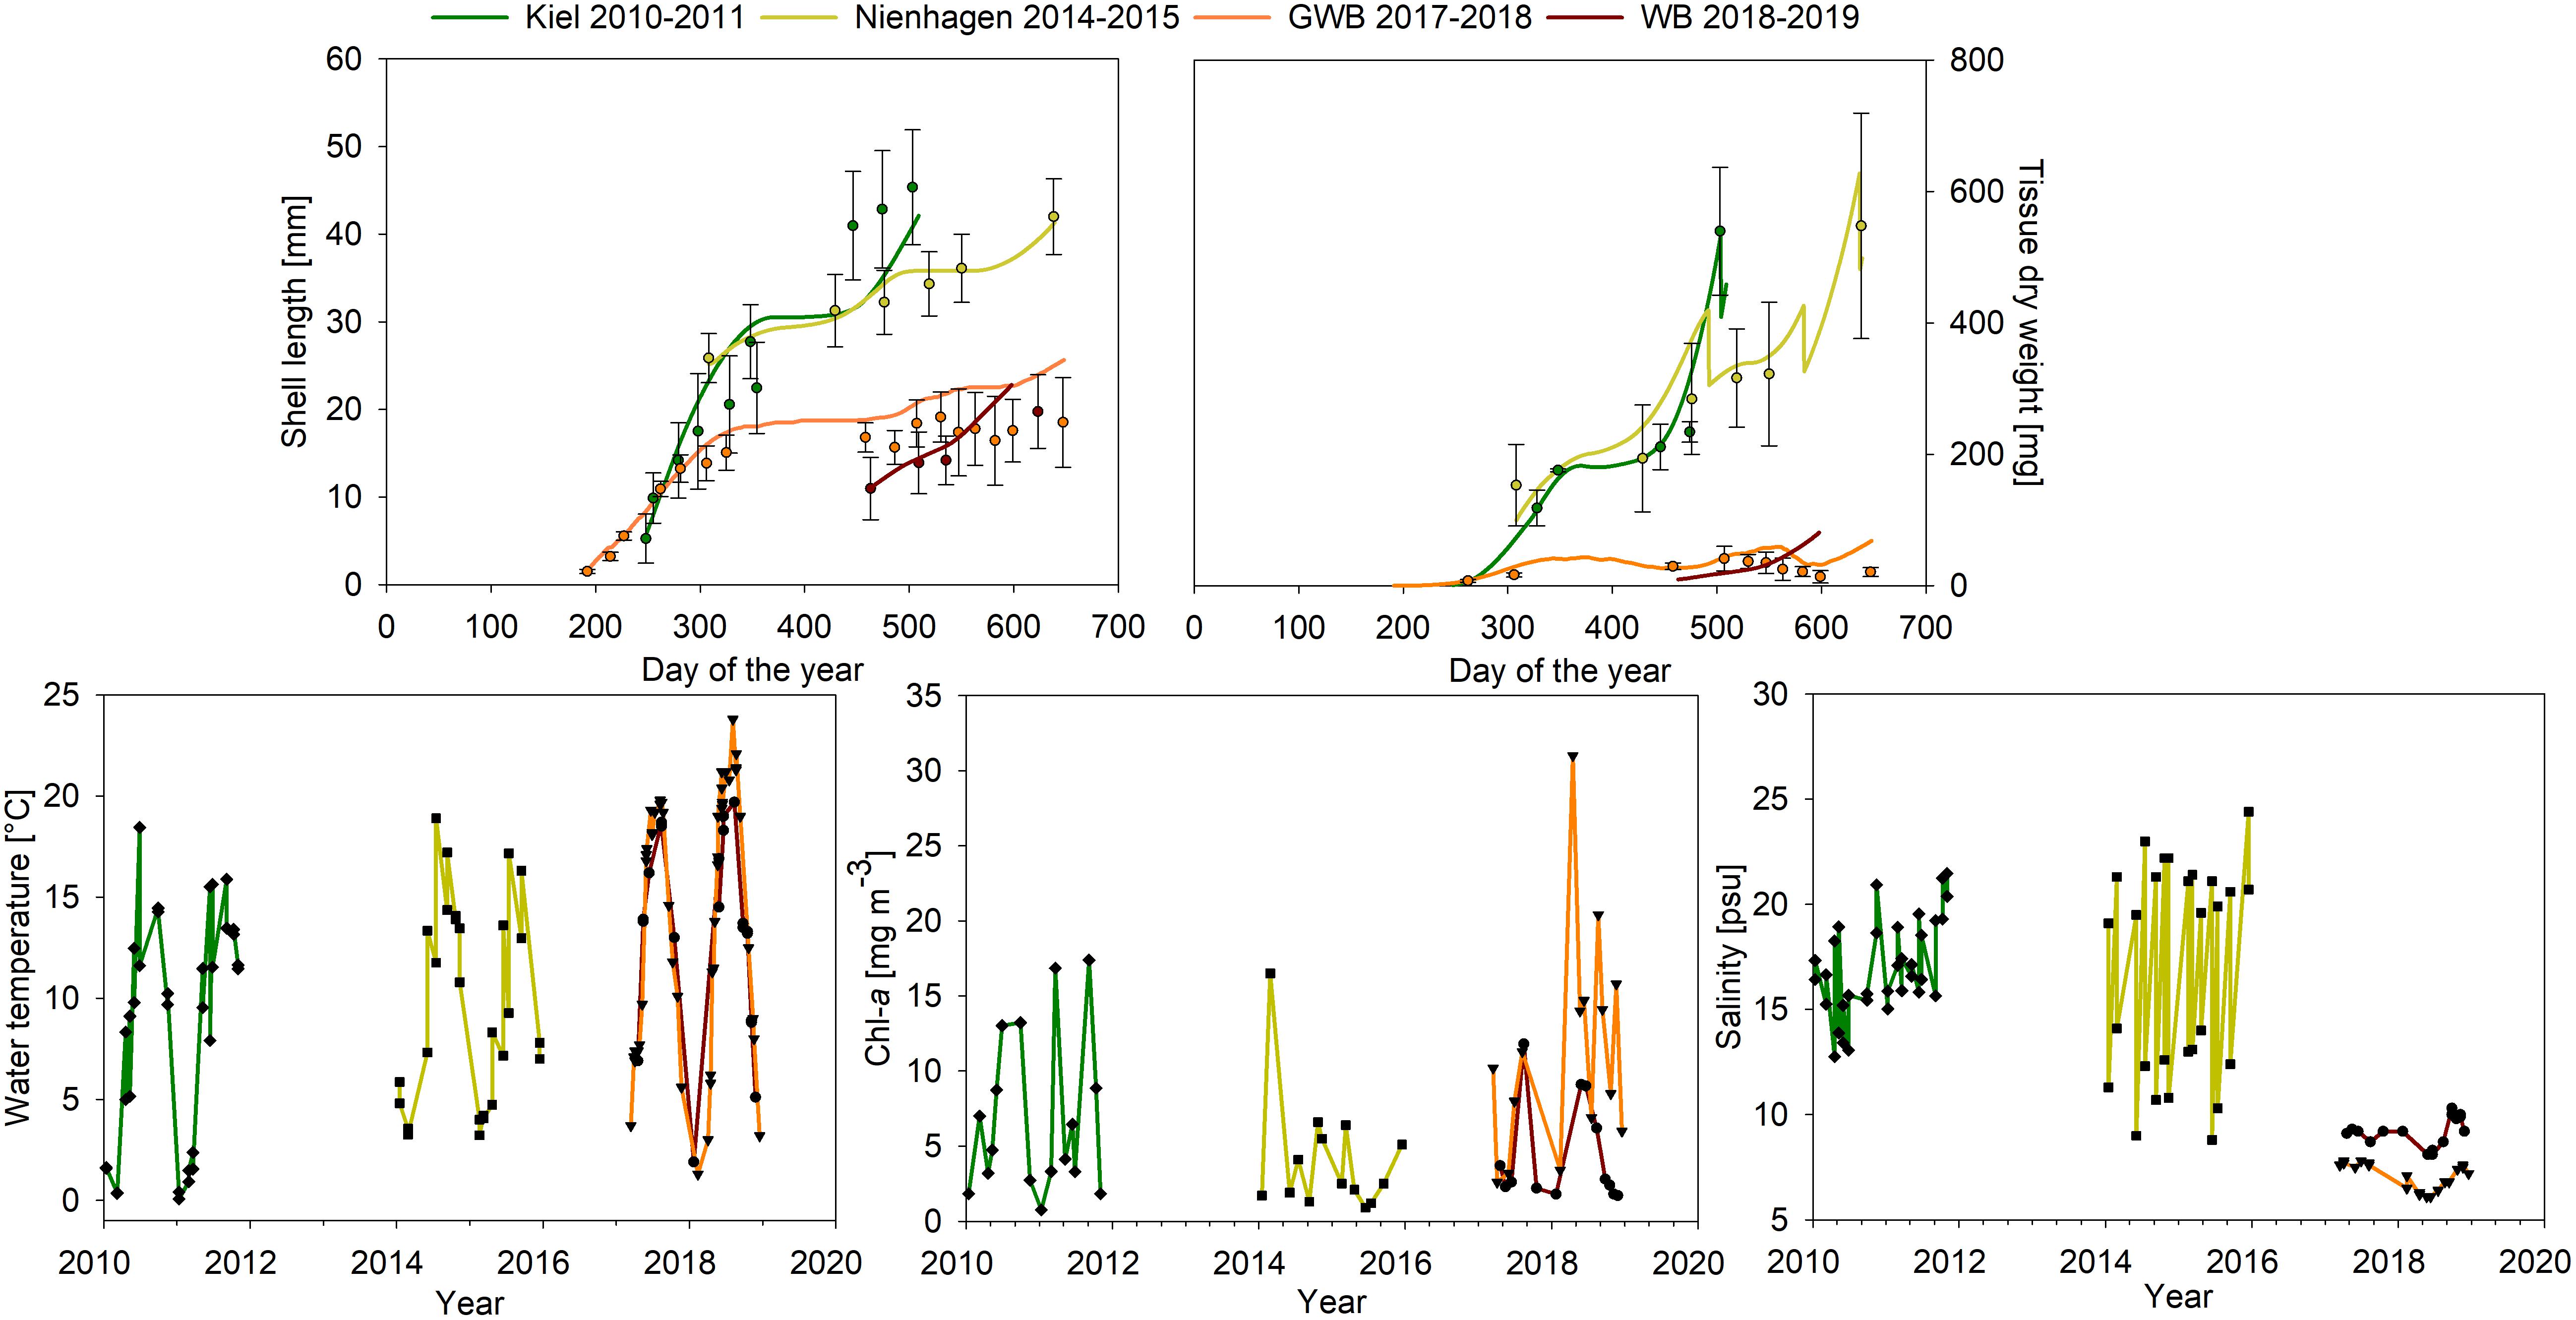
Figure 2. Upper graphs: Model results from the four study sites Kiel (green), Nienhagen (yellow), WB (red), and GWB (orange) compared with measured data for SL and tissue DW. Lower graphs: water temperature, chl-a concentration and salinity at study sites during the study period (monitored data of LLUR and LUNG).
Blue Mussel Farms in the German Baltic Sea: Settling and Growth
Results showed high variation of mussel density between sites, but also seasonally (from spat fall to harvest) for each site (Table 3). Shell growth rates decreased with salinity from the North Sea to GWB. Specific growth rates were based on tissue DW and these results were fewer than for SLs as well as negative for GWB, since weight decreased during the heat wave in summer 2018 after approximately one year of growth (Table 3 and Figure 2).
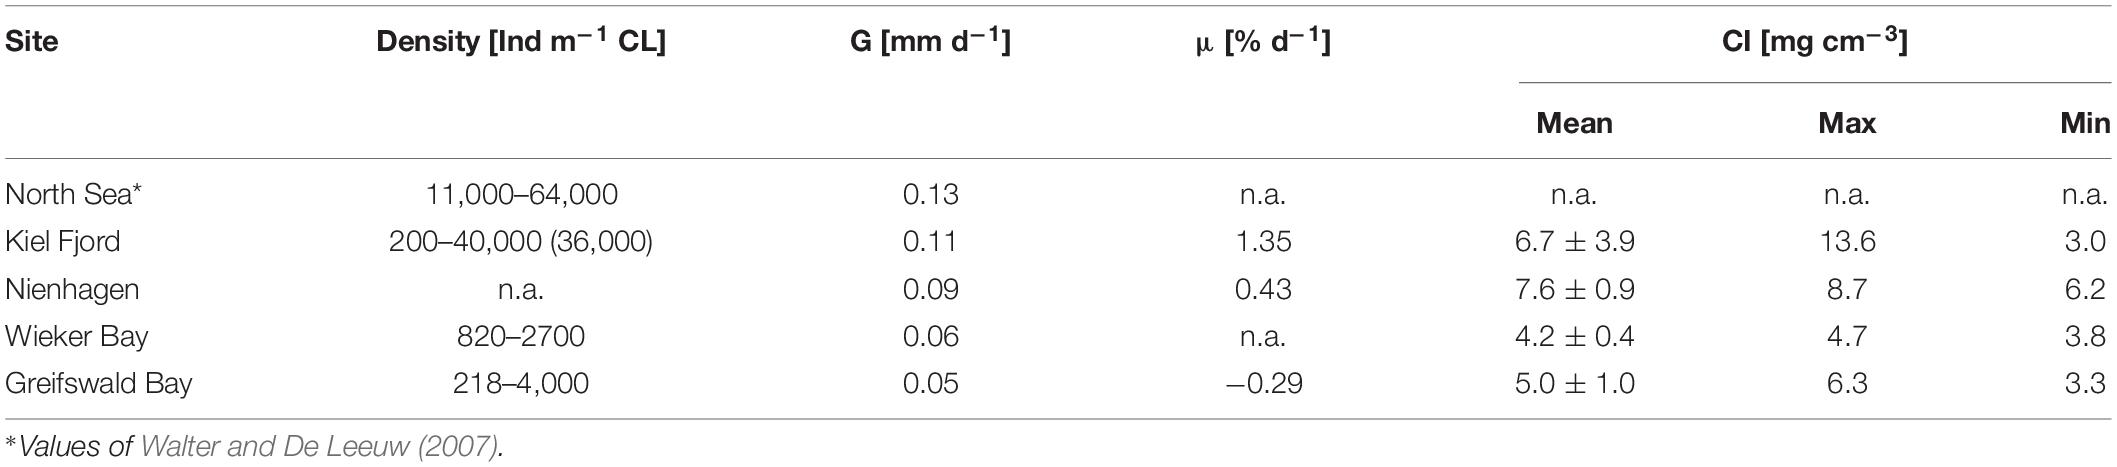
Table 3. Settling density (individuals per meter of collector line, CL), shell growth rate (G), specific growth rate (μ), and mussel condition index (CI).
Settling took place in June and July at all sites except for Nienhagen, which provided settling substrate only in August. Nonetheless, the mussels in Nienhagen picked up growth fast. Mussel CI showed on average lower values at low salinities (GWB and WB) compared to the other, more saline areas (Tables 1, 3). The CI had the highest range in Kiel Fjord, where it was high during winter (13.6 mg cm–3 in November 2010) and low in spring (3.0 mg cm–3in April 2011) after spawning. In Nienhagen, CI varied only slightly, with higher values (8.7 mg cm–3) in winter (November, 2014) and lowest values (6.2 mg cm–3) in spring (March, 2015). In WB, CI was 4.7 mg cm–3 in November 2018 and 3.8 mg cm–3 in June 2018. In GWB, CI was lowest in October 2018 after the heat wave (3.3 mg cm–3) and highest in September 2017 (6.3 mg cm–3).
Significant differences in SLs after settling appeared between sites after (i) 79–98 days between Nienhagen and the other sites (p < 0.001), (ii) 153–167 days between Kiel Fjord and GWB (p < 0.001) and Nienhagen and GWB (p < 0.001), and (iii) 314–338 days between all sites (p < 0.001) except between GWB and WB (Kruskal–Wallis One Way Analysis of Variance on Ranks, SigmaPlot 13.0).
Sites in WB and GWB recorded a high mussel loss in the summer of 2018 of around 80% (mostly due to fall offs). Densities in GWB declined from 4,000 Ind m–1 in November 2017 to 218 Ind m–1 in October 2018. Shell growth of the remaining mussels stagnated and decreased (Figure 2), while tissue DW and hereby mussel condition (CI) also reduced (Figure 2). In GWB, no new spat settlement took place in this summer, while in WB, new settlement occurred in late summer (August/September).
DEB Modeling of Mussel Growth
The salinity response in the DEB model was re-calibrated against measured growth data from Nienhagen (2014–2015) by minimizing the RMSD and model results showed a significant correlations with measured biomass (r2 = 0.92, n = 6, p < 0.0001) and SL (r2 = 0.97, n = 5, p < 0.0001). The DEB model was validated against data from Kiel (2000–2011) and showed significant correlations with biomass (r2 = 0.94, n = 5, p < 0.0001) and SL (r2 = 0.81, n = 9, p < 0.0001).
During the heat wave in summer 2018 for GWB, the model predicted a decrease in biomass although less pronounced than for observations, but overestimated growth in October 2018 after the heat wave (Figure 2). Hence, the correlation between data and model was only significant for mussel tissue if the last data point from 19th Oct, 2018 was ignored (tissue DW: r2 = 0.47, n = 9, p = 0.04), whereas it was significant for all data points for SL (r2 = 0.93, n = 15, p < 0.0001).
The model test of using other thresholds for food over-saturation did not improve the model fit (lower r2) for GWB compared to the standard run and underestimated the mussel biomass especially during the spring bloom (data not shown). The model sensitivity study showed that mussel growth in GWB responded strongly to changes in temperature and salinity, but not to food levels (Figure 3). Nienhagen responded strongly to changes in salinity and moderately to temperature and food. The responses of the Kiel farm were less than for other farms and related to temperature and salinity. The model formulation was most sensitive to the salinity stress coefficient, but not to the Arrhenius temperature coefficient, the half-saturation food coefficient (except for Nienhagen), somatic maintenance cost or the initial weight of the mussels (Figure 3).
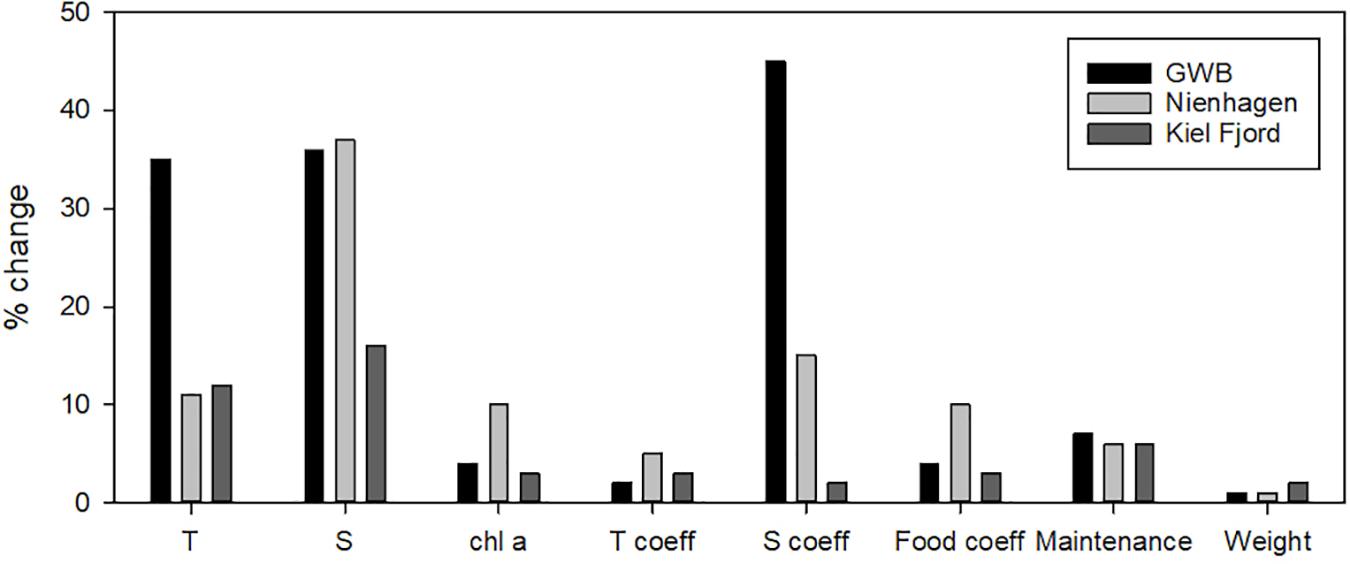
Figure 3. Model sensitivity study showing the change (%) in mussel tissue to ±10% changes in temperature (T), salinity (S), chl-a concentrations, the Arrhenius temperature coefficient (T coeff), the salinity maintenance cost coefficient (S coeff), the half-saturation food coefficient (Food coeff), the somatic maintenance cost coefficient and the initial weight of mussel tissue.
The comprehensive modeling of individual SL and tissue DW for 12 stations revealed a high variability along the natural salinity gradient of the German Baltic coast (Table 4 and Figure 4).
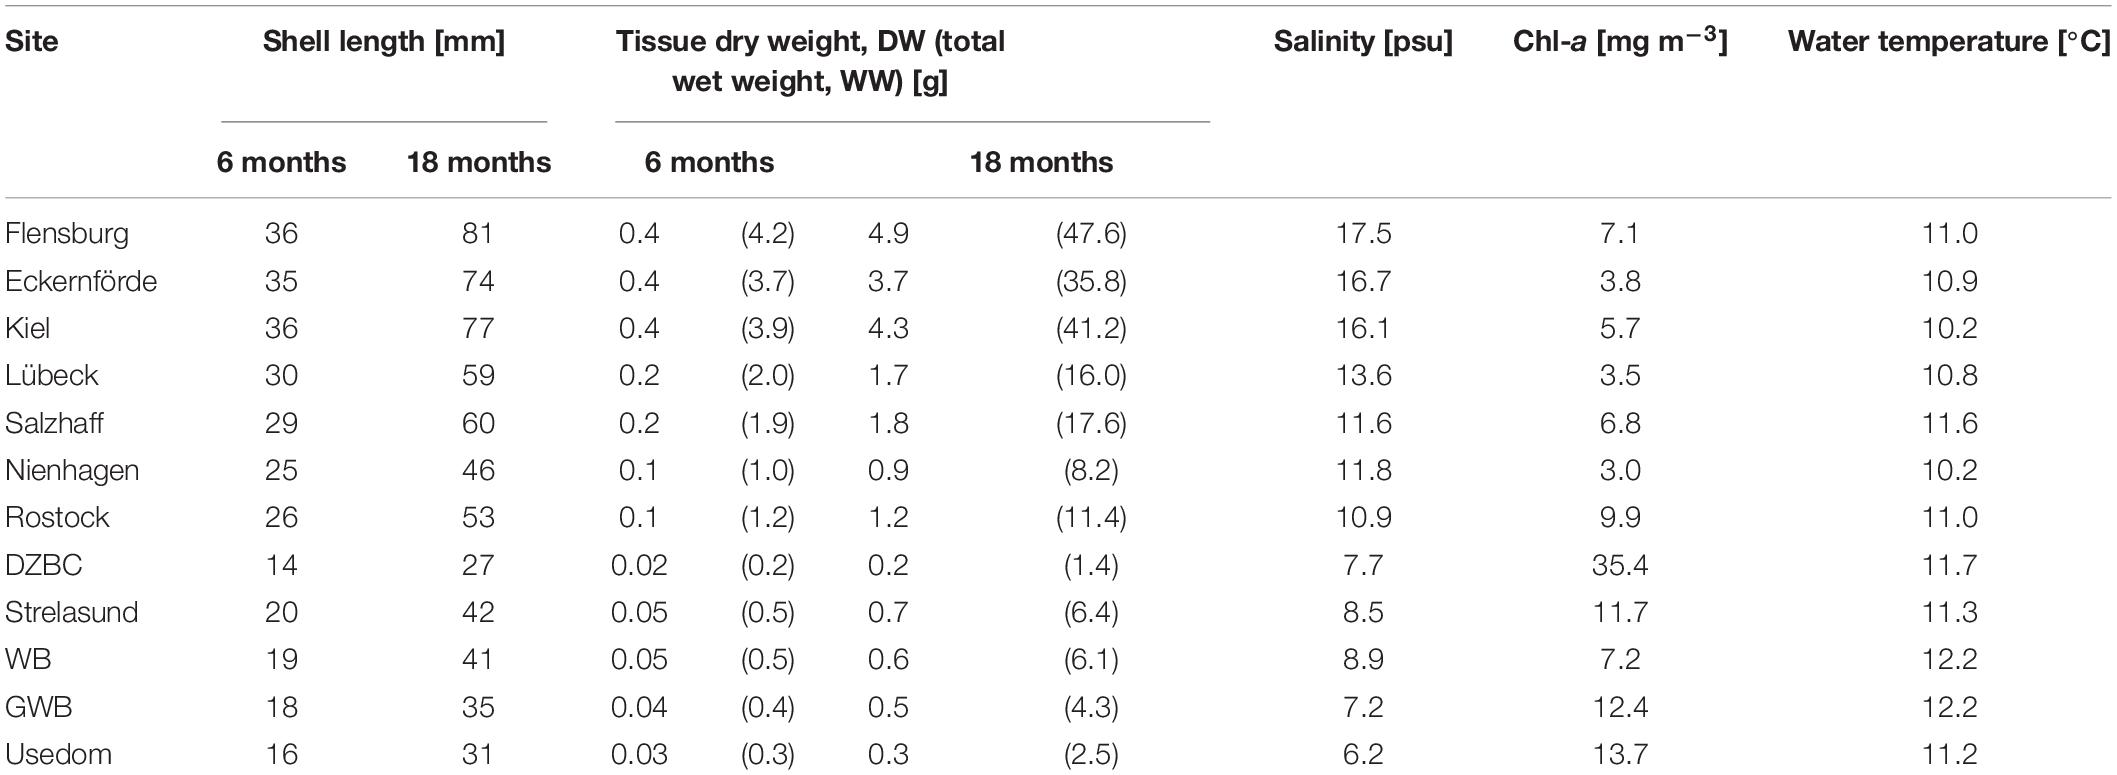
Table 4. Modeled shell length and tissue dry weight (DW) as well as calculated total wet weight (WW) after 6 and 18 months.
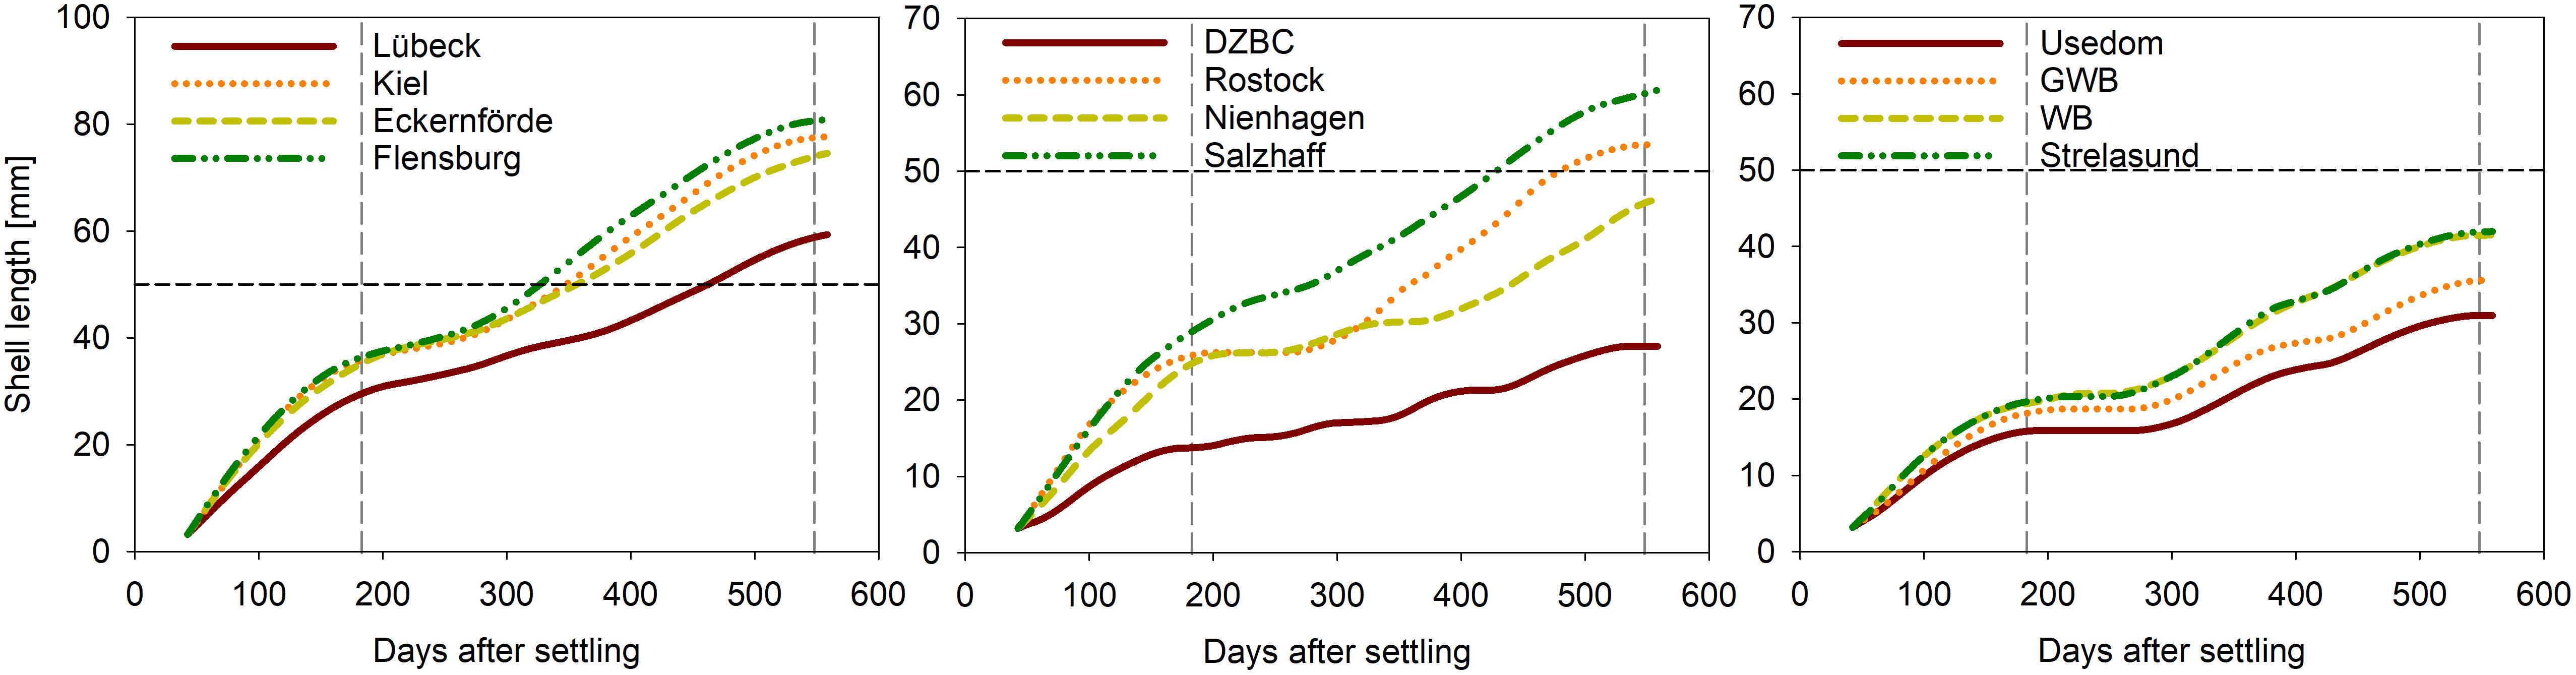
Figure 4. Modeled shell growth of mussels at twelve stations along the German Baltic coast covering salinities from 7 to 17 psu (Figure 1).
Mussels at sites west of Rostock with salinities above 10 psu (Table 4 and Figure 4) reached the 50 mm threshold within 18 months, except of Nienhagen, where chl-a concentrations were lower than for other sites (Table 4). Modeled individual tissue DW after 6 (18) months ranged from 0.02 (0.2) g in the DZBC to 0.4 (4.2) g by Flensburg. Mussels east of Rostock did not reach 50 mm SL after 18 months but varied from 27 mm (DZBC) to 42 mm (Strelasund) (Table 4).
Economic Profitability
Based on modeled mussel yields (Table 5), mussel farms east of Rostock are unable to produce mussels for human consumption (>50 mm) within 18 months, hence, they are no longer considered for profitability in this regard. As for animal feed production, none of the studied farms were found to be profitable, even with increasing farm size. This is due to the low market prices of 0.06 € kg–1.
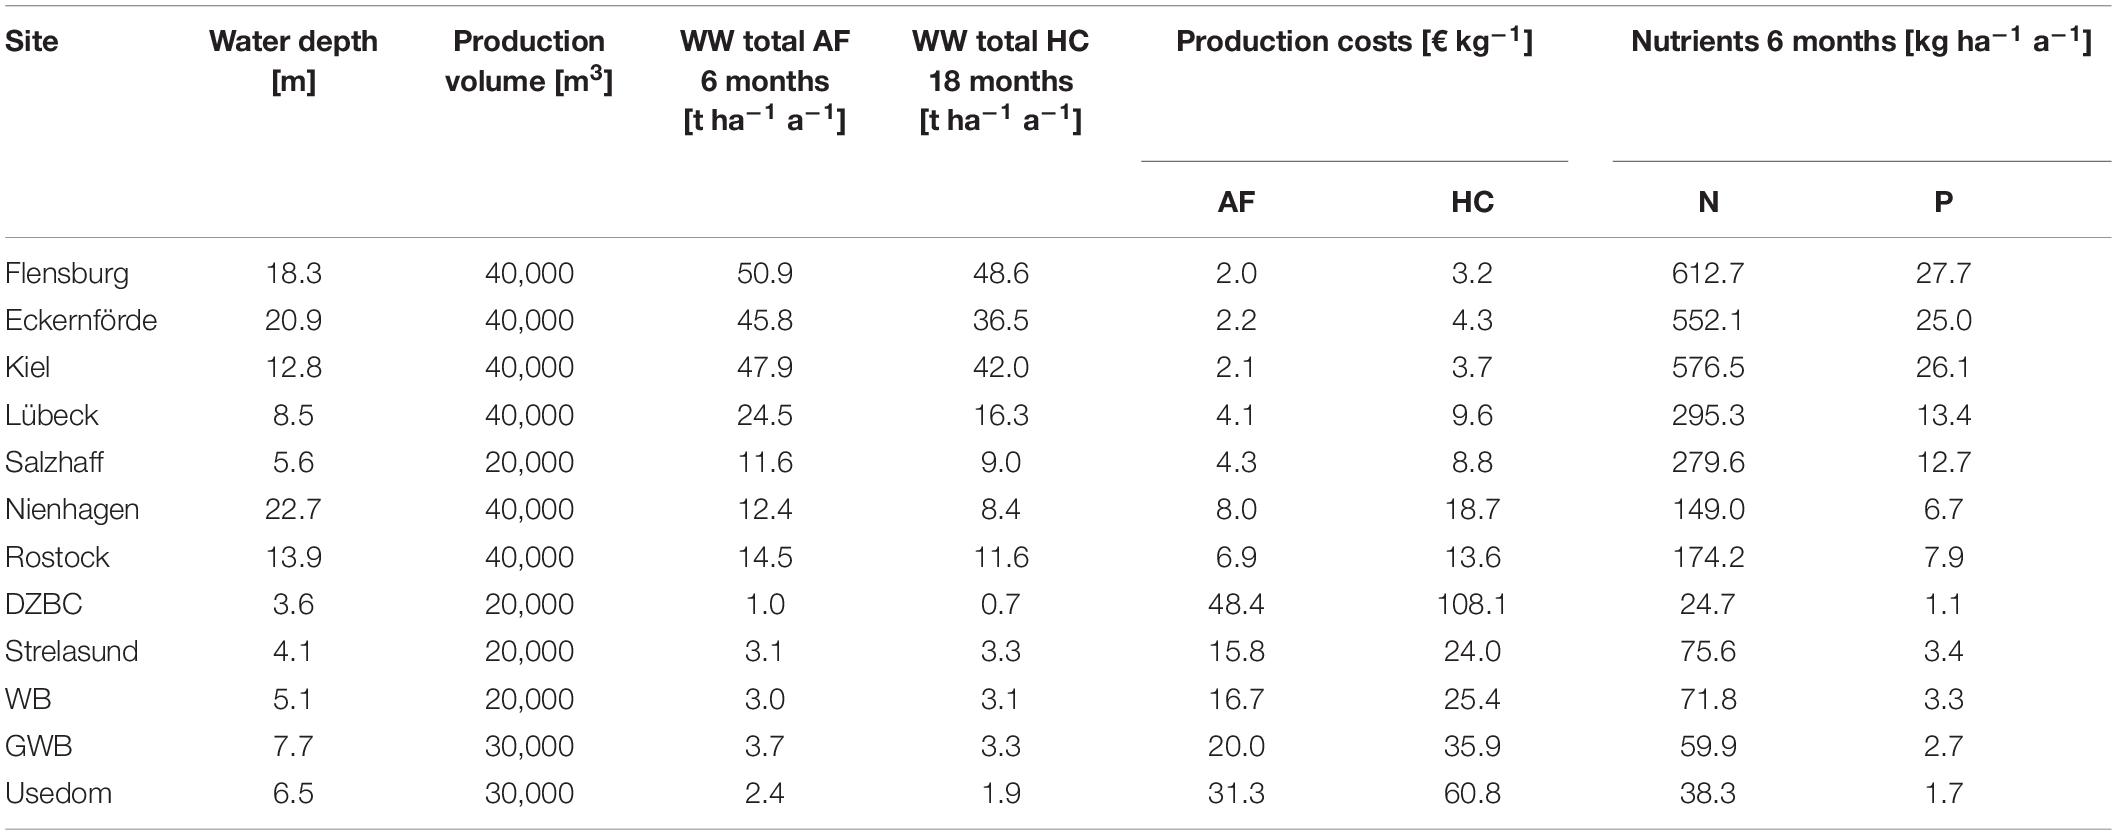
Table 5. Potential yearly mussel harvest (total wet weight, WW) for animal feed (AF) and human consumption (HC) for an established 1 ha farm, production costs for each (without upfront investment costs), as well as yearly nutrient removal [kg ha–1 a–1] if harvested as animal feed mussels. Production volumes result from water depth and applicable collector length (2, 3, or 4 m).
Production costs decreased with increasing farm size, but the minimal threshold of 0.7 € kg–1 as in the Limfjord was not reached at any of the farm sites (Figure 5a). If sold as a local specialty for 11 € kg–1, mussel farming in Kiel Fjord could already be profitable at a cultivation volume of 40,000 m3 (1 ha). If sold at a marked price of 2.19 € kg–1, profitability would start below a cultivation volume of 160,000 m3, 4 ha (Figure 5b). If mussel farming was used as a nutrient mitigation measure in Kiel Fjord (6 month production cycle), nutrient removal costs would range between 44 to 172 € kg N–1 and 964 to 3,804 € kg P–1 yearly, depending on the farm size (Figure 5c).
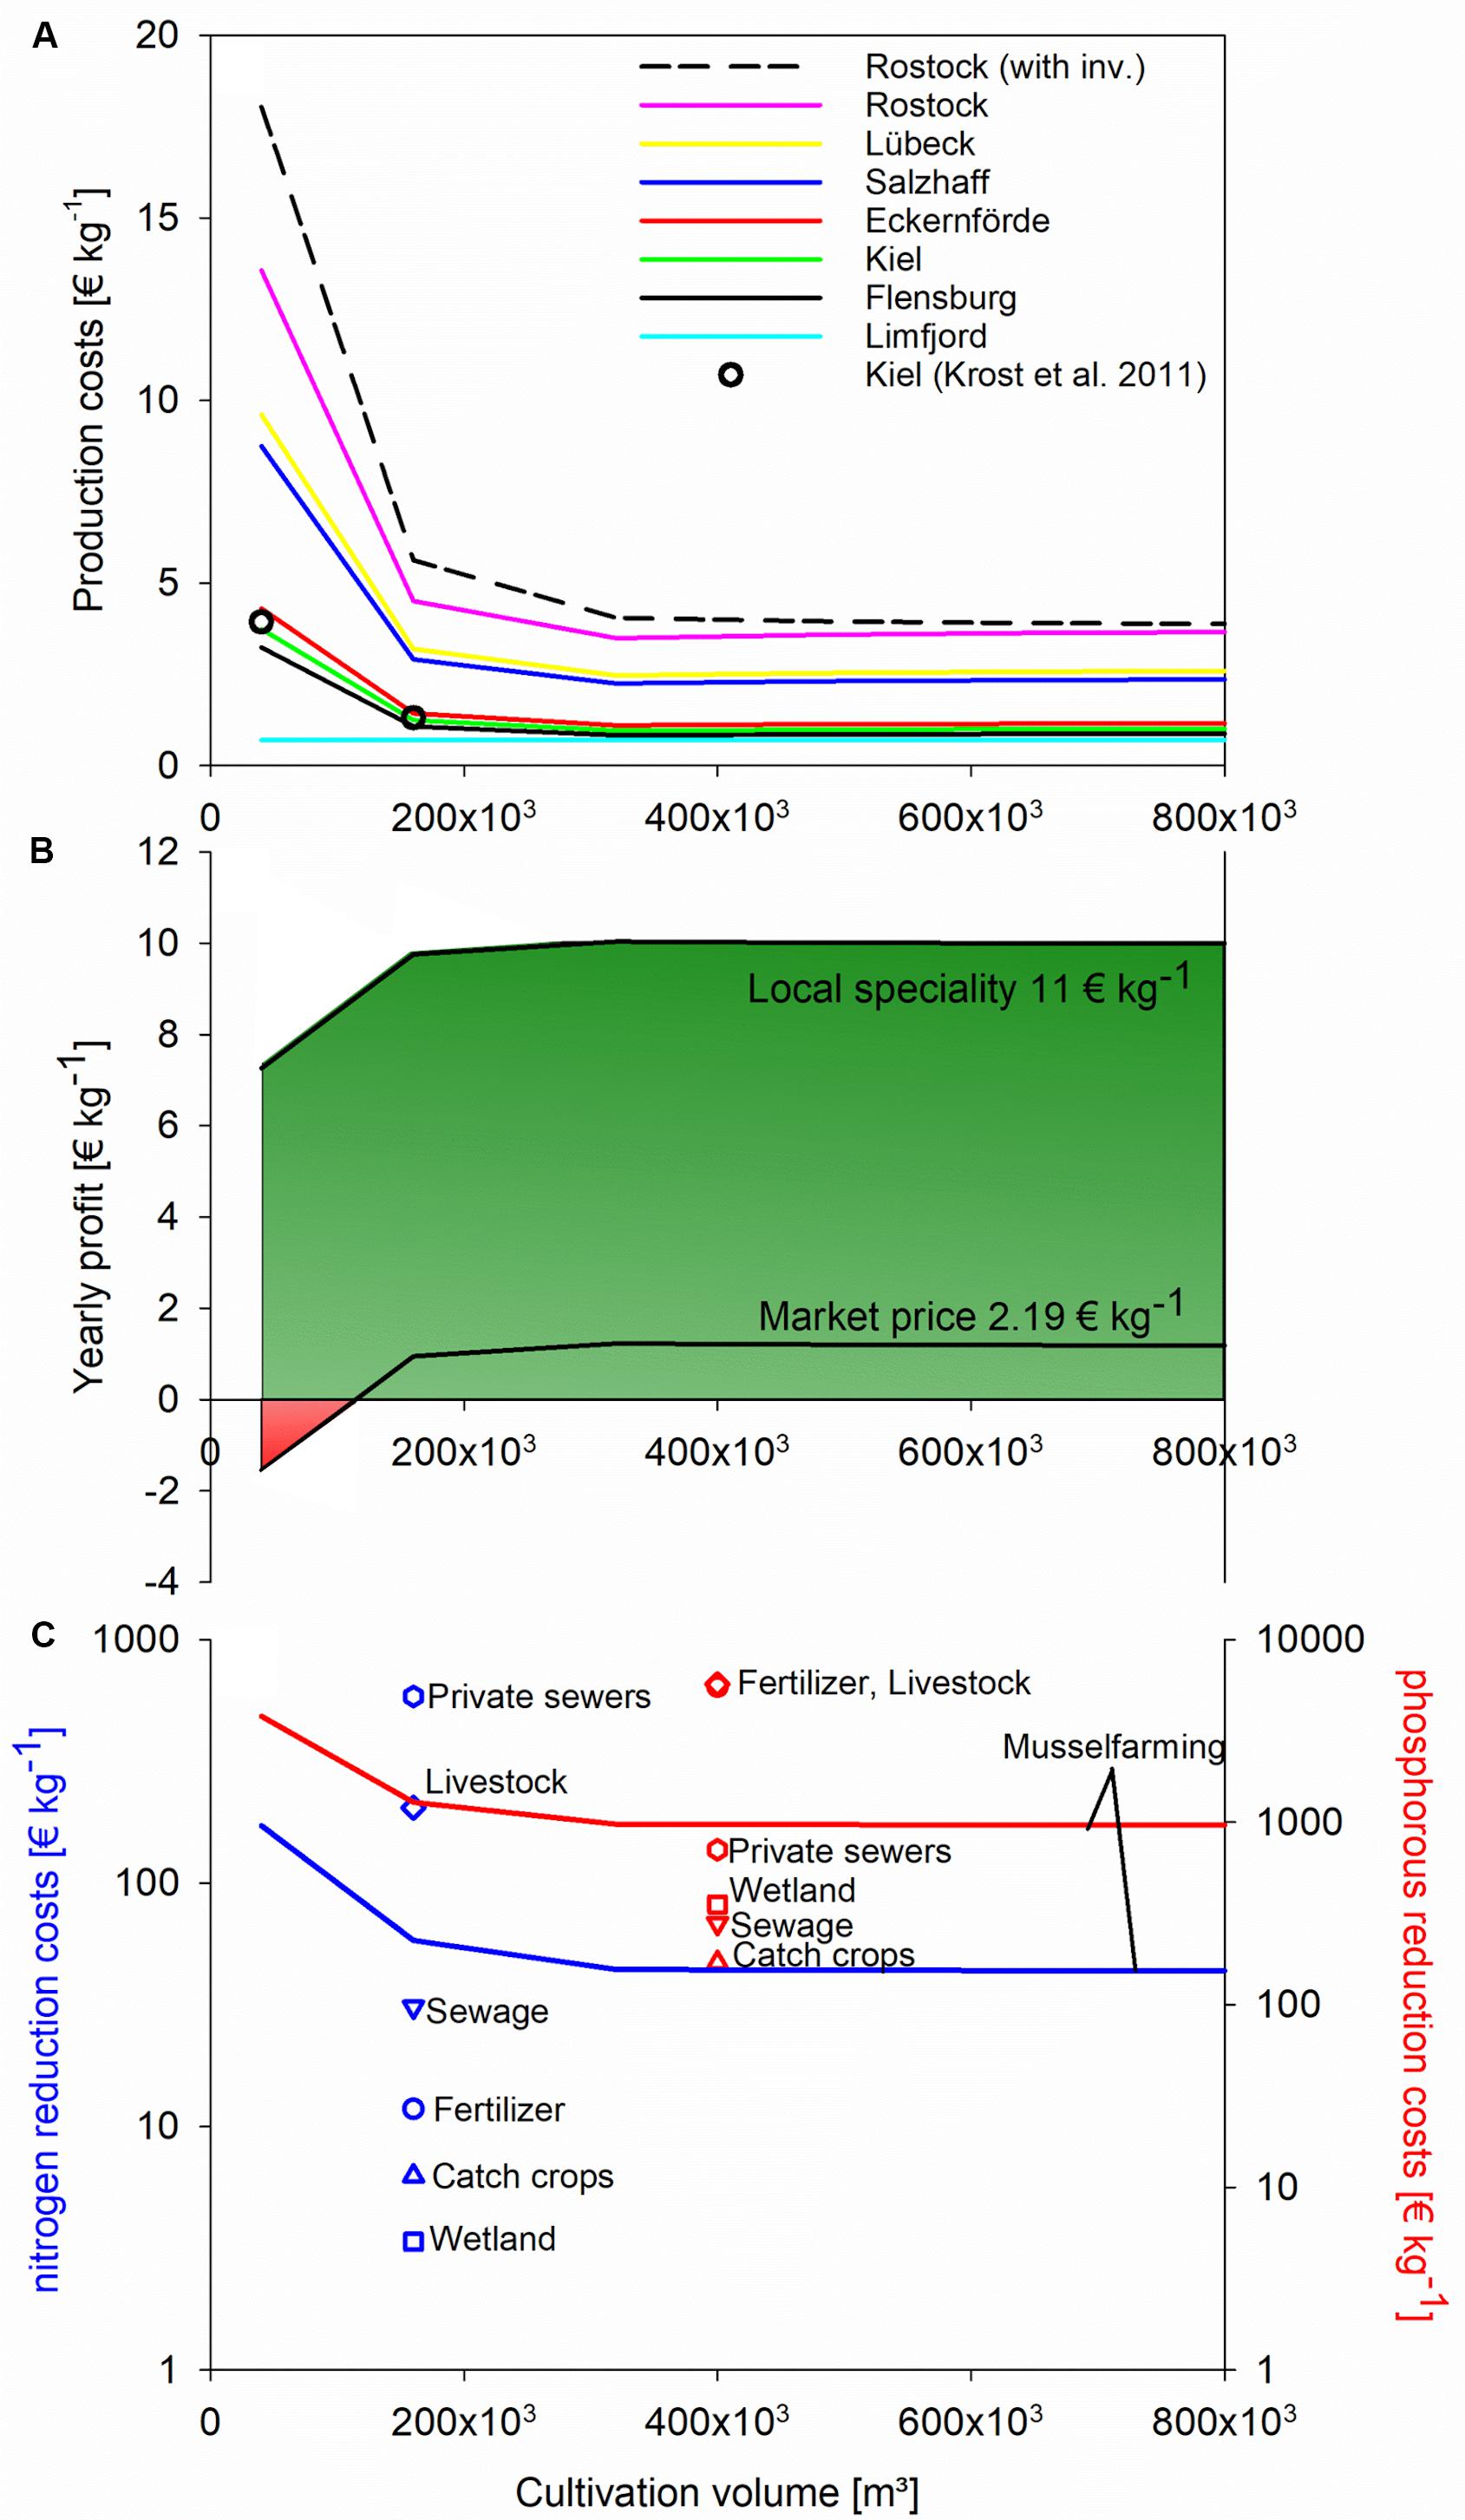
Figure 5. (A) Yearly operational costs of mussel production for human consumption west of Rostock, excluding investment costs (with investment costs for Rostock as comparison), inclusion of cost data by Krost et al. (2011) (black circle) and inclusion of minimal reported production costs of 0.7 € kg– 1 (Limfjord production); (B) profitability for mussel farming in Kiel Fjord, if sold for human consumption, following two market price scenarios (neglecting upfront investment costs); (C) costs for phosphorus (red) and nitrogen (blue) removal: comparing mussel farming (example of Kiel Fjord, neglecting upfront investment costs) with other measures after Gren et al. (2008).
Discussion and Conclusion
Mussel farming represents an environmentally friendly alternative for a high quality protein source that at the same time can be a measure against eutrophication in the brackish Baltic Sea. In the present study, a combination of environmental monitoring data, mussel growth data from four test farms and DEB modeling was used to assess the farm production and nutrient removal potential at a salinity gradient along the German coastline. It was shown that suspended mussel cultures growing at salinities above 10 psu (west of Rostock) could reach market size of 50 mm for human consumption within 18 months, except for Nienhagen. The Nienhagen site showed relatively low mean chl-a concentrations of 3 mg m–3 and the model sensitivity test indicated higher food limitation here compared to the other sites, together with a high sensitivity to salinity changes (Figure 3).
At lower salinities <10 psu, mussels were stressed due to the extra maintenance costs from osmoregulation (Riisgård et al., 2013a; Landes et al., 2015; Maar et al., 2015) and reached a size of 30–45 mm after 18 months (Figure 4). The model sensitivity study showed that mussels in GWB (2017–2018) responded strongly to changes in both salinity and temperature indicating that the mussels were severely stressed and sensitive to environmental change. A heat wave occurred in summer 2018 and high water temperatures (>20°C) weaken mussel condition (Hutchins, 1947; Braby and Somero, 2006) and byssus threads (Van Winkle, 1970; Allen et al., 1976; Young, 1985; Newcomb, 2015). Furthermore, studies have shown a reduced temperature resistance for mussels at decreasing salinities (Hiebenthal et al., 2012). The observed decrease in mussel tissue during summer 2018 could partly be explained by the DEB model due to a lower net growth efficiency at temperatures >20°C as the decrease was less severe than observed (Figure 2). The GWB model was very sensitive to changes in temperature and salinity; hence, small deviations in the forcing data could have caused the discrepancy between data and DEB model results. In addition, it was observed that the mussels in GWB detached from the collector line and settled to the bottom, which was most likely a result of weak byssus threads. The loss of mussels could also have affected the average SLs and biomass of the mussels in the farm, if more of the larger individuals were lost indicated by the decrease in population SL during the heat wave (Figure 2). Not only adult mussel growth is negatively influenced by high temperatures (Gonzalez and Yevich, 1976; Almada-Villela et al., 1982), but also larvae survival is drastically reduced, especially under low salinities (Brenko and Calabrese, 1969). This might explain the late or absent settlement in WB and GWB. Nonetheless, further confirmation, by specific experiments at low salinities, is required to proof heat waves as a cause for reduced mussel growth, condition and/or mussel loss as observed in the field.
Chl-a concentrations were used as a proxy for food availability in the calibrated DEB model, whereas POC could be another potential food source as observed for more tidal areas, e.g., the North Sea, with high amount of resuspension (Jago et al., 1993; Van Raaphorst et al., 2003). In the southern Baltic Sea, POC is mainly derived from primary production and associated processes (Dzierzbicka-Głowacka et al., 2010) and there is a positive correlation between POC and chl-a concentrations (Maciejewska and Pempkowiak, 2014), supporting our approach of using chl-a as a food proxy. However, during periods with low phytoplankton biomass, detrital complexes may be an important food source for bivalves (Newell et al., 1998; Hedberg et al., 2018; Adams et al., 2019) not accounted for by the model. The maximum chl-a concentration for optimal mussel growth is uncertain and was set to 17 mg m–3 in the present study, whereupon the assimilation efficiency was reduced due to overloading of the digestive system with undigested algae cells passing the gut (Kiørboe et al., 1981; Riisgård et al., 2013b). Previous studies found maximal growth rates at chl-a concentrations up to 10–17 mg m–3 and that growth was severely reduced at >41 mg m–3 (Clausen and Riisgård, 1996; Petersen et al., 1997; Riisgård et al., 2013b), but there is to our knowledge a lack of experimental data conducted from 17 to 41 mg-chl-a mg m–3 to support a better model description. However, the other tested thresholds (10, 12, 14, and 20 mg m–3) did not improve model performance for GWB. The sites with highest average chl-a concentrations were Strelasund (12.3 mg m–3), GWB (13.7 mg m–3), Usedom (14.2 mg m–3), and DZBC (36.2 mg m–3). Hence, the DEB growth estimates are more uncertain from these areas, especially DZBC. Nevertheless, the salinity response was calibrated for the Nienhagen site with chl-a concentrations below 6.4 mg m–3 (Figure 2) and was therefore not influenced by a negative response to high food conditions. We therefore believe that the new salinity calibration is robust.
Within 6 months, a 1-ha farm can produce from 1.0 t (DZBC) to 51 t (Flensburg) and remove 1.1 to 27.7 kg P and 24.7 to 612.7 kg N, respectively. In comparison, a 1-ha farm in the eutrophic Limfjorden (salinities of 20–35 psu) could remove 40 to 100 kg P and 600 to 1,270 kg N by harvesting of mussels (Taylor et al., 2019). In the Eastern Baltic Sea with salinities around 6 psu, the same farm size could remove 6.4 to 10.8 kg P and 83 to 140 kg N by harvest (Kotta et al., 2020). Hence, the estimated nutrient removal along the German coastline was in between previous estimates from higher and lower salinity areas as would be expected from the strong influence of salinity on mussel growth. The potential to use mussel farming as a nutrient reduction measure, and its economic value in this regard, is highly discussed (Lindahl and Kollberg, 2008; Stadmark and Conley, 2011; Hedberg et al., 2018; Gren, 2019; Petersen et al., 2019). Compared with other nutrient remediation measures, mussel farming at high productive sites lies roughly in the middle of previously reported costs. Optimization of farm set up and harvesting techniques can greatly increase the biomass yield and hereby reduce costs (Taylor et al., 2019).
Further, mussel farms can be established and repositioned more freely, targeting specific areas in need of nutrient reductions. Moreover, mussel farming reduces N and P simultaneously. As a result, the price for nutrient reduction decreases. At the same time, mussel farming is also found to increase water clarity (Schröder et al., 2014; Nielsen et al., 2016; Friedland et al., 2019). This can have important economic implications for coastal communities, as higher water transparency makes waterbodies more attractive to visitors. Studies in Sweden (Soutukorva, 2001) and Finland (Vesterinen et al., 2010) revealed a statistically significant, positive coefficient, demonstrating the preference visitors have for higher water transparency. For example, the aggregate benefit to Stockholm and Uppsala counties following a 1 m rise in water transparency was SEK 85-273 (EUR 11-35) million year–1 (Soutukorva, 2001).
Nonetheless, unpredicted biomass losses will affect the profitability of mussel farming. They could not be included in calculations of this study, since there are no long-term observations of mussel spat settlement and/or potential losses along the German Baltic coast. Neglecting these unpredicted losses, profitability of mussel farming is very much size, site and sales price dependent. Enlarging farms can reduce production costs, but also cause an increase in food depletion (not included in extrapolations here) (Nielsen et al., 2016). Additionally, large mussel farms can have negative effects on the environment, such as increased local sedimentation rates (Dahlbäck and Gunnarsson, 1981; Callier et al., 2006) and hereby organic matter below the farm (Kautsky and Evans, 1987; Christensen et al., 2003), changes in the benthic communities (Kasper et al., 1985; Callier et al., 2008) and microbial assemblages (Mirto et al., 2000), alterations in oxygen and nitrogen dynamics (Nizzoli et al., 2005; Carlsson et al., 2012) and resulting hypoxia below farms (Lee et al., 2016). However, environmental impacts of mussel farms are still under discussion, not always clearly visible and often site dependent (Chamberlain, 2002; Crawford et al., 2003; Fabi et al., 2009).
Furthermore, an increase in farm volume to a profitable size is not always possible due to multiple coastal uses, stakeholder conflicts and protected areas (Gimpel et al., 2018). Aquaculture areas can be designated in national or regional marine spatial planning and site specific spatial analyses are required before establishing and expanding a mussel farm (Backer, 2011; Karka et al., 2011; Holbach et al., 2020).
Besides the reduction of production costs, the sales price also differs depending on the mussel usage (e.g., animal feed or human consumption) and the current market need. As for human consumption mussels, higher marked prices of up to 11 € kg–1 can be reached, if promoted and sold as a regional product, as it is in Kiel. Usually, mussels in Germany will be sold for human consumption above 50 mm SL. The Danish market accepts 45 mm (pers. com. J. Petersen) and even so called “mini-mussels” of 30–35 mm (Larsen and Riisgård, 2016). Site specific market analyses need to be done, to determine the demand and acceptance of consumers to small-size, local-specialty mussels, with higher prices.
For the Baltic Sea, a combination of uses could be a lucrative supplementary and seasonal work for fishermen (who already possess many of the working equipment, as e.g., a working boat), if financial contribution for nutrient remediation is given or if mussel farming as mitigation measure allows for new fish aquaculture. After harvest, small size mussels could be used for mussel meal production to supplement, e.g., fish feed. However, this requires high tonnages to be accepted by processing companies (10,000 t WW; Schernewski et al., 2018). While this could barely be realized by a single mussel farm, the collective effort of several farms under a single state authority, could supply this quantity to processing companies. On the other hand, if promoted as local specialty, mussels as small as 30 mm could be sold for human consumption and at the same time, increase the touristic value of an area.
Data Availability Statement
The datasets generated for this study are available on request to the corresponding author.
Author Contributions
A-LB was responsible for overall structure of the manuscript, writing the manuscript, and data collection. MM was responsible for the DEB modeling and contributed to the writing. MN and GS were responsible for the economic calculations and contributed to the writing. PK, FP, SD, LR, and RF provided data for the mussel farms in Kiel, Nienhagen, WB, and GWB, respectively. LR and RF also contributed to the writing.
Funding
The work was financially supported by the project BONUS OPTIMUS (03A0020A). The project has received funding from BONUS (Art 185) funded jointly by the European Union’s Seventh Program for research, technological development and demonstration, and from Baltic Sea national funding institutions.
Conflict of Interest
The authors declare that the research was conducted in the absence of any commercial or financial relationships that could be construed as a potential conflict of interest.
Acknowledgments
We would like to thank M. V. Weber (LUNG-MV) and H. Lutterbeck (LLUR-SH) for the provision of environmental data, as well as T. Staufenberger, Y. Rößner, and F. Bak for technical support. Furthermore, we would like to thank the three referees as well as the editor for their constructive comments on the manuscript.
Supplementary Material
The Supplementary Material for this article can be found online at: https://www.frontiersin.org/articles/10.3389/fmars.2020.00371/full#supplementary-material
Abbreviations
CI, (mussel) condition index; DZBC, Darss-Zingst-Bodden-Chain; GWB, Greifswald Bay; RMSD, root-mean-square difference; WB, Wieker Bay.
Footnotes
- ^ http://www.fao.org/fishery/statistics/global-aquaculture-production/en
- ^ Water quality – Measurement of biochemical parameters – Spectrometric determination of the chlorophyll-a concentration. https://www.iso.org/standard/18300.html.
- ^ c2F0YmFsdHlrQGlvcGFuLmdkYS5wbA==
- ^ https://www.kieler-meeresfarm.de/aktuelles/
- ^ https://www.schleswig-holstein.de/DE/Landesregierung/LLUR/Organisation/abteilungen/pdf/Jahresbericht_2018.pdf
References
Adams, C. M., Mayer, L. M., Rawson, P., Brady, D. C., and Newell, C. (2019). Detrital protein contributes to oyster nutrition and growth in the damariscotta estuary, Maine, USA. Aquacult. Environ. Interact. 11, 521–536. doi: 10.3354/aei00330
Allen, J. A., Cook, M., Jackson, D. J., Preston, S., and Worth, E. M. (1976). Observations on the rate of production and mechanical properties of the byssus threads of Mytilus edulis. J. Molluscan Stud. 42, 279–289. doi: 10.1093/oxfordjournals.mollus.a065333
Almada-Villela, P. (1984). The effects of reduced salinity on the shell growth of small Mytilus edulis. J. Mar. Biol. Assoc. UK 64, 171–182.
Almada-Villela, P., Davenport, J., and Gruffydd, L. (1982). The effects of temperature on the shell growth of young Mytilus edulis L. J. Exp. Mar. Biol. Ecol. 59, 275–288.
Bacher, C., and Gangnery, A. (2006). Use of individual dynamic energy budget to simulate population dynamics of cultivated oysters. J. Sea Res. 56, 140–155.
Backer, H. (2011). Transboundary maritime spatial planning: a baltic sea perspective. J. Coast. Conserv. 15, 279–289. doi: 10.1007/s11852-011-0156-1
Beadman, H. A., Willows, R. I., and Kaiser, M. J. (2002). Potential applications of mussel modelling. Helgol. Mar. Res. 56, 76–85. doi: 10.1007/s10152-001-0092-9
Berge, G. M., and Austreng, E. (1989). Blue mussel in feed for rainbow trout. Aquaculture 81, 79–90. doi: 10.1016/0044-8486(89)90232-9
Beyer, C., Schultz-Zehden, A., Vollmann, T., Cahill, B., Roß, A., et al. (2017). Towards an implementation strategy for the sustainable blue growth agenda for the baltic sea region. Marit. Aff. 1–95. doi: 10.2771/706890
Bøhle, B. (1972). Effects of adaptation to reduced salinity on filtration activity and growth of mussels (Mytilus edulis L.). J. Exp. Mar. Bio. Ecol. 10, 41–47.
Braby, C. E., and Somero, G. N. (2006). Following the heart: temperature and salinity effects on heart rate in native and invasive species of blue mussels (genus Mytiilus). J. Exp. Biol. 209, 2554–2566. doi: 10.1242/jeb.02259
Brenko, M., and Calabrese, A. (1969). The combined effects of salinity and temperature on larvae of the mussel Mytilus edulis. Mar. Biol. 4, 224–226.
Callier, M. D., McKindsey, C. W., and Desrosiers, G. (2008). Evaluation of indicators used to detect mussel farm influence on the benthos: two case studies in the Magdalen Islands, Eastern Canada. Aquaculture 278, 77–88. doi: 10.1016/j.aquaculture.2008.03.026
Callier, M. D., Weise, A. M., McKindsey, C. W., and Desrosiers, G. (2006). Sedimentation rates in a suspended mussel farm (Great-Entry Lagoon, Canada): biodeposit production and dispersion. Mar. Ecol. Prog. Ser. 322, 129–141. doi: 10.3354/meps322129
Carlsson, M., Engström, P., Lindahl, O., Ljungqvist, L., Petersen, J., Svanberg, L., et al. (2012). Effects of mussel farms on the benthic nitrogen cycle on the Swedish west coast. Aquac. Environ. Interact. 2, 177–191. doi: 10.3354/aei00039
Chamberlain, J. (2002). Modelling the Environmental Impacts of Suspended Mussel (Mytilus edulis L.). Farming. Disseratation., Napier University, Edinburgh, 1–206.
Christensen, P. B., Glud, R. N., Dalsgaard, T., and Gillespie, P. (2003). Impacts of longline mussel farming on oxygen and nitrogen dynamics and biological communities of coastal sediments. Aquaculture 218, 567–588.
Clausen, I., and Riisgård, H. U. (1996). Growth, filtration and respiration in the mussel Mytilus edulis: no evidence for physiological regulation of the filter-pump to nutritional needs. Mar. Ecol.Prog. Ser. 141, 37–45.
Crawford, C. M., Macleod, C. K. A., and Mitchell, I. M. (2003). Effects of shellfish farming on the benthic environment. Aquaculture 224, 117–140. doi: 10.1016/S0044-8486(03)00210-2
CRM, (2011). Abschlussbericht für das Projekt EBAMA - AZ 27119 – 34: Verfahrensentwicklung und Anlagenkonzeption für die extraktive Aquakultur von Muscheln und Makroalgen in der Ostsee (Extractive Baltic Aquaculture of Mussels and Algae EBAMA) Steigerung. https://www.dbu.de/OPAC/ab/DBU-Abschlussbericht-AZ-27119.pdf.
Cubillo, A. M., Fuentes-Santos, I., and Labarta, U. (2015). Interaction between stocking density and settlement on population dynamics in suspended mussel culture. J. Sea Res. 95, 84–94. doi: 10.1016/j.seares.2014.09.009
Dahlbäck, B., and Gunnarsson, L. ÅH. (1981). Sedimentation and sulfate reduction under a mussel culture. Mar. Biol. 63, 269–275. doi: 10.1007/BF00395996
Darr, A., Gogina, M., and Zettler, M. L. (2014). Detecting hot-spots of bivalve biomass in the south-western Baltic Sea. J. Mar. Syst. 134, 69–80. doi: 10.1016/j.jmarsys.2014.03.003
Davenport, J. (1979). Is Mytilus edulis a short term osmoregulator? Comp. Biochem. Physiol. 64, 91–95.
Diaz, E., and Kraufvelin, P. (2013). The Baltic Ecomussel Project – Final report. Available at: http://projects.centralbaltic.eu/images/files/result_pdf/BALTIC_ECOMUSSEL_result1_Final_report_small.pdf.
Dolmer, P. (1998). The interactions between bed structure of Mytilus edulis L. and the predator Asterias rubens L. J. Exp. Mar. Bio. Ecol. 28, 137–150. doi: 10.1016/S0022-0981(98)00024-0
Dolmer, P. (2000). Feeding activity of mussels Mytilus edulis related to near-bed currents and phytoplankton biomass. J. Sea Res. 44, 221–231. doi: 10.1016/S1385-1101(00)00052-6
Dzierzbicka-Głowacka, L., Kuliñski, K., Maciejewska, A., Jakacki, J., and Pempkowiak, J. (2010). Particulate organic carbon in the southern baltic sea: numerical simulations and experimental data. Oceanologia 52, 621–648. doi: 10.5697/oc.52-4.621
EUMOFA (2019). Fresh Mussels in the EU – Price Structure in the Supply Chain – Focus on Denmark, Germany and Italy. https://www.eumofa.eu/documents/20178/151118/PTAT+Fresh+Mussel_EN.pdf.
European Comission [EC] (2013). Strategic Guidelines for the Sustainable Development of EU Aquaculture. COM(2013) 229 final. Available at: https://ec.europa.eu/fisheries/sites/fisheries/files/docs/body/com_2013_229_en.pdf.
European Comission [EC] (2014). A Sustainable Blue Growth Agenda for the Baltic Sea Region. SWD(2014) 167 final. Available at: https://ec.europa.eu/maritimeaffairs/sites/maritimeaffairs/files/docs/body/swd-2014-167_en.pdf.pdf.
European Comission [EC], (2017). Report on the Blue Growth Strategy – Towards More Sustainable Growth and Jobs in the Blue Economy. SWD(2017) 128 Final. https://ec.europa.eu/maritimeaffairs/sites/maritimeaffairs/files/swd-2017-128_en.pdf.
Fabi, G., Manoukian, S., and Spagnolo, A. (2009). Impact of an open-sea suspended mussel culture on macrobenthic community (Western Adriatic Sea). Aquaculture 289, 54–63. doi: 10.1016/j.aquaculture.2008.12.026
Filgueira, R., Byron, C. J., Comeau, L. A., Costa-Pierce, B., Cranford, P. J., Ferreira, J. G., et al. (2015). An integrated ecosystem approach for assessing the potential role of cultivated bivalve shells as part of the carbon trading system. Mar. Ecol. Prog. Ser. 518, 281–287. doi: 10.3354/meps11048
Filgueira, R., Grant, J., and Petersen, J. K. (2018). Identifying the optimal depth for mussel suspended culture in shallow and turbid environments. J. Sea Res. 132, 15–23. doi: 10.1016/j.seares.2017.11.006
Frechette, M., Lachance-Bernard, M., and Daigle, G. (2010). Body size, population density and factors regulating suspension-cultured blue mussel (Mytilus spp.) populations. Aquat. Living Resour. 23, 247–254. doi: 10.1051/alr/2010028
Friedland, R., Buer, A., Dahlke, S., and Schernewski, G. (2019). Spatial effects of different zebra mussel farming strategies in an eutrophic Baltic lagoon. Front. Environ. Sci. 6:158. doi: 10.3389/fenvs.2018.00158
Gimpel, A., Stelzenmüller, V., Töpsch, S., Galparsoro, I., Gubbins, M., Miller, D., et al. (2018). A GIS-based tool for an integrated assessment of spatial planning trade-offs with aquaculture. Sci. Total Environ. 627, 1644–1655. doi: 10.1016/j.scitotenv.2018.01.133
Gonzalez, J. G., and Yevich, P. (1976). Responses of an estuarine population of the blue mussel Mytilus edulis to heated water from a steam generating plant. Mar. Biol. 34, 177–189. doi: 10.1007/BF00390760
Gren, I. M. (2019). The economic value of mussel farming for uncertain nutrient removal in the Baltic Sea. PLoS ONE 14:e0218023. doi: 10.1371/journal.pone.0218023
Gren, I. M., and Elofsson, K. (2017). Credit stacking in nutrient trading markets for the Baltic Sea. Mar. Policy 79, 1–7. doi: 10.1016/j.marpol.2017.01.026
Gren, I. M., Jonzon, Y., and Lindqvist, M. (2008). Costs of Nutrient Reductions to the Baltic Sea—technical report. Workingpaper 2008:1. Department of Economics. Uppsala: Swedish University of Agricultural Sciences.
Haas, S., Rößner, Y., Schröder, J., Bronnmann, J., Jooss, F., Loy, J. P., et al. (2015). Konzeptionierung Einer Umweltverträglichen, Marinen Aquakultur in Schleswig - Holsteinischen Ostseeküstengewässern Abschlussbericht. https://www.schleswig-holstein.de/DE/Fachinhalte/F/fischerei/Downloads/KonzeptstudieUmweltvertraeglicheAquakultur.pdf?__blob=publicationFile&v=3.
Hawkins, A. J. S., and Hilbish, T. J. (1992). The costs of cell volume regulation: protein metabolism during hyperosmotic adjustment. J. Mar. Biol. Assoc. UK 72, 569–578. doi: 10.1017/S002531540005935X
Hawkins, A. J. S., Pascoe, P. L., Parry, H., Brinsley, M., Black, K. D., McGonigle, C., et al. (2013). ShellSIM: a generic model of growth and environmental effects validated across contrasting habitats in bivalve shellfish. J. Shellfish Res. 32, 237–253. doi: 10.2983/035.032.0201
Hedberg N., Kautsky N., Kumblad L. and Wikström S.A. (2018). Limitations of Using Blue Mussel Farms as a Nutrient Reduction Measure in the Baltic Sea. Report 2/2018 from Baltic Sea Centre, Stockholm University. Available online at: https://www.su.se/polopoly_fs/1.406424.1539853328!/menu/standard/file/BSC_Mussels_report_2_2018_lowres.pdf doi: 10.13140/RG.2.2.15804.49285
Hiebenthal, C., Philipp, E., Eisenhauer, A., and Wahl, M. (2012). Interactive effects of temperature and salinity on shell formation and general condition in Baltic Sea Mytilus edulis and Arctica islandica. Aquat. Biol. 14, 289–298. doi: 10.3354/ab00405
Holbach, A., Maar, M., Timmermann, K., and Taylor, D. (2020). A spatial model for nutrient mitigation potential of blue mussel farms in the western Baltic Sea. Sci. Total Environ. 139624. doi: 10.1016/j.scitotenv.2020.139624
Holdt, S. L., and Edwards, M. D. (2014). Cost-effective IMTA: a comparison of the production efficiencies of mussels and seaweed. J. Appl. Phycol. 26, 933–945. doi: 10.1007/s10811-014-0273-y
Hutchins, L. W. (1947). The basis for temperature zonation in geographical distribution. Ecol. Monogr. 17, 325–335. doi: 10.2307/1948663
Jago, C. F., Bale, A. J., Green, M. O., Howarth, M. J., Jones, S. E., McCave, I. N., et al. (1993). Resuspension processes and seston dynamics, southern North Sea. Philos. Trans. R. Soc. Lond. A 343, 475–491. doi: 10.1098/rsta.1993.0060
Karka, H., Kyriazopoulos, E., and Kanellopoulou, K. (2011). “Spatial planning for Aquaculture: a Special National Framework for resolving local conflicts,” in Proceedings of the 51st Congress of the European Regional Science Association, Barcelona, 1–11.
Kasper, H. F., Gillespie, P. A., Boyer, I. C., and MacKenzie, A. L. (1985). Effects of mussel aquaculture on the nitrogen cycle and benthic communities in Kenepuru Sound, Marlborough Sounds, New Zealand. Mar. Biol. 85, 127–136.
Kautsky, N. (1982). Growth and size structure in a baltic Mytilus edulis population. Mar. Biol. 68, 117–133. doi: 10.1007/BF00397599
Kautsky, N., and Evans, S. (1987). Role of biodeposition by Mytilus edulis in the circulation of matter and nutrients in a Baltic coastal ecosystem. Mar. Ecol. Prog. Ser. 38, 201–212.
Kautsky, N., Johannesson, K., and Tedengren, M. (1990). Genotypic and phenotypic differences between Baltic and North Sea populations of Mytilus edulis evaluated through reciprocal transplantations. I. Growth and morphology. Mar. Ecol. Prog. Ser. 59, 203–210. doi: 10.3354/meps059221
Kiørboe, T., Møhlenberg, F., and Nøhr, O. (1981). Effect of suspended bottom material on growth and energetics in Mytilus edulis. Mar. Biol. 61, 283–288. doi: 10.1007/BF00401567
Klamt, A. M., and Schernewski, G. (2013). “Climate change – a new opportunity for mussel farming in the Southern Baltic?” in Climate Change Adaptation in Practice, eds P. Schmidt-Thom and J. Klein (Chichester: Wiley-Blackwell), 171–184. doi: 10.1002/9781118548165.ch13
Kooijman, S. A. L. M. (1986). Energy budgets can explain body size relations. J. Theor. Biol. 121, 269–282. doi: 10.1016/S0022-5193(86)80107-2
Kooijman, S. A. L. M. (2010). Dynamic Energy and Mass Budgets, Biological Systems. Cambridge: Cambridge University Press. doi: 10.1017/CBO9780511565403
Kotta, J., Futter, M., Kaasik, A., Liversage, K., Rätsep, M., Barboza, F. R., et al. (2020). Cleaning up seas using blue growth initiatives: mussel farming for eutrophication control in the Baltic Sea. Sci. Total Environ. 709, 1–7. doi: 10.1016/j.scitotenv.2019.136144
Krost, P., Rehm, S., Kock, M., and Piker, L. (2011). Leitfaden für Nachhaltige Marine Aquakultur. CRM – Coastal Research & Management GbR. Available at: http://crm-online.de/de/publikationen/.
Landes, A., Dolmer, P., Poulsen, L. K., Petersen, J. K., and Vismann, B. (2015). Growth and respiration in blue mussels (Mytilus spp.) from different salinity regimes. J. Shellfish Res. 34, 373–382. doi: 10.2983/035.034.0220
Larsen, P. S., and Riisgård, H. U. (2016). Growth-prediction model for blue mussels (Mytilus edulis) on future optimally thinned farm-ropes in Great Belt (Denmark). J. Mar. Sci. Eng. 4:42. doi: 10.3390/jmse4030042
Larsson, J., Lind, E. E., Corell, H., Grahn, M., Smolarz, K., et al. (2017). Regional genetic differentiation in the blue mussel from the Baltic Sea area. Estuar. Coast. Shelf Sci. 195, 98–109. doi: 10.1016/j.ecss.2016.06.016
Lee, Y. G., Jeong, D. U., Lee, J. S., Choi, Y. H., and Lee, M. O. (2016). Effects of hypoxia caused by mussel farming on benthic foraminifera in semi-closed Gamak Bay, South Korea. Mar. Pollut. Bull. 109, 566–581. doi: 10.1016/j.marpolbul.2016.01.024
Lindahl, O. (2013). Mussel Meal Production Based on Mussels From the Baltic Sea. Reports of Aquabest project 6/2013. Helsinki: Finnish Game and Fisheries Research Institute.
Lindahl, O., Hart, R., Hernroth, B., Kollberg, S., Loo, L. O., Olrog, L., et al. (2005). Improving marine water quality by mussel farming: a profitable solution for Swedish society. J. Hum. Environ. 34, 131–138.
Lindahl, O., and Kollberg, S. (2008). How mussels can improve coastal water quality: mussel farming – a way to combat eutrophication. Biosci. Explain. 5, 1–14.
Lyngsgaard, M. M., Dolmer, P., Kotta, J., Rätsep, M., Peterson, A., and Krost, P. (2019). Recruitment, Growth and Production of Blue Mussels in the Baltic Sea 1–63. https://www.submariner-network.eu/images/BBG_substrates_recruitment_V1.pdf
Maar, M., Larsen, M. M., Tørring, D., and Petersen, J. K. (2018). Bioaccumulation of metals (Cd, Cu, Ni, Pb and Zn) in suspended cultures of blue mussels exposed to different environmental conditions. Estuar. Coast. Shelf Sci. 201, 185–197. doi: 10.1016/j.ecss.2015.10.010
Maar, M., Saurel, C., Landes, A., Dolmer, P., and Petersen, J. K. (2015). Growth potential of blue mussels (M. edulis) exposed to different salinities evaluated by a dynamic energy budget model. J. Mar. Syst. 148, 48–55. doi: 10.1016/j.jmarsys.2015.02.003
Maciejewska, A., and Pempkowiak, J. (2014). DOC and POC in the water column of the southern Baltic. Part I. Evaluation of factors influencing sources, distribution and concentration dynamics of organic matter. Oceanologia 56, 523–548. doi: 10.5697/oc.56-3.523
McLaughlan, C., Rose, P., and Aldridge, D. C. (2014). Making the best of a pest: the potential for using invasive zebra mussel (Dreissena polymorpha) biomass as a supplement to commercial chicken feed. Environ. Manage. 54, 1102–1109. doi: 10.1007/s00267-014-0335-6
Minnhagen, S. (2017). Farming of Blue Mussels in the Baltic Sea: A Review of Pilot Studies 2007-2016. Balt. Blue Growth. Available at: https://www.kalmar.se/download/18.1406a62a160009ef1ef8c7/1512468421056/Farming-of-blue-mussels-in-the-Baltic-Sea-a-review-of-pilot-studies-from-2007-2016.pdf.
Mirto, S., La Rosa, T., Danovaro, R., and Mazzola, A. (2000). Microbial and meiofaunal response to intensive mussel-farm biodeposition in coastal sediments of the Western Mediterranean. Mar. Pollut. Bull. 40, 244–252. doi: 10.1016/S0025-326X(99)00209-X
Morris, J. P., Backeljau, T., and Chapelle, G. (2018). Shells from aquaculture: a valuable biomaterial, not a nuisance waste product. Rev. Aquact. 11, 42–57. doi: 10.1111/raq.12225
Navarro, E., Iglesias, J. I. P., Camacho, A. P., and Labarta, U. (1996). The effect of diets of phytoplankton and suspended bottom material on feeding and absorption of raft mussels (Mytilus galloprovincialis Lmk). J. Exp. Mar. Biol. Ecol. 198, 175–189. doi: 10.1016/0022-0981(95)00210-3
Neufeld, D. S., and Wright, S. H. (1996). Response of cell volume in Mytilus gill to acute salinity change. J. Exp. Biol. 199, 473–484.
Newcomb, L. A. (2015). Elevated Temperature and Ocean Acidification Alter Mechanics of Mussel Attachment. Dissertation, Univeryity of Washington. Available at: https://digital.lib.washington.edu/researchworks/bitstream/handle/1773/35134/Newcomb_washington_0250E_15444.pdf?sequence=1&isAllowed=y.
Newell, C. R., Campbell, D. E., and Gallagher, S. M. (1998). Development of the mussel aquaculture lease site model MUSMOD: a field program to calibrate model formulations. J. Exp. Mar. Bio. Ecol. 219, 143–169. doi: 10.1016/S0022-0981(97)00179-2
Nielsen, P., Cranford, P. J., Maar, M., and Petersen, J. K. (2016). Magnitude, spatial scale and optimization of ecosystem services from a nutrient extraction mussel farm in the eutrophic skive fjord, denmark. Aquact. Environ. Interact. 8, 312–329. doi: 10.3354/aei00175
Nizzoli, D., Welsh, D. T., Bartoli, M., and Viaroli, P. (2005). Impacts of mussel (Mytilus galloprovincialis) farming on oxygen consumption and nutrient recycling in a eutrophic coastal lagoon. Hydrobiologia 550, 183–198. doi: 10.1007/s10750-005-4378-9
Palm, H. W., Graf, G., Paschen, M., and Schubert, H. (2015). Abschlussbericht: Verfahrensentwicklung einer Integrierten Multi Trophischen Aquakultur für die Küstengewässer Mecklenburg-Vorpommerns (Baltic IMTA). Available at: http://www.aquakultur-mv.de/static/AQUA/Dokumente/Forschen/Abschlussbericht_IMTA_31_10_2015_UNIRO_(1).pdf.
Peine, F., Bobertz, B., and Graf, G. (2005). Influence of the blue mussel Mytilus edulis (Linnaeus) on the bottom roughness length (z0) in the south-western Baltic Sea. Baltica 18, 13–22.
Petersen, J. K., Hasler, B., Timmermann, K., Nielsen, P., Tørring, D. B., Larsen, M. M., et al. (2014). Mussels as a tool for mitigation of nutrients in the marine environment. Mar. Pollut. Bull. 82, 137–143. doi: 10.1016/j.marpolbul.2014.03.006
Petersen, J. K., Holmer, M., Termansen, M., and Hasler, B. (2019). “Nutrient extraction through bivalves,” in Goods and Services of Marine Bivalves, eds A. Smaal, J. Ferreira, J. Grant, J. Petersen, and Ø Strand, (Berlin: Springer), 179–208. doi: 10.1007/978-3-319-96776-9
Petersen, J. K., Maar, M., Ysebaert, T., and Herman, P. M. J. (2013). Near-bed gradients in particles and nutrients above a mussel bed in the limfjorden: influence of physical mixing and mussel filtration. Mar. Ecol. Prog. Ser. 490, 137–146. doi: 10.3354/meps10444
Petersen, J. K., Saurel, C., Nielsen, P., and Timmermann, K. (2016). The use of shellfish for eutrophication control. Aquac. Int. 24, 857–878. doi: 10.1007/s10499-015-9953-0
Petersen, J. K., Schou, O., and Thor, P. (1997). In situ growth of the ascidian Ciona intestinalis (L.) and the blue mussel Mytilus edulis in an eelgrass meadow. J. Exp. Mar. Bio. Ecol. 218, 1–11. doi: 10.1016/S0022-0981(97)00064-6
Riisgård, H. U., Bøttiger, L., and Pleissner, D. (2012). Effect of salinity on growth of mussels, Mytilus edulis, with special reference to great belt (Denmark). Open J. Mar. Sci. 2, 167–176. doi: 10.4236/ojms.2012.24020
Riisgård, H. U., Larsen, P. S., Turja, R., and Lundgreen, K. (2014). Dwarfism of blue mussels in the low saline Baltic Sea – Growth to the lower salinity limit. Mar. Ecol. Prog. Ser. 517, 181–192. doi: 10.3354/meps11011
Riisgård, H. U., Lüskow, F., Pleissner, D., Lundgreen, K., and López, M. ÁP. (2013a). Effect of salinity on filtration rates of mussels Mytilus edulis with special emphasis on dwarfed mussels from the low-saline Central Baltic Sea. Helgol. Mar. Res. 67, 591–598. doi: 10.1007/s10152-013-0347-2
Riisgård, H. U., Pleissner, D., Lundgreen, K., and Larsen, P. S. (2013b). Growth of mussels Mytilus edulis at algal (Rhodomonas salina) concentrations below and above saturation levels for reduced filtration rate. Mar. Biol. Res. 9, 1005–1017. doi: 10.1080/17451000.2012.742549
Saraiva, S., der Meer, J., van, Kooijman, S. A. L. M., and Sousa, T. (2011). DEB parameters estimation for Mytilus edulis. J. Sea Res. 66, 289–296. doi: 10.1016/j.seares.2011.06.002
Schernewski, G., Friedland, R., Buer, A.-L., Dahlke, S., Drews, B., Höft, S., et al. (2018). Ecological-social-economic assessment of Zebra-mussel cultivation scenarios for the Oder (Szczecin) Lagoon. J. Coast. Conserv. 23, 913–929. doi: 10.1007/s11852-018-0649-2
Schiele, K. S., Darr, A., and Zettler, M. L. (2014). Verifying a biotope classification using benthic communities – An analysis towards the implementation of the European marine strategy framework directive. Mar. Pollut. Bull. 78, 181–189. doi: 10.1016/j.marpolbul.2013.10.045
Schiele, K. S., Darr, A., Zettler, M. L., Friedland, R., Tauber, F., von Weber, M., et al. (2015). Biotope map of the German Baltic Sea. Mar. Pollut. Bull. 96, 127–135. doi: 10.1016/j.marpolbul.2015.05.038
Schröder, T., Stank, J., Schernewski, G., and Krost, P. (2014). The impact of a mussel farm on water transparency in the Kiel Fjord. Ocean Coast. Manage. 101, 42–52. doi: 10.1016/j.ocecoaman.2014.04.034
Soutukorva, Å. (2001). The Value of Improved Water Quality. A Random Utility Model of Recreation in the Stockholm Archipelago. Available at: http://citeseerx.ist.psu.edu/viewdoc/download?doi=10.1.1.198.2298&rep=rep1&type=pdf.
Stadmark, J., and Conley, D. J. (2011). Mussel farming as a nutrient reduction measure in the Baltic Sea: consideration of nutrient biogeochemical cycles. Mar. Pollut. Bull. 62, 1385–1388. doi: 10.1016/j.marpolbul.2011.05.001
Stuckas, H., Knöbel, L., Schade, H., Breusing, C., Hinrichsen, H.-H., Bartel, M., et al. (2017). Combining hydrodynamic modelling with genetics: can passive larval drift shape the genetic structure of Baltic Mytilus populations? Int. J. Lab. Hematol. 26, 2765–2782. doi: 10.1111/ijlh.12426
Taylor, D., Saurel, C., Nielsen, P., and Petersen, J. K. (2019). Production characteristics and optimization of mitigation mussel culture. Front. Mar. Sci. 6:698. doi: 10.3389/FMARS.2019.00698
Teal, L. R., van Hal, R., van Kooten, T., Ruardij, P., and Rijnsdorp, A. D. (2012). Bio-energetics underpins the spatial response of North Sea plaice (Pleuronectes platessa L.) and sole (Solea solea L.) to climate change. Glob. Chang. Biol. 18, 3291–3305. doi: 10.1111/j.1365-2486.2012.02795.x
Timmermann, K., Maar, M., Bolding, K., Larsen, J., Windolf, J., Nielsen, P., et al. (2019). Mussel production as a nutrient mitigation tool for improving marine water quality. Aquact. Environ. Interact. 11, 191–204. doi: 10.3354/aei00306
Tørring, D., Gramkow, M., Fomsgaard, C., Redeker, S., Holtegaard, L. E., Freudendahl, A. S., et al. (2008). Blåmuslingeprojekt fase 3 – Integration og Optimering af Produktionsformer. Nykøbing Mors: DTU Orbit.
Väinölä, R., and Hvilsom, M. M. (1991). Genetic divergence and a hybrid zone between Baltic and North Sea Mytilus populations (Mytilidae: Mollusca). Biol. J. Linn. Soc. 43, 127–148. doi: 10.1111/j.1095-8312.1991.tb00589.x
van der Schatte Olivier, A., Jones, L., Vay, L., Le, Christie, M., et al. (2018). A global review of the ecosystem services provided by bivalve aquaculture. Rev. Aquact. 12, 3–25. doi: 10.1111/raq.12301
van der Veer, H. W., Cardoso, J. F. M. F., and van der Meer, J. (2006). The estimation of DEB parameters for various Northeast Atlantic bivalve species. J. Sea Res. 56, 107–124. doi: 10.1016/j.seares.2006.03.005
Van Raaphorst, W., Malschaert, H., and Van Haren, H. (2003). Tidal resuspension and deposition of particulate matter in the Oyster Grounds, North Sea. J. Mar. Res. 56, 257–291. doi: 10.1357/002224098321836181
Van Winkle, W. (1970). Effect of environmental factors on byssal thread formation. Mar. Biol. 7, 143–148. doi: 10.1007/BF00354918
Vesterinen, J., Pouta, E., Huhtala, A., and Neuvonen, M. (2010). Impacts of changes in water quality on recreation behavior and benefits in Finland. J. Environ. Manage. 91, 984–994. doi: 10.1016/j.jenvman.2009.12.005
Walter, U., and De Leeuw, D. (2007). Miesmuschel-Langleinenkulturen – Vom wissenschaftlichen Experiment zur wirtschaftlichen Umsetzung. Inf. Fischereiforsch. 54, 34–39. doi: 10.3220/Infn54
Westerbom, M., Kilpi, M., and Mustonen, O. (2002). Blue mussels, Mytilus edulis, at the edge of the range: population structure, growth and biomass along a salinity gradient in the north-eastern Baltic Sea. Mar. Biol. 140, 991–999. doi: 10.1007/s00227-001-0765-6
Wing, S. R., and Leichter, J. J. (2011). Variation in environmental conditions in a subtidal prey refuge: effects of salinity stress, food availability and predation on mussels in a fjord system. Mar. Ecol. Prog. Ser. 422, 201–210. doi: 10.3354/meps08911
Keywords: Baltic Sea, mussel cultivation, growth rates, DEB-model, profitability
Citation: Buer A-L, Maar M, Nepf M, Ritzenhofen L, Dahlke S, Friedland R, Krost P, Peine F and Schernewski G (2020) Potential and Feasibility of Mytilus spp. Farming Along a Salinity Gradient. Front. Mar. Sci. 7:371. doi: 10.3389/fmars.2020.00371
Received: 10 December 2019; Accepted: 30 April 2020;
Published: 03 June 2020.
Edited by:
Jose Luis Iriarte, Austral University of Chile, ChileReviewed by:
Carter Newell, Pemaquid Mussel Farms, United StatesDamian Coman Brady, University of Maine, United States
Sandra L. Marin, Austral University of Chile, Chile
Copyright © 2020 Buer, Maar, Nepf, Ritzenhofen, Dahlke, Friedland, Krost, Peine and Schernewski. This is an open-access article distributed under the terms of the Creative Commons Attribution License (CC BY). The use, distribution or reproduction in other forums is permitted, provided the original author(s) and the copyright owner(s) are credited and that the original publication in this journal is cited, in accordance with accepted academic practice. No use, distribution or reproduction is permitted which does not comply with these terms.
*Correspondence: Anna-Lucia Buer, YW5uYS1sdWNpYS5idWVyQGlvLXdhcm5lbXVlbmRlLmRl