- Program for the Human Environment, The Rockefeller University, New York, NY, United States
An accurate, comprehensive reference sequence library maximizes information gained from environmental DNA (eDNA) metabarcoding of marine fishes. Here, we used a regional checklist and early results from an ongoing eDNA time series to target mid-Atlantic U.S. coastal fishes lacking reference sequences. We obtained 60 specimens representing 31 species from NOAA trawl surveys and institutional collections, and analyzed 12S and COI barcode regions, the latter to confirm specimen identification. Combined with existing GenBank accessions, the enhanced 12S dataset covered most (74%) of 341 fishes on New Jersey State checklist including 95% of those categorized abundant or common. For eDNA time series, we collected water samples approximately twice monthly for 24 months at an ocean and a bay site in New Jersey. Metabarcoding was performed using separate 12S primer sets targeting bony and cartilaginous fishes. Bioinformatic analysis of Illumina MiSeq fastq files with the augmented library yielded exact matches for 90% of the 104 fish amplicon sequence variants generated from field samples. Newly obtained reference sequences revealed two southern U.S. species as relatively common warm season migrants: Gulf kingfish (Menticirrhus littoralis) and Brazilian cownose ray (Rhinoptera brasiliensis). A beach wrack specimen corroborated the local presence of Brazilian cownose ray. Our results highlight the value of strengthening reference libraries and demonstrate that eDNA can help detect range shifts including those of species overlooked by traditional surveys.
Introduction
Human activities increasingly crowd the neritic zone ocean, from shoreline recreation to wind farms at the edge of the continental shelf. Addressing human impacts asks for up-to-date, spatially detailed reporting on the diversity, distribution, and abundance of near-shore marine life. Censusing marine fish and other nekton – animals that move – is challenging, as surveys typically involve costly specialized equipment, personnel, and time. Aquatic environmental DNA (eDNA) offers a relatively low-cost, low-impact tool that may help in sustainable ocean management (Hansen et al., 2018).
Taberlet and colleagues were the first to show that a small volume of water suffices to detect resident fauna, demonstrating that pond water eDNA reliably reports an invasive frog’s presence (Ficetola et al., 2008). Potential sources of aquatic eDNA include cells lost from body surfaces, body wastes, and tissue fragments following predation, death, or injury (Taberlet et al., 2018). Most aquatic eDNA is in particulate form that can be captured with a small-pore size (0.2–10 μM) filter (Turner et al., 2014). Degradation and dispersal typically limit detection to a few days after animals leave, although the sources and fates of eDNA from different organisms and in different environments need more study (Collins et al., 2018; Andruszkiewicz et al., 2019). Metabarcoding profiles ecological communities by high-throughput sequencing of eDNA amplified with broad-range primers (Pompanon et al., 2011; Riaz et al., 2011; Thomsen et al., 2012; Miya et al., 2015; Kelly et al., 2017). Primers targeting the vertebrate mitochondrial 12S rRNA gene, for example, detect marine fish diversity with similar recovery as traditional surveys (Kelly et al., 2014; Port et al., 2016; Thomsen et al., 2016; Andruszkiewicz et al., 2017). Assessing relative fish abundance based on frequency of detection or number of reads looks promising, although more work is needed (Lodge et al., 2012; Buxton et al., 2017; Yamamoto et al., 2017; Lamb et al., 2019). Identifications rely on an accurate, comprehensive library. For species-level IDs, full-length exact matches are desirable, as some closely related taxa differ at only one or two nucleotides in the typical 100–200 bp 12S target region.
Here, we evaluate the 12S metabarcoding reference library for U.S. mid-Atlantic fishes, report new eDNA reference sequences, and test the enhanced library against a 2-year time series of marine samples collected in coastal New Jersey. Ichthyofauna in the mid-Atlantic Bight have received careful long-term monitoring including more than 30 years of trawl surveys conducted by New Jersey Bureau of Marine Fishes and NOAA Northeast Fisheries Science Center (Politis et al., 2014; Hinks and Barry, 2019; Levesque, 2019), and diverse studies in ocean and estuary locations (e.g., Tatham et al., 1984; Able et al., 2010, 2011; Valenti et al., 2017).
Materials and Methods
General Precautions
Standard molecular biology precautions were employed. Gloves were worn for all laboratory procedures and changed frequently to minimize potential cross-contamination including after filtering water samples, setting up PCR reactions, and any handling of PCR products. Filtration equipment was scrubbed and rinsed thoroughly after each use with tap water, and equipment and workspace areas were wiped with a 1:10 dilution of household bleach (final concentration approximately 0.5%) after use. After each procedure, used tips and other disposables were carefully discarded away from the workspace area, and collection containers were rinsed with 0.5% bleach.
New 12S, COI Reference Sequences
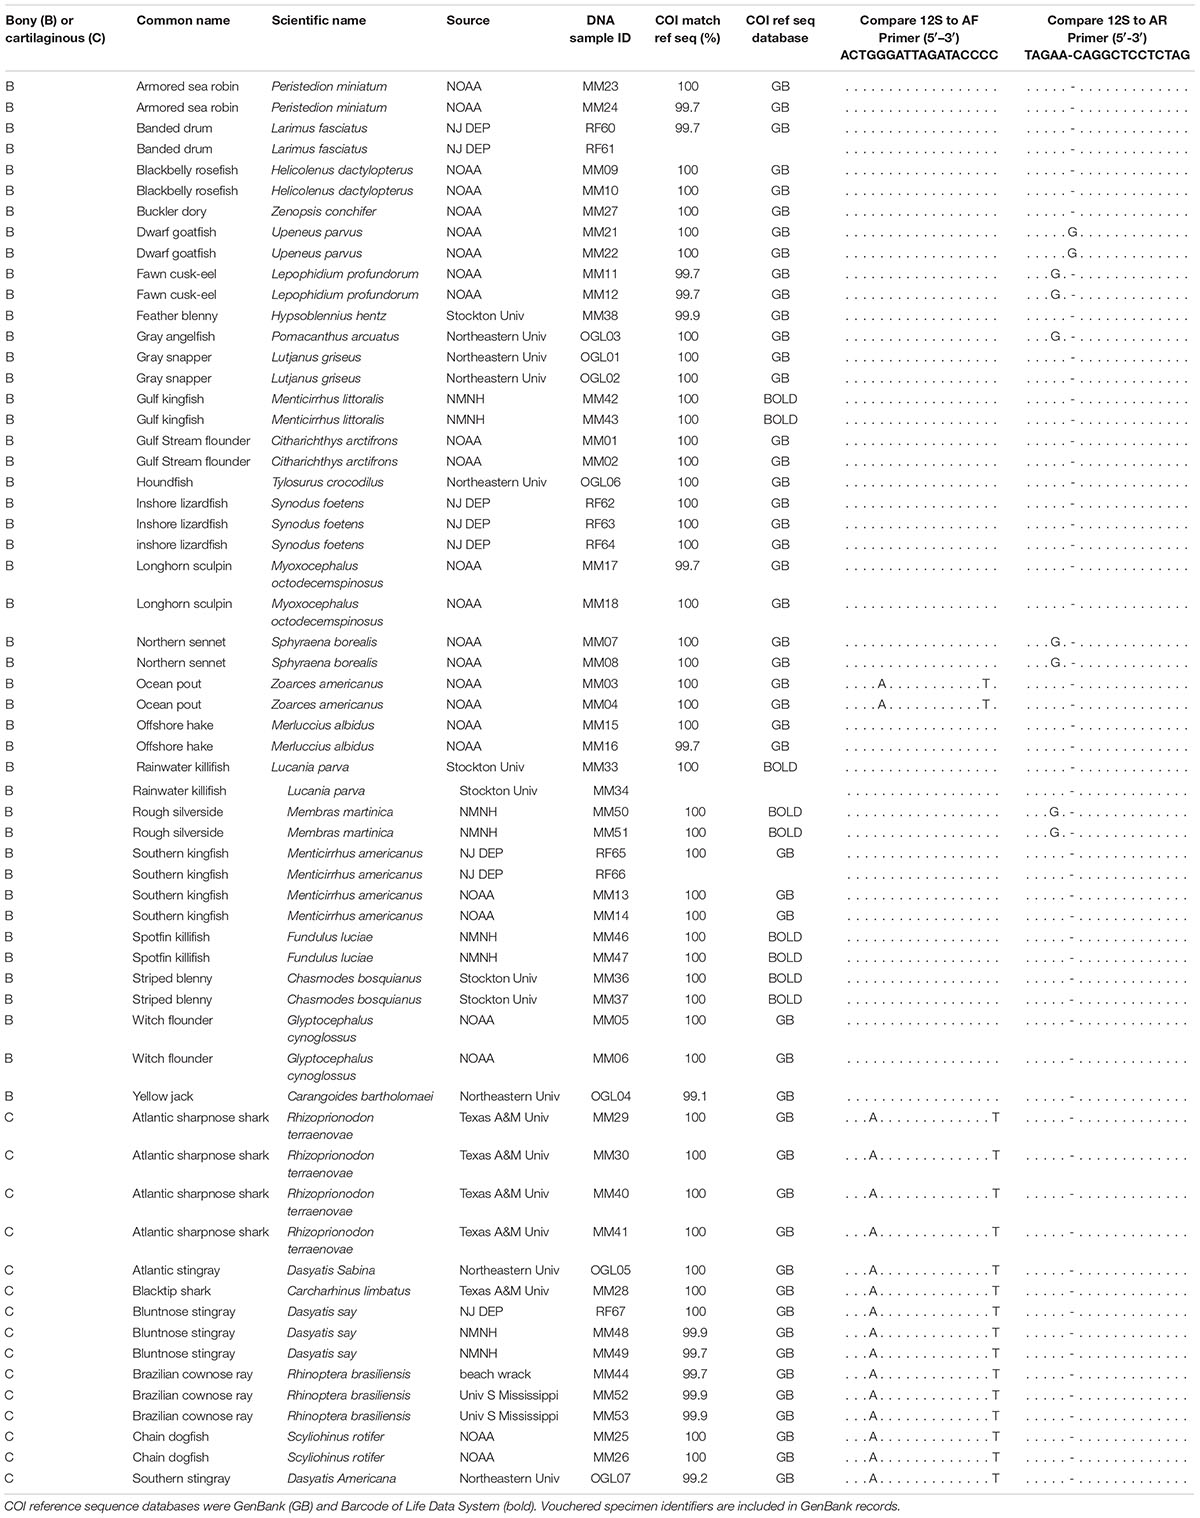
Tissue requests are focused on regionally common species not, or poorly, represented in GenBank for 12S rRNA gene eDNA target segment. A total of 60 tissue specimens representing 31 species were generously donated by researchers at six institutions (Table 1). DNA was extracted using DNeasy PowerSoil kit (Qiagen) with modifications from the manufacturer’s protocol (Supplementary File 1). For 12S amplification, different pairs were used for bony and cartilaginous fishes (Li and Ortí, 2007; Stoeckle et al., 2018). Amplifications were performed with Illustra PuReTaq beads in 0.2-ml tubes (GE Healthcare), reaction volume of 25 μl, 5 μl of specimen DNA, and 250 μM M13-tailed primers (IDT). Thermal cycler protocol was 95°C for 5 m, 35 cycles of 95°C for 20 s, 57°C for 20 s, and 72°C for 20 s, and 72°C for 1 m. COI barcode region was amplified with COI-3 primer cocktail, except that alternate primers were used for rays (Ivanova et al., 2007; Zeng et al., 2016; Kirchoff et al., 2017). Primer sequences and additional PCR parameters are given in Supplementary Table 1. Amplifications were confirmed by agarose gel electrophoresis, and PCR clean-up and bidirectional sequencing were done at GENEWIZ. Consensus sequences were assembled in MEGA, using 4Peaks to assess trace files (Kumar et al., 2004; Griekspoor and Groothuis, 2019).
Water Collection, Filtration, DNA Extraction
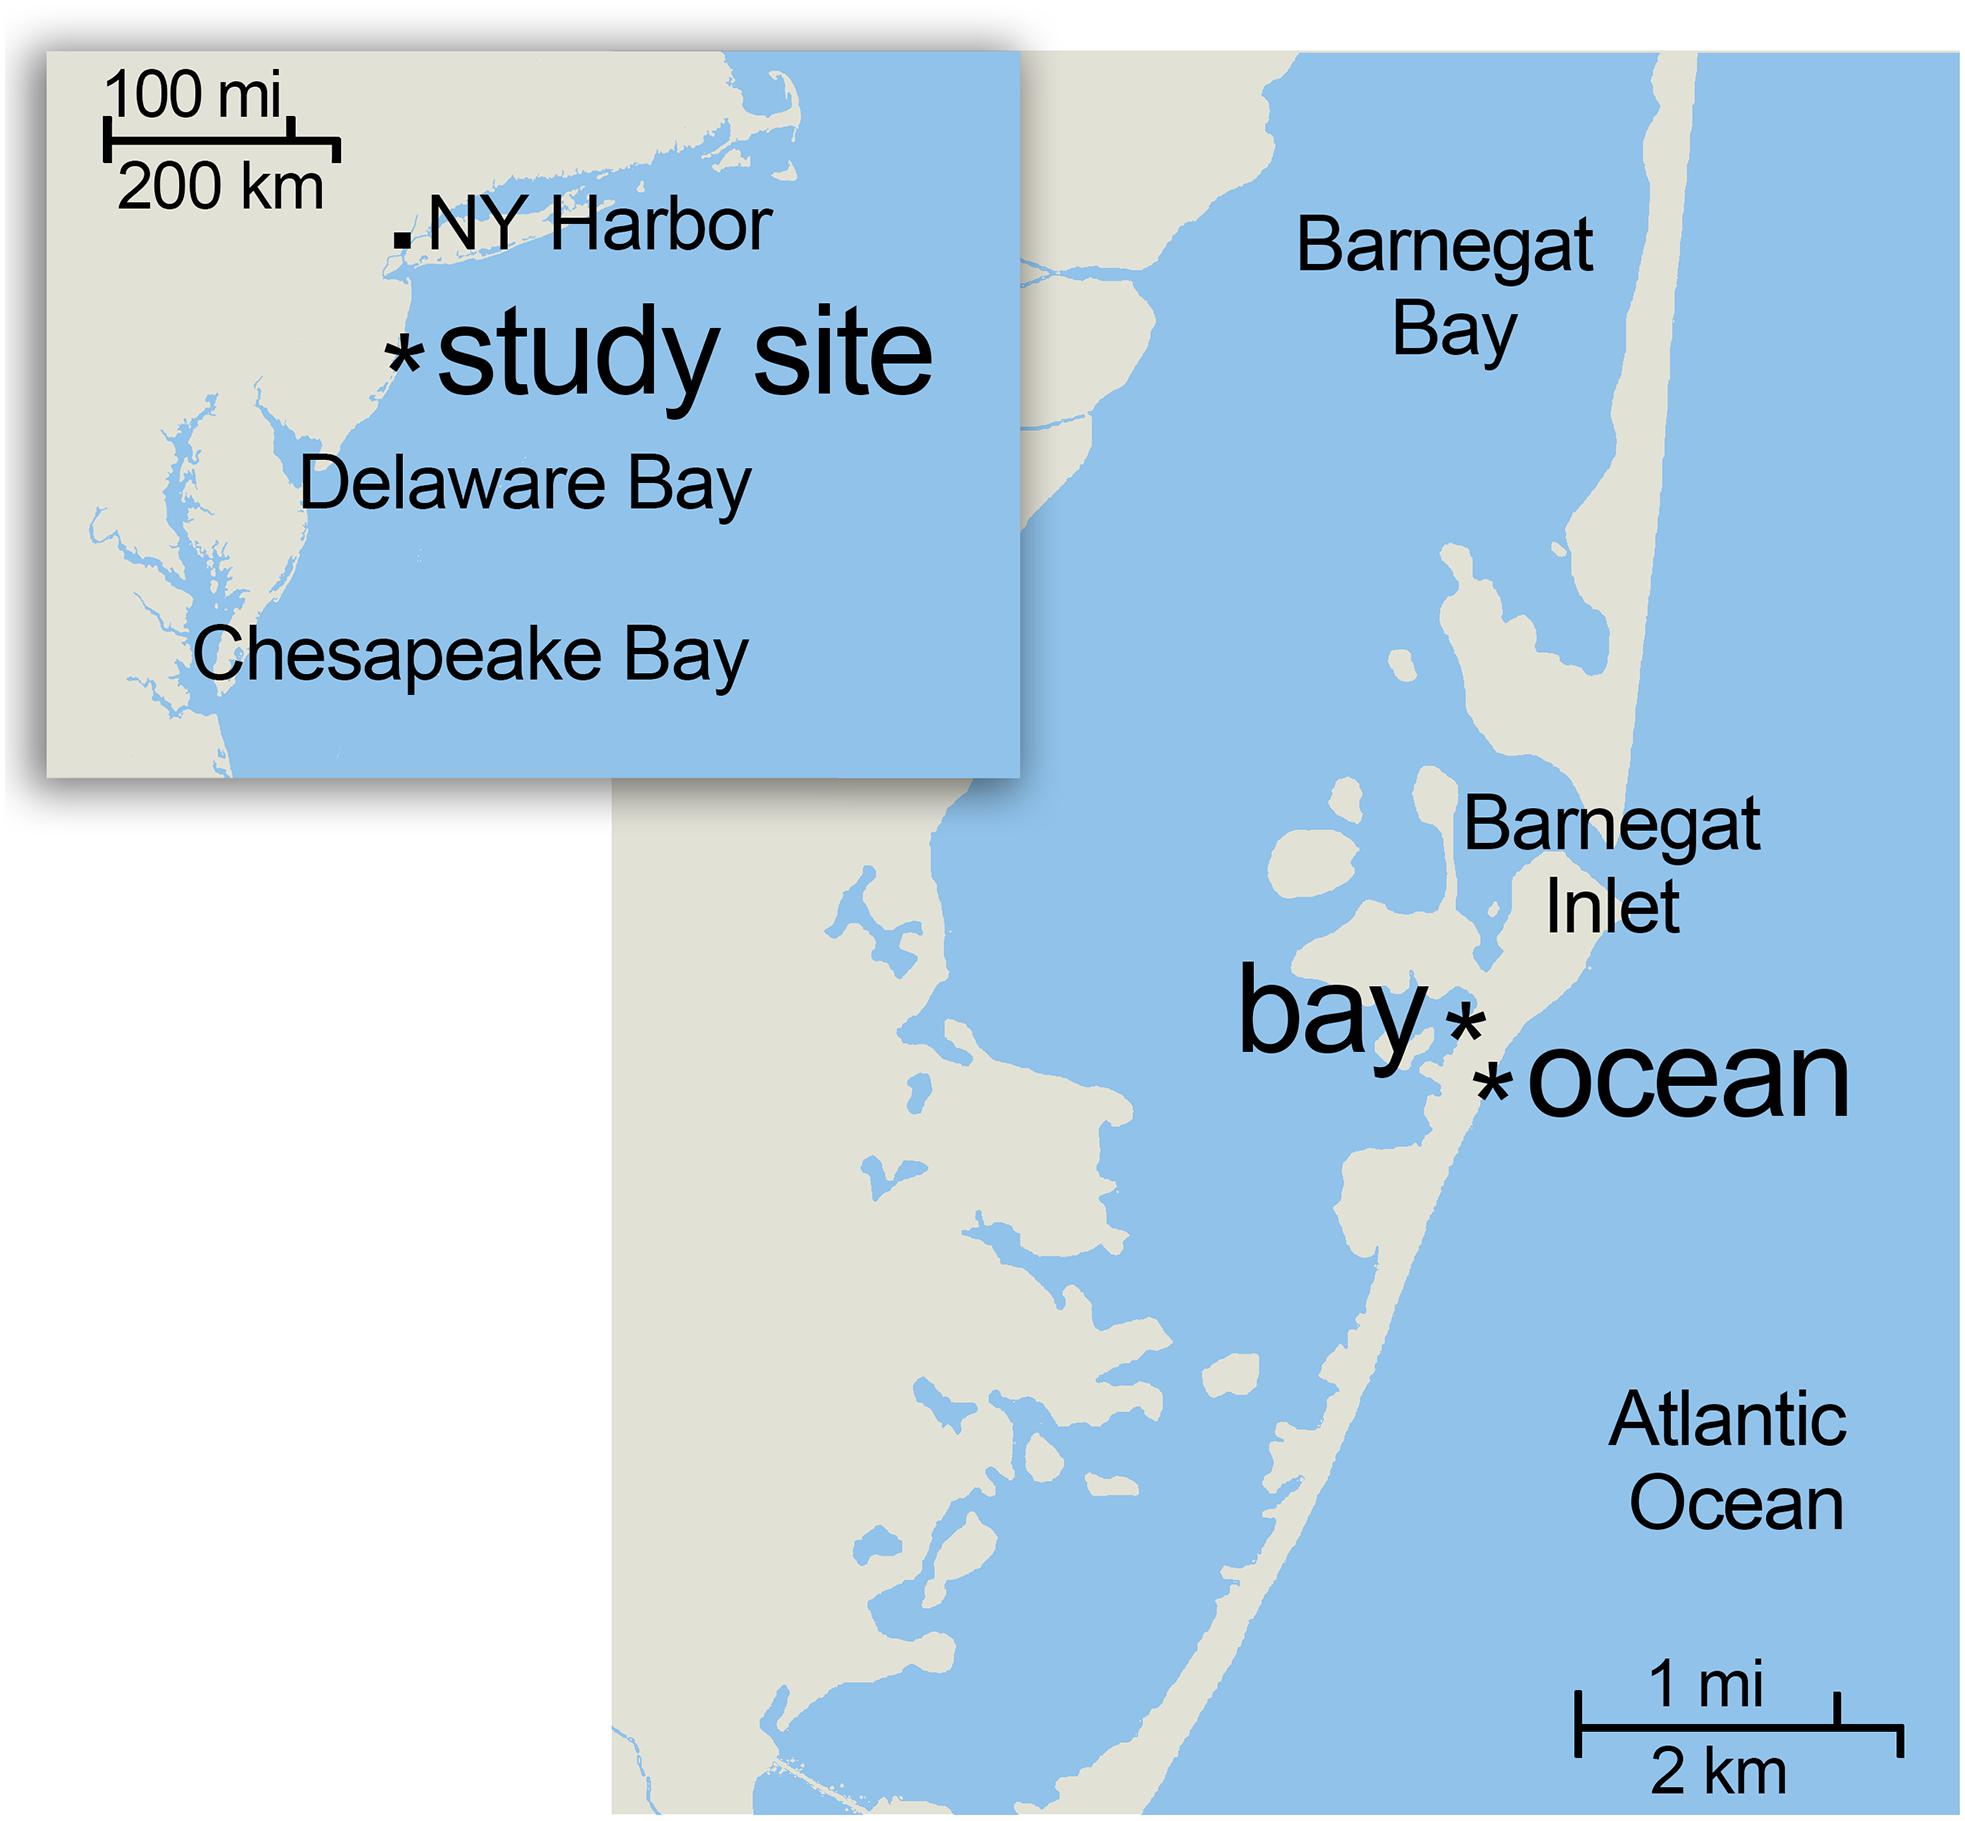
With authorization from New Jersey Department of Environmental Protection, surface water samples were collected within 2 m of shoreline by wading or with a dip bucket in the ocean (39.741641, −74.112961) and bay (39.745287, −74.117982) sites on a barrier island about 110 km south of New York City (Figure 1). The locations are about 2.5 km south of Barnegat Inlet, a large tidal channel connecting the ocean and the bay (Seabergh et al., 2003); the distance between sites by water is about 8 km. Samples were stored at 4°C for 24–48 h before filtration. The water was poured through a paper coffee filter to exclude large particulate matter and into a glass filter holder (Millipore) attached to wall suction with a 47-mm, 0.45-μM pore size nylon filter (Millipore). Filters were folded to cover retained material and stored in 15 ml tubes at −20°C. If the water did not completely filter after 4 h, the volume filtered was recorded, and the remainder is discarded. As negative controls, 1 L samples of laboratory tap water were filtered using the same equipment and procedures as those of the environmental samples. DNA was extracted with PowerSoil kit with modifications from the manufacturer’s protocol (Supplementary File 1), eluted with 100 μl of Buffer 6 and concentration measured by Qubit (Thermo Fisher Scientific). Ocean water temperatures in Atlantic City, NJ, about 50 km south of the study location, were obtained from the NOAA website1. No animals were housed or experimented upon as part of this study. No endangered or protected species were collected.
Metabarcoding
Amplifications were performed with Illustra PuReTaq beads, 5 μl of DNA sample (1/20 of the total) or 5 μl of HyClone water, molecular biology grade (GE Healthcare), and 200 μM Illumina-tailed “ecoPrimers” (Riaz et al., 2011) that target an approximately 106-bp segment of 12S V5 region (IDT). PCR parameters were 95°C for 5 m, 40 cycles of 95°C for 20 s, 52°C for 20 s, and 72°C for 20 s, and 72°C for 1 m. Each sample was amplified once for bony fishes (primer set AF/AR) and once for cartilaginous fishes (primer set AFS/AR). Negative control reactions (tap water eDNA and reagent-grade water) were included in all amplification sets. Primer sequences, with Illumina tails in BOLD, were 1) forward primer AF: TCG TCG GCA GCG TCA GAT GTG TAT AAG AGA CAG ACT GGG ATT AGA TAC CCC; 2) reverse primer AR: GTC TCG TGG GCT CGG AGA TGT GTA TAA GAG ACA G TAG AAC AGG CTC CTC TAG; 3) forward primer AFS: TCG TCG GCA GCG TCA GAT GTG TAT AAG AGA CAG ACT GGG ATT AGA TAC CCT. Following amplification, 5 μl was run on a 2% agarose gel to assess the products, and the remainder was diluted 1:20 in Buffer EB (Qiagen) and stored at −20°C. Indexing was done with Illustra PuReTaq beads, 5 μl of diluted amplification product, and 2.5 μl of left and right index primers (Nextera XT Index Kit v2; Illumina). Thermal cycler parameters were 95°C for 5 m, 12 cycles of 95°C for 20 s, 55°C for 20 s, and 72°C for 20 s, and 72°C for 1 m. Bony and cartilaginous fish amplifications were indexed separately. Indexed PCR libraries were pooled, treated with 1:1 AMPure XP, and the yield measured with Qbit. This ratio of AMPure was utilized to help exclude a primer product (size about 200 bp, compared to the desired product size of about 380 bp) that was generated from some samples and negative controls. Sequencing was done at GENEWIZ on an Illumina MiSeq (2 × 150 bp). PhiX spike-in was not employed.
Bioinformatic analysis was performed using DADA2, which identifies all unique sequences rather than lumping according to threshold criteria (Callahan et al., 2016, 2017). Our DADA2 pipeline (Stoeckle et al., 2017) generated taxon assignments by comparison to an internal library, which was updated when new reference sequences became available. Because the identification algorithm picked up some partial matches, DADA2 output files were exported to Excel and IDs re-checked for exact full-length matches using Excel MATCH function. Finally, all unnamed ASVs were submitted manually to GenBank; those with greater than 90% identity to any vertebrate were recorded. At the completion of the study, fastq files were re-analyzed in DADA2 pipeline with the fully updated library. All species-level identifications were based on 100% matches. Detections less than 1/1,000 of the total for that amplicon sequence variant (ASV) in that MiSeq run were excluded to reduce mis-assignment errors. To compile results from MiSeq runs, minor ASVs differing by one or two nucleotides from the predominant sequence for that taxon, which include sequencing errors and uncommon haplotype variants, were not utilized (Stoeckle et al., 2017).
Results
Regional Marine Fish Checklist, New Reference Sequences
We compared the New Jersey Checklist of Saltwater Fishes to GenBank, noting which had accessions for the 12S eDNA target (Able, 1992; Riaz et al., 2011). Checklist species, 223 (65%) of 341, had one or more records fully covering this region (median 2, range 1–191), including 90 (84%) of 107 fishes ranked abundant or common (Supplementary Table 2). Tissue requests are focused on common species not, or poorly, represented. In addition, neighbor-joining trees of ASVs generated from ongoing time series helped guide requests toward taxa likely to match unnamed ASVs. In some cases, this approach led to requests for species not on the NJ Checklist (Supplementary Table 3). As noted above, a total of 60 tissue specimens representing 31 “missing species” were obtained (Table 1). An approximately 690-bp 12S segment spanning the eDNA target region including primer binding sites was recovered from all specimens. COI barcodes, obtained from at least one representative of each species, showed 99.7–100% identity to reference sequences in GenBank or BOLD, confirming specimen IDs. New sequences obtained in this study boosted GenBank coverage of NJ checklist fishes for 12S V5 target locus to 74% overall, and to 95% of species ranked abundant or common (Supplementary Table 2). Additional 12S sequences for poorly represented fishes were exact or near-exact matches for existing GenBank records. Among near-exact matches, none of the polymorphisms fell within the approximately 106-bp 12S metabarcoding target gene region.
Time Series Water Collection, Filtration, DNA Extraction
From April 2017 to March 2019, 59 pairs of 1-L water samples were collected approximately twice monthly at an ocean and a bay site in coastal New Jersey (Figure 1). Ocean water tended to clog filters less quickly than did bay water, resulting in average filtered volume of 920 ml from ocean samples and 750 ml from bay. Interval between filtration and extraction averaged 31 days (range 0–92 days), with no evidence of DNA loss during filter storage (Supplementary Figure 1). DNA yield was lower for ocean than bay samples (average per liter filtered, about 3,800 and 5,000 ng, respectively; corresponding concentrations of extracted DNA averaged 38 and 50 ng/μl, respectively), and averaged 2-fold higher in spring and summer compared to fall and winter (Supplementary Figure 2). All 20 tap water negative controls contained DNA (average 200 ng/L filtered). Collection dates, filtration, and DNA details for each sample are given in Supplementary Table 4.
Primer Evaluation in Bony and Cartilaginous Fishes
An alignment of 12S sequences showed that most elasmobranchs have a T at the 3′ end of the forward primer site, compared to a C in most osteichthyes (e.g., Table 1). Modifying forward primer AF with a 3′ T (primer AFS) greatly improved detection of elasmobranchs and moderately reduced that of osteichthyes (Figure 2). In the following, we report bony fish results with AF/AR primer pair and cartilaginous fish findings with AFS/AR primer pair.
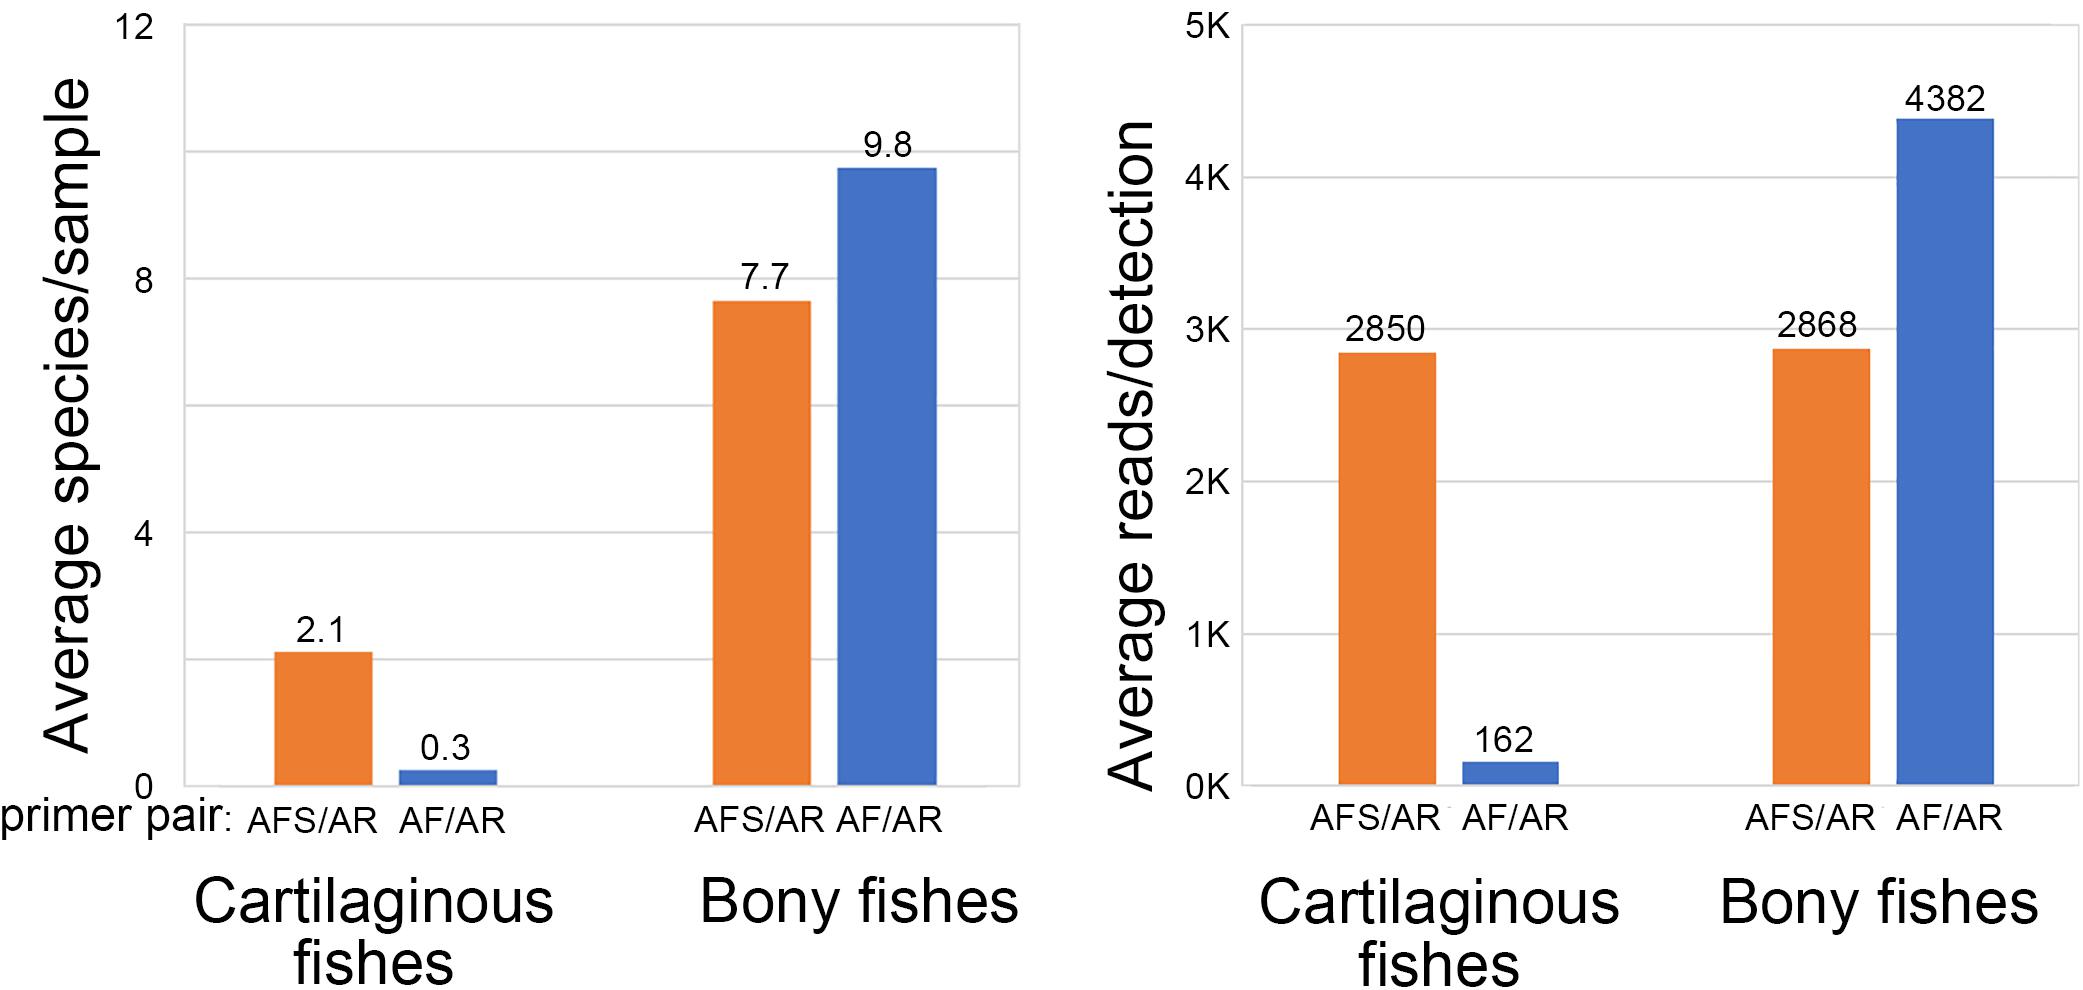
Figure 2. Improved detection of cartilaginous fishes (sharks, rays, skates) with forward primer AFS.
Library Preparation, MiSeq Metabarcoding, DADA2 Pipeline
Libraries (236) were prepared from field samples (each sample was amplified separately for bony and cartilaginous fishes), plus 77 libraries from tap water DNA and 79 from reagent-grade water. The resulting 392 libraries, together with other samples not reported here, were indexed and run on Illumina MiSeq, 2 × 150 bp, distributed over 10 runs with 82–96 libraries per run (Supplementary Tables 5, 6). Average raw reads were 13.1 M per run, mean quality score 33, and on average, 75% of bases had q-score greater than 30. Bioinformatic processing with DADA2 produced an average of 6.2 M paired reads per run, with an average of 85 K reads per library from field samples. After filtering to reduce mis-assignment errors, all negative control libraries (tap water DNA, reagent-grade water) were negative for fish reads. Among the complete set of coastal water samples, 89 bony fish and 15 cartilaginous fish ASVs were detected. Eighty-six matched a single species, eight matched two or more, and 10 had no exact matches (Supplementary Table 7).
Bony Fish eDNA
Libraries prepared from ocean and bay samples amplified with AF/AR primer pair generated on average about 40,000 and 80,000 bony fish reads, respectively. Ocean reads were distributed among 66 fish ASVs and bay reads among 63 ASVs. Species frequency differed strongly between the ocean and the bay, consistent with known habitat preferences (Figure 3) (complete results in Supplementary Tables 5, 8). The number of species per sample roughly tracked water temperature, and individual species exhibited consistent seasonal patterns (Figure 4). At both sites, a small number of fishes accounted for the great majority of reads, as commonly recovered taxa tended to have higher average reads per detection (Figures 3, 5). New reference sequences matched eight ASVs, including that of Gulf kingfish (Menticirrhus littoralis), a southern U.S. species (Figures 3, 4).
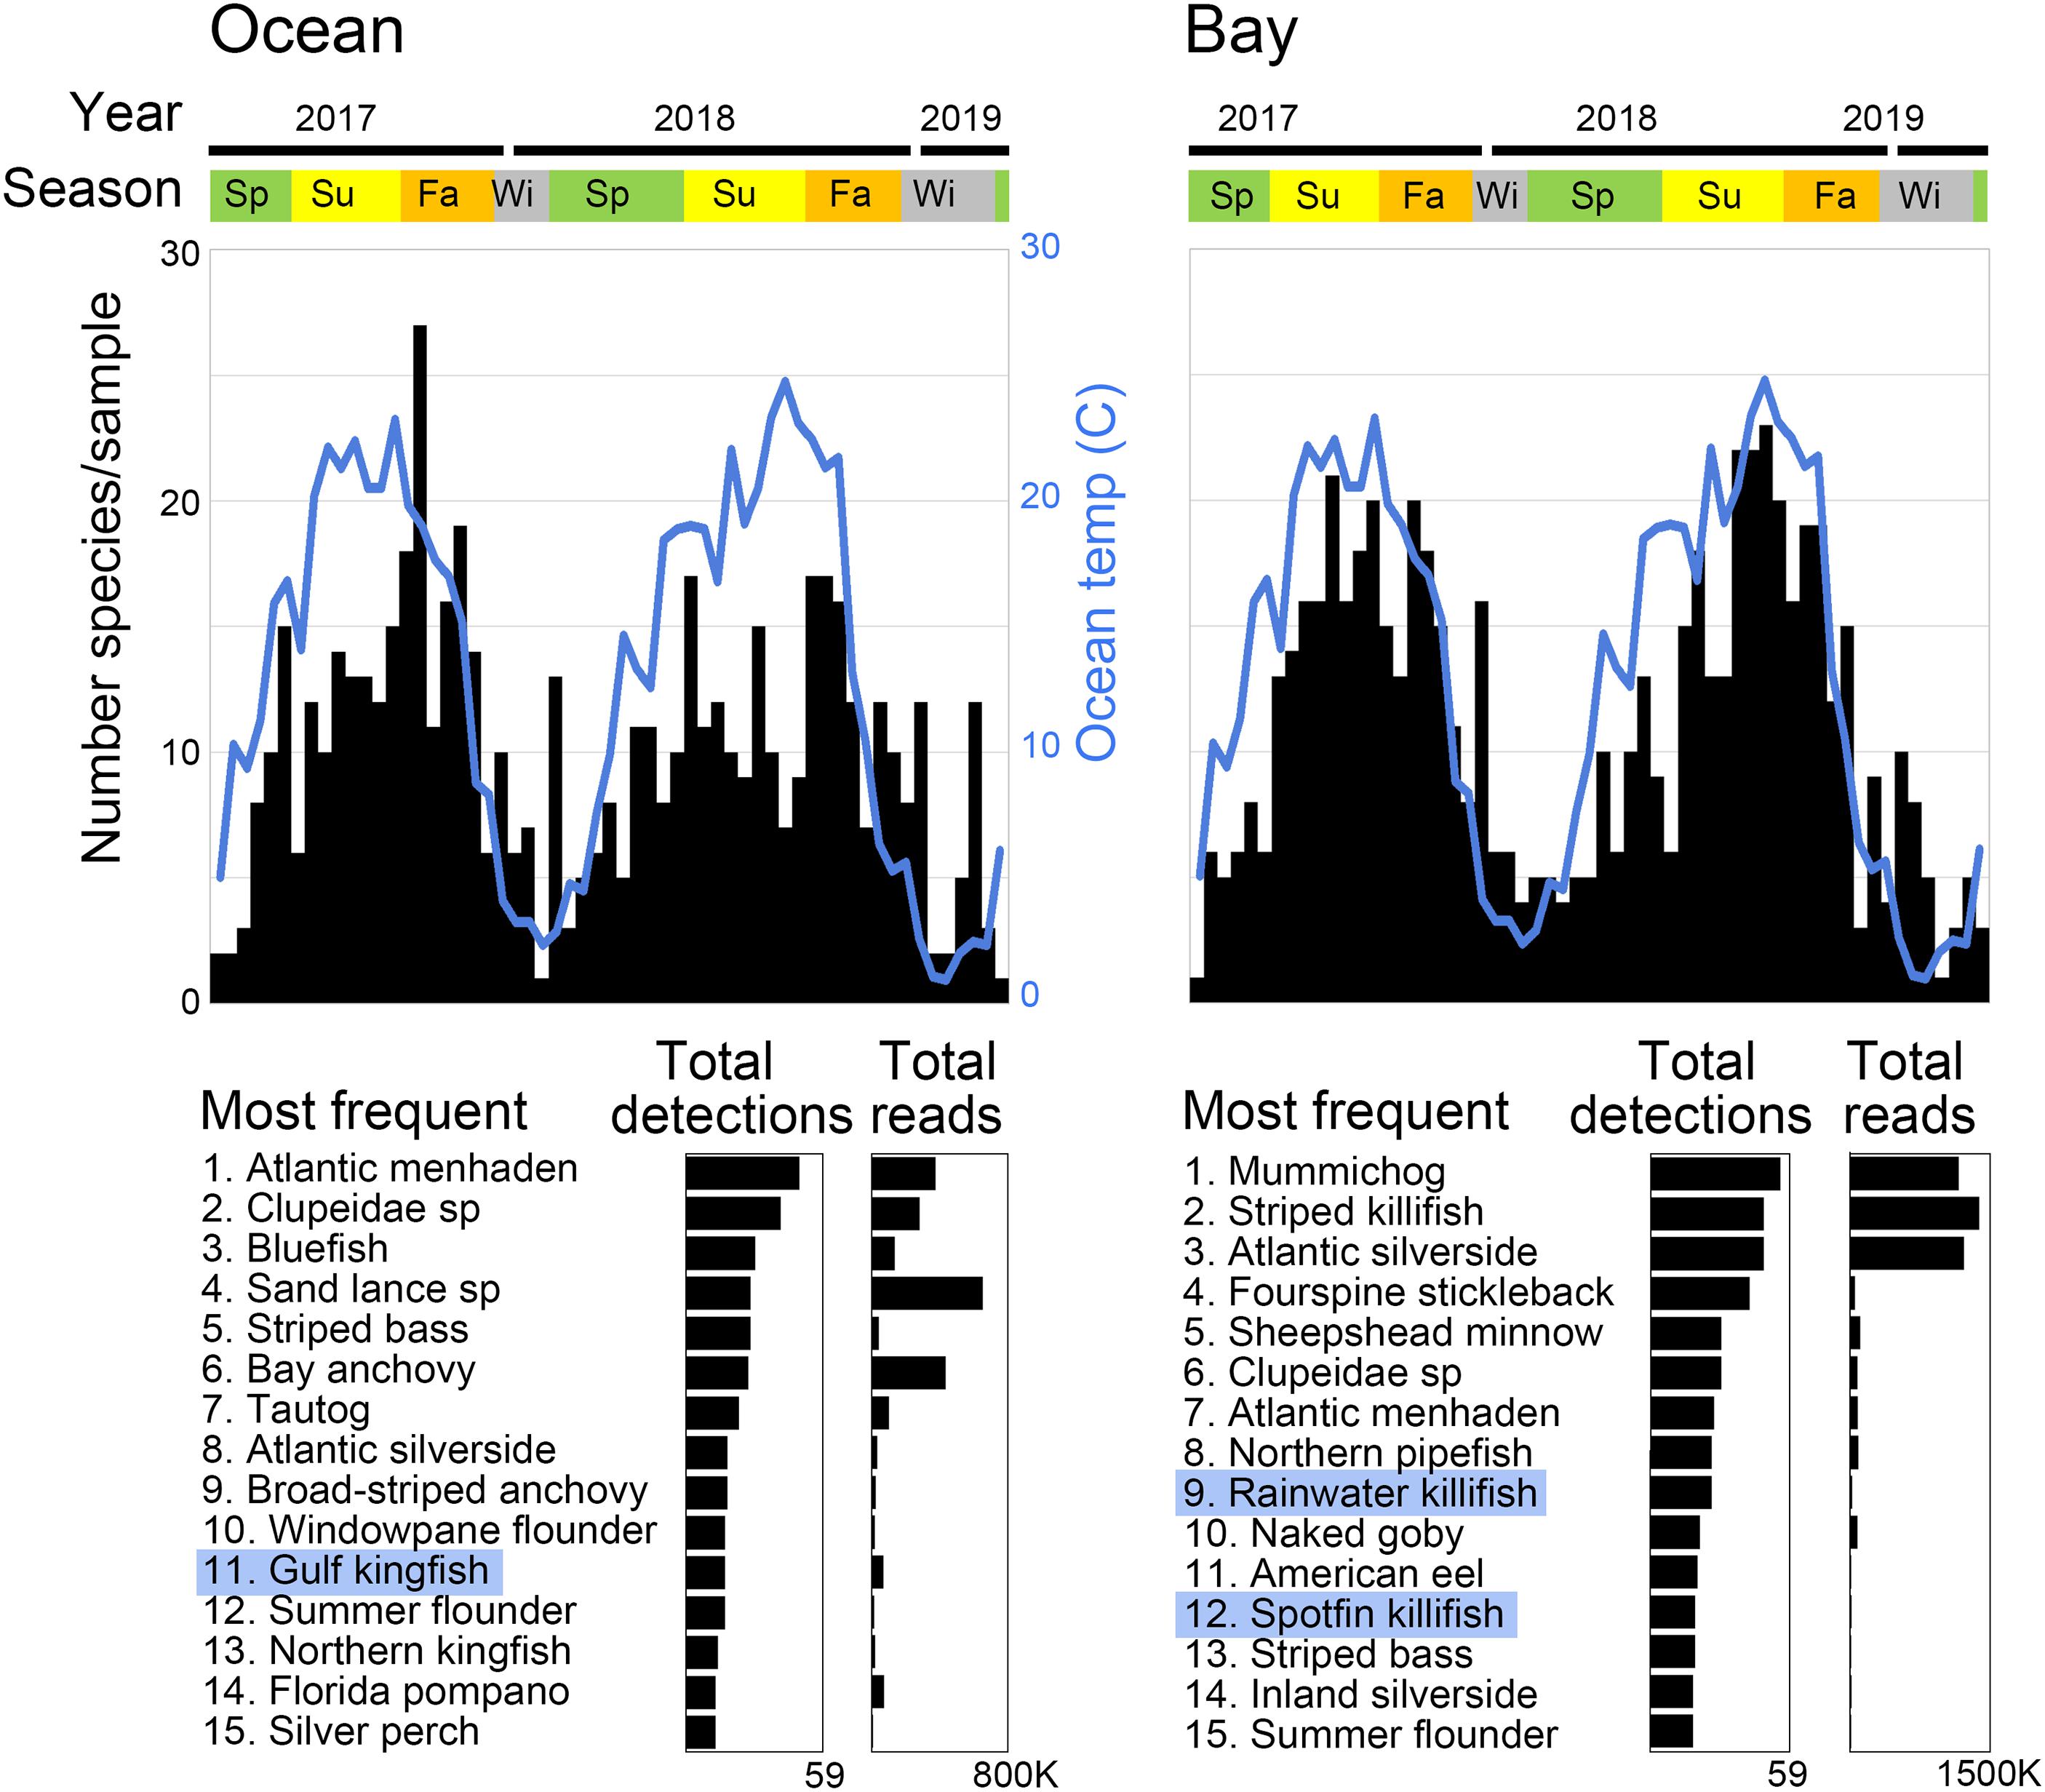
Figure 3. Two-year time series of bony fish eDNA in coastal New Jersey. Fishes with new reference sequences reported in this study are highlighted in blue.
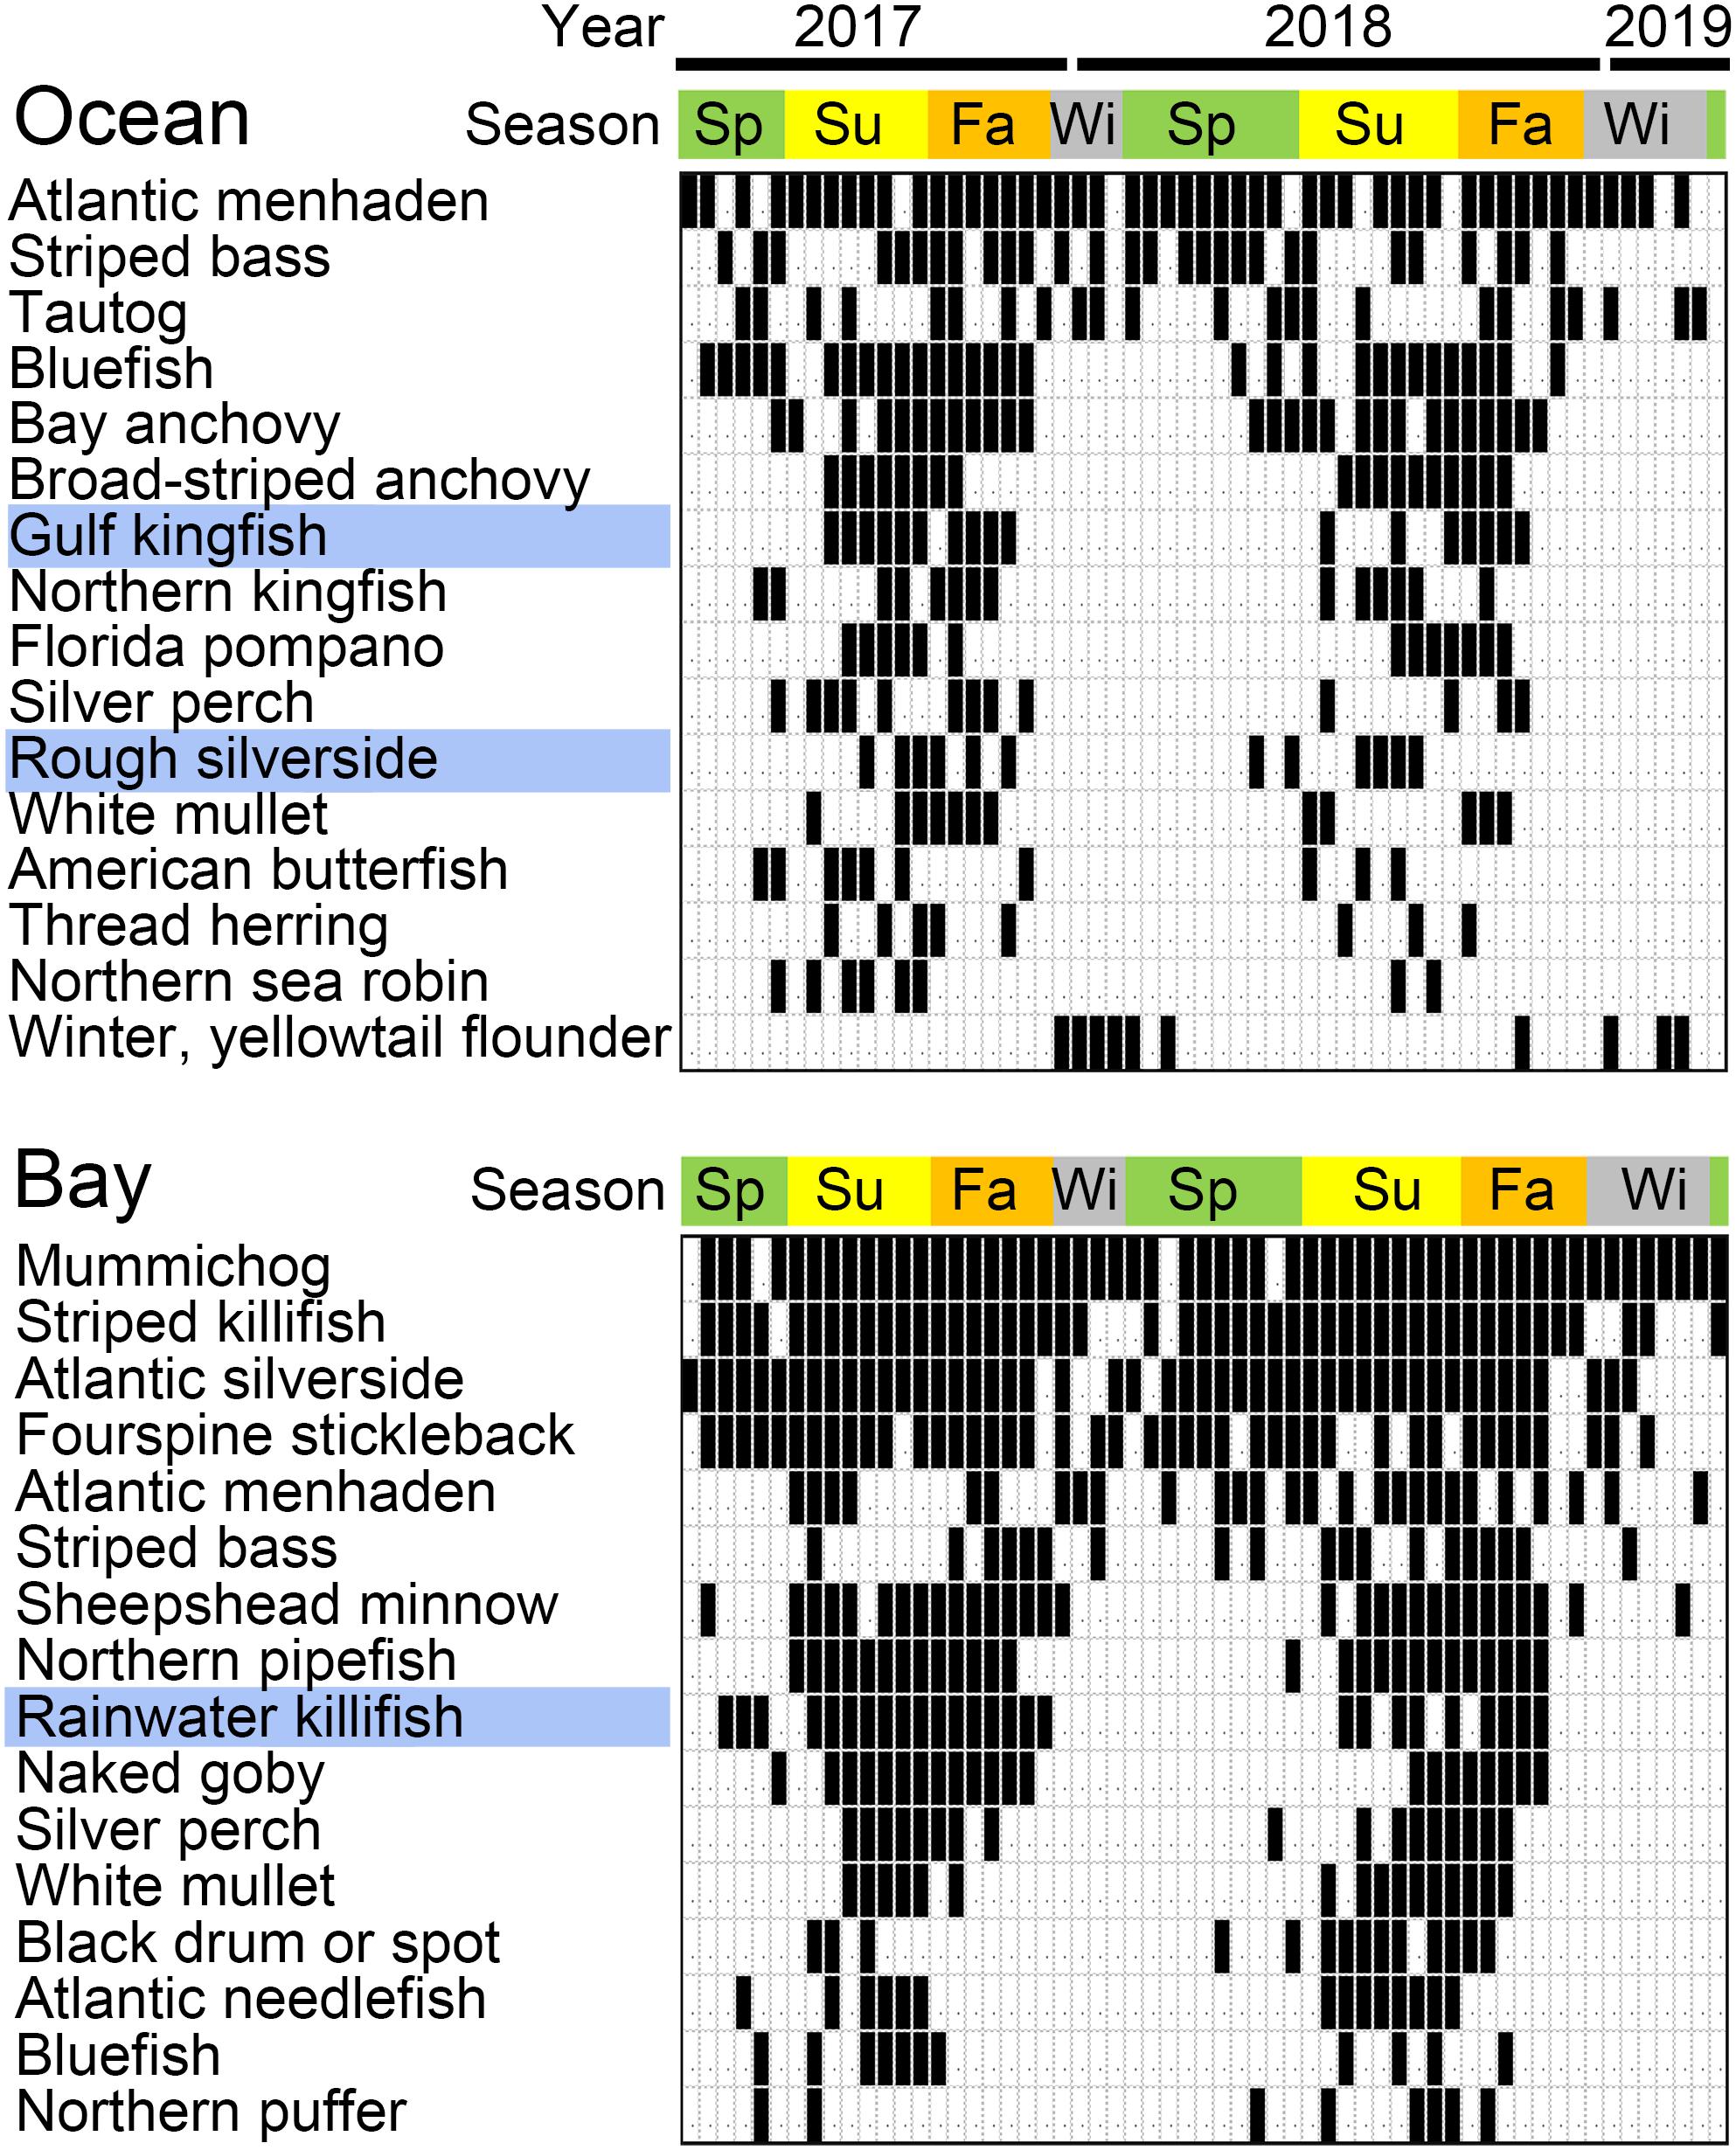
Figure 4. Detection of selected bony fish species. Positive samples are indicated in black. Blue highlights fishes with new reference sequences reported in this study. Most seasonal species were restricted to warmer months, except for winter or yellowtail flounder (Pseudopleuronectes americanus or Limanda ferruginea), both cold water specialists.
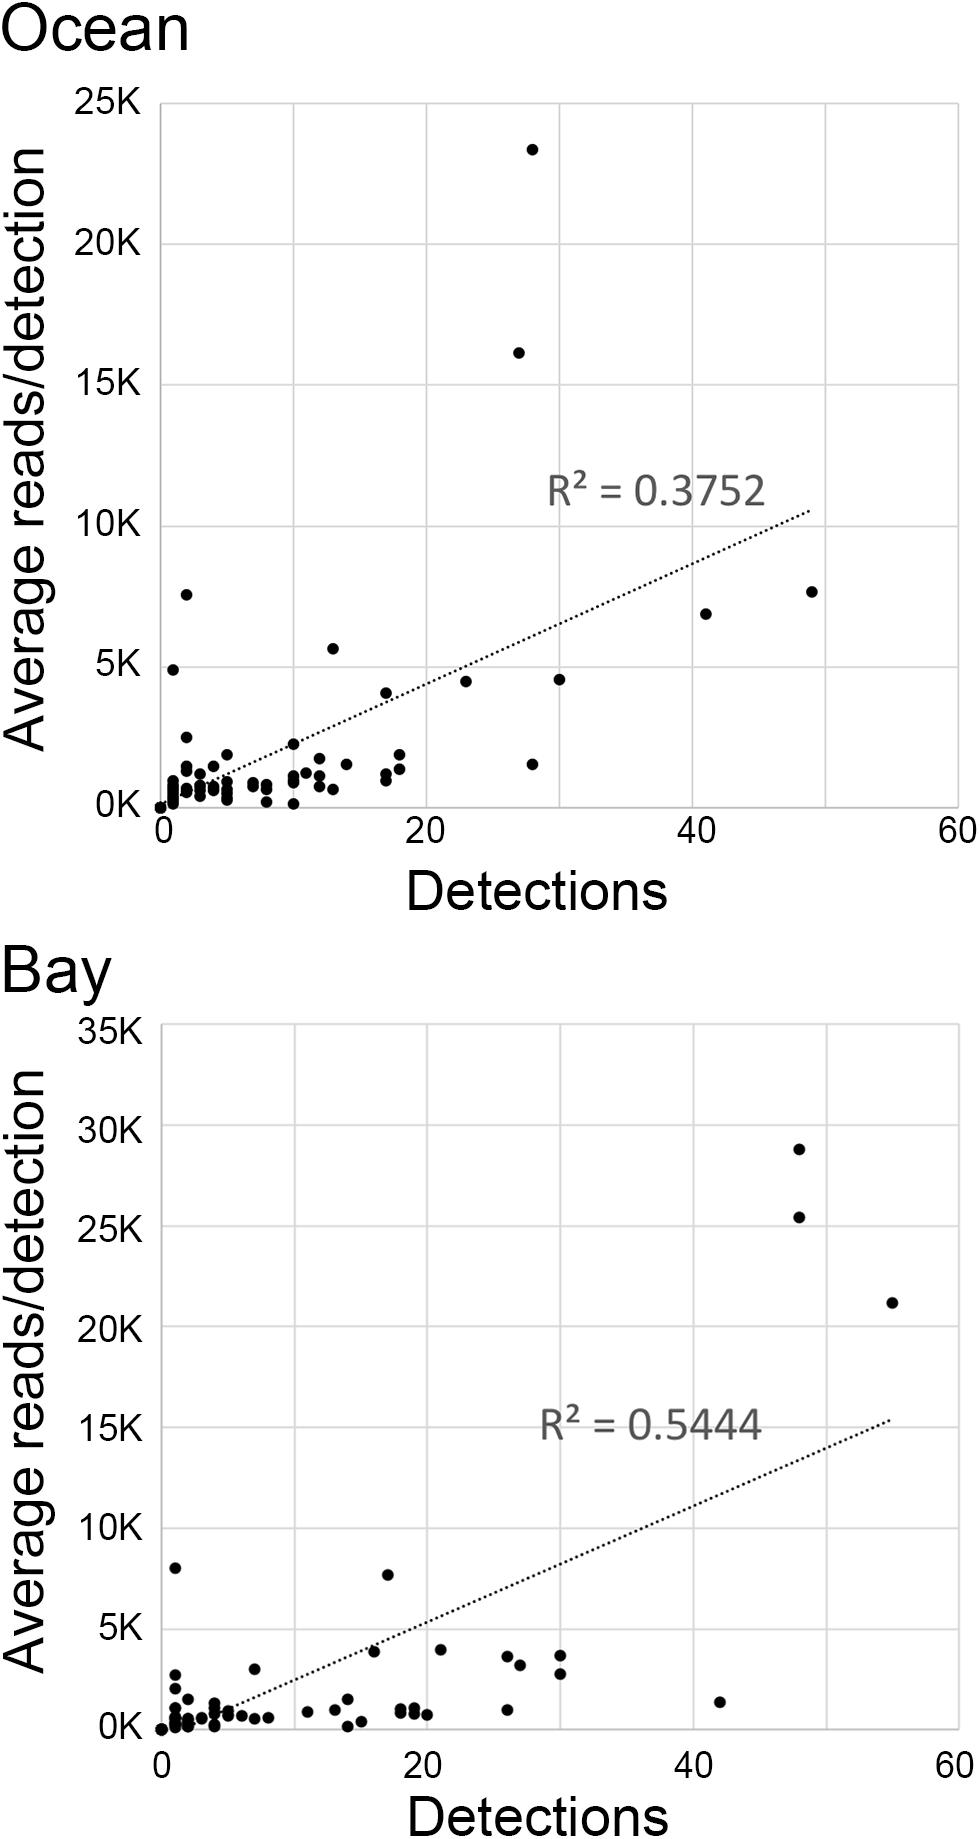
Figure 5. eDNA abundance (average reads/detection) vs. frequency (number of detections) for bony fish species.
Cartilaginous Fish eDNA
The AFS/AR primer pair generated on average about 6,000 and 2,000 elasmobranch reads from ocean and bay libraries, respectively (Supplementary Table 5). Detections were strongly seasonal, with most species limited to warmer months, except for little or winter skate (Leucoraja erinacea or L. ocellata) and spiny dogfish (Squalus acanthias), which are known to move into this region during cold water months (Figure 6). New reference sequences ID’d three elasmobranch ASVs, including Brazilian cownose ray (Rhinoptera brasiliensis), a semi-tropical species with U.S. records limited to the Gulf of Mexico. Unlike congener R. bonasus, R. brasiliensis eDNA was not found in the bay (0/59 vs. 7/59, p = 0.0129, Fisher’s exact test). A decayed individual found near the ocean collection site in August 2017 was identified as Brazilian cownose ray based on 12S and COI sequences (Table 1 and Supplementary Figure 3).
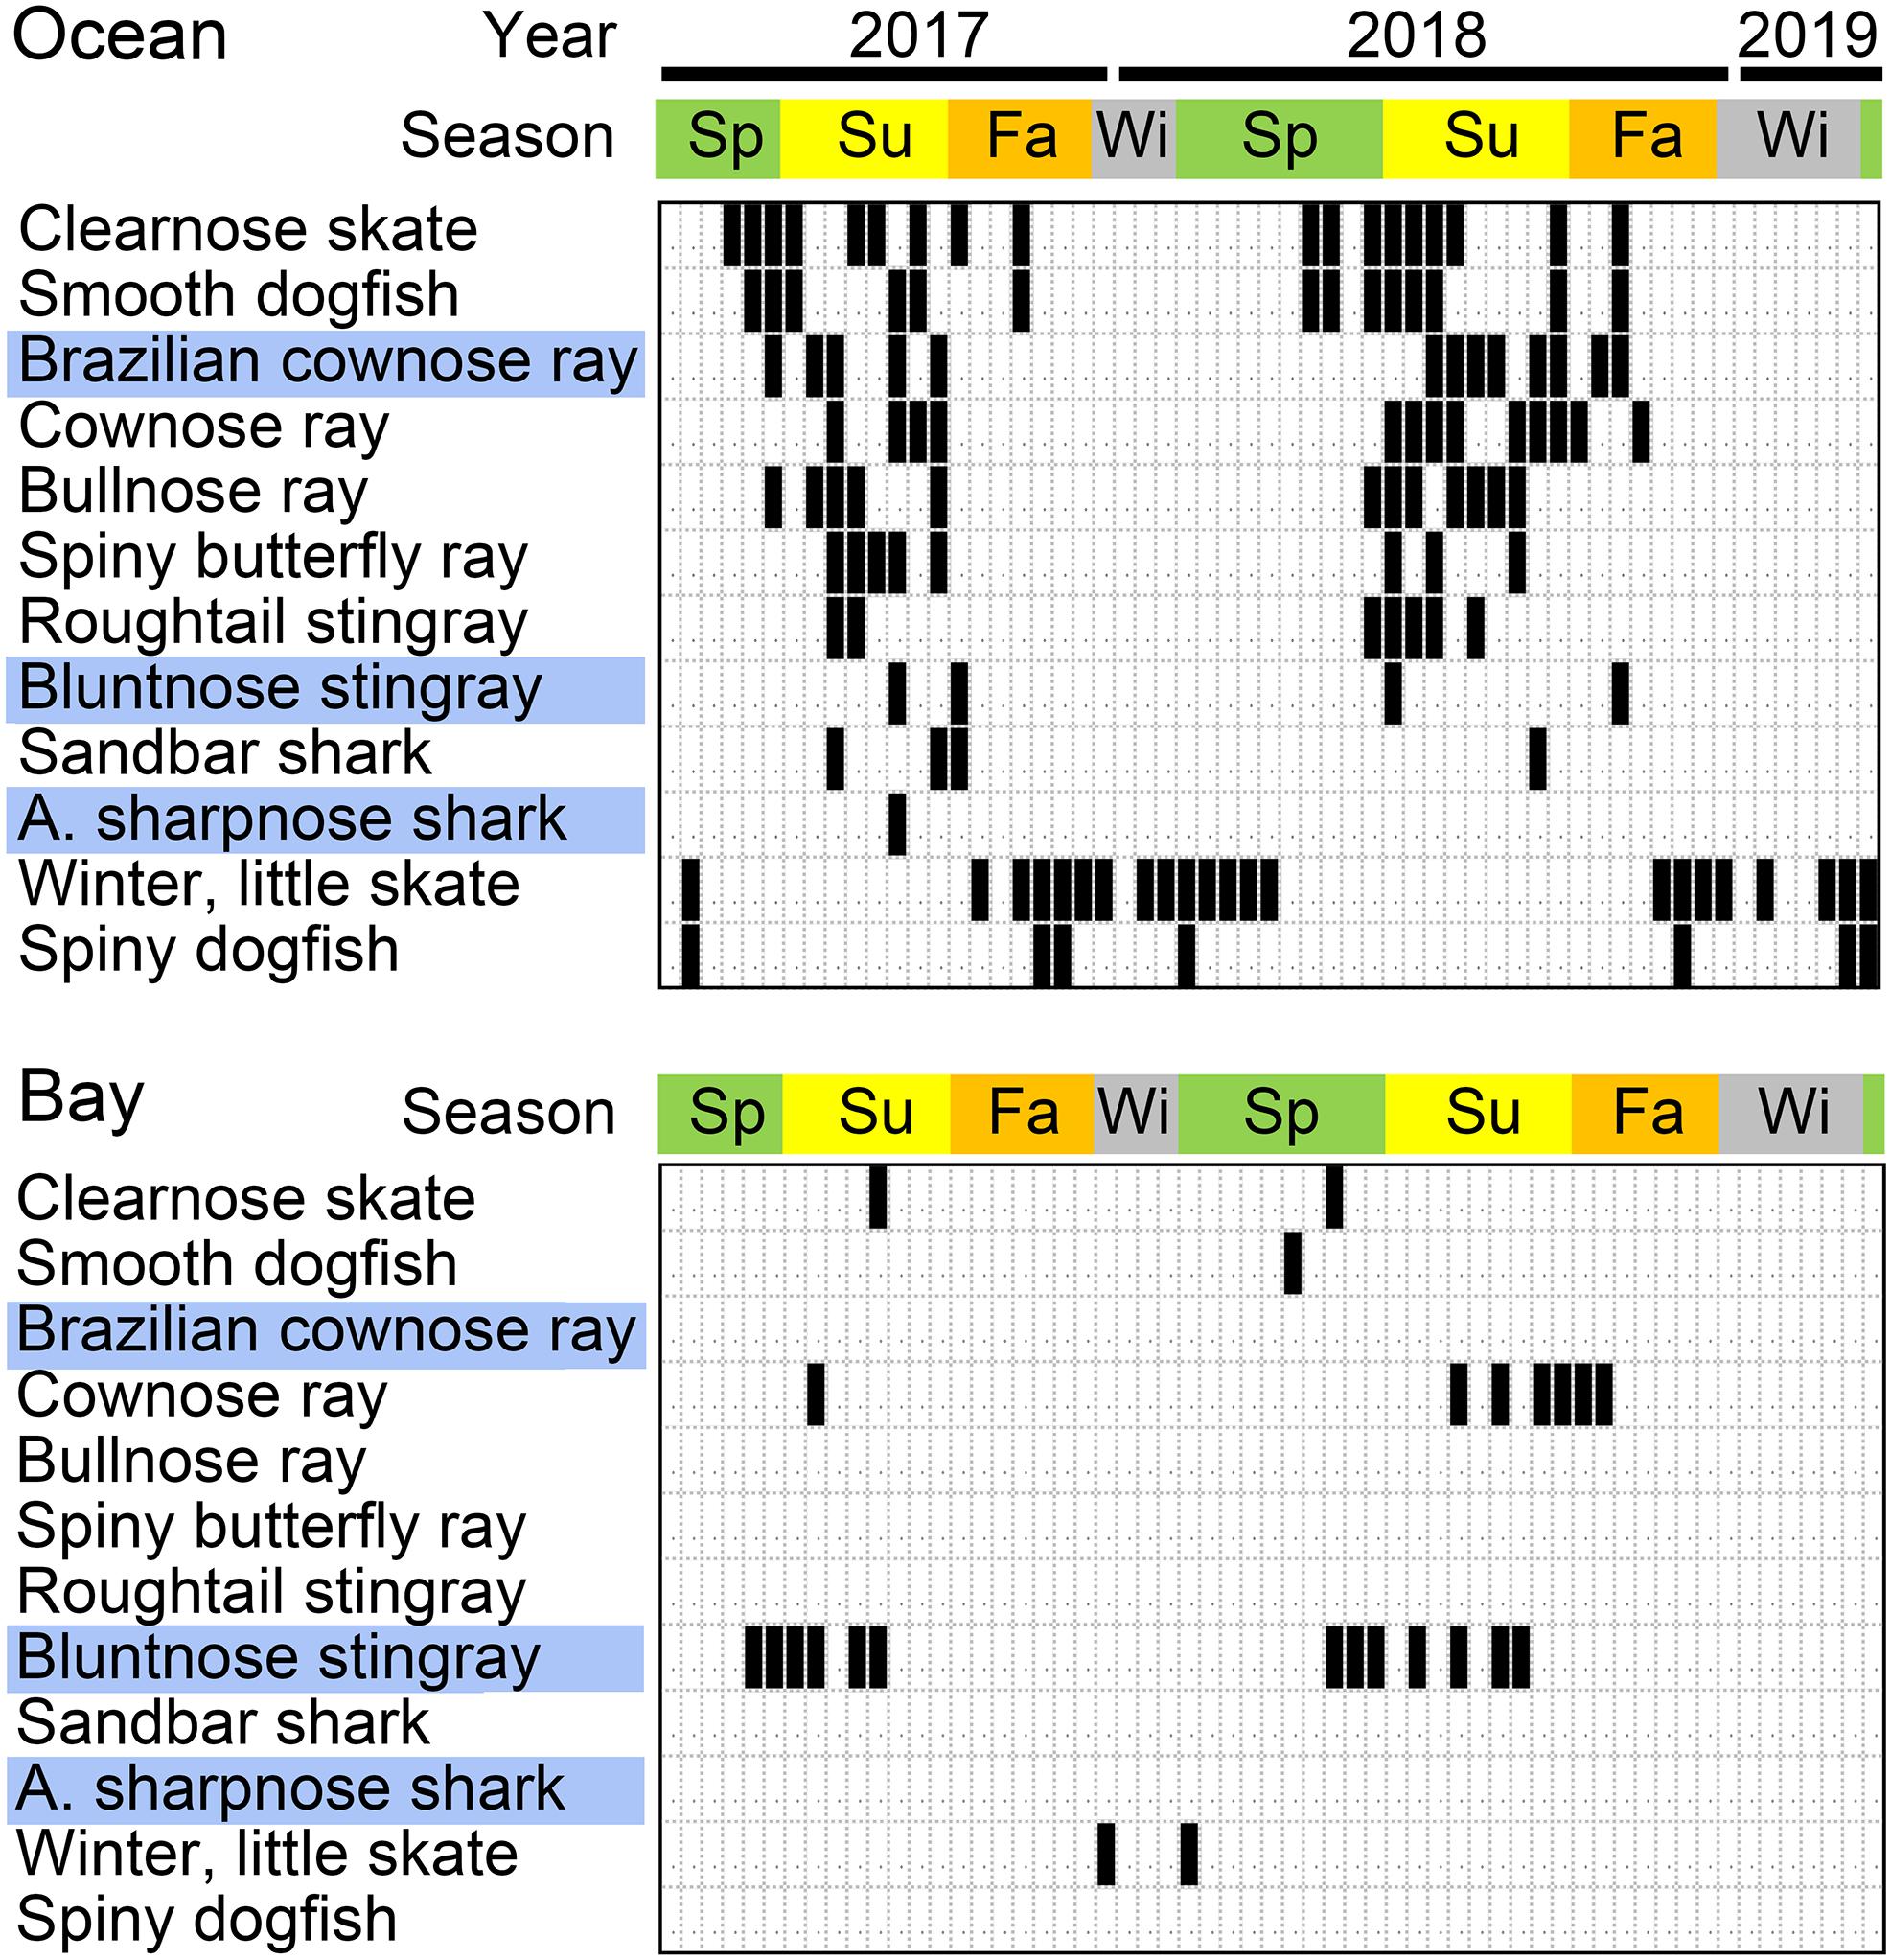
Figure 6. Sharks, rays, and skates found by eDNA metabarcoding in coastal New Jersey. Positive samples are indicated in black. Fishes with new reference sequences reported in this study are highlighted in blue.
Other Fishes, Non-fish Vertebrate eDNA
Other non-checklist fish eDNAs included skilletfish (Gobiesox strumosus) (seven samples), Pacific sand lance (Ammodytes hexapterus) (4), capelin (Mallotus villosus) (1), and butterfly kingfish (Gasterochisma melampus) (1). Human and domestic animal DNAs were regularly amplified from field samples and from negative controls (Supplementary Table 9), as commonly observed with vertebrate primers (Leonard et al., 2007). Given their presence in negative controls, all detections of human and domestic animal DNA were considered as of unknown origin. In addition, ASVs matching land and marine mammals, birds, and turtles were recovered from field samples and not from negative controls (Supplementary Table 9). The accuracy and comprehensiveness of 12S reference library for non-fish vertebrates were not assessed.
Discussion
Here we evaluate the existing eDNA metabarcoding reference library for U.S. mid-Atlantic coastal fishes, provide new reference sequences for 31 species, and test the enhanced library against a 2-year time series of water samples from ocean and bay sites in New Jersey. The new library enabled exact match identifications for most all (90%) fish ASVs generated from time series samples, revealing strong seasonal patterns and differences in species distribution between ocean and bay. To our knowledge, this is the most detailed multi-year time series of New York Bight fishes by any methodology to date, highlighting eDNA’s potential for relatively low-cost, low-impact mapping of marine life. Our findings add evidence that aquatic eDNA is localized in space and time consistent with fish distribution and abundance, supporting expanded application in ocean monitoring and exploration (Baker et al., 2018; Lafferty et al., 2018; Holman et al., 2019; Yamahara et al., 2019).
eDNA revealed the Gulf kingfish (Menticirrhus littoralis) as a common seasonal migrant, with similar occurrences as congeneric northern kingfish (M. saxatilis) (NJ Checklist status, common). In 1907, the Gulf kingfish was described as “rarely if ever straying north of North Carolina” (Smith, 1907) and subsequently found to be seasonally present in Chesapeake Bay, about 350 km south of our study site (Hildebrand and Schroeder, 1928; Murdy et al., 1997). A recreational fishing website mentions a Gulf kingfish caught in Long Beach Island, New Jersey (Delaware Surf Fishing, 2019), but we have not found any scientific reports of M. littoralis north of Chesapeake Bay, including the absence from NJ Trawl Surveys conducted during the period of this study and from regional checklists (Able, 1992; Briggs and Waldman, 2002; Collette and Klein-MacPhee, 2002; Froese and Pauly, 2019). Our findings do not help answer whether the Gulf kingfish recently extended its range northward or whether the species has been present for some time but overlooked, possibly due to a restricted distribution or morphologic similarity to related species. In addition, the possible limit of putative range extension is unknown. Among other field samples analyzed in these MiSeq runs, the Gulf kingfish eDNA was found in one of 17 samples from outer New York harbor in spring and summer 2017, and none of nine collected in Martha’s Vineyard in summer 2018. Given the absence of a physical specimen, it is possible that eDNA matching Gulf kingfish was derived from a related species. However, including the new sequences reported in this study, all kingfish family (Sciaenidae) taxa on the NJ Checklist have species-specific 12S sequences.
eDNA found both cownose ray (Rhinopterabonasus) and Brazilian cownose ray (R. brasiliensis) as relatively common warm season migrants. Seasonal appearance of cownose ray eDNA fits the checklist status as occasional in summer as well as recent New Jersey Trawl Survey results. Brazilian cownose ray eDNA was a surprise, and this discovery was bolstered by COI and 12S mtDNA testing of a beach wrack specimen. As the specimen was not examined morphologically, we cannot exclude possibility that this was a R. bonasus individual carrying introgressed R. brasiliensis mtDNA. R. brasiliensis was originally described as limited to coastal Brazil and more recently found to be widespread in the Gulf of Mexico from southern Mexico to Alabama, but not in Chesapeake Bay (Vooren and Lamónaca, 2004; Jones et al., 2017; Palacios-Barreto et al., 2017). R. bonasus, which abounds in Chesapeake Bay, was also detected in Barnegat Bay by eDNA, where R. brasiliensis eDNA was absent. This brings up the possibility that the two batoids have different habitat preferences. The three Rhinoptera species found in U.S. waters, namely, bonasus, brasiliensis, and steindachneri (Pacific cownose ray), closely resemble one another, challenging even expert morphologic discrimination (Naylor et al., 2012). It is uncertain whether R. brasiliensis recently extended its range or has been present but overlooked, perhaps due to morphologic conservation or patchy distribution. Of note, single specimens of Brazilian cownose ray are reported from Nantucket and North Carolina, dating to 1881 and 1953, respectively (Bigelow and Schroeder, 1953; Jones et al., 2017).
Regarding other non-checklist taxa, the range of skilletfish extends to New Jersey (Murdy et al., 1997). A recent study found eDNA matching Pacific sand lance in Long Island Sound, and it is unknown whether this reflects species presence or an imperfect database (Liu et al., 2019). Single detections of the other two extra-limital fishes, butterfly kingfish and capelin, are also of uncertain significance.
The limitations of this study include potential misidentifications due to absent representation of relevant species or unrecognized errors in the reference database. Some unmatched ASVs may be unrecorded haplotypes of species already in GenBank, particularly as 12S accessions for most fishes are few (median two individuals/species). As with other mtDNA genes, 12S IDs can be misled by hybridization, which can result in mitochondrial introgression, i.e., mitochondrial genomes shared between species. This caveat applies to all species identifications based solely on mtDNA, including those in this study. However, to our knowledge, mitochondrial introgression in marine fishes is reported relatively uncommonly (Hubbs, 1955; Gardner, 1997; Montanari et al., 2012), and we are not aware of documentation for species in this study. Other possible impediments common to metabarcoding studies include distorted results due to primer bias, stochastic effects of amplification leading to erratic detection, and unrecognized cross-contamination (Deiner et al., 2017).
Alternate eDNA targets may yield different or additional information. In particular, the MiFish segment of the 12S rRNA gene, immediately adjacent to the ecoPrimer V5 region targeted in this study, is longer (average 170 vs. 106 bp) and better resolves some closely related species (Miya et al., 2015) compared to the V5 region. We chose the V5 region due to concerns about potential primer bias, as our preliminary analysis indicated that MiFish-U primer set has more mismatches against bony fishes than V5 AF/AR primers have. Whether these mismatches affect amplification is not known. Given the wide interest in fish stock assessment via eDNA, a systematic comparison of these primer sets may be worthwhile.
Our results are consistent with a positive relationship between fish abundance and eDNA detection, as the protocol commonly found common fishes and rarely found rare ones. Most (70%) time series species are ranked common or abundant including all top 15 from the ocean and the bay, while most (70%) checklist species are occasional or rare. Even when present, rare fishes may be hard to discover by metabarcoding, as scarce eDNAs amplify less consistently than more abundant lineages (Ficetola et al., 2015; Furlan et al., 2016; Stoeckle et al., 2017). Apprehension of uncommon fishes amidst a sea of plentiful forms can challenge metabarcoding. In one report, lineages representing less than 0.05% (i.e., 1/2,000) of the total vertebrate DNA were not detected, even with 15 replicate amplifications, which presumably reflects constraints inherent in PCR (Sato et al., 2017; Kelly et al., 2019). In our study, the least common species, i.e., those found only once, all had more than 100 reads, whereas one might expect to recover uncommon species with as few as a single read. This observation may reflect absent amplification of rarer lineages. The apparent dynamic range of our protocol – the difference between the highest read number from common species and the lowest read number from single-detection species – was about 2,000-fold (Supplementary Figure 4). Non-amplification methods may help extend the lower limit of metabarcoding detection (Mariac et al., 2018).
In this study we provide a 2-year metabarcoding look at ocean and bay fishes in coastal New Jersey. New reference sequences combined with existing GenBank records demonstrate strong differences by season and site consistent with fish biology, and reveal two southern fishes, not recorded in traditional surveys, as warm season migrants. Gaining new insights in a well-studied ecosystem spotlights the added value of this technology. Our findings of fish species north of their prior ranges are consistent with long-term trends in U.S. Mid-Atlantic, which show northward movement of multiple fish populations over the past 40 years, attributed to ocean warming (Nye et al., 2009; Cleary et al., 2017). Looking ahead, piggybacking eDNA collection onto existing marine surveys will likely speed understanding of how eDNA can augment established methods for assessing diversity and abundance (e.g., Thomsen et al., 2016; Watts and Miksis-Olds, 2018; Berry et al., 2019).
Data Availability Statement
All 12S and COI sequences generated in this study are deposited in GenBank under Accession nos. MN883172–MN883232 and MN883233–MN883290, respectively. Illumina FASTQ files are deposited in NCBI Sequence Read Archive (NCBI BioProject ID PRJNA358446).
Author Contributions
MS conceived and designed the study and wrote the first draft of the manuscript and generated the figures. MS and MD performed the DNA analysis. ZC-P designed the bioinformatics pipeline. MS, MD, and ZC-P contributed to manuscript revision and read and approved the final version.
Funding
This work received support from Monmouth University–Rockefeller University Marine Science Policy Initiative. The funders had no role in the study design, data collection and analysis, decision to publish, or preparation of the manuscript.
Conflict of Interest
The authors declare that the research was conducted in the absence of any commercial or financial relationships that could be construed as a potential conflict of interest.
Acknowledgments
We thank Jesse Ausubel for the encouragement and editorial comments, and Jeanne Garbarino, Disan Davis, Doug Heigl, Lizzie Krisch, and Odaelys Walwyn for the laboratory space and assistance.
Supplementary Material
The Supplementary Material for this article can be found online at: https://www.frontiersin.org/articles/10.3389/fmars.2020.00226/full#supplementary-material
Footnotes
References
Able, K. W. (1992). Checklist of New Jersey saltwater fishes. (1992). Bull. N. J. Acad. Sci. 37, 1–11.
Able, K. W., Grothues, T. M., Rowe, P. M., Wuenschel, M. J., and Vasslides, J. M. (2011). Near-surface larval and juvenile fish in coastal habitats: comparisons between the inner shelf and an estuary in the New York Bight during summer and fall. Estuar. Coast. 34, 726–738. doi: 10.1007/s12237-011-9399-1
Able, K. W., Wilber, D. H., Muzeni-Corino, A., and Clarke, D. G. (2010). Spring and summer larval fish assemblages in the surf zone and nearshore off northern New Jersey. USA. Estuar. Coast. 33, 211–222. doi: 10.1007/s12237-009-9240-2
Andruszkiewicz, E. A., Koseff, J. R., Fringer, O. B., Ouellette, N. T., Lowe, A. B., Edwards, C. A., et al. (2019). Modeling environmental DNA transport in the coastal ocean using Lagrangian particle tracking. Front. Mar. Sci. 6:477. doi: 10.3389/fmars.2019.00477
Andruszkiewicz, E. A., Starks, H. A., Chavez, F. P., Sassoubre, L. M., Block, B. A., and Boehm, A. B. (2017). Biomonitoring of marine vertebrates in Monterey Bay using eDNA metabarcoding. PLoS One 12:e0176343. doi: 10.1371/journal.pone.0176343
Baker, C. S., Steel, D., Nieukirk, S., and Klinck, H. (2018). Environmental DNA (eDNA) from the wake of the whales: droplet digital PCR for detection and species identification. Front. Mar. Sci. 5:133. doi: 10.3389/fmars.2018.00133
Berry, T. E., Saunders, B. J., Coghlan, M. L., Stat, M., Jarman, S., Richardson, A. J., et al. (2019). Marine environmental DNA biomonitoring reveals seasonal patterns in biodiversity and identifies ecosystem responses to anomalous climatic events. PLoS Genet. 15:e1007943. doi: 10.1371/journal.pgen.1007943
Bigelow, H. B., and Schroeder, W. C. (1953). “Sawfishes, guitarfishes, skates, and rays,” in Fishes of the Western North Atlantic Memoirs of the Sears Memorial Foundation for Marine Research, eds J. Tee-Van and C. M. Breeder (New Haven: Yale University Press).
Briggs, P. T., and Waldman, J. R. (2002). Annotated list of fishes reported from the marine waters of New York. Northeastern Nat. 9, 47–80.
Buxton, A. S., Groombridge, J. J., Zakaria, N. B., and Griffiths, R. A. (2017). Seasonal variation in environmental DNA in relation to population size and environmental factors. Sci. Rep. 7:46294. doi: 10.1038/srep46294
Callahan, B., McMurdie, P. J., and Holmes, S. P. (2017). Exact sequence variants should replace operational taxonomic units in marker-gene data analysis. ISME J. 11, 2639–2643. doi: 10.1038/ismej.2017.119
Callahan, B. J., McMurdie, P. J., Rosen, M. J., Han, A. W., Johnson, J. A., and Holmes, S. P. (2016). DADA2: high-resolution sample inference from Illumina amplicon data. Nat. Methods 13, 581–583. doi: 10.1038/nmeth.3869
Cleary, J., Roberts, S., Curtice, C., and Halpin, P. N. (2017). Exploring Species Range Shifts in the U.S. Mid Atlantic: Existing Literature, Web Portals, and Data”, report prepared for the Mid-Atlantic Council on the Ocean (MARCO). Durham: Marine Geospatial Ecology Lab at Duke University.
Collette, B. B., and Klein-MacPhee, G. (eds) (2002). Bigelow and Schroeder’s Fishes of the Gulf of Maine, 3rd Edn. Washington, DC: Smithsonian Institution Press.
Collins, R. A., Wangensteen, O. S., O’Gorman, E. J., Mariani, S., Sims, D. W., and Genner, M. J. (2018). Persistence of environmental DNA in marine systems. Commun Biol. 1:185. doi: 10.1038/s42003-018-0192-6
Deiner, K., Bik, H. M., Machler, E., Seymour, M., Lacoursiere-Roussel, A., Altermatt, F., et al. (2017). Environmental DNA metabarcoding: transforming how we survey animal and plant communities. Mol. Ecol. 26, 5872–5895. doi: 10.1111/mec.14350
Delaware Surf Fishing (2019). Available online at: https://www.delaware-surf-fishing.com/new-kingfish-town (accessed December 17, 2019).
Ficetola, G. F., Miaud, C., Pompanon, F., and Taberlet, P. (2008). Species detection using environmental DNA from water samples. Biol. Lett. 4, 423–425. doi: 10.1098/rsbl.2008.0118
Ficetola, G. F., Pansu, J., Bonin, A., Coissac, E., Giguet-Covex, C., DeBarba, M., et al. (2015). Replication levels, false presences and the estimation of the presence/absence from eDNA metabarcoding data. Mol. Ecol. Resour. 15, 543–556. doi: 10.1111/1755-0998.12338
Froese, R., and Pauly, D. (eds) (2019). FishBase World Wide Web Electronic Publication, Vol. 10, Rome: FAO.
Furlan, E. M., Gleeson, D., Hardy, C. M., and Duncan, R. P. (2016). A framework for estimating the sensitivity of eDNA surveys. Mol. Ecol. Resour. 16, 641–654. doi: 10.1111/1755-0998.12483
Griekspoor, A., and Groothuis, T. (2019). 4Peaks Software. Available online at: https://nucleobytes.com (accessed January 1, 2019).
Hansen, B. K., Bekkevold, D., Clausen, L. W., and Nielsen, E. E. (2018). The skeptical optimist: challenges and perspectives for the application of environmental DNA in marine fisheries. Fish Fish. 19, 751–768.
Hildebrand, S. F., and Schroeder, W. C. (1928). Fishes of Chesapeake Bay. Bulletin Vol. XLIII, Part I. Washington, DC: U.S. Department of Commerce.
Hinks, G., and Barry, L. (2019). Ocean Trawling Survey, 2019. Trenton, NJ: New Jersey Department of Environmental Protection.
Holman, L. E., de Bruyn, M., Crer, S., Carvalho, G., Robidart, J., and Rius, M. (2019). Detection of introduced and resident marine species using environmental DNA metabarcoding of sediment and water. Sci. Rep. 9:11559. doi: 10.1038/s41598-019-47899-7
Ivanova, N. V., Zemlak, T. S., Hanner, R. H., and Hebert, P. D. N. (2007). Universal primer cocktails for fish DNA barcoding. Mol. Ecol. Notes 7, 544–548. doi: 10.1139/gen-2018-0145
Jones, C. M., Hoffmayer, E. R., Hendon, J. M., Quattro, J. M., Lewandowski, J., Roberts, M. A., et al. (2017). Morphological conservation of rays in the genusRhinoptera (Elasmobranchii, Rhinopteridae) conceals the occurrence of a large batoid, Rhinopterabrasiliensis Müller, in the northern Gulf of Mexico. Zootaxa 4286, 499–514.
Kelly, R. P., Closek, C. J., O’Donnell, J. L., Kralj, J. E., Shelton, A. O., and Samhouri, J. F. (2017). Genetic and manual survey methods yield different and complementary views of an ecosystem. Front. Mar. Sci. 3:283. doi: 10.3389/fmars.2016.00283
Kelly, R. P., Port, J. A., Yamahara, K. M., and Crowder, L. B. (2014). Usingenvironmental DNA to census marine fish in a large mesocosm. PLoS One 9:e86175. doi: 10.1371/journal.pone.0086175
Kelly, R. P., Shelton, A. O., and Gallego, R. (2019). Understanding PCR processes to draw meaningful conclusions from environmental DNA studies. Sci. Rep. 9:12133. doi: 10.1038/s41598-019-48546-x
Kirchoff, K. N., Hauffe, T., Stelbrink, B., Albrecht, C., and Wilke, T. (2017). Evolutionary bottlenecks in brackish water habitats drive the colonization of fresh water by stingrays. J. Evol. Biol. 30, 1576–1591. doi: 10.1111/jeb.13128
Kumar, S., Tamura, K., and Nei, M. (2004). MEGA3: integrated software for molecular evolutionary genetics analysis and sequence alignment. Brief Bioinform. 5, 150–163. doi: 10.1093/bib/5.2.150
Lafferty, K. D., Benesh, K. C., Mahon, A. R., Jerde, C. L., and Lowe, C. H. (2018). Detecting southern California’s white sharks with environmental DNA. Front. Mar. Sci. 5:355. doi: 10.3389/fmars.2018.00355
Lamb, P. D., Hunter, E., Pinnegar, J. K., Creer, S., Davis, R. G., and Taylor, M. I. (2019). How quantitative is metabarcoding: a meta-analytical approach. Mol. Ecol. 28, 420–430. doi: 10.1111/mec.14920
Leonard, J. A., Shanks, O., Hofreiter, M., Kreuz, E., Hodges, L., Ream, W., et al. (2007). Animal DNA in PCR reagents plagues ancient DNA research. J. Archaeol. Sci. 34, 1361–1366.
Levesque, J. C. (2019). Spatio-temporal patterns of the oceanic conditions and nearshore marine community in the Mid-Atlantic Bight (New Jersey. USA). PeerJ. 7:e7927. doi: 10.7717/peerj.7927
Li, C., and Ortí, G. (2007). Molecular phylogeny of Clupeiformes (Actinopterygii) inferred from nuclear and mitochondrial DNA sequences. Mol. Phylogenet. Evol. 44, 386–398. doi: 10.1016/j.ympev.2006.10.030
Liu, Y., Wikfors, G. H., Rose, J. M., McBride, R. S., Milke, L. M., and Mercaldo-Allen, R. (2019). Application of environmental DNA metabarcoding to spatiotemporal finfish community assessment in a temperate embayment. Front. Mar. Sci. 6:674. doi: 10.3389/fmars.2019.00674
Lodge, D. M., Turner, C. R., Jerde, C. L., Barnes, M. A., Chadderton, L., Egan, S. P., et al. (2012). Conservation in a cup of water: estimated biodiversity and population abundance from environmental DNA. Mol. Ecol. 21, 2555–2558. doi: 10.1111/j.1365-294X.2012.05600.x
Mariac, C., Vigouroux, Y., Duponchelle, F., García-Dávila, C., Nunez, J., Desmarais, E., et al. (2018). Metabarcoding by capture using a single COI probe (MCSP) to identify and quantify fish species in ichthyoplankton swarms. PLoS One 13:e0202976. doi: 10.1371/journal.pone.0202976
Miya, M., Sato, Y., Fukunaga, T., Sado, T., Poulsen, J. Y., Sato, K., et al. (2015). MiFish, a set of universal PCR primers for metabarcoding environmental DNA from fishes: detection of more than 230 subtropical marine species. R. Soc. Open Sci. 2:150088. doi: 10.1098/rsos.150088
Montanari, S. R., van Herwerden, L., Pratchett, M. S., Hobbs, J. P., and Fugedi, A. (2012). Reef fish hybridization: lessons learnt from butterflyfishes (genus Chaetodon). Ecol. Evol. 2, 310–328. doi: 10.1002/ece3.83
Murdy, E. O., Birdsong, R. S., and Musick, J. A. (1997). Fishes of Chesapeake Bay. Washington, DC: Smithsonian Institution.
Naylor, G. J. P., Caira, J. N., Jensen, K., Rosana, K. A. M., White, W. T., and Last, P. R. (2012). A DNA sequence-based approach to the identification of shark and ray species and its implications for global elasmobranch diversity and parasitology. Bull. Am. Mus. Nat. Hist. 367, 1–263.
Nye, J. A., Link, J. S., Hare, J. A., and Overholtz, W. J. (2009). Changing spatial distribution of fish stocks in relation to climate and population size on the Northeast United States continental shelf. Mar. Ecol. Progr. Ser. 393, 111–129.
Palacios-Barreto, P., Cruz, V. P., Foresti, F., Rangel, B. D. S., Uribe-Alcocer, M., and Díaz-James, P. (2017). Molecular evidence supporting the expansion of the geographical distribution of the Brazilian cownose ray Rhinopterabrasiliensis (Myliobatiformes: Rhinopteridae) in the western Atlantic. Zootaxa 4341, 593–600. doi: 10.11646/Zootaxa.4341.4.12
Politis, P. J., Galbraith, J. K., Kostovick, P., and Brown, R. W. (2014). Northeast Fisheries Science Center bottom trawl survey protocols for the NOAA Ship Henry B. Bigelow. Northeast Fisheries Sci Cent Ref Doc 14-06. Silver Spring, MA: NOAA
Pompanon, F., Coissac, E., and Taberlet, P. (2011). Metabarcoding, une nouvelle façon d’analyser la biodiversité. Biofutur 319, 30–32.
Port, J. A., O’Donnell, J. L., Romero-Maraccini, O. C., Leary, P. R., Litvin, S. Y., Nickols, K. J., et al. (2016). Assessing vertebrate biodiversity in a kelp forest using environmental DNA. Mol. Ecol. 25, 527–541. doi: 10.1111/mec.13481
Riaz, T., Shehzad, W., Viari, A., Pompanon, F., Taberlet, P., and Coissac, E. (2011). ecoPrimers: inference of new DNA barcode markers from whole genome sequence analysis. Nuclic Acids Res. 39:e145. doi: 10.1093/nar/gkr732
Sato, H., Sogo, Y., Doi, H., and Yamanaka, H. (2017). Usefulness and limitations of sample pooling for environmental DNA metabarcoding of freshwater fish communities. Sci. Rep. 7:14860. doi: 10.1038/s41598-017-14978-6
Seabergh, W., Cialone, M., McCormick, J., Watson, K., and Chasten, M. (2003). Monitoring Barnegat Inlet, New Jersey, South Jetty Realignment. U.S. Army Corps of Engineers, ERDC/CHL TR-03-9. Available online at: https://www.researchgate.net/publication/235146412_Monitoring_Barnegat_Inlet_New_Jersey_South_Jetty_Realignment (Accessed January 5, 2020).
Smith, H. M. (1907). The fishes of North Carolina. North Carolina Geological and Economic Survey, Vol. II., Raleigh: Uzzell.
Stoeckle, M. Y., Mishu, M. D., and Charlop-Powers, Z. (2018). GoFish: a versatile nested PCR strategy for environmental DNA assays for marine vertebrates. PLoS One 13:e0198717. doi: 10.1371/journal.pone.0198717
Stoeckle, M. Y., Soboleva, L., and Charlop-Powers, Z. (2017). Aquatic environmental DNA detects seasonal fish abundance and habitat preference in an urban estuary. PLoS One 12:e0175186. doi: 10.1371/journal.pone.0175186
Taberlet, P., Bonin, A., Zinger, L., and Coissac, E. (2018). Environmental DNA for Biodiversity Research and Monitoring. New York, NY: Oxford University Press.
Tatham, T. R., Thomas, D. L., and Danila, D. J. (1984). “Fishes of Barnegat Bay,” in Ecology of Barnegat Bay, Vol. 6, eds M. J. Kennish and R. A. Lutz (New Jersey: Springer-Verlag).
Thomsen, P. F., Kielgast, J., Iversen, L. L., Møller, P. R., Rasmussen, M., and Willerslev, E. (2012). Detection of diverse marine fish fauna using environmental DNA from seawater samples. PLoS One 7:e41732. doi: 10.1371/journal.pone.0041732
Thomsen, P. F., Møller, P. R., Sigsgaard, E. E., Knudsen, W., Jørgensen, O. A., and Willerslev, E. (2016). Environmental DNA from seawater samples correlate with trawl catches of subarctic, deepwater fishes. PLoS One 11:e0165252. doi: 10.1371/journal.pone.0165252
Turner, C. R., Barnes, M. A., Xu, C. C. Y., Jones, S. E., Jerde, C. L., and Lodge, D. M. (2014). Particle size distribution and optimal capture of aqueous macrobial eDNA. Methods Ecol. Evol. 5, 676–684.
Valenti, J. L., Grothues, T. M., and Able, K. W. (2017). Estuarine fish communities along a spatial urbanization gradient. J. Coast. Res. 78, 254–268.
Vooren, C. M., and Lamónaca, A. F. (2004). Rhinopterabrasiliensis. The IUCN Red List of Threatened Species 2004: e.T44595A10912274. Available online at: http://dx.doi.org/10.2305/IUCN.UK.2004.RLTS.T44595A10912274.en (accessed December 17, 2019).
Watts, A. W., and Miksis-Olds, J. L. (2018). “The ocean as a living sensor: environmental DNA and acoustics for detecting marine life,” in Proceedings of the National Conference on Marine Environmental DNA 2018. New York, NY.
Yamahara, K. M., Preston, C. M., Birch, J., Walz, K., Marin, I. I. I. R., Jensen, S., et al. (2019). In situ autonomous acquisition and preservation of marine environmental DNA using an autonomous underwater vehicle. Front. Mar. Sci. 6:373. doi: 10.3389/fmars.2019.00373
Yamamoto, S., Masuda, R., Sato, Y., Sado, T., Araki, H., Kondoh, M., et al. (2017). Environmental DNA metabarcoding reveals local fish communities in a species-rich coastal sea. Sci. Rep. 7:40368. doi: 10.1038/srep40368
Keywords: environmental DNA, eDNA, metabarcoding, marine, fishes, range shift, extralimital species, time series
Citation: Stoeckle MY, Das Mishu M and Charlop-Powers Z (2020) Improved Environmental DNA Reference Library Detects Overlooked Marine Fishes in New Jersey, United States. Front. Mar. Sci. 7:226. doi: 10.3389/fmars.2020.00226
Received: 06 January 2020; Accepted: 24 March 2020;
Published: 05 May 2020.
Edited by:
Andrew Stanley Mount, Clemson University, United StatesReviewed by:
Luke Thompson, Atlantic Oceanographic and Meteorological Laboratory (NOAA), United StatesChristopher Meyer, Smithsonian National Museum of Natural History (SI), United States
Copyright © 2020 Stoeckle, Das Mishu and Charlop-Powers. This is an open-access article distributed under the terms of the Creative Commons Attribution License (CC BY). The use, distribution or reproduction in other forums is permitted, provided the original author(s) and the copyright owner(s) are credited and that the original publication in this journal is cited, in accordance with accepted academic practice. No use, distribution or reproduction is permitted which does not comply with these terms.
*Correspondence: Mark Y. Stoeckle, bWFyay5zdG9lY2tsZUByb2NrZWZlbGxlci5lZHU=
 Mark Y. Stoeckle
 Mithun Das Mishu