 Valentina Amaral
 Cristina Romera-Castillo
 Jesús Forja
- 1Departamento de Química Física, Facultad de Ciencias del Mar y Ambientales, INMAR, Universidad de Cádiz, Campus Río San Pedro s/n, Cádiz, España
- 2Ecología Funcional de Sistemas Acuáticos, Centro Universitario Regional Este, Universidad de la República, Rocha, Uruguay
- 3Instituto de Ciencias del Mar-CSIC, Barcelona, España
The Gulf of Cádiz (GoC) connects the Mediterranean Sea with the Atlantic Ocean through the Strait of Gibraltar. Particular hydrographic processes take place in the GoC, such as riverine discharges and surface circulation marked by wind-induced seasonal upwelling. Although physical processes have been widely studied, little is known about the biogeochemical processes that occur in the basin, especially those involving organic matter. Therefore, vertical and seasonal dynamics of dissolved organic carbon (DOC) and optical properties of dissolved organic matter (DOM, absorbance and fluorescence) were measured in 766 samples collected between 5 and 800 m depth during four oceanographic cruises to obtain quantitative and qualitative information about DOM in the GoC. We performed parallel factor analysis (PARAFAC) to identify the main fluorophores present in the GoC, and an optimum multiparameter water mass analysis to differentiate the effect of water mass mixing from the biogeochemical processes in deep waters. PARAFAC analysis validated six fluorescent components; three humic-like, two protein-like, and a possible mixture of polycyclic aromatic hydrocarbon-like with protein-like material. DOC average concentration was 77.0 ± 12.7 μM, with higher values in surface and coastal waters during summer, mainly related to primary production. Linear relationships between DOC and apparent oxygen utilization indicate differences in oxygen consumption within the deep waters, which could be related to upwelling zones. Seasonal and spatial differences were also observed in the distribution of fluorescent DOM. Protein-like components were the most abundant fraction, with an average contribution of 64.75% ± 7.85%, being higher in summer and surface waters, associated with an increase in biological activity. Our results indicate that water mass mixing is the main driver of the major humic-like components, while biogeochemical processes at a local scale explain DOC and protein-like components distribution. Our findings suggest that modeling DOM dynamics in the GoC is complicated due to its complex hydrography and the presence of multiple sources and sinks of DOM.
Introduction
The GoC is the only connection between the Mediterranean Sea and the Atlantic Ocean through the Strait of Gibraltar. Consequently, it plays an important role in the North Atlantic circulation and climate in general (Price and O’Neil Baringer, 1994; Mauritzen et al., 2001). The GoC is also involved in the carbon cycle of the Eastern North Atlantic Ocean (Parrilla, 1998) and the Mediterranean Sea (Dafner et al., 2001). Physical processes in the GoC have been widely studied (Criado-Aldeanueva et al., 2006; Bellanco and Sánchez-Leal, 2016) as well as biogeochemical processes mainly focused on the inorganic carbon dynamics (Dafner et al., 2001; Ribas-Ribas et al., 2011a). However, less is known about the processes involving the organic carbon pool. A gap of knowledge that should be filled to better understand the role of the GoC in the carbon cycle of both Atlantic and Mediterranean waters.
Marine DOM is one of the largest and most dynamic reservoirs of reduced carbon on the Earth (Hedges, 2002), with an estimated stock of 662 Pg (Hansell et al., 2009). The main source of oceanic DOM is primary production, while terrestrial inputs only account for 2–3% of the total pool, although they can dominate in coastal zones (Opsahl and Benner, 1997). The DOM fraction absorbing light at both ultraviolet (UV) and visible wavelengths is referred to as CDOM (Coble, 2007). It is one of the major absorption components in the ocean, and a tracer for biogeochemical processes and oceanic circulation (Nelson and Siegel, 2013). The sub-fraction of CDOM that fluoresces is called FDOM (Coble, 2007) and can represent between 20 and 70% of the DOC, depending on the aquatic system, being higher in coastal areas (Coble, 2007). Optical properties (absorption and fluorescence) can yield qualitative information about the origin and chemical quality of the DOM pool, such as DOM’s molecular weight and aromaticity (Weishaar et al., 2003; Helms et al., 2008).
Chemical characterization of DOM has been inferred from its optical properties in both the Mediterranean (Galletti et al., 2019; Martínez-Pérez et al., 2019) and North Atlantic waters (Jørgensen et al., 2011; Álvarez-Salgado et al., 2013). However, little is known in the confluence of these two basins, the GoC. González-Ortegón et al. (2018) measured FDOM using an EXO FDOM sensor, but the measurements were limited to humic-like substances (Ex 365/Em 480) and samples shallower than 150 m depth. Another study determined CDOM and FDOM but only at three stations in the Bay of Cádiz, located in the northeast zone of the GoC (Catalá et al., 2013).
This work aims to understand the DOM dynamics in the whole GoC, from the surface to the bottom, and its seasonal changes. During one year, we have studied the DOC and DOM optical properties (both absorption and fluorescence) along the entire basin to understand the physical and biogeochemical drivers of their distribution. DOM dynamics were expected to be highly variable due to the biogeochemical complexity of the study region. We hypothesized that FDOM distribution depended on the source of the organic matter (terrestrial vs. marine). We also hypothesized that FDOM followed a marked seasonal pattern driven by biological and photochemical transformations.
Materials and Methods
Study Area
This study was carried out in the GoC, located in the Southwestern Iberian Peninsula. The GoC is a semi-enclosed basin where oceanographic dynamics and water mass circulation patterns are driven by the interaction between Atlantic and Mediterranean waters masses and influenced by the coastal system (Bellanco and Sánchez-Leal, 2016).
Three main water masses circulate in the GoC (Criado-Aldeanueva et al., 2006; Bellanco and Sánchez-Leal, 2016; Supplementary Figure S1). The Surface Atlantic Water extends from the surface to the seasonal thermocline and has an Atlantic origin modified by atmospheric interaction. The NACW flows below 100 m depth in two different varieties (Pérez et al., 2001): a warmer one of subtropical origin (NACWT) and a colder one of subpolar origin (NACWS). Lastly, the denser and saltier modified MOW flows between 300 and 400 m depth and the seafloor. Density differences between NACW and MOW result in a bi-layer exchange: an inflow of Atlantic water at the surface toward the Mediterranean basin, and a deeper outflow of Mediterranean water to the Atlantic Ocean (Baringer and Price, 1999).
Three upwelling areas have been identified in the GoC: Cape St. Vincent and Cape Sta. María, where the NACW upwells favored by winds, and Cape of Trafalgar, where the tidal–topographical interaction has been identified as the main process responsible for the vertical transport of deep waters to the surface layers (Vargas-Yáñez et al., 2002; Sala et al., 2018). Furthermore, between Cape of Sta. María and Cape of Trafalgar, three major estuaries, Guadalquivir, Guadiana, and Tinto-Odiel systems (Figure 1), discharge freshwater into the GoC. Riverine inflows to these estuaries are located in a semiarid environment and are regulated by dams. The Tinto-Odiel estuary is an industrial port with a low flow rate of freshwater and an average salinity of 37.2 ± 0.7. Guadalquivir and Guadiana show a salinity gradient (0.3–36.6) with a mean flow rate of 29.5 m3 s–1 (2016) and 5.04 m3 s–1 (1984–2015), respectively1,2. The high demand for freshwater for crop irrigation, along with frequent drought events, usually leads to long water residence times in the two rivers (de la Paz et al., 2007; Vasconcelos et al., 2007). In general, the GoC is characterized by oligotrophic conditions (Navarro et al., 2012) except for the coastal zone, where Chl a and nutrient concentrations are high due to continental runoff (Sala et al., 2018). As a result of these spatial and temporal variable processes, the GoC is mainly characterized by long-term seasonal physicochemical variability (Criado-Aldeanueva et al., 2009; González-García et al., 2018).
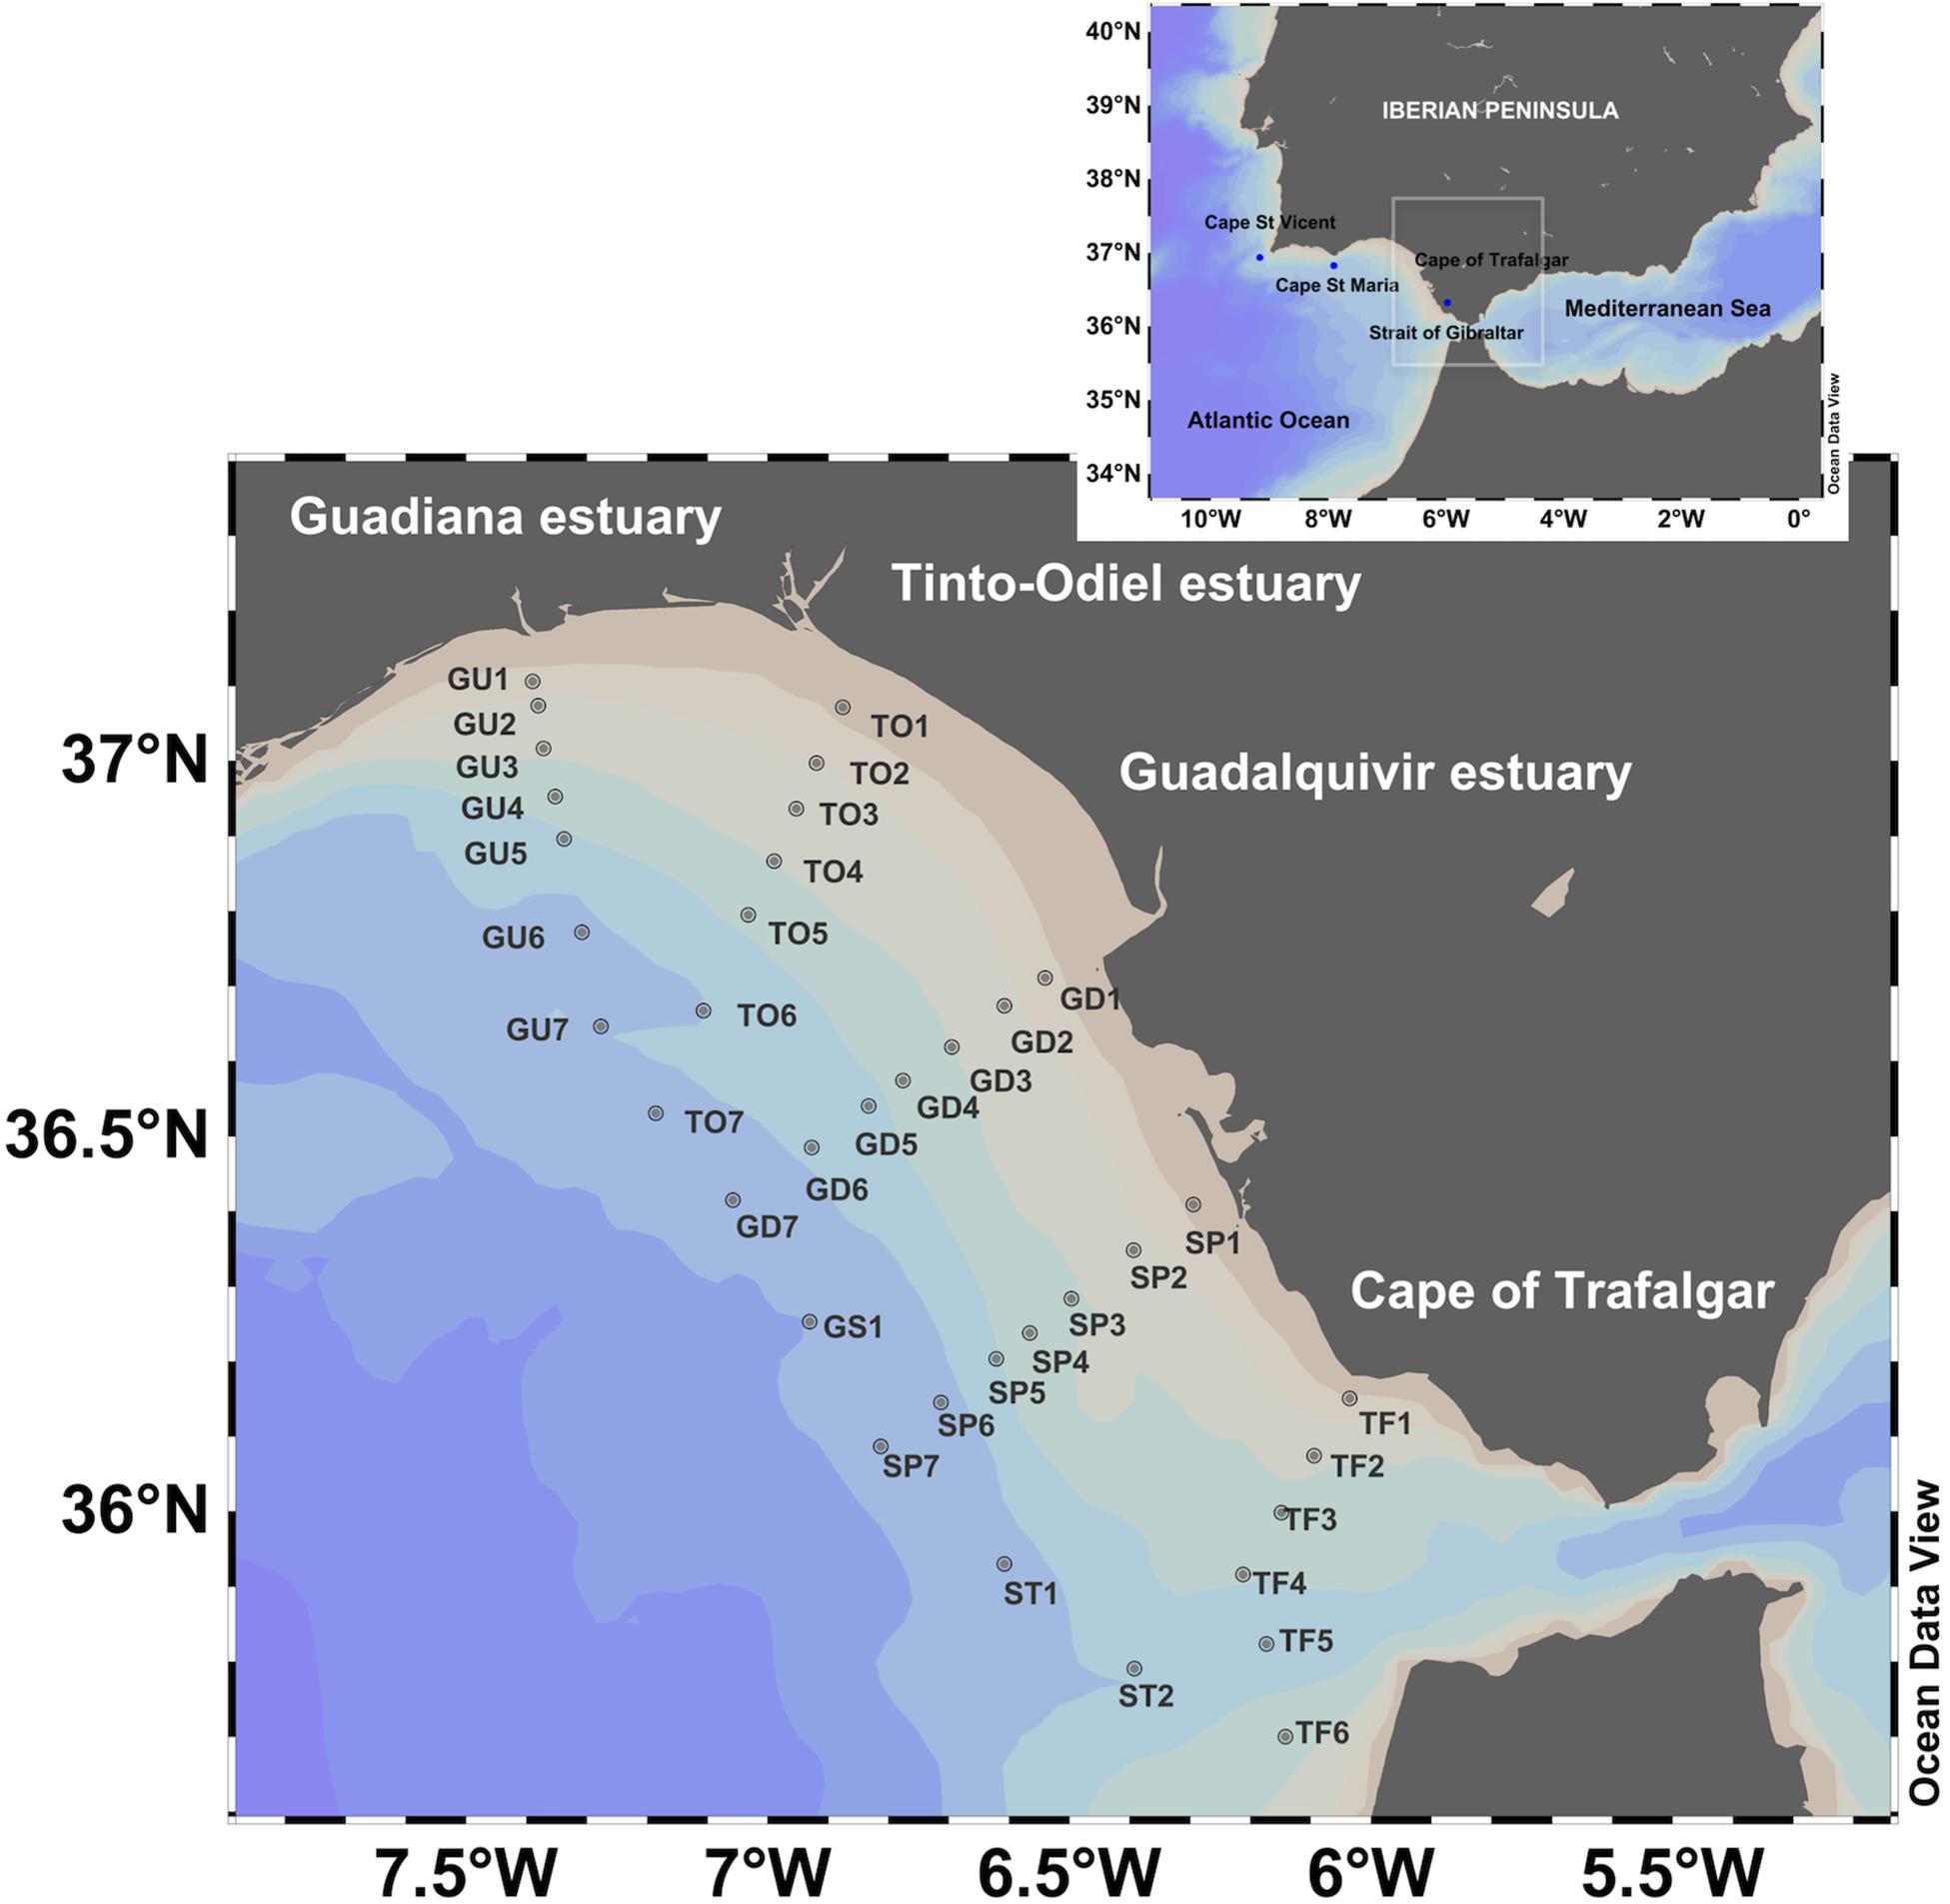
Figure 1. Sampling stations in the Gulf of Cádiz: Guadiana (GU), Tinto-Odiel (TO), Guadalquivir (GD), Sancti Petri (SP), Trafalgar (TF) and external stations (GS1, ST1, and ST2).
Sampling Strategy and Analytical Methods
Four cruises were conducted on board of B/O Angeles Alvariño and B/O Ramón Margalef vessels at the beginning of each season (March, June, September, and December 2016). Samples were collected at different depths, from 5 m to the bottom, and perpendicular to the coastline on five different transects designated as GU, TO, GD, SP and TF. Additionally, three off-shore stations were sampled (GS1, ST1, and ST2; Figure 1).
Seawater samples were collected using Niskin bottles (10 L) mounted on a rosette-sampler coupled to a Seabird CTD 911+, which measured S, T, DO and Chl a. For the calibration of the Chl a fluorescence, discrete samples were mesured using the fluorimetric method (González-García et al., 2018). AOU was calculated as the difference between DO at saturation and measured DO concentrations, where DO saturation was calculated from salinity and temperature following Benson and Krause (1984). Nitrate analyses were performed in a segmented flow autoanalyzer (Skalar, San Plus) based on classic spectrophotometric methods (Grasshoff, 1983) with an accuracy of ±0.10 μM. Complementary variables such as cumulative rainfall and monthly UV solar radiation were obtained from http://www.chguadalquivir.es and http://www.soda-pro.com, respectively. Wind speed data (Sensor 2740 situated at 10m height) were sourced from the Aanderaa Automatic Weather Station.
Determination of DOC, CDOM, and FDOM
Samples for DOC, CDOM, and FDOM analyses were collected in 0.25 L acid-cleaned amber glass bottles. Seawater was filtered through combusted Whatman GF/F filters (450°C, 4 h) with an acid-cleaned glass filtration system, previously rinsed with the sample. Samples for DOC were taken in duplicate and kept in the dark at −20°C until analysis. DOC concentration was determined by high-temperature catalytic oxidation using a Multi N/C 3100 Analytik Jena analyzer, calibrated daily using potassium hydrogen phthalate (Panreac, 99.1%). Deep seawater and low carbon reference waters (Hansell CRM Program, 42–45 μM) were measured to assess instrument variability (n = 5, 43 ± 1.8 μM).
UV-visible absorption spectra of CDOM (250–800 nm) was measured on board at a 1 nm interval using a JASCO-V750 spectrometer connected to a programmable temperature control system set at 20°C. A 10 cm path length quartz cuvette was used. Samples were blank corrected by subtracting the absorbance of daily Milli-Q water from the spectra, and a baseline correction was applied by subtracting the average absorbance between 600 and 800 nm to the measured absorption spectrum (Green and Blough, 1994). The corrected absorbance was converted into Napierian absorption coefficients (aλ, m–1) by multiplying by 2.303 and dividing by the cuvette path length (0.1 m) (Blough and Del Vecchio, 2002). In this study, we focused on the a254, since a strong relationship with the absorption coefficient at 350 nm was observed (R2 = 0.74, p < 0.05). a254 is proportional to the abundance of conjugated carbon double bonds and proposed as a proxy of DOC concentration (Lønborg and Álvarez-Salgado, 2014; Catalá et al., 2018). The SUVA254 is strongly correlated with aromaticity percentage and was calculated by dividing the decadic absorption coefficient at 254 (m–1) by the concentration of DOC (mg C L–1) (Weishaar et al., 2003). The S275–295, related to DOM molecular weight, was determined according to Helms et al. (2008).
Fluorescence was measured on board in a 1 cm quartz cuvette, using a spectrofluorometer (JASCO FP-8300) connected to a Peltier Thermostatted Cell Holder with Stirrer accessory (EHC-813) for temperature control (20°C). Excitation-Emission matrices (EEMs) were obtained for emission wavelengths from 300 to 560 nm (1 nm steps) and excitation wavelengths from 240 to 450 nm (5 nm steps) with a bandwidth of 5 nm and an integration time of 0.2 s. Raman peak at 350 nm, using Milli-Q water, was measured daily for sample blank correction together with a standard of quinine sulfate monohydrate (Sigma Aldrich, 98%) in H2SO4 to check system performance.
The drEEM 0.2.0 toolbox was used to standardize the EEMs (Murphy et al., 2013). Spectra were improved by the instrument correction factors obtained from the manufacturer’s protocol using Rhodamine A. Inner filter effect was addressed by correcting EEMs using the absorbance-based approach (Kothawala et al., 2013), data was standardized and normalized to Raman Units (RU) based on measurements of Raman peak at 350 nm (Lawaetz and Stedmon, 2009).
PARAFAC Modeling
Multivariate PARAFAC was employed to identify the different fluorescent components (fluorophores) that comprise the EEMs. PARAFAC was performed using the drEEM toolbox (version 0.2.0; Murphy et al., 2013) for Matlab (R2015b). Briefly, Raman and Rayleigh scatter bands (first and second order) were trimmed in each EEM. Corrected EEMs were normalized by their intensities, along with using non-negative constraint. Six independent components were identified (Supplementary Figure S2) using split-half validation with a convergence criterion of 10–8, random-initialization analysis, and thorough examination of outliers and model’s residuals (Stedmon and Bro, 2008). The online repository OpenFluor database (Murphy et al., 2014), along with published literature, were used for the identification of the PARAFAC components.
Given the major variation between allochthonous and autochthonous DOM in water samples, a misleading artifact may arise when modeling all samples together, hindering the accurate identification of biogeochemical facts regarding fluorescent components and their respective mechanisms (Mostofa et al., 2019). We performed individual seasonal models (n = 185–191) to assess whether PARAFAC modeling using all water samples together leads to information loss, such as masking seasonal variation of FDOM sources and therefore missing the underlying biogeochemical process. Nevertheless, we found that the components in the global model (n = 766) encompassed all components in individual seasonal models. In spring and winter, the same three-component models were obtained with one humic and two protein-like components (Supplementary Figure S3). In autumn and summer, PARAFAC validated a six-component model with the same components identified in the global model, except for C5 that showed slightly different Ex/Em peaks in the summer model (Supplementary Figure S3). Therefore, for simplicity and a better understanding of FDOM distribution in the GoC, only components of the global model will be described.
Optimum Multiparameter Water Mass Analysis
The variability of DOC, CDOM, and FDOM depends on water mass mixing and biogeochemical processes. To remove the variability caused by physical processes, we performed an optimum multiparameter water mass analysis (OMP, Poole and Tomczak, 1999). We obtained the mixing proportion of the different water masses found in the GoC for each water sample. Temperature and salinity, previously described in Flecha et al. (2012), were used as parameters to define the SWT. The analysis was carried out following Álvarez et al. (2014) using samples below 100 m depth (n = 256) since the influence of atmospheric interaction on T and S was observed in data above that depth. Once the water mass proportions were obtained for each sample, predicted variables (T, S, AOU, NO3, DOC, CDOM, and FDOM) were back-calculated through the linear regression between the SWT matrix and the observed variable. The high determination coefficients (R2 = 0.99) between the measured and predicted variables for T and S, as well as the low standard deviation of the corresponding residuals (<10–6), show that OMP results were reliable.
Statistical Analysis
Permutational analysis of variance (PERMANOVA) was performed to assess seasonal, vertical, and spatial differences between physicochemical variables (T, S, AOU, and Chl a).
To determine seasonal, vertical and spatial significant differences for DOC, CDOM, and PARAFAC components, and given the data structure, Kruskal Wallis non-parametric analysis of variance and post hoc pairwise Wilcoxon test (using Bonferroni to adjust p-value) were performed. A significance level of 0.05 was selected.
Linear regression models were developed to assess the effect of environmental conditions on the variability of DOC, CDOM, and PARAFAC fluorescent components in the surface water of the GoC, and were considered statistically significant when p < 0.01. T and S were used as explanatory variables to assess the influence of physical conditions. All analyses were performed in R 3.5 software (R Core Team, 2018) using “stats” and “vegan” packages.
Results
Fluorescent DOM Components in the Gulf of Cádiz
Six fluorescent components were statistically obtained from the global PARAFAC model (Murphy et al., 2013; Supplementary Figure S2 and Supplementary Table S2). Components 1 (C1) and 3 (C3) have been classified as humic-like (Coble, 1996), described in almost all aquatic environments. C1 presented similar spectral characteristics to Coble’s marine peak-M (Coble, 1996). However, it has been reported to have ubiquitous, allochthonous, and autochthonous origins and described for non-marine environments. C3 seems a mixture of the traditional peaks A and C (Coble, 1996). Component 4 (C4) has also been described as a common terrestrially derived component or produced after DOM exposure to UV radiation. Component 2, 5, and 6 (C2, C5, and C6) have been classified as fluorescent protein-like compounds, with narrow excitation bands and emission maxima below 400 nm, containing a fraction of autochthonous DOM. Components similar to C2 and C6 have been associated with Coble’s peak-T and peak-B, respectively (Coble, 1996), while C5 shows emission and excitation maxima similar to peak-N (Coble et al., 2014). However, C5 had the lowest Tucker congruence in the Openfluor database, and the peculiar spectra of this component could be related to the presence of PAH which fluoresces in the same region as protein-like groups (Coble et al., 2014). Nevertheless, it could also be a mixture of PAH and protein-like compounds, as it has been previously suggested for similar components.
Physicochemical Characteristics
Temperature in 2016 ranged from 11.4 to 22.9°C, with the lowest values in March and the highest ones in September. S showed low variability, with an average value of 36.27 ± 0.34. T and S revealed a marked stratification of the water column during autumn and summer with an average thermocline depth of 39.4 ± 15.6 m (Supplementary Table S1). During spring and winter, a strong mixing was observed with an average thermocline depth of 71.4 ± 34.5 m (Supplementary Table S1). Chl a showed an average value of 0.31 ± 0.39 μg L–1 with maxima around 3.5 μg L–1 in spring and summer in the coastal zone. This was probably due to the influence of the upwelling off Cape St. Vincent and, to a lesser extent, to the riverine nutrients input. AOU was also highly variable, with values >100 μM, characteristic of MOW, and minimum values <−80 μM corresponding to Chl a maxima in coastal stations.
PERMANOVA analyses showed that physicochemical variables (T, S, AOU, and Chl a) were statistically different (p < 0.001) and dependent on the season (p < 0.001) when comparing data from above and below the thermocline. Therefore, the dataset was split into data above SurfW and below the thermocline DeepW (Table 1). Supplementary Figure S4 shows T, S, AOU, Chl a, and DOC profiles in GD transect during the mixed and stratified period as an example of vertical distribution.
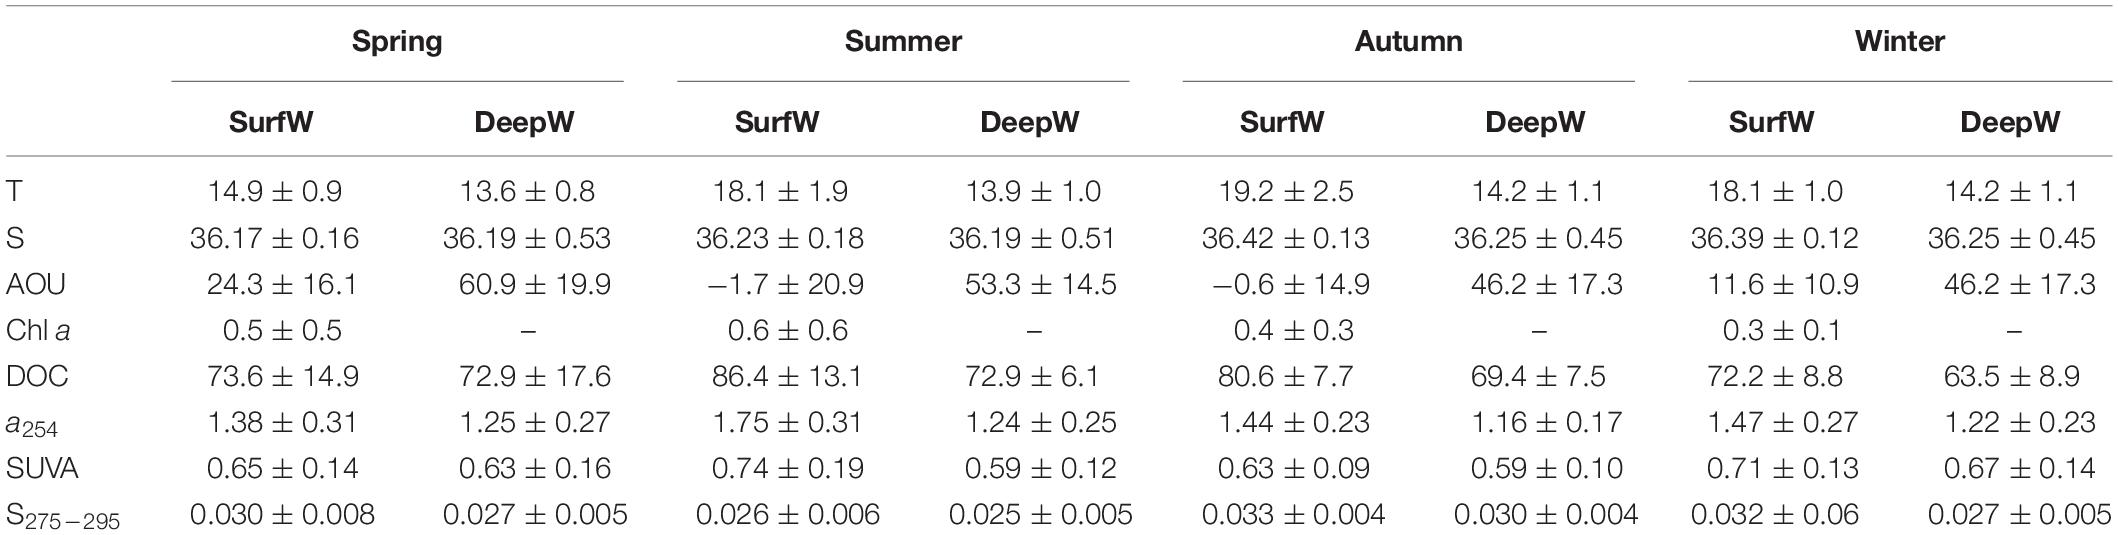
Table 1. Average ± standard deviation values of temperature (T,°C), salinity (S), apparent oxygen utilization (AOU, μM), chlorophyll a (Chl a, μg L−1), dissolved organic carbon (DOC, μM), CDOM absorption coefficient at 254 (a254, m–1), SUVA254 index (L mg–1 m–1) and the spectral slope S275–295 (nm–1) from surface (SurfW) and deep water (DeepW).
In spring and winter, westerly winds with high average speed were predominant, while in summer and autumn, easterly winds with lower speed prevailed (Supplementary Table S1). During spring, strong west winds favored the occurrence of the “Huelva Front” (Figures 2A,E). This was characterized by upwelled NACW extending cold water onto the coastal zone up to SP (Stevenson, 1977) and the warmer water carried by the Azores current toward the east, in the oceanic zone. During summer, the upwelling extension eastward from Cape St. Vincent lost intensity due to the easterly winds, still with a signature of cold, less salty waters, and relatively high Chl a (Figures 2B,F,N). The semipermanent upwelling off Cape Trafalgar was clearly observed during autumn (Figure 2C). In summer and winter, water with lower salinity was observed along the entire coastline (p < 0.05), probably due to the influence of accumulated rainfalls before the sampling dates (Supplementary Table S1). Coastal stations showed higher Chl a values than off-shore stations for all the seasons (p < 0.05), and no differences were observed in AOU (p > 0.05). Here we define coastal stations as the stations with a maximum depth of 60 m (Bellanco and Sánchez-Leal, 2016; Figure 1, stations 1 and 2), and off-shore stations as those with a bottom depth >60 m (Figure 1, stations 3 to 7 and external stations).
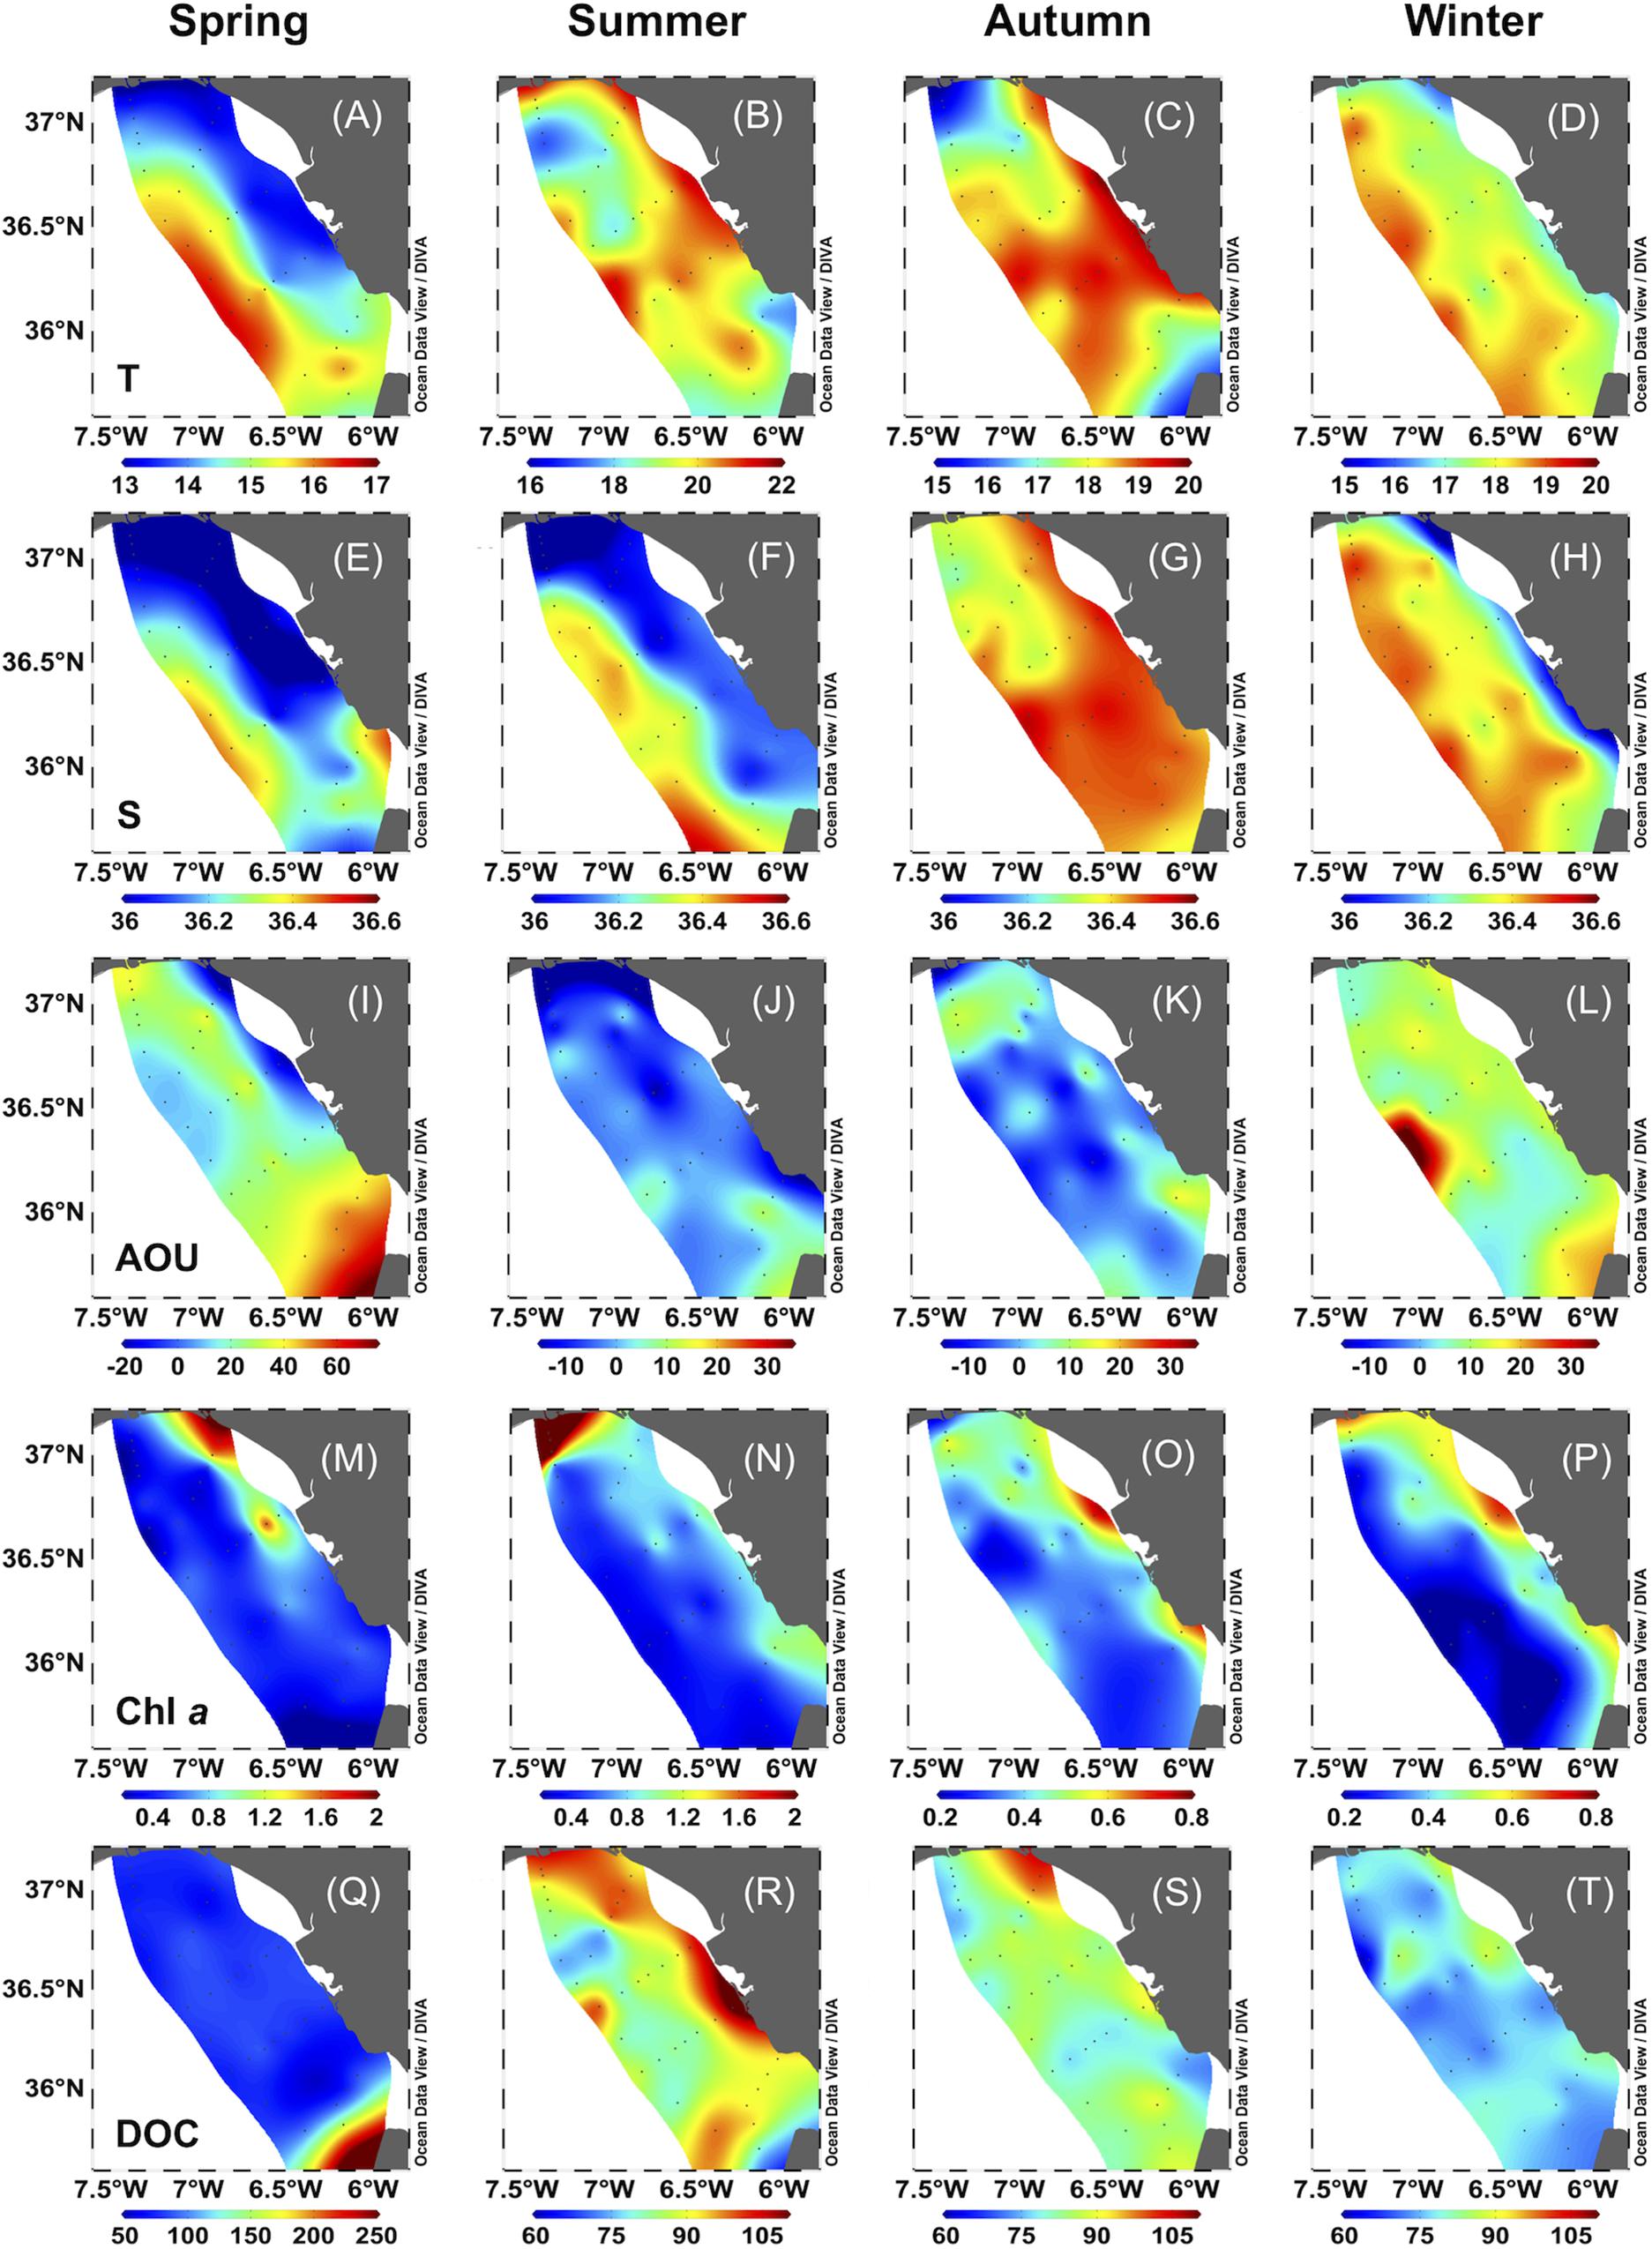
Figure 2. Surface water distribution of temperature (T,°C), salinity (S), apparent oxygen utilization (AOU, μM), dissolved organic carbon (DOC, μM) and chlorophyll a (Chl a, μg L–1) during spring, summer, autumn and winter 2016 in the Gulf of Cádiz.
Distribution of DOC, CDOM, and FDOM in the Gulf of Cádiz
Dissolved organic carbon ranged from 67.0 to 175.7 μM, which falls within the range of previously reported values for the area (Ribas-Ribas et al., 2011b). Lower average values were observed in spring and winter and higher during autumn and summer (p < 0.05). a254 ranged between 0.76 and 3.73 m–1, excluding maximum values found in SurfW during spring in TF (4.01–5.68 m–1, n = 5) that matched elevated DOC values (>150 μM, Figure 2Q). SUVA254 index ranged between 0.29 and 1.36 L mg–1 m–1, while S275–295 ranged between 0.014 and 0.059 nm–1. Summer showed the highest values of SUVA254 (p < 0.05) and the lowest of S275–295 (p < 0.05).
Unexpectedly, high values for protein-like C2 were observed in summer samples from SP6 and SP7 between 150 and 650 m depth and TF6 between 75 and 90 m depth. These values (n = 9) were three orders of magnitude higher than the average (>0.90 RU) and therefore excluded from the analyses. Other sources of the anomaly are discussed in section “DOM Distribution in Deep Water.” The two major humic-like components, C1 and C3, were highly correlated with each other (n = 753, R2 = 0.75, p < 0.001) and displayed the same distribution pattern, thus, for simplicity we will report only C1.
Humic-like C1 ranged from 0.003 to 0.024 RU (Figure 3A), while C4 ranged between 0 and 0.21 RU, with the highest values during summer and autumn (p < 0.05, Figure 3B). Protein-like C2 displayed the highest seasonal variability among all components ranging from 0.00048 to 0.69 RU (Figures 3C,D). In summer, C2 mean values were ten times higher than in the rest of the seasons. C5 varied between 0 and 0.086 RU and C6 between 0 and 0.097 RU (Figures 3E,F).
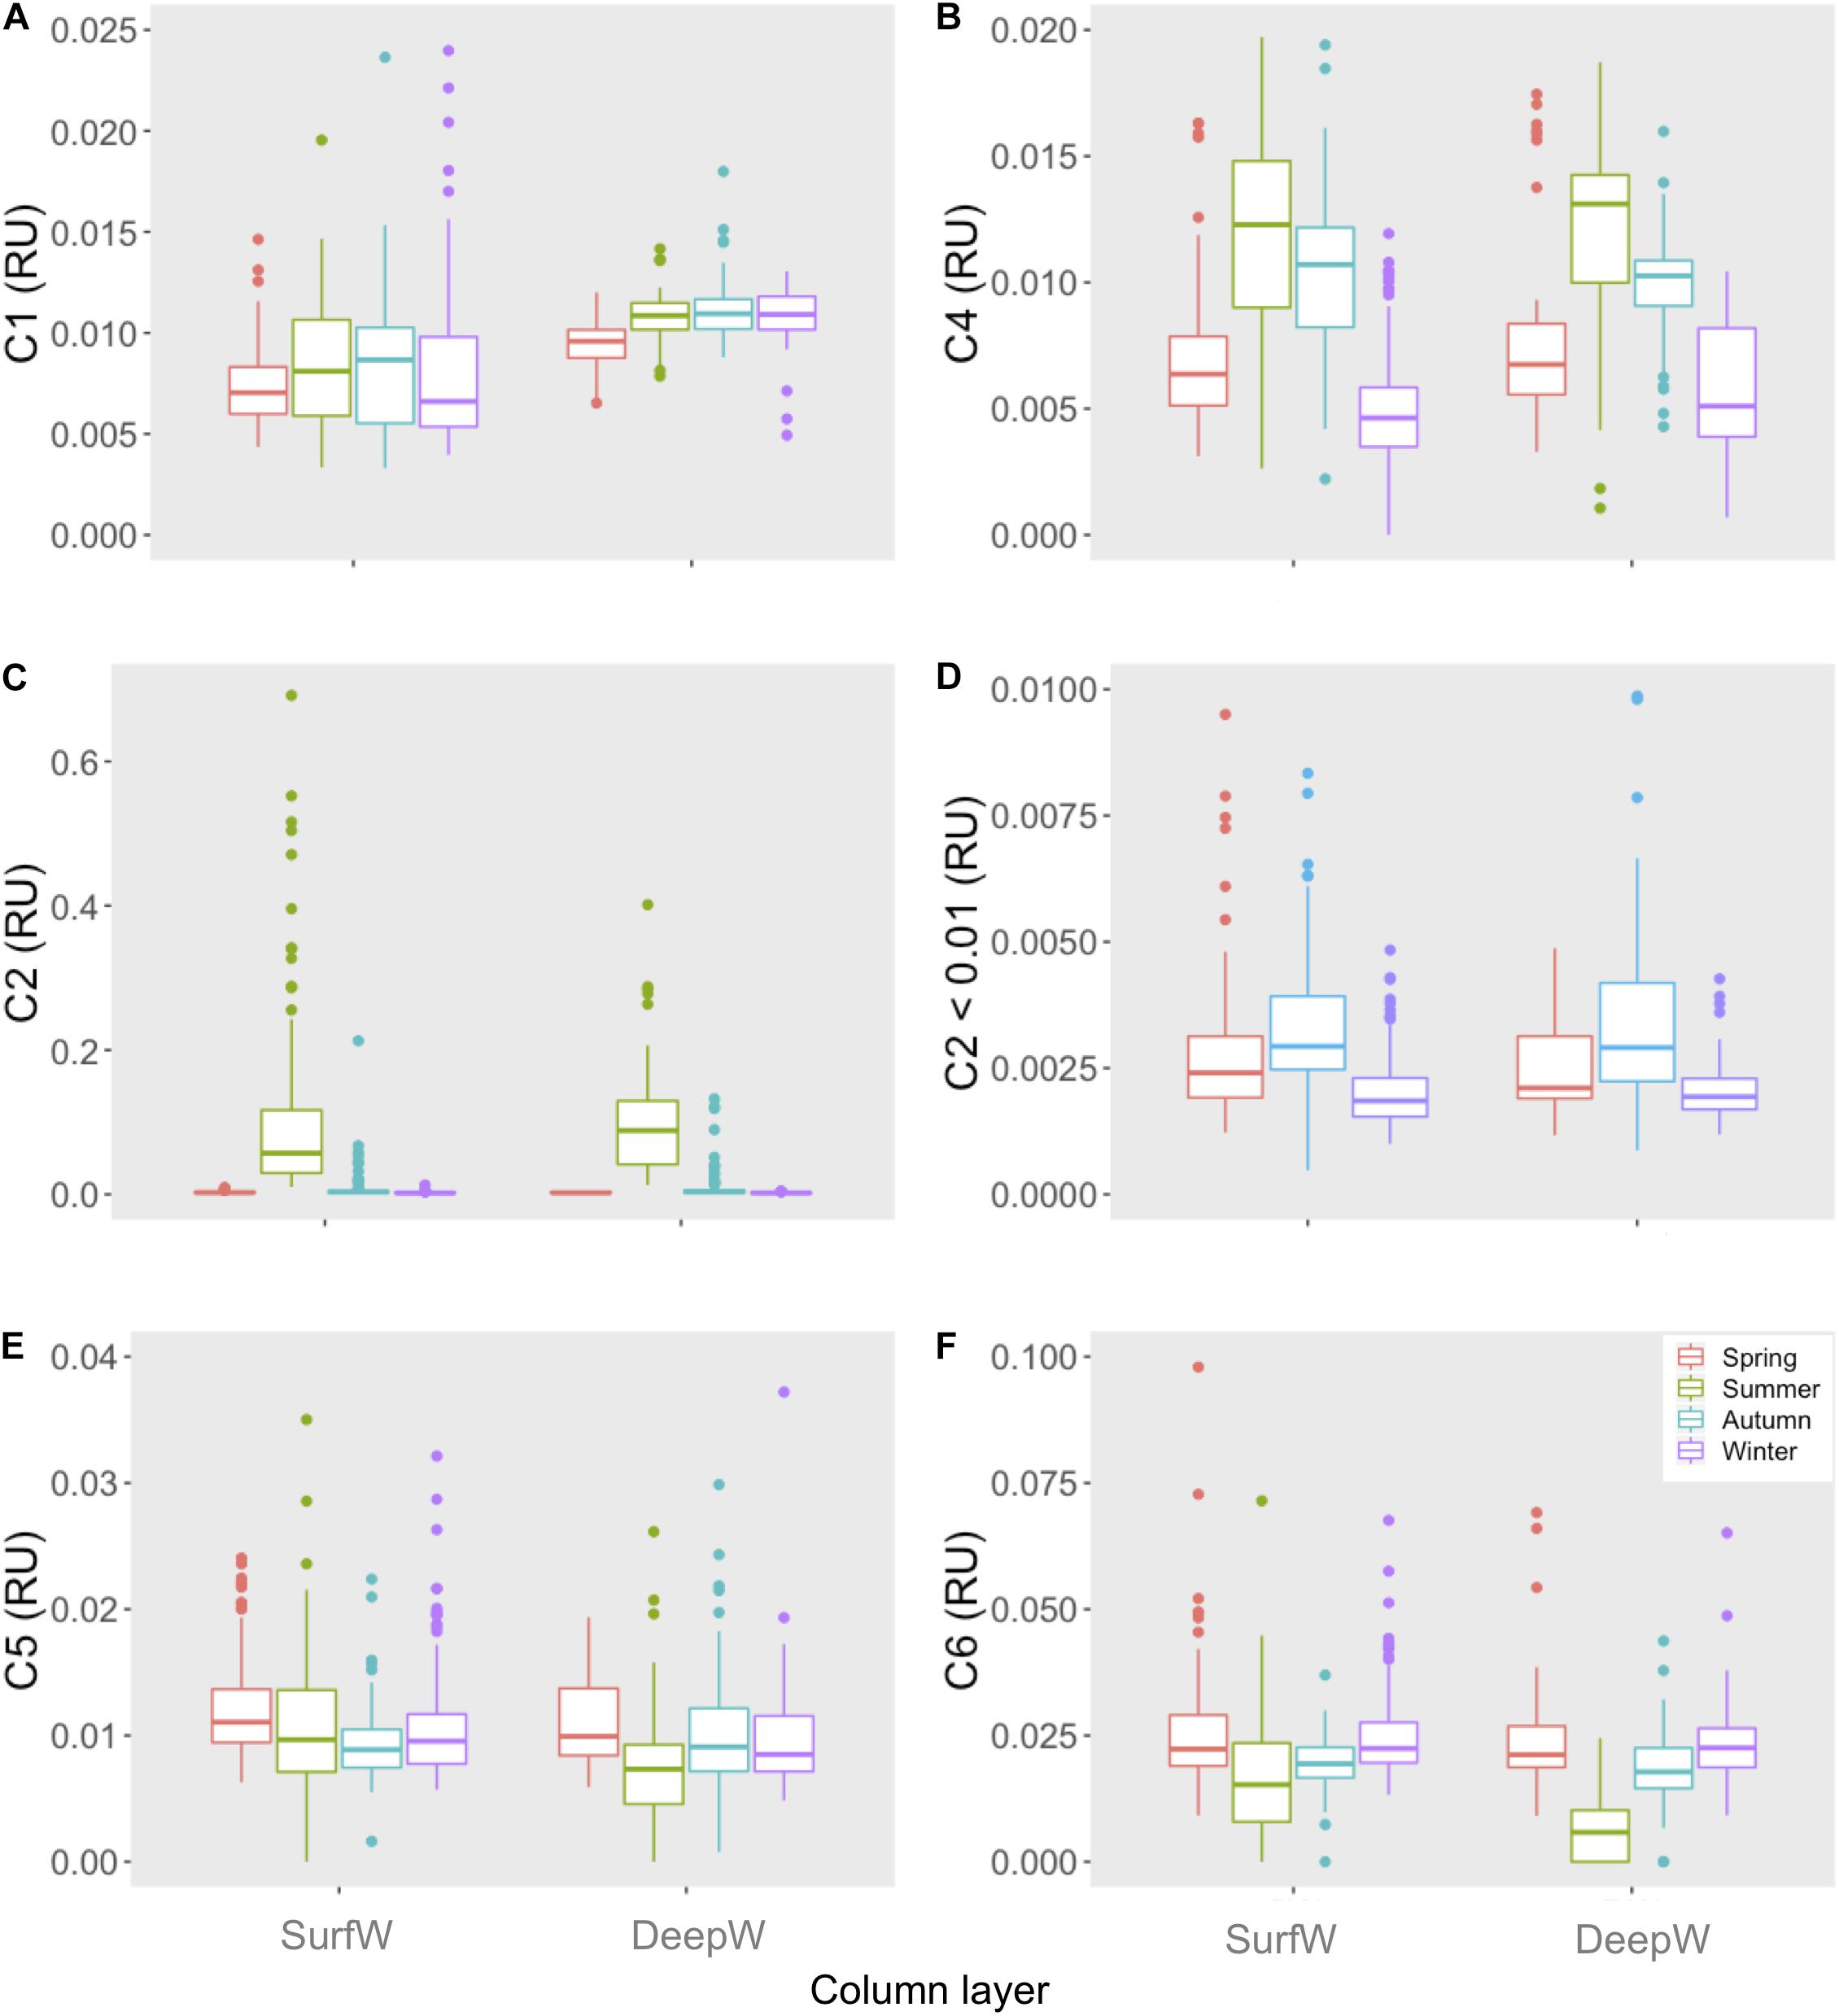
Figure 3. Average intensities of PARAFAC components- (A): C1, (B): C4, (C,D): C2, (E): C5 and (F): C6- for each season at surface water (SurfW) and deep water (DeepW) in the Gulf of Cádiz.
We observed variability in the vertical distribution of DOC with higher values occurring in SurfW than in DeepW, especially during the stratified period (summer and autumn, p < 0.05, Table 1). Similar to DOC concentrations, average measurements of a254, SUVA254, and S275–295 were higher in SurfW than in DeepW for all seasons (p < 0.05, Table 1). Vertical profiles of FDOM during the mixed and stratified period in the GD transect are presented as an example of vertical distribution (Supplementary Figure S5). Humic-like C1 increased with depth and presented seasonal variability in SurfW, with lower values during the mixed period (spring and winter). Instead, in DeepW, C1 remained constant during the four sampling periods. C2 and C4 showed similar values between layers along seasons (p > 0.05), while C5 and C6 showed higher intensities at the surface during the stratified period (p < 0.05).
We also observed spatial variability in DOC, CDOM, and FDOM distribution. Coastal stations showed higher values of DOC, a254, and SUVA254 and lower of S275–295 than off-shore stations (p < 0.05, Table 2). They also showed higher values of C1, C5, and C6 than off-shore stations (p < 0.05, Figures 4A–D,M–P,Q–T, respectively). Conversely, C2 and C4 showed no spatial differences (p > 0.05, Figures 4E–H and Figures 4I–L, respectively).
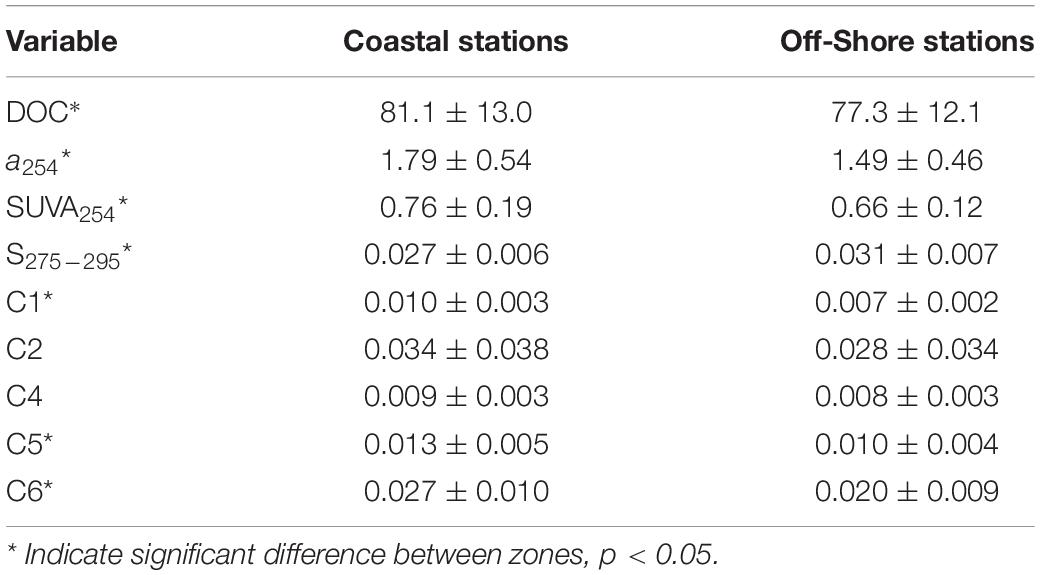
Table 2. Average ± standard deviation values of dissolved organic carbon (DOC, μM), CDOM absorption coefficient at 254 (a254, m–1), SUVA254 index (L mg–1 m–1), the spectral slope S275–295 (nm–1), and fluorescent components (C1-C6, RU) from surface coastal and off-shore stations.
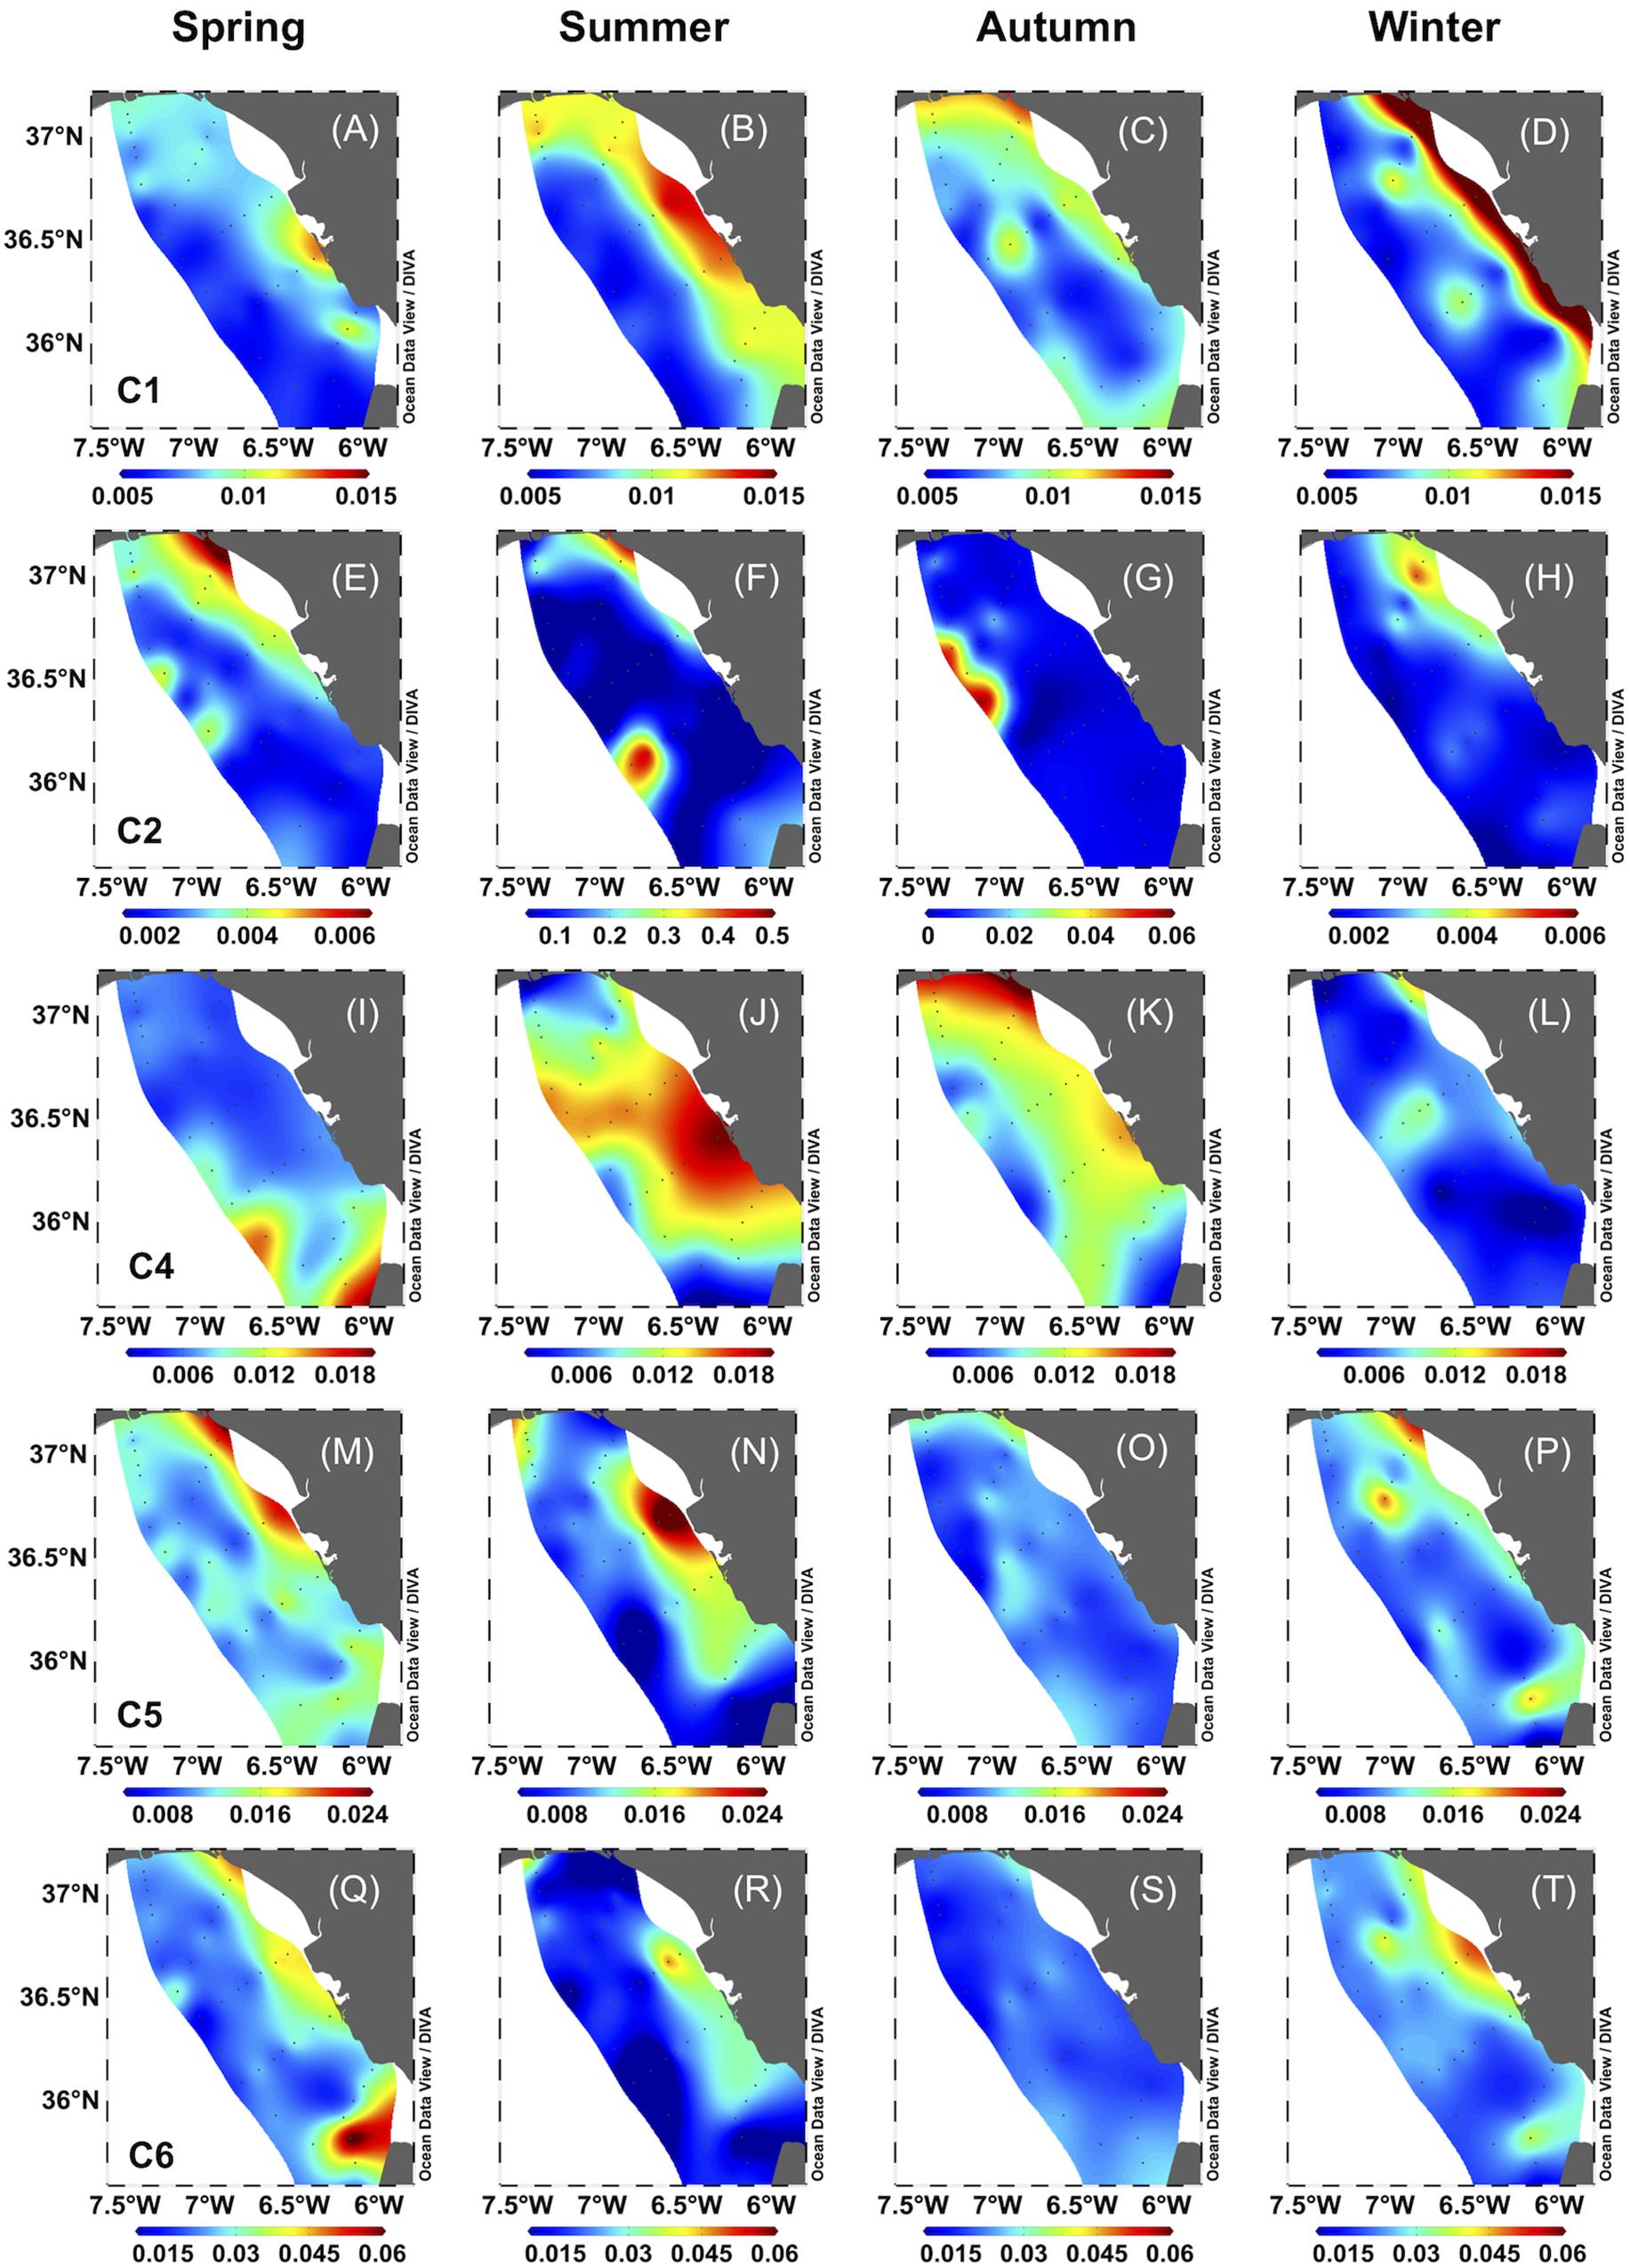
Figure 4. Surface water distribution of fluorescent components for each season: (A–D): C1, (E–H): C2, (I–L): C4, (M–P): C5, (Q–T): C6. Units are in RU. Note that C2 shows different scales in summer and autumn.
The relative contribution (%) of each fluorophore was determined to assess the dominant fraction of FDOM (Tanaka et al., 2016). Protein-like C6 was the dominant fraction in spring, autumn and winter, contributing with 37.43% ± 7.43% to the total FDOM. In summer, protein-like C2 was the most abundant, accounting for 56.94% ± 26.28% and decreasing to 6.22% ± 3.83% in other seasons. Thus, the sum of protein-like components (C2 + C5 + C6) dominated the FDOM pool during the study period (64.75% ± 7.85%).
DOC, CDOM, and FDOM Drivers in the Surface Layer
Multiple linear regressions with T and S were applied to determine the contribution of water mass mixing to DOM surface distribution (Supplementary Table S3). DOC and a254 showed weak but significant relationships with T and S, with highest and lowest explained variation occurring in autumn (R2 = 0.36, p < 0.001) and spring (R2 = 0.09, p < 0.001), respectively.
Among fluorescent components, the highest relationship with T and S was found for humic-like C1, with the highest explained variation in summer and winter (R2 = 0.69 and 0.79, respectively, p < 0.001) and the lowest in spring and autumn (R2 = 0.50 and 0.59, respectively, p < 0.001). Protein-like fluorescent components showed lower relationship with T and S than humic-like components (R2 < 0.36; p < 0.001). Terrestrial photoproduct C4 showed a significant correlation with T and S only in spring (R2 = 0.27, p < 0.01).
DOM Drivers in Deep Waters: OMP Analysis
A strong relationship was observed between calculated and observed values for AOU and nitrate (R2 = 0.82 and 0.87, respectively, p < 0.001, n = 256), with typical values coinciding with previous reports in the GoC (Table 3; Flecha et al., 2012). DOC and a254 were weakly correlated with water mass mixing (R2 = 0.27 and 0.18, respectively, p < 0.01, n = 254). Unlike protein-like components, humic-like C1 and C4 presented a strong linear relationship with water mass mixing proportions (R2 = 0.68 and 0.66, respectively, p < 0.001).
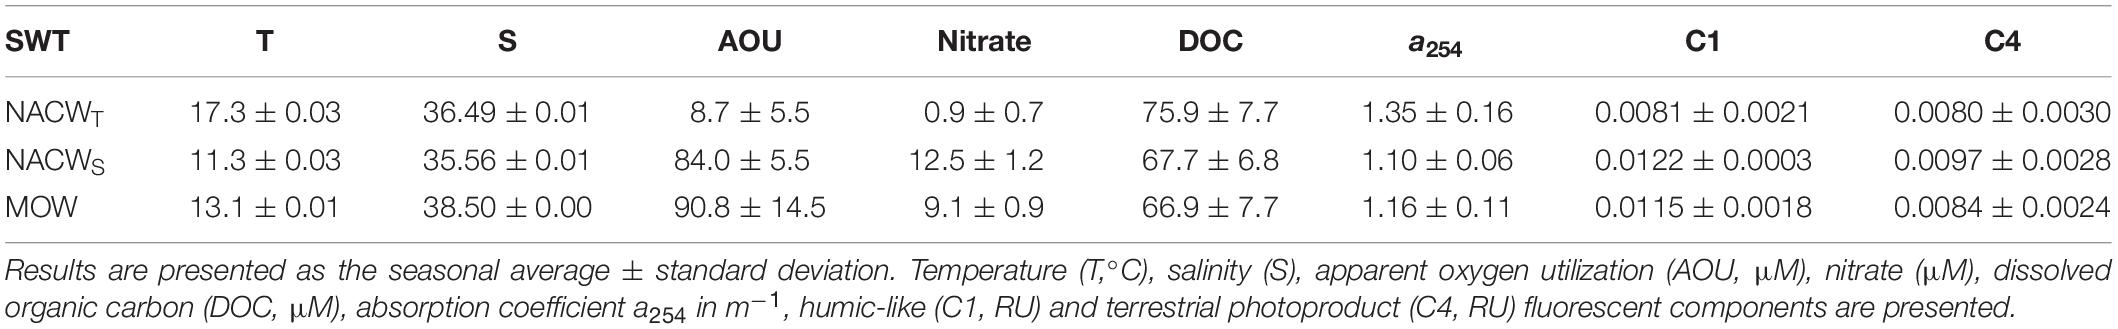
Table 3. Biogeochemical and fluorescence typical values of selected water mass in OMP analyses in deep water.
Discussion
PARAFAC Model: Fluorescent Components in the GoC
All the six fluorescent components found in the GoC have been previously described in other marine and freshwater systems (Supplementary Table S2). Among the humic-like components, C1 has been associated with microbial activity mixed with old humic material in coastal waters (Coble et al., 2014). It has been reported as ubiquitous, found in almost all environments, and derived from both autochthonous and allochthonous sources. C4 follows the same trend as UV radiation, increasing in summer and autumn and decreasing in winter and spring (Supplementary Figure S6, R2 = 0.98, p < 0.001), supporting previous suggestions that it is produced during the exposure of DOM to UV radiation (Supplementary Table S2). Protein-like C2 and C6 resemble the amino acids tryptophan and tyrosine, respectively. Finally, C5 is less common than other components and can be a combination of fluorophores containing both protein fluorescent structures and PAH substances. Abundant UV-A signals (Em < 400 nm, “protein-like”), as in our case, could be challenging for PARAFAC since spectra are shorter and steeper and affected by Raman and Rayleigh scatter (Murphy et al., 2018). Gonnelli et al. (2016) found a mixture of PAH and protein-like components with similar fluorescent characteristics as our C5 in surface water affected by oil spills. Their samples showed single fluorescence spectra with excitation at 255 nm and characteristic emission peaks of main oil components: fluorene (316 nm) and pyrene (372 nm). Both peaks were also observed in our C5. The GoC is located in one of the most important maritime crossroads in the world. More than 10% of international maritime traffic crosses the Strait of Gibraltar (145–192 ships per day), a percentage that rises in the case of oil tankers, as it is a key connection point with the greatest oil producers3. Oil contaminated ballast water and bunkering (refueling) represent an important source of marine pollution in the GoC4. Thereby, in this work, C5 could be a yet unresolved fluorescent group consisting of a mixture of protein-like material and oil-derived compounds. However, further analysis will be necessary to confirm such origin.
DOM Distribution in Surface Water
Dissolved organic carbon and CDOM concentrations in the GoC fall within the range previously described for coastal and marine systems (Romera-Castillo et al., 2011a; Nelson and Siegel, 2013). Nevertheless, the average annual mean concentration of surface DOC and CDOM are slightly lower than those observed in other oligotrophic coastal systems (Romera-Castillo et al., 2013). DOC has shown to be negatively correlated with salinity in the coastal zone (Cauwet, 2002), however, in this work, a strong relationship was not observed, in agreement with previous studies in this area (Ribas-Ribas et al., 2011b). In our study, water samples were collected between 7 and 16 km of the river mouth, and thus were likely too far from the river to observe a strong influence of terrestrial inputs. This is consistent with the low salinity range found here (35.8–36.6), and could also be the reason for water mass mixing explaining less than 36% of DOC and CDOM surface distribution (Supplementary Table S3). Another explanation for the low relationship between DOC and salinity could be the complexity of this transitional coastal-ocean system, where DOM is a mixture of allochthonous and autochthonous components.
Chromophoric dissolved organic matter is a reliable proxy for DOC in several aquatic systems (Lønborg and Álvarez-Salgado, 2014; Rochelle-Newall et al., 2014; Catalá et al., 2018). However, this relationship can be weak in coastal regions not strongly influenced by riverine inputs (Del Castillo et al., 2000; Ferrari, 2000). Again, the long distance between the coast and the first stations sampled here could explain the low relationship between DOC and CDOM in SurfW (R2 = 0.48, p < 0.001, n = 460). Another possibility is that the inner shelf coastal counter-current that transports water westward during most of the year (Garel et al., 2016), removes continental inputs, resulting in a weak terrestrial DOM signal. Additionally, that relationship can also be altered by the photodegradation of the CDOM (Blough and Del Vecchio, 2002) and microbial processing (Helms et al., 2008) during its transport along the estuaries.
In the open ocean, a strong relationship between CDOM and DOC concentrations is not usually observed (Nelson and Siegel, 2013). In the GoC, the relationship between CDOM and DOC was lower than in other open-ocean systems (R2 = 0.46, p < 0.001, n = 751) such as the Northeast Atlantic Ocean (R2 = 0.80, n = 233, Lønborg and Álvarez-Salgado, 2014), and the Mediterranean Sea (R2 = 0.87, n = 273, Catalá et al., 2018). In our study, the intercept of this relationship indicates that 33.8 μM of DOC vary independently of a254. This value is higher than the 10 μM found in the Northeast Atlantic Ocean and Mediterranean Sea (Lønborg and Álvarez-Salgado, 2014; Catalá et al., 2018). This shows that equations for DOC predictions using a254 had to be site-specific (Catalá et al., 2018) and that this method should not be used in ecosystems with highly variable DOC and CDOM sources (Rochelle-Newall et al., 2014).
The great variability observed in S275–295 (0.014–0.059 nm–1) covers values frequently observed in rivers (0.013–0.017 nm–1, Shen et al., 2012) and oligotrophic seawaters (0.04 nm–1, Aurin and Mannino, 2012). This result suggests that the DOM pool in the GoC comprises a wide range of molecules with different molecular weights. On the other hand, according to SUVA254 values identified by Weishaar et al. (2003), DOM in the GoC is more similar to DOM found in the ocean than in freshwater environments. Noteworthy, the average value found in our work (0.8 ± 0.1 L mg C–1 m–1) was lower than the one found by Massicotte et al., 2017 for the open ocean (1.7 ± 0.2 L mg C–1 m–1). In summer and winter, high molecular weight and aromatic compounds dominated the DOM pool, indicated by high SUVA254 and low S275–295 values, respectively (Weishaar et al., 2003; Helms et al., 2008).
Average seasonal deep DOC maximum and deep fluorescence maximum (DFM) from CTD showed the same pattern, increasing from autumn to spring (Figure 5). That, together with the strong linear relationship observed between them (R2 = 0.95, p < 0.05), suggests that phytoplankton release may be the most important source of DOC, as it has been previously suggested for this area (Huertas et al., 2005; Ribas-Ribas et al., 2011b). Huertas et al. (2005) found the DOC maxima matching the highest Chl a concentrations indicating that seasonal distribution of DOC in the GoC is related to phytoplankton biomass variation. However, we found a low correlation between DOC and CDOM with Chl a. In the GoC, pico and nanophytoplankton are the dominant fraction of phytoplankton and have been associated with the DFM (González-García et al., 2018). A lack of direct relationship between Chl a and picoplankton biomass was attributed to a low Chl a/cell ratio, distinctive of oligotrophic systems (Echevarría et al., 2009).
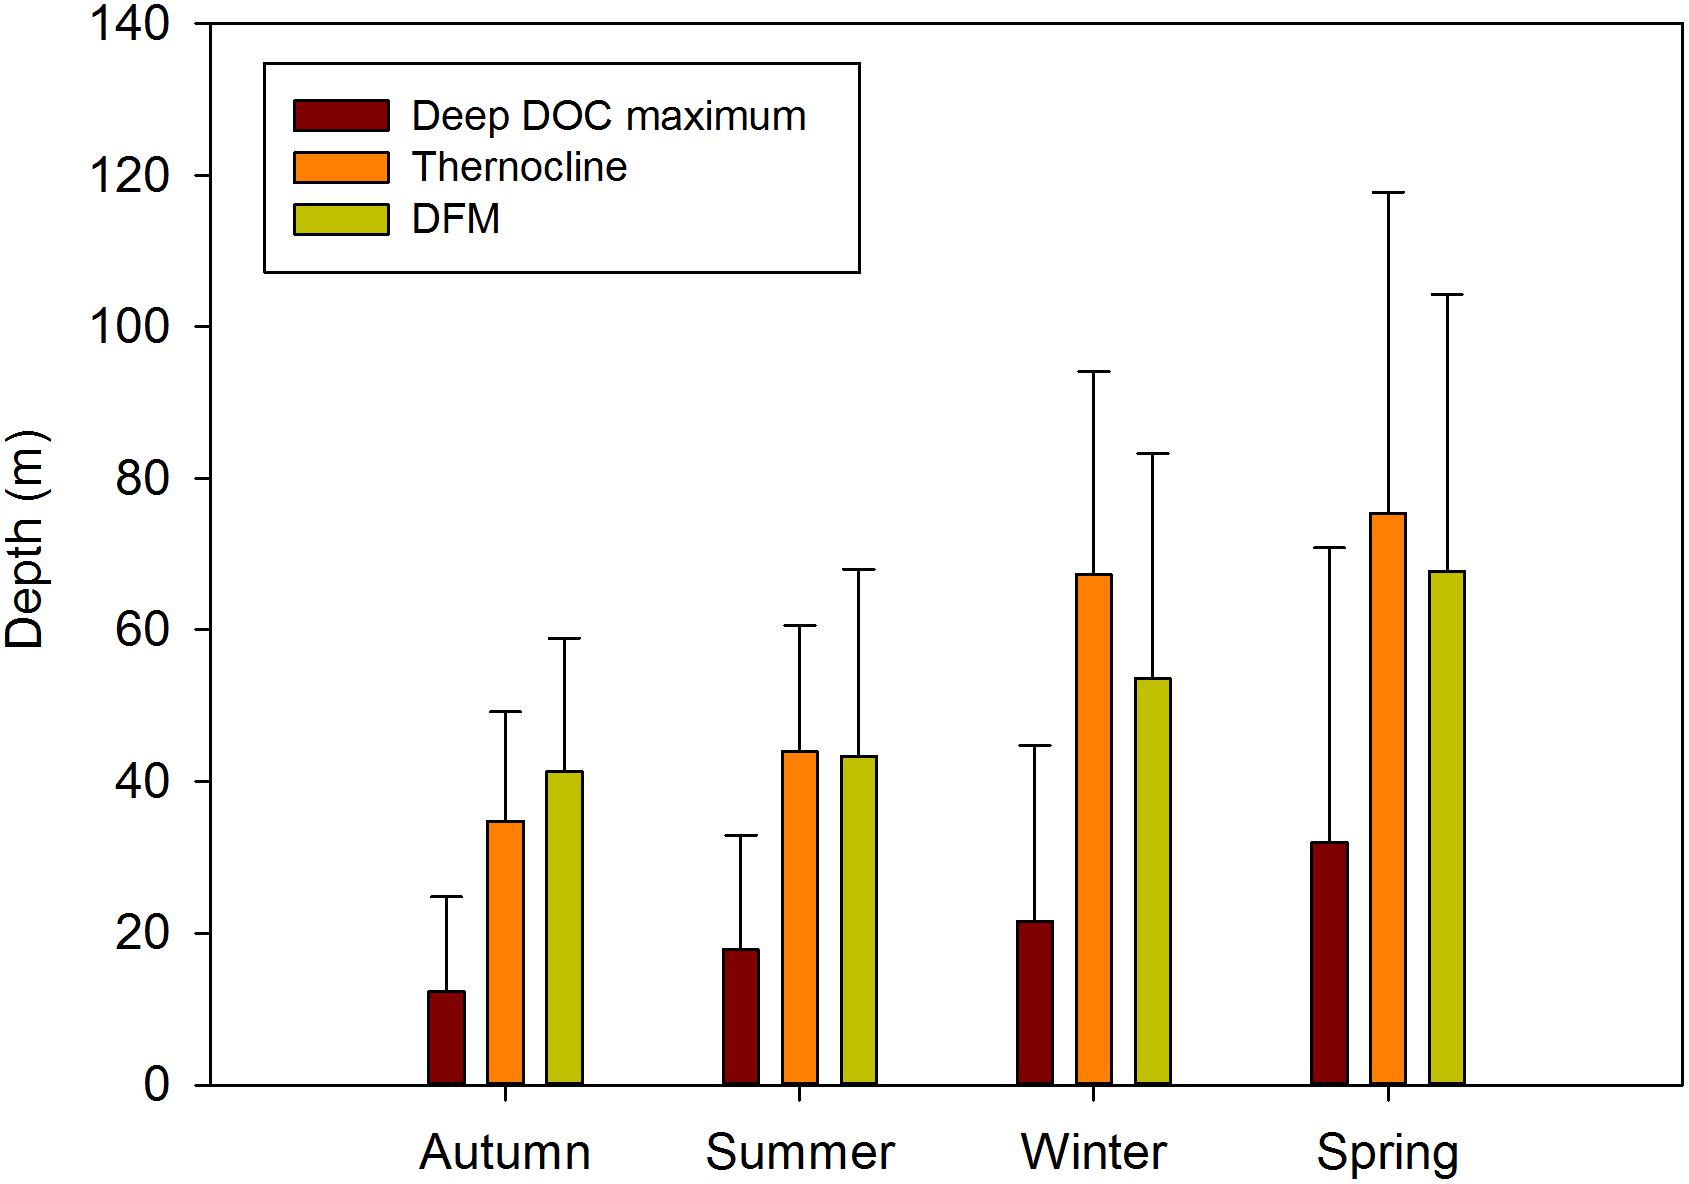
Figure 5. Deep DOC maximum, thermocline and deep fluorescence maximum (DFM) averages for each season.
Fluorescent dissolved organic matter variation in the GoC showed a humic-like C1 distribution mostly explained by water mass mixing, especially in winter (80%) and summer (70%) when higher monthly accumulated precipitation took place (Supplementary Table S1). Coastal stations showed higher fluorescence of C1 during these seasons, probably due to the supply of terrestrial DOM, which plays a major role in the distribution of humic-like material in the ocean (Jørgensen et al., 2011). González-Ortegón et al. (2018) found that the GoC is receiving large amounts of humic FDOM through riverine inputs with salinity as the main factor explaining FDOM variability within the Guadalquivir and Guadiana rivers and in the inner shelf of the GoC. Although in our work a strong influence of terrestrial inputs along the year was not observed, the signature of humic-like C1 during winter was evident across the coastal stations (Figure 4D). That could be associated to the combination of continental inputs and a lower degree of photodegradation during this season. Moreover, C1 was lower in SurfW than DeepW (Figure 3A) in agreement with other works suggesting that photochemical degradation is the major removal mechanism of humic-like components at surface in aquatic systems (Nieto-Cid et al., 2006; Jørgensen et al., 2011). Finally, in spring, 50% of the distribution of C1 was also explained by water mass mixing, however, it could be associated with the upwelling characterized by the “Huelva Front” (Figures 2A,E) favored by intense west winds during this season (Supplementary Table S1). On the other hand, the strong relationship observed between average C1 maxima depth and DFM in off-shore SurfW stations (R2 = 0.70, p < 0.05) supports the hypothesis that phytoplankton is the main producer of humic-like FDOM in the outer shelf of the GoC, as proposed by González-Ortegón et al. (2018). Finally, C4 seems to have a relatively constant vertical and spatial distribution along the upper column with no changes during the stratified period (Figure 3D). Its variability would be better linked to seasonality due to changes in UV radiation (Supplementary Figure S6).
Distribution patterns were different between protein-like C2 and C6 and the relationship between them was low (R2 = 0.2, p < 0.001, n = 460). This suggests that the sources and sinks for both components were not the same. On the other hand, C5 follows a pattern more similar to tyrosine-like C6 than to tryptophan-like C2 (R2 = 0.50 and 0.02, respectively, p < 0.001, n = 460). In general, water mass mixing explained less than 36% of the protein-like surface distribution. In coastal environments, a major source of protein-like components is autochthonous production by phytoplankton (Coble, 2007). C6 was higher at surface in agreement with the observed decrease of this component with depth in the ocean (Catalá et al., 2015). That is the same general pattern observed for DOC and Chl a (coastal and surface) linked to primary production in the surface layer. On the other hand, tryptophan fluorescence has been related to heterotrophic bacteria (Determann et al., 1998; Amaral et al., 2016) and associated with phytoplankton blooms in coastal environments (Para et al., 2010), which could explain the higher fraction of C2 found in summer after the spring bloom. However, no clear spatial distribution pattern was observed for this component. Maie et al. (2007) found that a large portion of peak-T was associated with non-proteinaceous material, and they proposed that such fluorescence could be attributed to tannin-associated phenols. They suggested that the tryptophan-like component is composed of a mixture of proteinaceous and presumably phenolic materials in humic-like substances with different chemical structures and ecological roles. Furthermore, polyphenolic compounds are also produced by brown algae (Geiselman and McConnell, 1981), which have massively expanded over the GoC in recent years (García-Gómez et al., 2018). The diverse sources of the protein-like C2 may explain the lack of a clear pattern on its spatial distribution in this work.
DOM Distribution in Deep Water
Dissolved organic carbon concentration in the DeepW of the GoC was not dependent on the water mass mixing since it only explained 27% of DOC distribution. This result contrasts with the Mediterranean Sea, where water mass mixing explains 83% of DOC variation (Catalá et al., 2018). This could be due to the multiple DOC sources found in the GoC, as it has been proposed for other coastal-ocean transitional systems (Liu et al., 2010). The intercept of the linear regression between the observed and calculated values from the OMP analysis showed that 54.3 (μM of DOC vary independently of water mass mixing. CDOM was not dependent on the water mass mixing either, showing a non-conservative behavior. Therefore, DOC and CDOM variability are associated with biogeochemical processes occurring in the water masses from their origin to the sampling site at a local scale. Conversely, around 70% of humic-like compounds variability was dependent on the water mass mixing, in agreement with other studies (Álvarez-Salgado et al., 2013; Catalá et al., 2015; Martínez-Pérez et al., 2019).
The relative importance of microbial respiration on DOC and CDOM distribution can be obtained through a linear relationship between the residuals of those variables and AOU residuals (Romera-Castillo et al., 2011b). The AOU reflects the net ecosystem metabolism, i.e., the net production of DO due to primary producers minus the net consumption by respiration (Smith and Hollibaugh, 1997). The difference between the observed and the OMP analyses back-calculated variables yielded the residuals of such variables, which variation is due to biogeochemical processes (Romera-Castillo et al., 2019). Although the relationship between AOUres and DOCres in the whole dataset was low and not significant (n = 256), when the dataset was sorted by upwelling affected stations, we found different relationships between these variables. Specifically, AOUres and DOCres showed a negative linear relationship in the stations less affected by the upwelling (TO, GD, SP and external stations, R2 = 0.17, β = −0.47, p < 0.001, n = 168). This result indicates that DOC supports 17% of heterotrophic metabolism. This value is within the range found by Arístegui et al. (2002) of 10–20% in the mesopelagic ocean (200–1000 m). On the contrary, in the stations affected by the upwelling (TF and GU), a positive linear relationship was observed between AOUres and DOCres (R2 = 0.28, β = 0.59, p < 0.001, n = 74). This result indicates that 28% of DOC production may be linked to microbial oxidation of particulate organic carbon to DOC (Dileep Kumar et al., 1990). This has also been proposed for the Tyrrhenian Deep Water and Western Mediterranean Deep Water (Santinelli et al., 2002). There is evidence that Mediterranean Water carries high loads of suspended particles to the North Atlantic Ocean, with higher abundance in the continental slope than off-shore (Freitas and Abrantes, 2002). The authors found higher values of suspended particle materials in Gibraltar and the western GoC near Cape of St. Vincent, while in the eastern GoC, mixing of MOW with NACW resulted in a decrease of particle abundance. Cape of Trafalgar and Cape of Sta. María (TF and GU) are influenced by a nutrient-rich upwelling, which enhances primary production in the SurfW and increases particle sinking. We hypothesized that the influence of the upwelling together with the higher load of particle material in this zone might be responsible for the spatial differences in oxygen consumption in the Deep GoC waters. Moreover, recent work found contrasting behaviors of net removal/accumulation of DOC in the deep Atlantic Ocean when increasing the spatial resolution (Romera-Castillo et al., 2019). Thus, our results highlight the importance of local conditions in DOC dynamics.
Although not a strong relationship was observed between residuals of FDOM components with AOUres (R2 < 0.1, p > 0.05), the positive slope between humic-like C1 and AOUres (1.5 ± 0.9 × 10⁻⁵ RU μmol O2–1 Kg) obtained in this work was quite similar to that observed in the West Mediterranean Sea (1.6 ± 0.4 × 10⁻⁵ RU μmol O2–1 Kg, Martínez-Pérez et al., 2019). This result indicates the release of humic-like FDOM as a byproduct of organic matter mineralization (Nieto-Cid et al., 2006; Jørgensen et al., 2011). Furthermore, higher typical values of C1 were found in NACWS and MOW, matching the highest AOU values (Table 3). On the contrary, the slope between residuals of protein-like C2 and AOUres was negative with the same slope value as the West Mediterranean Sea (−2.7 ± 1.3 × 10⁻⁵ RU μmol O2–1 Kg), suggesting a decay of C2 fluorescence in parallel with water mass aging (Martínez-Pérez et al., 2019). The lack of correlation between tryptophan-like components and AOU has been previously reported in the global dark ocean (Catalá et al., 2015). The authors suggested that this is caused by the low fluorescence of the relatively young central water found in their study with AOU values lower than 75 μM. Our results are in agreement with this hypothesis since the typical value of AOU for NACWT was 8.71 ± 4.48 μM (Table 3) with a typical fluorescence of 0.0010 ± 0.0002 RU, even lower than those observed in Catalá et al. (2015).
Finally, it is worth mentioning the presence of distinct absorption spectra with a shoulder at ∼ 300 nm during summer in off-shore stations (SP6 and SP7) between 300 and 650 m depth (Supplementary Figure S7). Those samples also present unusual values of protein-like C2 that increase with depth (1.8–5.8 RU, data excluded). One explanation is that these signals could be related to the secondary absorption nitrate peak centered at 302 nm (Catalá et al., 2016). The authors found that when the a302: nitrate ratio is >70 μM, the impact of this peak is significant in CDOM absorption. However, in our samples, it was not the case. Another possibility is the production of CDOM by plankton, as it has been previously documented (e.g., Steinberg et al., 2004; Romera-Castillo et al., 2011b). Furthermore, Steinberg et al. (2004) found that the different major groups of plankton (including zooplankton and protozoans) have distinctive absorption spectra. The absorption spectra from CDOM exuded by gelatinous zooplankton with vertical migration (pelagic tunicates) and colonial radiolarians showed a large peak at ∼297 and 300 nm, respectively, similar to those found in this work (Supplementary Figure S7). These plankton groups are ubiquitous, and most of the pelagic tunicates are benthic (Gershwin et al., 2014), thus explaining the increase of C2 with depth. However, further work—including molecular characterization of DOM—is needed to establish the possible source of this FDOM.
Conclusion
Parallel factor analysis modeling identified six fluorescent components in the GoC. Two were humic-like and two protein-like components widely distributed in coastal and marine waters. The other two have been less observed; a terrestrial derived DOM photoproduct and a possible mixture of PAH and protein-like compounds. The GoC showed a complicated hydrographic situation where different water masses are affected by continental inputs from riverine discharges, coastal upwelling, and currents comprised in the Strait of Gibraltar. Therefore, mesoscale processes from water mass circulation patterns were not suitable to explain DOM, except for the major humic-like components. The biogeochemical processes at a local scale explained DOC, CDOM, and protein-like components. Lower values of DOC and protein-like components were observed during spring and winter when the lowest temperatures were observed, and the water column was strongly mixed. While for CDOM, the lowest values occurred in autumn, when the water column was highly stratified, indicating the importance of photodegradation as a sink of CDOM. Humic-like C1 showed more constant average fluorescence along seasons, while the terrestrially derived photoproduct C4 and protein-like components exhibited marked seasonal changes. The 10-fold higher intensity of protein-like C2 during summer that accounts for the 56.94% ± 26.28% of the total pool of FDOM seems to be linked to biological activity. In deep water, the relationship between AOUres with DOCres showed spatial differences. Near the upwelling zones (TF and GU), DOC is produced in parallel with water mass aging due to microbial oxidation of particulate organic carbon to DOC. However, in the rest of the GoC, microbial DOC mineralization predominates. Finally, the relationship between FDOM residuals and AOUres suggested the production of humic-like C1 (positive slope) and consumption of protein-like C2 (negative slope) in the deep waters of the GoC. Overall, our results highlight the importance of local hydrographic and biogeochemical features in DOM dynamics in coastal ocean systems.
Data Availability Statement
The datasets generated for this study are available on request to the corresponding author.
Author Contributions
All authors contributed design of the study and revised and approved the submitted version of the manuscript. JF and VA measured and processed the data. VA and CR-C carried out statistical analysis. VA prepared the manuscript with the help and inputs of CR-C and JF.
Funding
This work was funded by the Spanish CICYT (Spanish Program for Science Technology) under the contract CTM2014-59244-C3-1-R and RTI2018-100865-B-C21. VA was financed by the Uruguayan Agency for Research and Innovation (ANII) with a Ph.D. fellowship (POS_EXT_2015_1_122780). CR-C was funded by a Juan de la Cierva-Incorporación Postdoctoral Fellowship from the Spanish “Ministerio de Economía y Competitividad.”
Conflict of Interest
The authors declare that the research was conducted in the absence of any commercial or financial relationships that could be construed as a potential conflict of interest.
Acknowledgments
The authors would like to thanks the crews of the R/V’s Angeles Alvariño and Ramón Margalef for their assistance during fieldwork. Ana Sierra and Dolores Jiménez-López for their assistance in data acquisition. Gastón Pereyra and Maria Vilas performed the final language revision.
Supplementary Material
The Supplementary Material for this article can be found online at: https://www.frontiersin.org/articles/10.3389/fmars.2020.00126/full#supplementary-material
Abbreviations
a254, absorption coefficient at 254 nm (m–1); AOU, apparent oxygen utilization (μ M); AOUres, AOU residuals; CDOM, chromophoric dissolved organic matter; Chl a, in vivo chlorophyll a fluorescence (μ g L–1); DeepW, deep water; DO, dissolved oxygen (μ M); DOC, dissolved organic carbon (μ M); DOCres, DOC residuals; DOM, dissolved organic matter; EEMs, Excitation-Emission matrixes; FDOM, fluorescent dissolved organic matter; GD, Guadalquivir; GoC, Gulf of Cádiz; GU, Guadiana; MOW, Mediterranean Outflow Water; NACW, North Atlantic Central Water; OMP, Optimum multiparametric water mass analysis; PAH, polycyclic aromatic hydrocarbon; PARAFAC, parallel factor analysis; S, salinity; S275–295, spectral slope between 275 and 295 nm (nm–1); SP, Sancti Petri; SurfW, surface water; SUVA254, specific ultraviolet absorbance at 254 nm (L mg–1 m–1); SWT, source water types; T, temperature (° C); TF, Trafalgar; TO, Tinto-Odiel.
Footnotes
- ^ http://www.chguadalquivir.es/
- ^ https://www.chguadiana.es
- ^ http://www.juntadeandalucia.es
- ^ http://www.marineplan.es
References
Álvarez, M., Brea, S., Mercier, H., and Álvarez-Salgado, X. A. (2014). Mineralization of biogenic materials in the water masses of the South Atlantic Ocean. I: assessment and results of an optimum multiparameter analysis. Prog. Oceanogr. 123, 1–23. doi: 10.1016/j.pocean.2013.12.007
Álvarez-Salgado, X. A., Nieto-Cid, M., Álvarez, M., Pérez, F. F., Morin, P., and Mercier, H. (2013). New insights on the mineralization of dissolved organic matter in central, intermediate, and deep water masses of the northeast North Atlantic. Limnol. Oceanogr. 58, 681–696. doi: 10.4319/lo.2013.58.2.0681
Amaral, V., Graeber, D., Calliari, D., and Alonso, C. (2016). Strong linkages between DOM optical properties and main clades of aquatic bacteria. Limnol. Oceanogr. 61, 906–918. doi: 10.1002/lno.10258
Arístegui, J., Duarte, C. M., Agustí, S., Doval, M., Álvarez-Salgado, X. A., and Hansell, D. A. (2002). Oceanography: dissolved organic carbon support of respiration in the dark ocean. Science. 298:1967. doi: 10.1126/science.1076746
Aurin, D., and Mannino, A. (2012). A database for developing global ocean color algorithms for colored dissolved organic material, CDOM spectral slope, and dissolved organic carbon. Ocean Opt. 11, 121257.
Baringer, M. O. N., and Price, J. F. (1999). A review of the physical oceanography of the Mediterranean outflow. Mar. Geol. 155, 63–82. doi: 10.1016/S0025-3227(98)00141-8
Bellanco, M. J., and Sánchez-Leal, R. F. (2016). Spatial distribution and intra-annual variability of water masses on the Eastern Gulf of Cadiz seabed. Cont. Shelf Res. 128, 26–35. doi: 10.1016/j.csr.2016.09.001
Benson, B. B., and Krause, D. J. (1984). The concentration and isotopic fractionation of oxygen dissolved in freshwater and seawater in equilibrium with the atmosphere. Limnol. Oceanogr. 29, 620–632. doi: 10.4319/lo.1984.29.3.0620
Blough, N. V., and Del Vecchio, R. (2002). “Chromophoric DOM in the coastal environment,” in Biogeochemistry of Marine Dissolved Organic Matter, eds D. A. Hansell, and C. A. Carlson, (Cambridge, MA: Academic Press), 509–546. doi: 10.1016/b978-012323841-2/50012-9
Catalá, T. S., Martínez-Pérez, A. M., Nieto-Cid, M., Álvarez, M., Otero, J., Emelianov, M., et al. (2018). Dissolved Organic Matter (DOM) in the open Mediterranean Sea. I. Basin–wide distribution and drivers of chromophoric DOM. Prog. Oceanogr. 165, 35–51. doi: 10.1016/j.pocean.2018.05.002
Catalá, T. S., Mladenov, N., Echevarría, F., and Reche, I. (2013). Positive trends between salinity and chromophoric and fluorescent dissolved organic matter in a seasonally inverse estuary. Estuar. Coast. Shelf Sci. 133, 206–216. doi: 10.1016/j.ecss.2013.08.030
Catalá, T. S., Reche, I., Fuentes-Lema, A., Romera-Castillo, C., Nieto-Cid, M., Ortega-Retuerta, E., et al. (2015). Turnover time of fluorescent dissolved organic matter in the dark global ocean. Nat. Commun. 6, 1–8. doi: 10.1038/ncomms6986
Catalá, T. S., Reche, I., Ramón, C. L., López-sanz, À, Álvarez, M., Calvo, E., et al. (2016). Chromophoric signatures of microbial by-products in the dark ocean. Geophys. Res. Lett. 43, 7639–7648. doi: 10.1002/2016GL069878
Cauwet, G. (2002). “DOM in coastal zone,” in Biogeochemistry of Marine Dissolved Organic Matter, eds D. A. Hansell and C. A. Carlson (San Diego, CA: Academic Press), 579–609.
Coble, P. (1996). Characterization of marine and terrestrial DOM in seawater using excitation-emission matrix spectroscopy. Mar. Chem. 51, 325–346. doi: 10.1016/0304-4203(95)00062-3
Coble, P. G. (2007). Marine optical biogeochemistry: the chemistry of ocean color. Chem. Rev. 107, 402–418. doi: 10.1021/cr050350
Coble, P. G., Lead, J., Baker, A., Reynolds, D. M., and Spencer, R. G. M. (2014). Aquatic Organic Matter Fluorescence. eds P. G. Coble, J. Lead, A. Baker, D. M. Reynolds, and R. G. M. Spencer. (Cambridge: Cambridge University Press).
Criado-Aldeanueva, F., Garcia-Lafuente, J., Navarro, G., and Ruiz, J. (2009). Seasonal and interannual variability of the surface circulation in the eastern Gulf of Cadiz (SW Iberia). J. Geophys. Res. Ocean. 114, 1–11. doi: 10.1029/2008JC005069
Criado-Aldeanueva, F., García-Lafuente, J., Vargas, J. M., Del Río, J., Vázquez, A., Reul, A., et al. (2006). Distribution and circulation of water masses in the Gulf of Cadiz from in situ observations. Deep. Res. Part II Top. Stud. Oceanogr. 53, 1144–1160. doi: 10.1016/j.dsr2.2006.04.012
Dafner, E., González-Dávila, M., Magdalena Santana-Casiano, J., and Sempéré, R. (2001). Total organic and inorganic carbon exchange through the strait of gibraltar in september 1997. Deep. Res. Part I Oceanogr. Res. Pap. 48, 1217–1235. doi: 10.1016/S0967-0637(00)00064-9
de la Paz, M., Gómez-Parra, A., and Forja, J. (2007). Inorganic carbon dynamic and air-water CO2 exchange in the guadalquivir estuary (SW Iberian Peninsula). J. Mar. Syst 68, 265–277. doi: 10.1016/j.jmarsys.2006.11.011
Del Castillo, C., Gilbes, F., Goble, P. G., and Muller-Karger, F. E. (2000). On the seasonal dispersal of riverine colored dissolved organic Matter(CDOM) on the west Florida Shelf. Limnol.Oceanogr. 45, 1425–1432. doi: 10.4319/lo.2000.45.6.1425
Determann, S., Lobbes, J., örg, M., Reuter, R., and Rullkötter, J. (1998). Ultraviolet fluorescence excitation and emission spectroscopy of marine algae and bacteria. Mar. Chem. 62, 137–156. doi: 10.1016/S0304-4203(98)00026-7
Dileep Kumar, M., Rajendran, A., Somasundar, K., Haake, B., Jenisch, A., Shuo, Z., et al. (1990). Dynamics of dissolved organic carbon in the northwestern Indian Ocean. Mar. Chem. 31, 299–316. doi: 10.1016/0304-4203(90)90044-D
Echevarría, F., Zabala, L., Corzo, A., Navarro, G., Prieto, L., and Macías, D. (2009). Spatial distribution of autotrophic picoplankton in relation to physical forcings: the Gulf of Cádiz, Strait of Gibraltar and Alborán Sea case study. J. Plankton Res. 31, 1339–1351. doi: 10.1093/plankt/fbp070
Ferrari, G. M. (2000). The relationship between chromophoric dissolved organic matter and dissolved organic carbon in the European atlantic coastal area and in the West Mediterranean Sea (Gulf of Lions). Mar. Chem. 70, 339–357. doi: 10.1016/S0304-4203(00)00036-0
Flecha, S., Pérez, F. F., Navarro, G., Ruiz, J., Olivé, I., Rodríguez-Gálvez, S., et al. (2012). Anthropogenic carbon inventory in the Gulf of Cádiz. J. Mar. Syst. 92, 67–75. doi: 10.1016/j.jmarsys.2011.10.010
Freitas, P. S., and Abrantes, F. (2002). Suspended particulate matter in the Mediterranean water at the Gulf of Cadiz and off the southwest coast of the Iberian Peninsula. Deep. Res. Part II Top. Stud. Oceanogr. 49, 4245–4261. doi: 10.1016/S0967-0645(02)00153-4
Galletti, Y., Gonnelli, M., Retelletti Brogi, S., Vestri, S., and Santinelli, C. (2019). DOM dynamics in open waters of the Mediterranean Sea: new insights from optical properties. Deep. Res. Part I Oceanogr. Res. Pap. 144, 95–114. doi: 10.1016/j.dsr.2019.01.007
García-Gómez, J. C., Sempere-Valverde, J., Ostalé-Valriberas, E., Martínez, M., Olaya-Ponzone, L., González, A. R., et al. (2018). “Rugulopterix okamurae (EY Dawson) IK Hwang, WJ Lee & HS Kim (Dictyotales, Ochrophyta), alga exótica “explosiva” en el estrecho de Gibraltar,” in. Observaciones Preliminares de su Distribución e Impacto, Almoraima, 48.
Garel, E., Laiz, I., Drago, T., and Relvas, P. (2016). Characterisation of coastal counter-currents on the inner shelf of the Gulf of Cadiz. J. Mar.Syst. 155, 19–34. doi: 10.1016/j.jmarsys.2015.11.001
Geiselman, J. A., and McConnell, O. J. (1981). Polyphenols in brown algae Fucus vesiculosus and Ascophyllum nodosum: chemical defenses against the marine herbivorous snail. Littorina littorea. J. Chem. Ecol. 7, 1115–1133. doi: 10.1007/BF00987632
Gershwin, L., Lewis, M., Gowlett-Holmes, K., and Kloser, R. (2014). “The pelagic tunicates,” in Pelagic Invertebrates of South-Eastern Australia: A Field Reference Guide. Version 1.1, ed. L. Gershwin (Hobart: CSIRO Marine and Atmospheric Research).
Gonnelli, M., Galletti, Y., Marchetti, E., Mercadante, L., Retelletti Brogi, S., Ribotti, A., et al. (2016). Dissolved organic matter dynamics in surface waters affected by oil spill pollution: results from the serious game exercise. Deep. Res. Part II Top. Stud. Oceanogr. 133, 88–99. doi: 10.1016/j.dsr2.2016.05.027
González-García, C., Forja, J., González-Cabrera, M. C., Jiménez, M. P., and Lubián, L. M. (2018). Annual variations of total and fractionated chlorophyll and phytoplankton groups in the Gulf of Cadiz. Sci. Total Environ. 61, 1551–1565. doi: 10.1016/j.scitotenv.2017.08.292
González-Ortegón, E., Amaral, V., Baldó, F., Sánchez-Leal, R. F., Bellanco, M. J., Jiménez, M. P., et al. (2018). Sources and coastal distribution of dissolved organic matter in the Gulf of Cadiz. Sci. Total Environ. 630, 1583–1595. doi: 10.1016/j.scitotenv.2018.02.293
Green, S. A., and Blough, N. V. (1994). Optical absorption and fluorescence of chromophoric properties dissolved organic matter in natural waters. Limnology 39, 1903–1916. doi: 10.4319/lo.1994.39.8.1903
Hansell, D. A., Carlson, C. A., Repeta, D. J. R., and Schlitzer, R. (2009). Dissolved organic matter in the Ocean. Oceanography 22, 202–211.
Helms, J. R., Kieber, D. J., Minor, E. C., Ritchie, J. D., Stubbins, A., and Mopper, K. (2008). Absorption spectral slopes and slope ratios as indicators of molecular weight, source, and photobleaching of chromophoric dissolved organic matter. Limnol. Oceanogr. 53, 955–969. doi: 10.4319/lo.2008.53.3.0955
Huertas, E., Navarro, G., Rodríguez-Gálvez, S., and Prieto, L. (2005). The influence of phytoplankton biomass on the spatial distribution of carbon dioxide in surface sea water of a coastal area of the Gulf of Cádiz (southwestern Spain). Can. J. Bot. 83, 929–940. doi: 10.1139/b05-082
Jørgensen, L., Stedmon, C. A., Kragh, T., Markager, S., Middelboe, M., and Søndergaard, M. (2011). Global trends in the fluorescence characteristics and distribution of marine dissolved organic matter. Mar. Chem. 126, 139–148. doi: 10.1016/j.marchem.2011.05.002
Kothawala, D. N., Murphy, K. R., Stedmon, C. A., Weyhenmeyer, G. A., and Tranvik, L. J. (2013). Inner filter correction of dissolved organic matter fluorescence. Limnol. Oceanogr. Methods 11, 616–630. doi: 10.4319/lom.2013.11.616
Lawaetz, A. J., and Stedmon, C. A. (2009). Fluorescence intensity calibration using the Raman scatter peak of water. Appl. Spectrosc. 63, 936–940. doi: 10.1366/000370209788964548
Liu, K. K., Atkinson, L., Quiñones, R., and Talaue-McManus, L. (eds) (2010). Carbon and nutrient Fluxes in Continental Margins: a Global Synthesis. Berlin: Springer Science & Business Media.
Lønborg, C., and Álvarez-Salgado, X. A. (2014). Tracing dissolved organic matter cycling in the eastern boundary of the temperate North Atlantic using absorption and fluorescence spectroscopy. Deep. Res. Part I Oceanogr. Res. Pap. 85, 35–46. doi: 10.1016/j.dsr.2013.11.002
Maie, N., Scully, N. M., Pisani, O., and Jaffé, R. (2007). Composition of a protein-like fluorophore of dissolved organic matter in coastal wetland and estuarine ecosystems. Water Res. 41, 563–570. doi: 10.1016/j.watres.2006.11.006
Martínez-Pérez, A. M., Catalá, T. S., Nieto-Cid, M., Otero, J., Álvarez, M., Emelianov, M., et al. (2019). Dissolved organic matter (DOM) in the open Mediterranean Sea. II: basin–wide distribution and drivers of fluorescent DOM. Prog. Oceanogr. 170, 93–106. doi: 10.1016/j.pocean.2018.10.019
Massicotte, P., Asmala, E., Stedmon, C., and Markager, S. (2017). Global distribution of dissolved organic matter along the aquatic continuum: across rivers, lakes and oceans. Science of the Total Environment 609, 180–191. doi: 10.1016/j.scitotenv.2017.07.076
Mauritzen, C., Morel, Y., and Paillet, J. (2001). On the influence of mediterranean water on the central waters of the North Atlantic Ocean. Deep. Res. Part I Oceanogr. Res. Pap. 48, 347–381. doi: 10.1016/S0967-0637(00)00043-1
Mostofa, K. M. G., Jie, Y., Sakugawa, H., and Liu, C. Q. (2019). Equal treatment of different EEM Data on PARAFAC modeling produces artifact fluorescent components that have misleading biogeochemical consequences. Environ. Sci. Technol. 53, 561–563. doi: 10.1021/acs.est.8b06647
Murphy, K. R., Stedmon, C. A., Graeber, D., and Bro, R. (2013). Fluorescence spectroscopy and multi-way techniques. PARAFAC. Anal. Methods 5, 6557–6566. doi: 10.1039/c3ay41160e
Murphy, K. R., Stedmon, C. A., Wenig, P., and Bro, R. (2014). OpenFluor- an online spectral library of auto-fluorescence by organic compounds in the environment. Anal. Methods 6, 658–661. doi: 10.1039/c3ay41935e
Murphy, K. R., Timko, S. A., Gonsior, M., Powers, L. C., Wünsch, U. J., and Stedmon, C. A. (2018). Photochemistry illuminates ubiquitous organic matter fluorescence spectra. Environ. Sci. Technol. 52, 11243–11250. doi: 10.1021/acs.est.8b02648
Navarro, G., Caballero, I., Prieto, L., Vázquez, A., Flecha, S., Huertas, I. E., et al. (2012). Seasonal-to-interannual variability of chlorophyll-a bloom timing associated with physical forcing in the Gulf of Cádiz. Adv. Sp. Res. 50, 1164–1172. doi: 10.1016/j.asr.2011.11.034
Nelson, N. B., and Siegel, D. A. (2013). The global distribution and dynamics of chromophoric dissolved organic matter. Ann. Rev. Mar. Sci. 5, 447–476. doi: 10.1146/annurev-marine-120710-100751
Nieto-Cid, M., Alvarez-Salgado, X. A., and Perez, F. F. (2006). Microbial and photochemical reactivity of fluorescent dissolved organic matter in a coastal upwelling system. Limnol. Oceanogr. 51, 1391–1400. doi: 10.4319/lo.2006.51.3.1391
Opsahl, S., and Benner, R. (1997). Distribution and cycling of terrigenous dissolved organic matter in the ocean. Nature 386, 480–482. doi: 10.1038/386480a0
Para, J., Coble, P. G., Charrière, B., Tedetti, M., Fontana, C., and Sempéré, R. (2010). Fluorescence and absorption properties of chromophoric dissolved organic matter (CDOM) in coastal surface waters of the northwestern Mediterranean Sea, influence of the Rhone River. Biogeosciences 7, 4083–4103. doi: 10.5194/bg-7-4083-2010
Parrilla, G. (1998). Mid-Term Scientific Report. CANIGO-MAST 3-CT 96-0060. Madrid: Instituto Español de Oceanografía.
Pérez, F. F., Castro, C. G., Álvarez-Salgado, X. A., and Ríos, A. F. (2001). Coupling between the Iberian basin - Scale circulation and the Portugal boundary current system: a chemical study. Deep. Res. Part I Oceanogr. Res. Pap. 48, 1519–1533. doi: 10.1016/S0967-0637(00)00101-1
Poole, R., and Tomczak, M. (1999). Optimum multiparameter analysis of the water mass structure in the western North Atlantic Ocean. J. Geophys. Res. 98:10155. doi: 10.1029/93jc00180
Price, J. F., and O’Neil Baringer, M. (1994). Outflows and deep water production by marginal seas. Prog. Oceanogr. 33, 161–200. doi: 10.1016/0079-6611(94)90027-2
R Core Team (2018). R: A Language and Environment for Statistical Computing. Vienna, Austria: R Foundation for Statistical Computing.
Ribas-Ribas, M., Gómez-Parra, A., and Forja, J. M. (2011a). Air-sea CO2 fluxes in the north-eastern shelf of the Gulf of Cádiz (southwest Iberian Peninsula). Mar. Chem. 123, 56–66. doi: 10.1016/j.marchem.2010.09.005
Ribas-Ribas, M., Gómez-Parra, A., and Forja, J. M. (2011b). Spatio-temporal variability of the dissolved organic carbon and nitrogen in a coastal area affected by river input: the north eastern shelf of the Gulf of Cádiz (SW Iberian Peninsula). Mar. Chem. 126, 295–308. doi: 10.1016/j.marchem.2011.07.003
Rochelle-Newall, E., Hulot, F. D., Janeau, J. L., and Merroune, A. (2014). CDOM fluorescence as a proxy of DOC concentration in natural waters: a comparison of four contrasting tropical systems. Environ. Monit. Assess. 186, 589–596. doi: 10.1007/s10661-013-3401-2
Romera-Castillo, C., Álvarez, M., and Pelegrí, J. L. (2019). Net additions of recalcitrant dissolved organic carbon in the Deep Atlantic Ocean. Global Biogeochemical Cycles 33, 1162–1173. doi: 10.1029/2018GB006162
Romera-Castillo, C., Álvarez-Salgado, X. A., Galí, M., Gasol, J. M., and Marrasé, C. (2013). Combined effect of light exposure and microbial activity on distinct dissolved organic matter pools. A seasonal field study in an oligotrophic coastal system (Blanes Bay, NW Mediterranean). Mar. Chem. 148, 44–51. doi: 10.1016/j.marchem.2012.10.004
Romera-Castillo, C., Nieto-Cid, M., Castro, C. G., Marrasé, C., Largier, J., Barton, E. D., et al. (2011a). Fluorescence: absorption coefficient ratio - Tracing photochemical and microbial degradation processes affecting coloured dissolved organic matter in a coastal system. Mar. Chem. 125, 26–38. doi: 10.1016/j.marchem.2011.02.001
Romera-Castillo, C., Sarmento, H., Alvarez-Salgado, X. A. Á, Gasol, J. M., and Marrasé, C. (2011b). Net production and consumption of fluorescent colored dissolved organic matter by natural bacterial assemblages growing on marine phytoplankton exudates. Appl. Environ. Microbiol 77, 7490–7498. doi: 10.1128/AEM.00200-11
Sala, I., Navarro, G., Bolado-Penagos, M., Echevarría, F., and García, C. M. (2018). High-chlorophyll-area assessment based on remote sensing observations: the case study of Cape Trafalgar. Remote Sens 10:165. doi: 10.3390/rs10020165
Santinelli, C., Gasparini, G., Nannicini, L., and Seritti, A. (2002). Vertical distribution of dissolved organic carbon (DOC) in the Mediterranean Sea. Deep Sea Res. Part I Oceanogr. Res. Pap. 49, 2203–2219. doi: 10.3354/cr031205
Shen, Y., Fichot, C. G., and Benner, R. (2012). Floodplain influence on dissolved organic matter composition and export from the Mississippi–Atchafalaya river system to the Gulf of Mexico. Limnol. Oceanogr. 57, 1149–1160. doi: 10.4319/lo.2012.57.4.1149
Smith, S. V., and Hollibaugh, J. T. (1997). Annual cycle and interannual variability of ecosystem metabolism in a temperate climate embayment. Ecol. Monogr. 67, 509–533. doi: 10.1890/0012-9615(1997)067
Stedmon, C., and Bro, R. (2008). Characterizing dissolved organic matter fluorescence with parallel factor analysis: a tutorial. Limnol. Oceanogr. Methods 6, 572–579. doi: 10.4319/lom.2008.6.572b
Steinberg, D. K., Nelson, N. B., Carlson, C. A., and Prusak, A. C. (2004). Production of chromophoric dissolved organic matter (CDOM) in the open ocean by zooplankton and the colonial cyanobacterium Trichodesmium spp. Mar. Ecol. Prog. Ser. 267, 45–56. doi: 10.3354/meps267045
Stevenson, R. E. (1977). Huelva Front and Malaga, Spain, eddy chain as defined by satellite and oceanographic data. Dtsch. Hydrogr. Zeitschrift 30, 51–53. doi: 10.1007/BF02226082
Tanaka, K., Takesue, N., Nishioka, J., Kondo, Y., Ooki, A., Kuma, K., et al. (2016). The conservative behavior of dissolved organic carbon in surface waters of the southern Chukchi Sea, Arctic Ocean, during early summer. Sci. Rep. 6, 1–10. doi: 10.1038/srep34123
Vargas-Yáñez, M., Sarhan, T., Plaza, F., Rubín, J. P., and García-Martínez, M. C. (2002). The influence of tide-topography interaction on low-frequency heat and nutrient fluxes. Application to Cape Trafalgar. 22, 115–139. doi: 10.1016/s0278-4343(01)00063-2
Vasconcelos, R. P., Reis-Santos, P., Fonseca, V., Maia, A., Ruano, M., França, S., et al. (2007). Assessing anthropogenic pressures on estuarine fish nurseries along the Portuguese coast: a multi-metric index and conceptual approach. Sci. Total Environ. 374, 199–215. doi: 10.1016/j.scitotenv.2006.12.048
Keywords: DOC, DOM, optical properties, PARAFAC, water mass analysis, biogeochemistry and coastal-ocean transitional system
Citation: Amaral V, Romera-Castillo C and Forja J (2020) Dissolved Organic Matter in the Gulf of Cádiz: Distribution and Drivers of Chromophoric and Fluorescent Properties. Front. Mar. Sci. 7:126. doi: 10.3389/fmars.2020.00126
Received: 18 July 2019; Accepted: 17 February 2020;
Published: 20 March 2020.
Edited by:
Gordon T. Taylor, Stony Brook University, United StatesReviewed by:
Eurico D’Sa, Louisiana State University, United StatesMorimaru Kida, University of Oldenburg, Germany
Copyright © 2020 Amaral, Romera-Castillo and Forja. This is an open-access article distributed under the terms of the Creative Commons Attribution License (CC BY). The use, distribution or reproduction in other forums is permitted, provided the original author(s) and the copyright owner(s) are credited and that the original publication in this journal is cited, in accordance with accepted academic practice. No use, distribution or reproduction is permitted which does not comply with these terms.
*Correspondence: Valentina Amaral, dmFtYXJhbEBjdXJlLmVkdS51eQ==