 Bruce H. Robison
 Rob E. Sherlock
 Kim R. Reisenbichler
 Paul R. McGill
- Monterey Bay Aquarium Research Institute, Moss Landing, CA, United States
Diel vertical migrations (DVM) by zooplankton and nekton are driven by the selective advantage of avoiding visually cued predators near the surface during the hours of daylight. And just as there is a second set of predators that occupy the migrators’ dark daytime depths, there is also a diverse suite of predators that comprise a gauntlet of threats during the migrations. Here we examine these migrations from the perspective of the migrators, to enumerate the kinds of predatory threats they face and to assess the threat potential of various predator types. The study is based on thousands of hours of in situ observations and measurements of the mesopelagic community in Monterey Bay, California, conducted chiefly by remotely operated vehicles (ROVs). We provide accounts of some predator/prey interactions, and we introduce a means to calculate the threat potential of specific predators, based on MBARI’s long-term time-series of quantitative video surveys.
Introduction
The dusk and dawn migrations of epi-mesopelagic animals comprise a tidal cycle of shifting biomass in a tide driven not by gravity, but by light. Twice a day a diverse aggregation of species traverses the water column, with most individuals covering hundreds of meters each way (Marshall, 1979). Distributed along the migratory path are passive predators, lying in wait to ensnare, entangle, or engulf the vertical commuters. Also attendant are layers of active predators, who lure, track, or chase their migrating prey. In the 17th century, some Native American tribes imposed ritualistic punishment on prisoners by forcing them to run between two lines of warriors who would reach out to strike the captive as he raced past. Similar practices are known from military history as far back as the ancient Greeks. In modern parlance, “running the gauntlet” has come to mean passing through a series of challenges or attacks, and it can be applied to fraternity hazing, military boot camp, or to the diel vertical migrations (DVM) of midwater animals.
Vertically migrating animals comprise an active component of the biological pump, and when compared with passively sinking detritus, the migrators contribute significantly to the overall flux of particulate organic carbon (Robinson et al., 2010; Davison et al., 2013; Steinberg and Landry, 2017; Archibald et al., 2019). The migration strategy balances the risk of predation with feeding opportunity – factors that vary based on latitude, time of year, turbidity, the size of the animal, and more (Hansen and Visser, 2016; Ohman and Romagnan, 2016). Our historical perspective on vertical migrations has been shaped by the means through which we study them, and for the most part our spatial resolution has been indirect and relatively coarse. The trawl nets with which scientists have traditionally gathered data on DVM are blunt tools for examining complex behaviors like predation and predator avoidance. Even the most precise midwater trawling systems cannot resolve animal distribution patterns in the vertical plane at scales of less than tens of meters. And in the horizontal plane, net tows integrate distribution patterns over hundreds or thousands of meters. The best way to determine the fine-scale aspects of vertical migration is directly, in situ. The first scientist to take this approach was Eric Barham of the U.S. Navy Electronics Laboratory. Barham (1963, 1966) used human-occupied vehicles (HOVs) coupled with shipboard acoustic systems to delineate the composition and structure of sonic scattering layers (SSL). He observed, for the first time, migrating fishes, siphonophores, and crustaceans at their daytime and nighttime depths as well as during their ascents and descents.
This paper examines diel vertical migration from the standpoint of the migrators, to assess the threats they face during their movements. It is based on thousands of hours of in situ observations and measurements made with HOVs, remotely operated vehicles (ROVs), and autonomous underwater vehicles (AUVs) in Monterey Bay, California. The value of in situ midwater research has increased dramatically with the development of new vehicles and advanced technologies that enable investigative practices which were previously possible only in terrestrial and shallow-water research. These include manipulative experimental work, detailed behavioral observations, high-precision small-scale resolution of distribution and abundance, and direct measurements of physiological processes in situ (Robison et al., 2017). A consequence of technological advances is that we can now more thoroughly investigate DVM, as Barham did, from within SSL. Here we provide examples of the predatory threats faced by some migratory species, and a means to quantify the threat potential of different types of predators.
Here, threat potential is a measure of the latent risk of encountering a potential predator or obstacle during diel vertical migration. It does not equate to mortality nor is it a proxy for predation rate or predatory impact.
Materials and Methods
Data Acquisition
The quantitative data and observations reported here were generated in Monterey Bay, California, principally during a long-term series of ROV dives initiated in 1988. Dive sites were situated most commonly over the axis of the Monterey Submarine Canyon, at locations where the bottom depths ranged from 1600 to 3500 m. Three different ROVs were used to conduct the research, each carrying what, at the time, was a state-of-the-art high-resolution video camera that recorded continuously throughout each dive. The video footage, coupled with coincident hydrographic measurements, was annotated and incorporated into MBARI’s Video Annotation and Reference System (VARS) database (Schlining and Stout, 2006). The video data can be arranged into two categories: transect data and transit data.
The quantitative data presented here come from MBARI’s midwater time series, 1997–2015; which constituted 1893 mesopelagic video transects conducted during daylight hours. Transect data were generated during horizontal excursions of the vehicle at a single reference station in a vertically stacked series of specific depth intervals from 50 to 1000 m. Transects were run at a constant speed and depth with the camera’s lens at its widest field of view. Lighting was uniform. The area viewed was calculated based upon test tank calibrations. The volume of water surveyed was calculated by multiplying the viewed area by the distance traveled, which was measured precisely by an acoustic current meter (Robison et al., 2005; Katija et al., 2017). Animals in each transect were counted and summed to give abundance and that value was divided by the volume to give the number of individuals per cubic meter. Transect data were collected on approximately a monthly basis after 1994 as the core of MBARI’s midwater time-series database.
Transit data were derived from video footage recorded during all non-transecting, midwater dive time. That is, when the vehicle was ascending, descending, searching, observing, making measurements, conducting manipulative work, and all other activities in the water column. Transit data provide behavioral observations, information on predator/prey interactions and context for the quantitative transect data. Because our ROVs have variable ballast systems, behavioral observations can be made stealthily, with minimal use of thrusters to keep the vehicle in position (Robison et al., 2017). As was the case with transecting, all transit video footage was annotated by highly skilled technicians to identify and count the animals encountered, then logged into VARS. Concurrent hydrographic data were likewise logged into the database, linked by time code to each annotation.
In addition to the data generated during ROV and AUV dives, observations of Monterey Bay’s mesopelagic community and its vertical migrations were made from several HOVs: Deep Rover, Alvin, Mir, Deep Worker, and Nadir. These HOVs along with MBARI’s ROV Tiburon and the i2MAP AUV are all electrically powered and thus are relatively quiet. MBARI’s two hydraulically powered ROVs Ventana and Doc Ricketts are noisy, which limits their ability to make observations of fishes.
Seasonality of Monterey Bay
Monterey Bay is bisected by the Monterey Submarine Canyon that brings the deep ocean close to shore. Coastal upwelling delivers nutrient-rich water during spring and into the summer months (Skogsberg, 1936; Bolin and Abbott, 1963; Pennington and Chavez, 2000). Skogsberg and Phelps (1946) initially described three oceanic seasons in Monterey Bay – a pattern subsequently accepted by many scientists like Barham (1957), Bolin and Abbott (1963), and thoroughly discussed by Pennington and Chavez (2000). However, the parameters of temperature, oxygen and nutrient concentrations depend largely upon whether upwelling is, or is not, occurring (Bolin and Hopkins Marine Station, 1964).
When upwelling is underway, the mixed layer is shallow, with increased nutrient levels and primary production (Olivieri and Chavez, 2000). Data for Monterey Bay indicate that the majority of primary production occurs within this shallow mixed layer (SML) (Pennington and Chavez, 2000). In a broad sense then, the seasonality of Monterey Bay may be categorized by mixed layer depth, shallow versus deep, and estimated by whether upwelling (m d–1) is positive or negative. Mean daily upwelling velocities calculated from a 12-year data set indicate that, on average, upwelling velocity is positive from ∼ calendar days 92 (April) through 305 (November) in Monterey Bay (Olivieri and Chavez, 2000; Silguero and Robison, 2000). These dates were used to define our transect data as having occurred during the upwelling/SML or deep mixed layer (DML) season.
Calculating Threat Potential
In order to calculate the likelihood that an individual migrator would encounter a specific type of predator or threat during ascent or descent, we first calculated mean predator density per cubic meter using daytime transect data from 1997 to 2015. Logistical constraints limited our opportunities for nighttime transecting. Because transects occur at set depths in the water column (50 m, and then 100–1000 m by 100 m increments), we integrated predator abundance across the vertical depth range that the migratory prey traverse using trapezoidal integration (Dull, 1941), the Bolstad2 package (Curran, 2013) within the software R (R Core Team, 2013) and/or Mathematica (Wolfram Research Inc, 2019). After calculating areal density, the cross-sectional area (CSA) for a given predator was approximated based on its shape and size as did Jackson et al. (1993) who calculated the CSA of pteropod feeding webs. Since prey travel vertically, the likelihood of an encounter with a predator will depend on the CSA of that predator (e.g. the spread of its tentacles in the case of the siphonophore, Nanomia bijuga) and it is the predators’ horizontal spacing which matters most to the prey, not their vertical distribution. For example, two predators might overlie one another completely, but occur at different depths. For a vertically migrating prey in our model, this amounts to a single predator, not two. Building on the model of Jackson et al. (1993) we account for one predator shadowing another by randomly distributing points, based on predator density, and representing the CSA of the predators across a space of 1 m2, then calculating the percentage of predator-occupied space in that 1 m2 using Mathematica (Figure 1). Predator density was calculated from time-series data (Figure 2). The probability of encountering a predator while migrating vertically is equal to the fraction of the square meter occupied by predators. For each predator, this simulation was repeated 1000 times (a normal Poisson distribution was usually reached after 500 permutations and in all cases by 1000) to generate a mean threat potential – the chance of a prey item encountering, but not necessarily being captured by, a predator while migrating vertically.
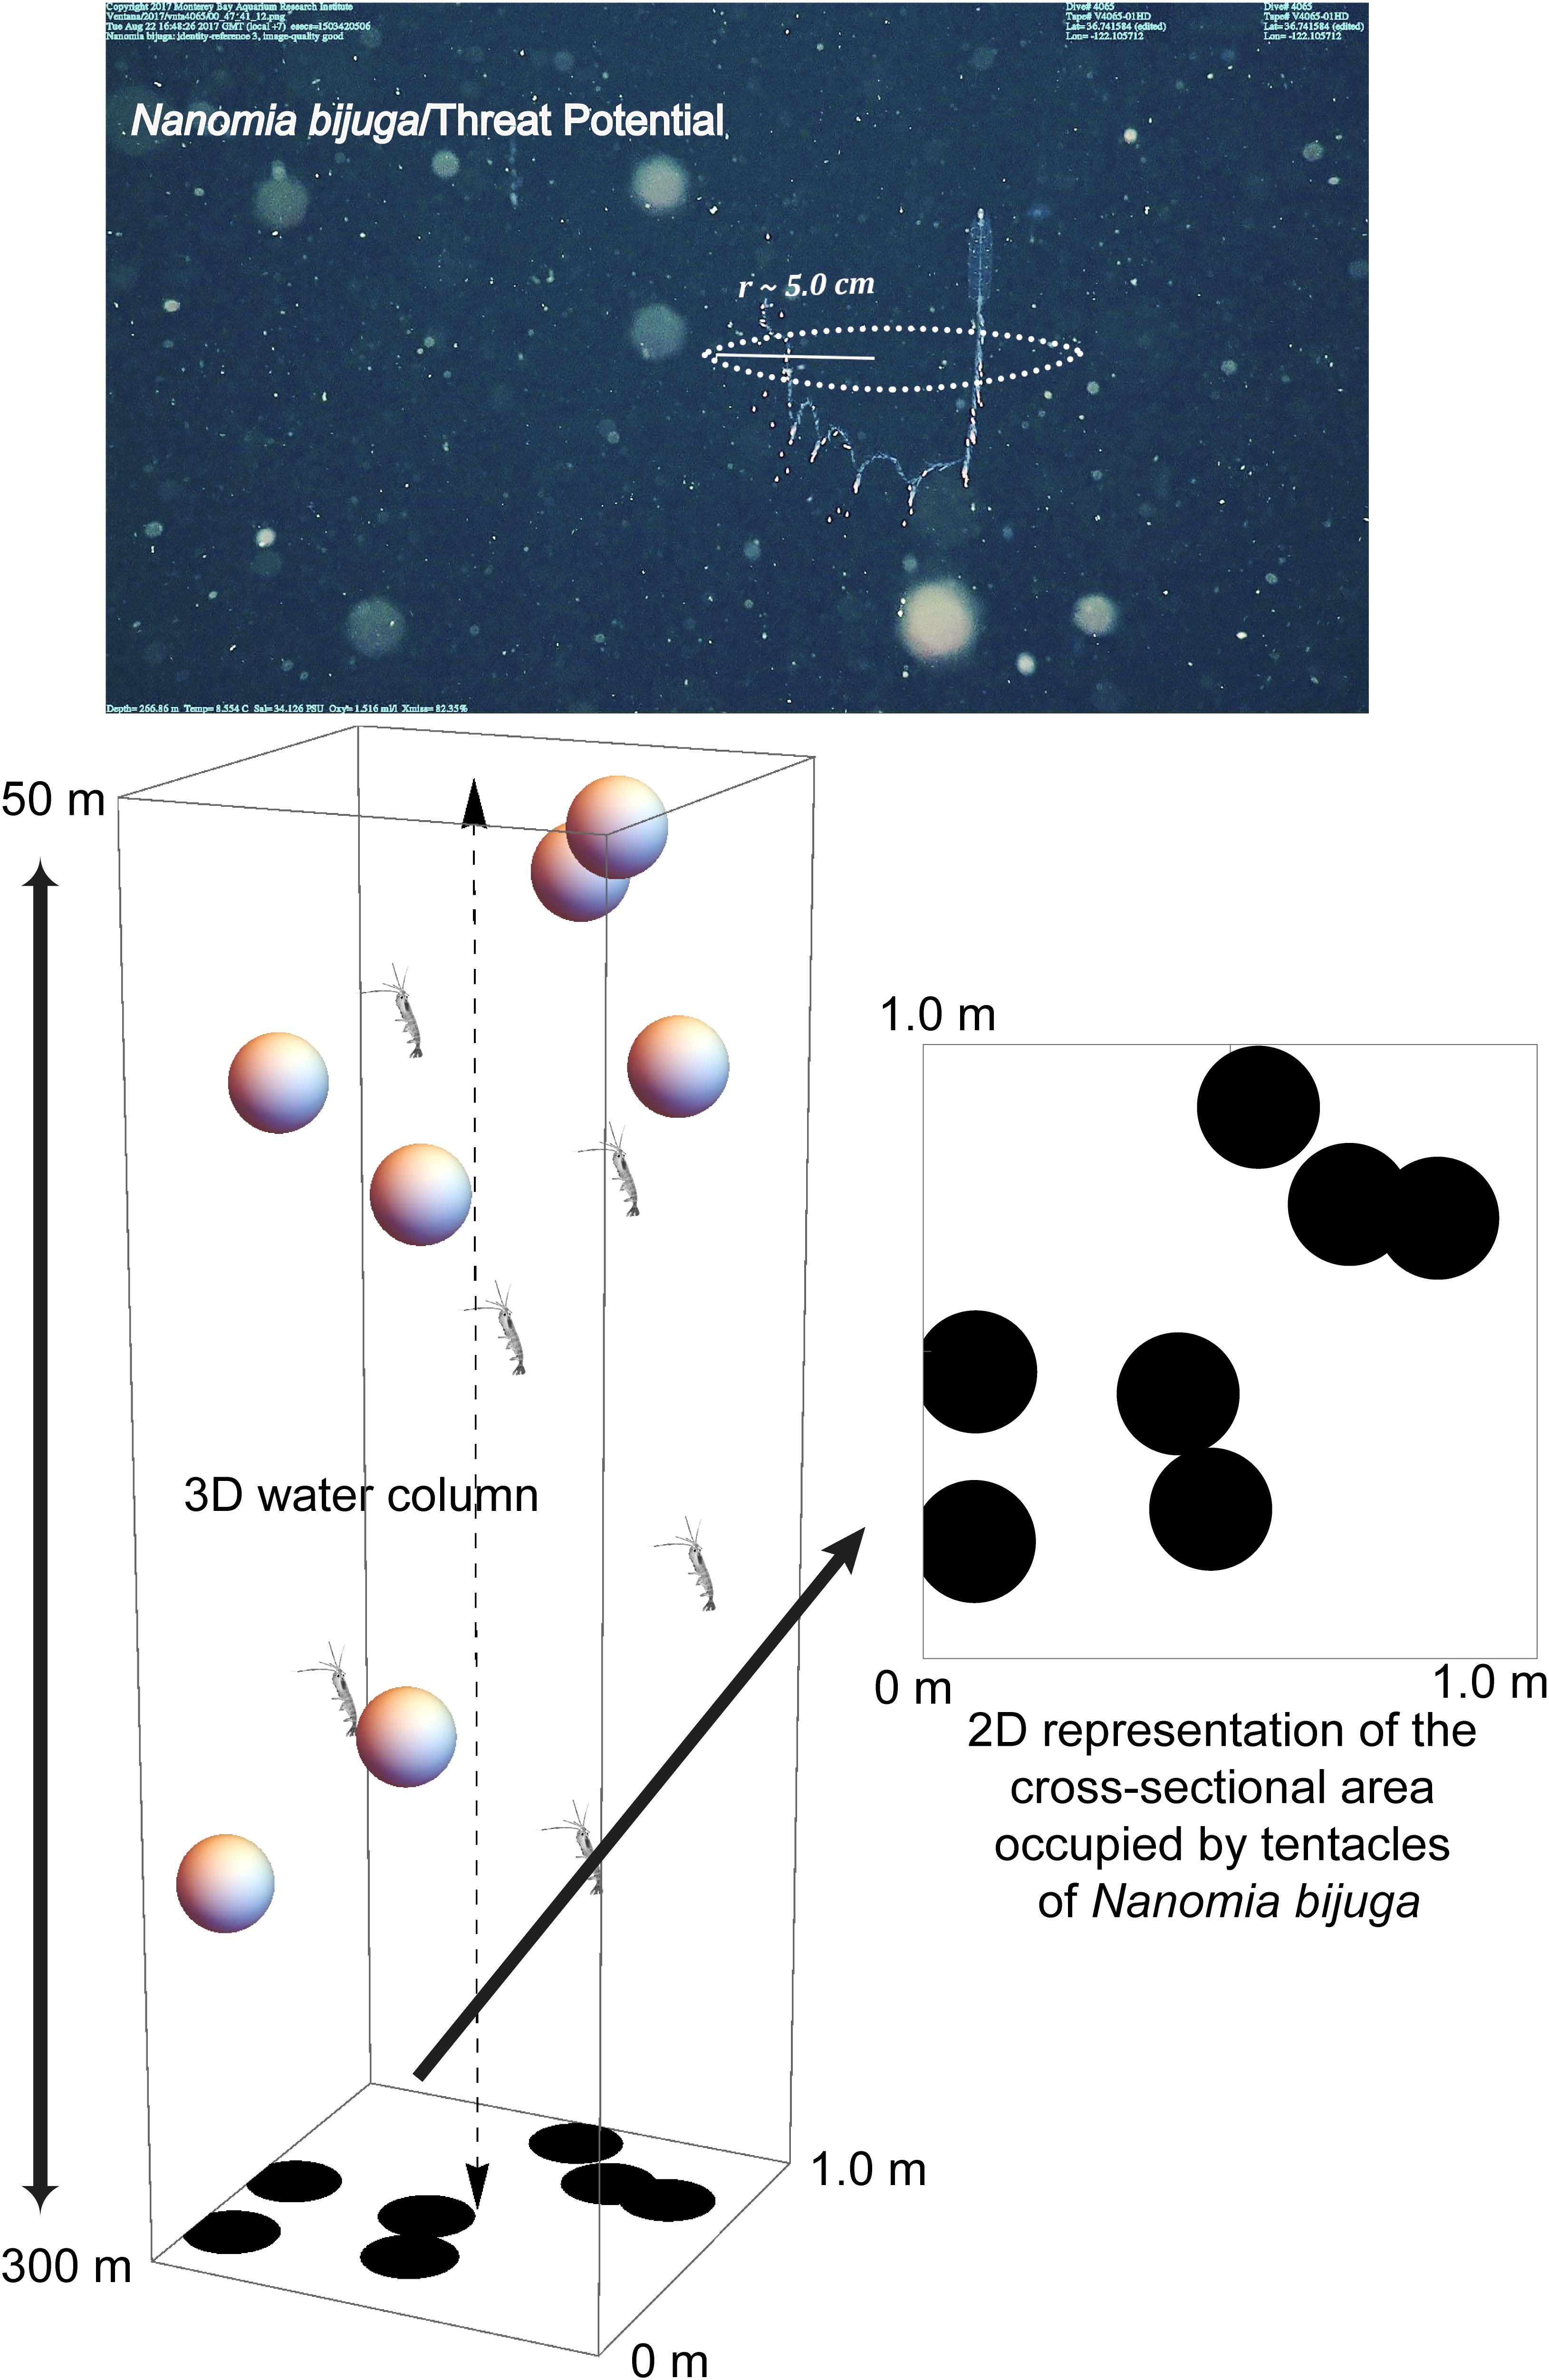
Figure 1. ROV video frame grab of the physonect siphonophore, Nanomia bijuga, fishing with its siphosome forming a “J” shape and tentilla with nematocysts (stinging cells) emanating outward and around the animal. A radius of 5 cm constitutes an average threat potential of ∼ 4–8% for the siphonophore, depending on seasonal abundance. The 3D diagram illustrates N. bijuga (spheres) in the 1 m2 × 250 m water column through which the vertically migrating prey (euphausiids) traverse. The threat potential was calculated based on the space occupied by the predator’s tentacles (dark circles) versus unoccupied space in the 2D illustration. Not to scale.
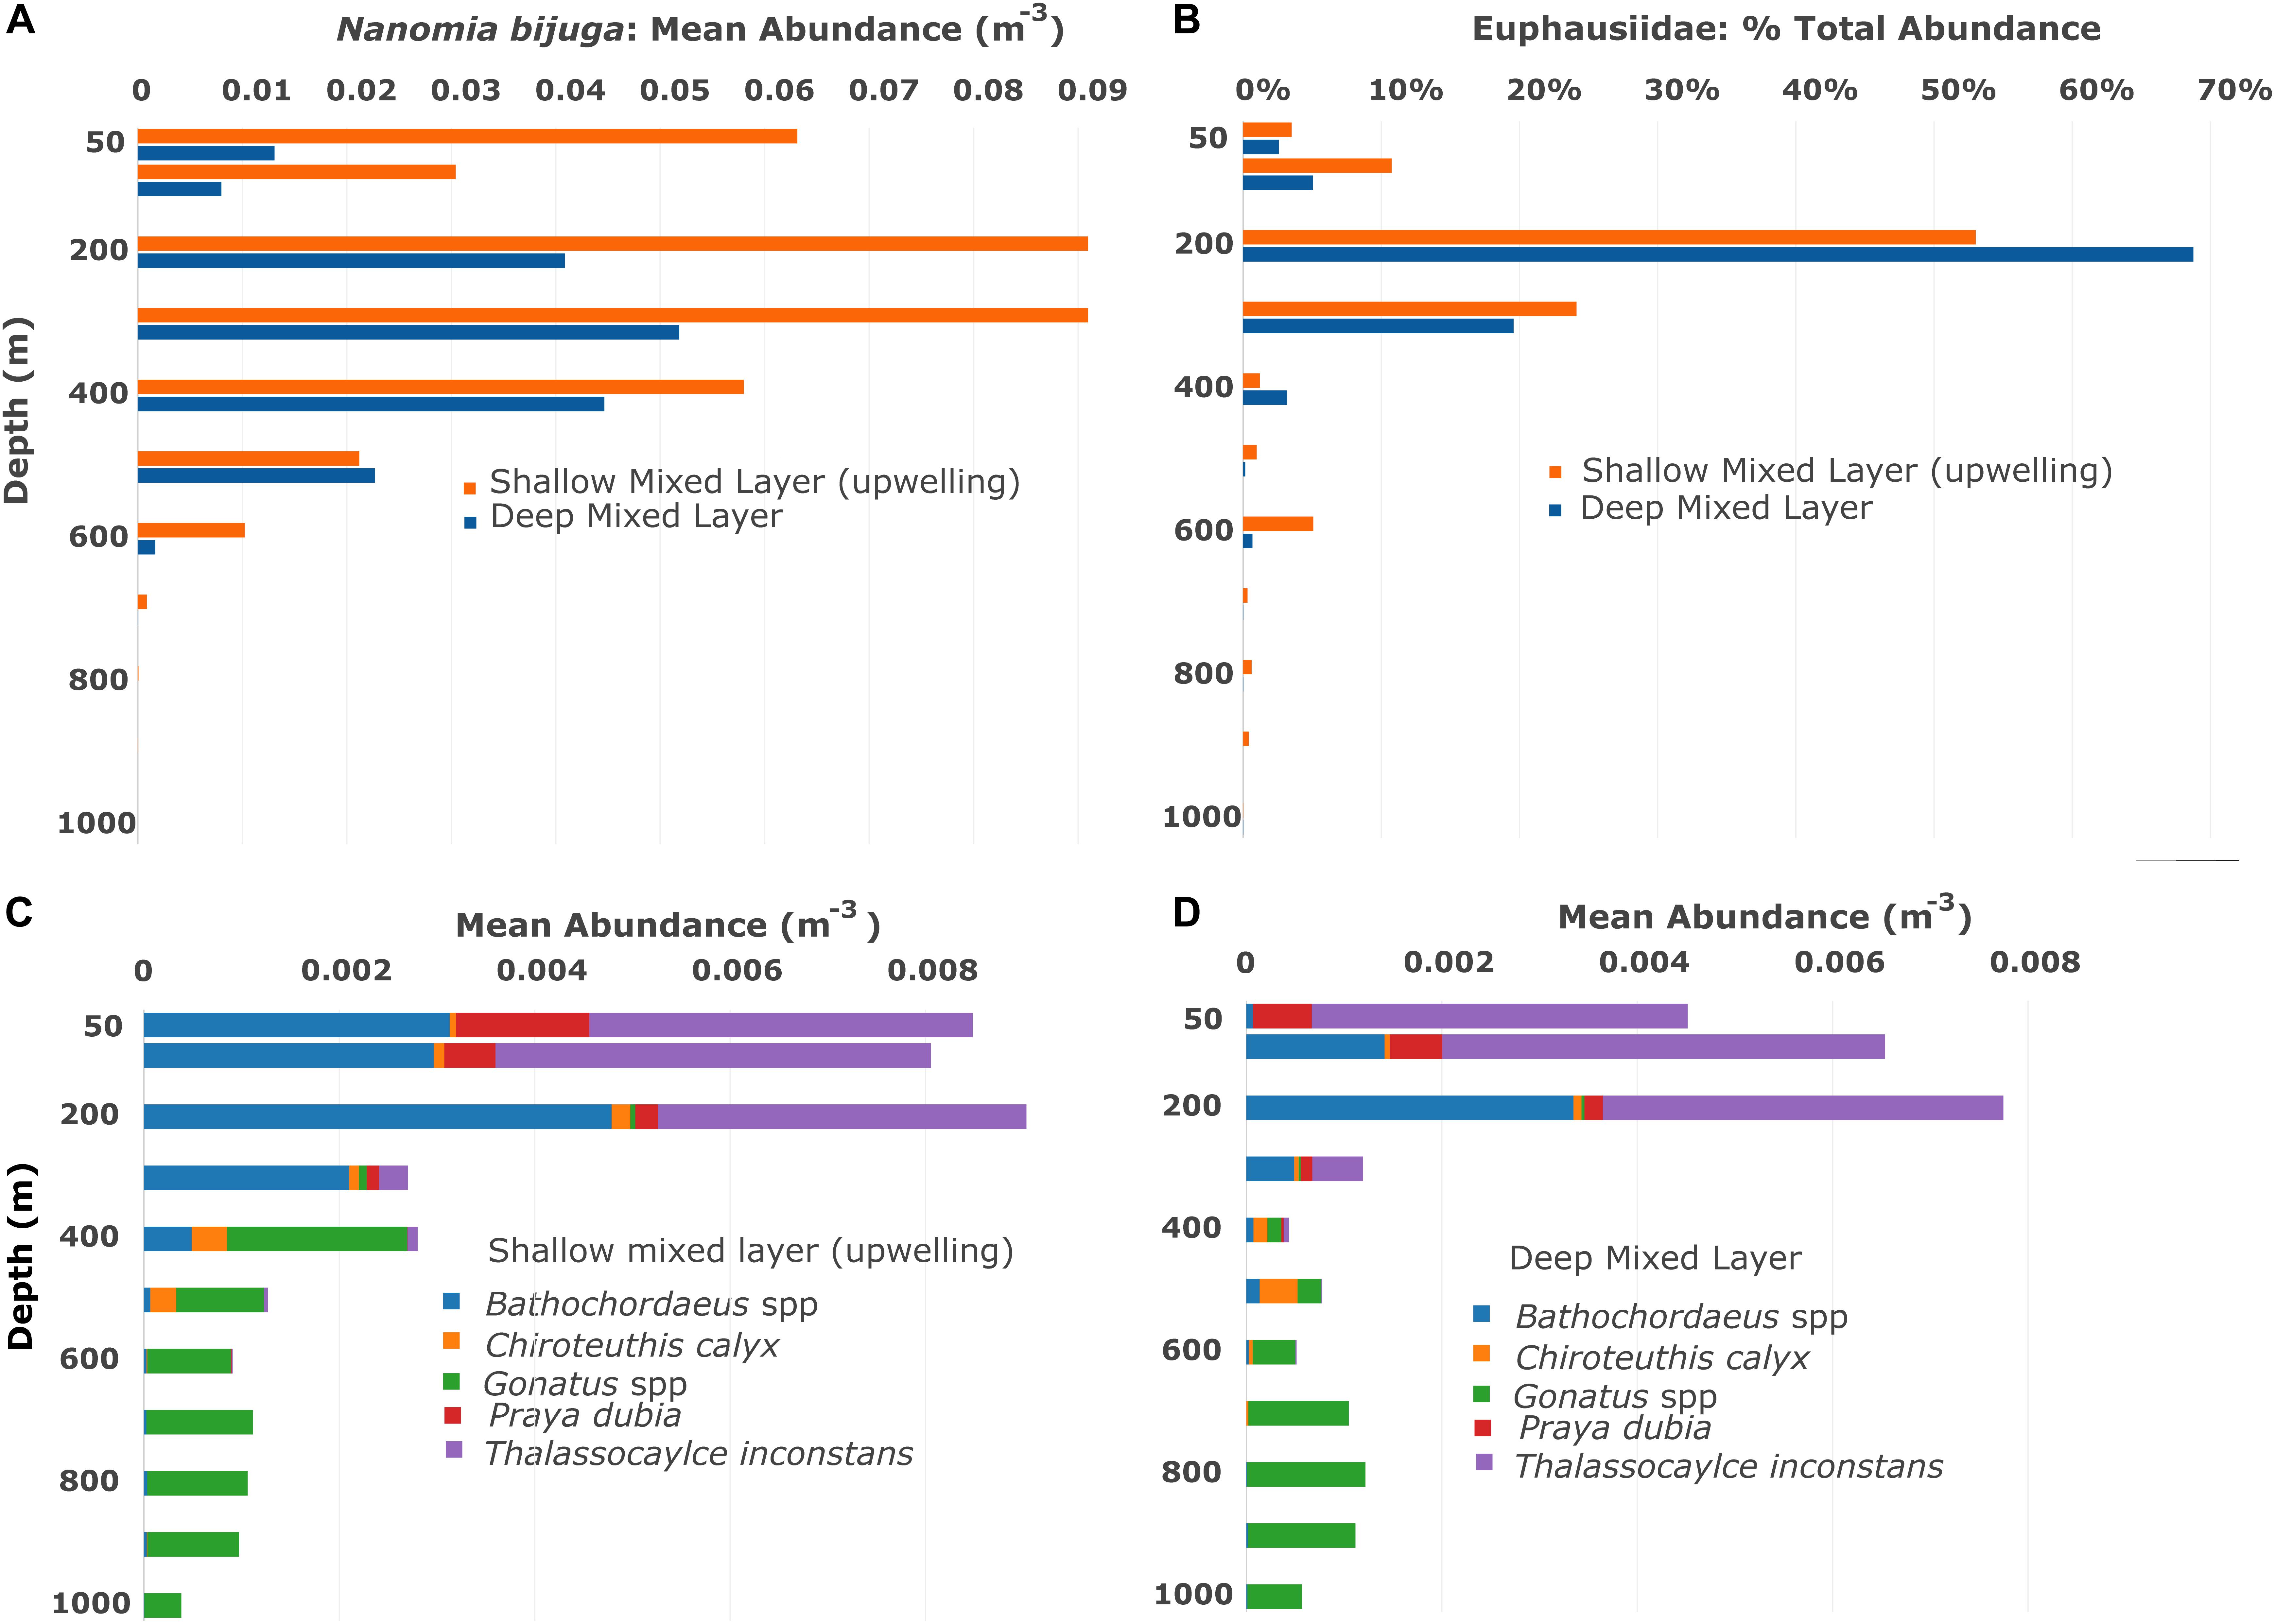
Figure 2. Vertical and seasonal distributions based on the Midwater Time Series, from 1997–2015 for (A) the siphonophore Nanomia bijuga, (B) euphausiid krill, (C,D) giant larvaceans Bathochordaeus spp., the squids Chiroteuthis calyx and Gonatus spp., the siphonophore Praya dubia and the lobate ctenophore Thalassocalyce inconstans. The mixed layer of nutrients is shallow when upwelling is occurring and deeper when it is not, thus seasonality in Monterey Bay is broadly defined here by mixed layer depth. Mean abundances indicate that many mesopelagic animals are more abundant when the mixed layer is shallow and upwelling is occurring. Note that krill are expressed in percent abundance because quantifying each euphausiid on video is not always possible.
There are several important assumptions made using this initial approach: predators are randomly spaced with respect to prey and to each other, prey travel in a straight, vertical path through the water column, there is no predator avoidance by prey, and predators are always ready to capture prey (i.e. negligible time is spent handling prey or relocating). Because at least some of the predators (e.g. N. bijuga and Chiroteuthis calyx) migrate with their prey, the prey stands a chance of encountering the same individual predator more than once – a factor not included in our estimates.
Estimates of a predator’s CSA were based on one or all of the following: (1) lab measurements (squids), (2) ROV video (Bathochordaeus spp., siphonophores and ctenophores) and laser measurements (Katija et al., 2017, Bathochordaeus spp., see Figure 3), and (3) published data. Because siphonophores are contractile, even an individual colony’s size will vary with behavior, thus making size a difficult parameter to quantify precisely. However, as an adult colony, Nanomia bijuga ranges from approximately 10 to 30 cm long. When these siphonophores deploy their tentacles to “fish” for prey, they typically form a J-shaped posture with their tentilla stretching into the water column around them, approximating a circle from the perspective of vertically migrating prey like a euphausiid (Figure 1). Based on the variability of adult size, a conservative estimate for the radius, r, of this circle of tentacular influence is approximately 5 cm (0.05 m), and the CSA = π ∗ r2.
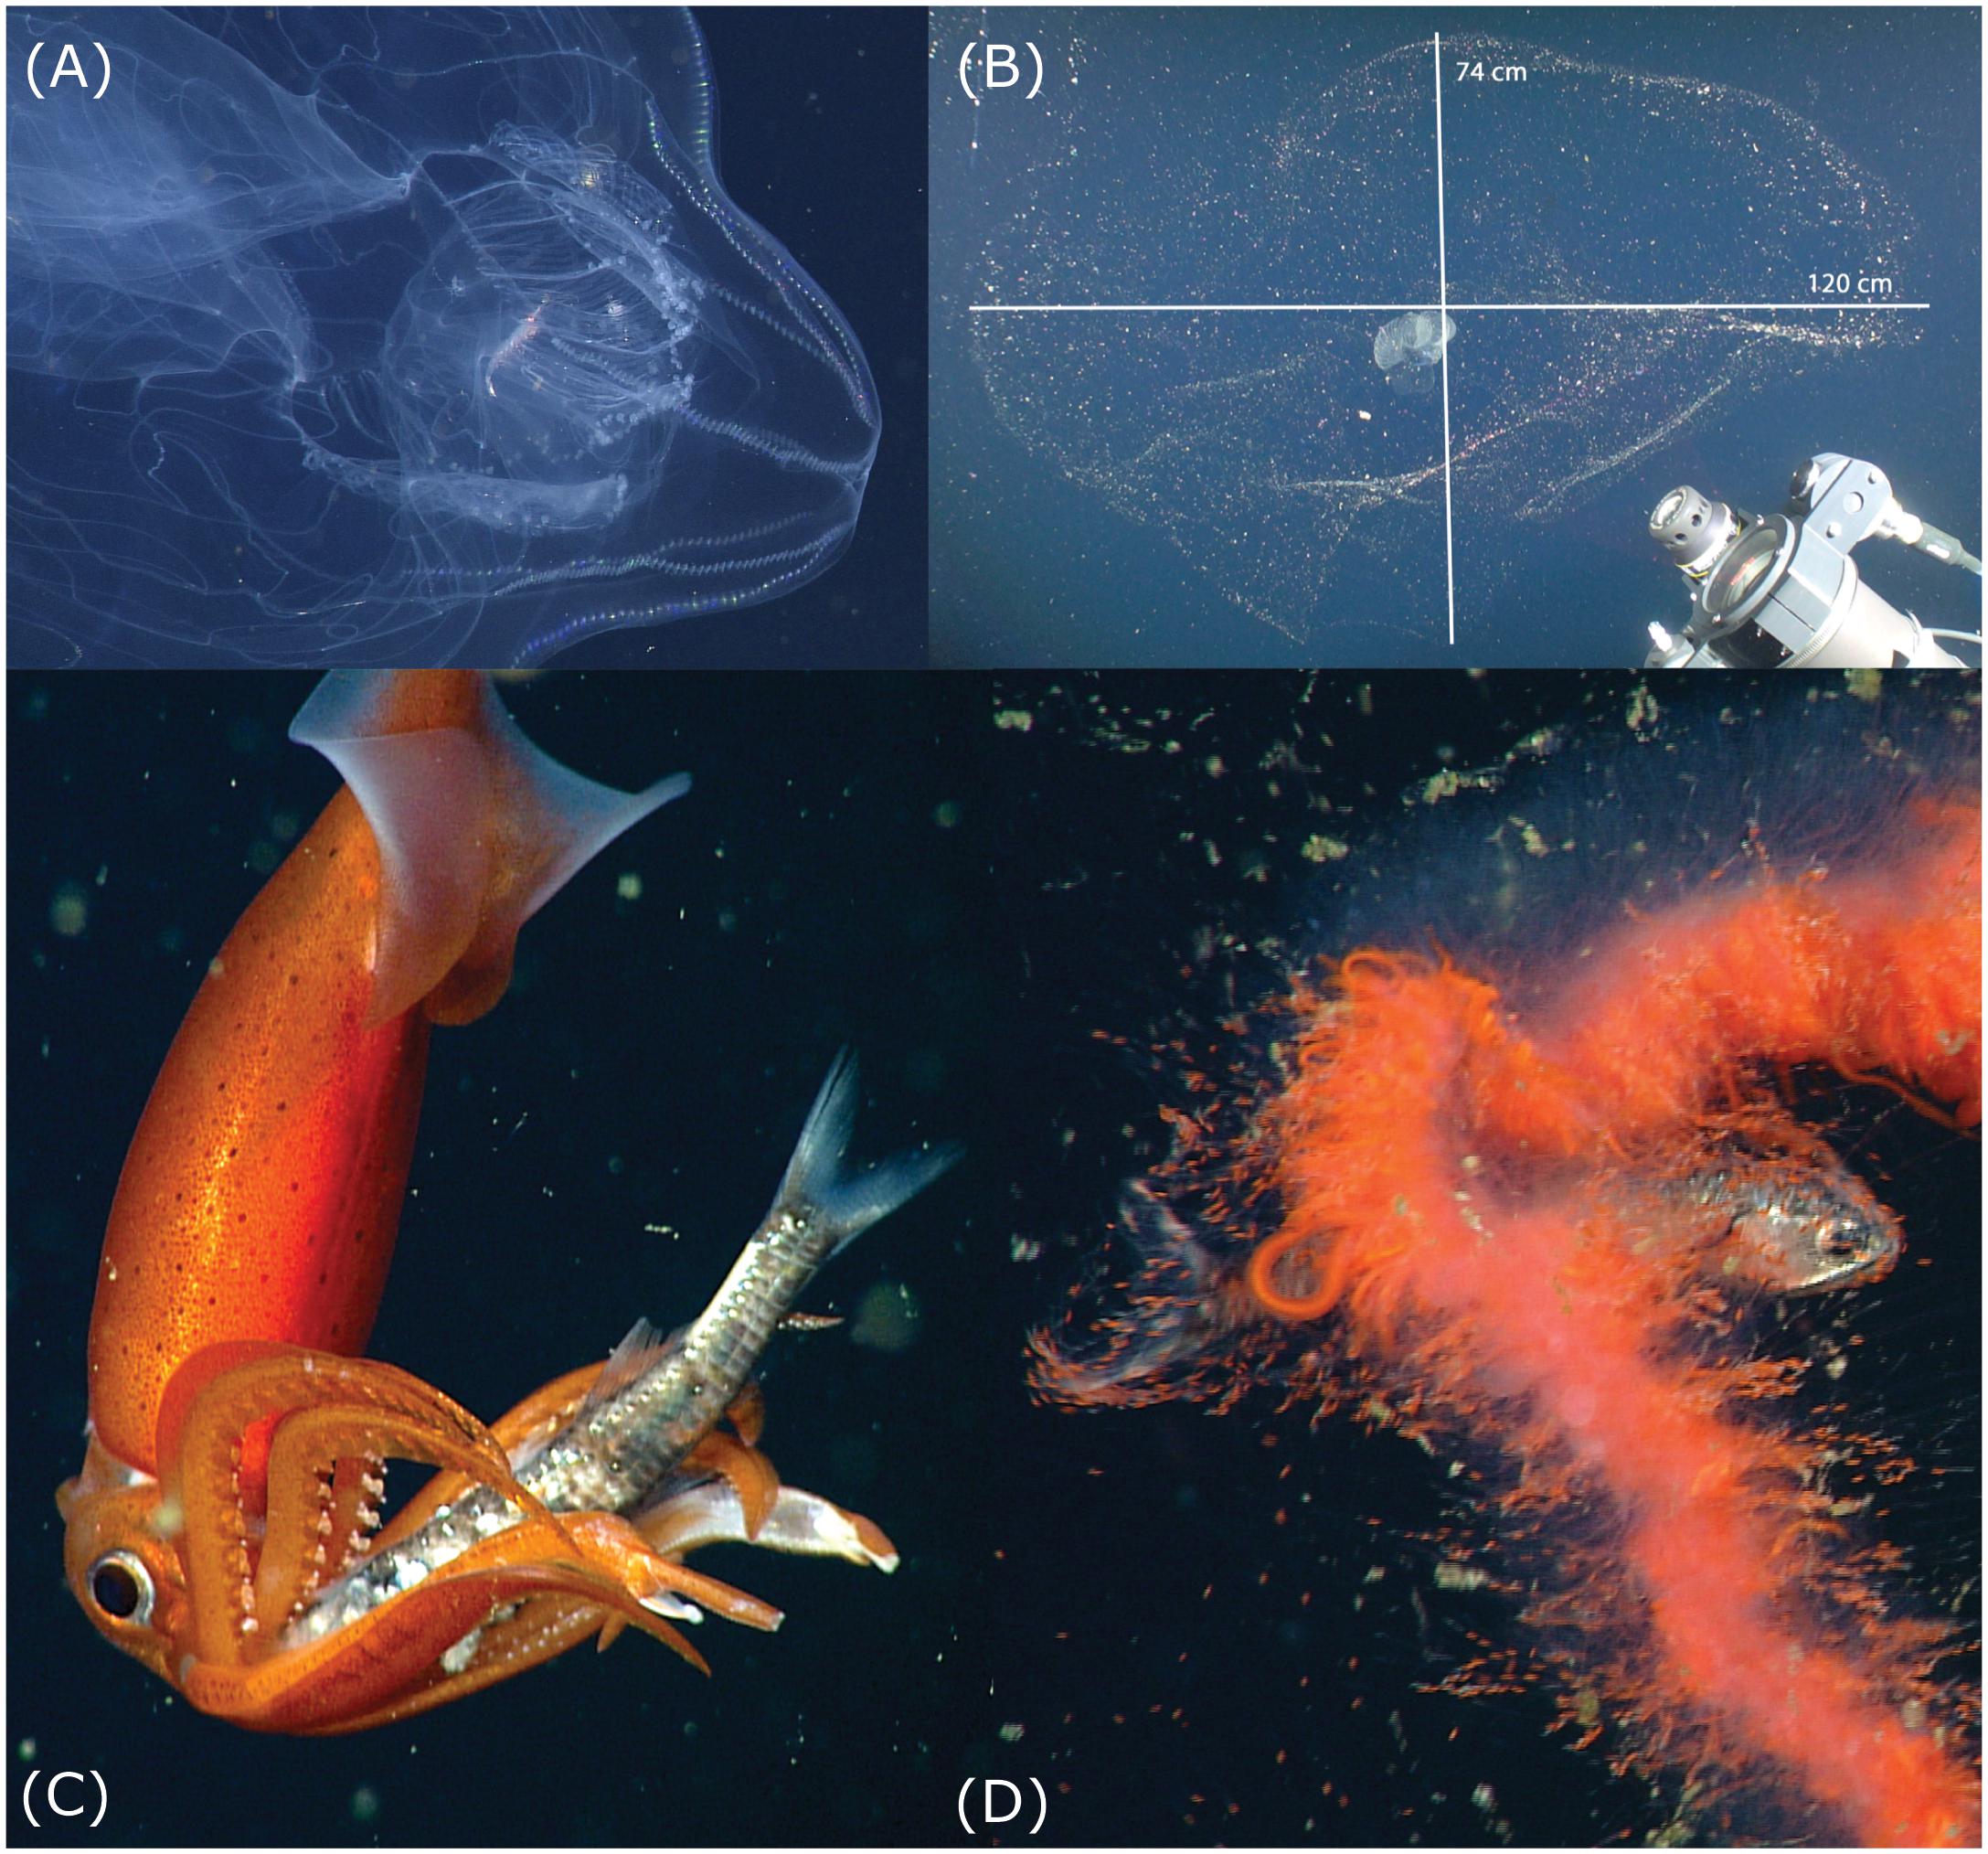
Figure 3. Potential threats to vertical migrators. Note that the images are not at the same scale. (A) The ctenophore Thalassocalyce has trapped a euphausiid krill within its lobes and is slowly transporting the prey using ciliary action, toward its mouth. This predator uses its transparent lobes to intercept vertically migrating prey. (B) The mucus “house” of the giant larvacean Bathochordaeus stygius, which can present an obstacle for vertically migrating zooplankton and micronekton, often spans >1 m in greatest dimension. The outer structure is a coarse-mesh filter and the inner portion is a fine-mesh filter within which the animal sits. When the filters become clogged, the larvacean discards them and extrudes another house. Precise measurements of structures too large and fragile to collect can be made with Deep-PIV (Katija et al., 2017) seen in the lower right corner. (C) The squid Gonatus onyx is holding a myctophid fish, Stenobrachius leucopsarus, with its arms, after catching it with long feeding tentacles. The squid disables the fish, using its beak to sever the spinal cord. (D) This undescribed, orange, physonect siphonophore has captured a myctophid fish, S. leucopsarus, with its tentacles and is maneuvering the prey into a gastrozooid (stomach). Access to additional data on these and other predators and prey is available through the MBARI Deep-Sea Guide: http://dsg.mbari.org/dsg/home.
With its lobes outstretched, the ctenophore Thalassocalyce inconstans (Figure 3A) forms a roughly circular threat that can span in excess of 30 cm in diameter. However, to estimate their threat potential a diameter of 15 cm was chosen because Thalassocalyce are observed in a range of sizes over depth and season. The cross section of water occupied by the tentacles of longer siphonophores, like Praya dubia, which typically stretch out in the horizontal plane, can be approximated using an elliptical shape: π ∗ a ∗ b, with a and b equal to the major and minor radii of the ellipse. Although P. dubia commonly reach lengths in excess of 30 m (Robison, 2004), we adopted 15 m as a conservative measure for the length of the colony and 1.0 m for the horizontal extent of the tentacles. The houses of giant larvaceans like Bathochordaeus spp. are similarly elliptical in cross section and can exceed a meter in longest dimension (Figure 3B). The threat potential of Bathochordaeus spp. was calculated based on a house 1 m in length by 0.3 m width.
The depth range of the vertically migrating prey must also be considered. In the midwater time series, the majority of euphausiids in Monterey Bay are found in the top 300 m of the water column while the daytime distribution of N. bijuga commonly extends down to 500 m (Figures 2A,B). Predators occurring below the prey’s depth range pose no threat.
The squids, C. calyx and Gonatus spp. feed on fishes, and by day most mesopelagic fish occur in the 400–600 m transects. When calculating the threat potential to the fishes by these squid, transect data from 50 to 600 m were used (Figures 2C,D). Gonatus spp. are fast-swimming predators of fishes and of each other (Hoving and Robison, 2016), with an estimated sphere of influence approximately 1.0 m in diameter. Chiroteuthis fishes for its prey with long, dangling feeding tentacles that have bioluminescent photophores to attract prey from a distance. The threat potential of Chiroteuthis was estimated to be double that of Gonatus, or 2.0 m.
Results
What follows is a series of accounts depicting interactions between some vertically migrating prey and some of their predators. Each synopsis is based on direct observations made from undersea vehicles, in situ, primarily in Monterey Bay.
Prey and Predator Profiles
Krill and Nanomia
Krill in Monterey Bay consist chiefly of two euphausiid species: Euphausia pacifica and Thysanoessa spinifera. They occur at depths principally between 100 and 300 m during the day (Figures 2A,B) and they migrate to shallower depths at night. Euphausiids are keystone forage for a broad range of predators from whales and birds to fish, squid, and jellies. Krill abundance and the composition of the euphausiid community can vary seasonally and episodically but they are a consistent presence year-round (Marinovic et al., 2002) with about 90% occurring within the top 300 m irrespective of mixed-layer depth (Figures 2A,B). While krill occasionally form dense swarms, we most often see them separated from each other by centimeter- to meter-scale distances. Their appearance during transects run within their depth range is usually patchy.
Nanomia bijuga is a small (10–30 cm) physonect siphonophore and a principal predator of krill in Monterey Bay. These siphonophores capture krill with nematocyst batteries at the ends of retractile tentacles based near the openings of a dozen or so gastrozooids (stomachs) arranged in a linear chain. Typically N. bijuga has 6–12 swimming bells (the nectosome), a gas-filled pneumatophore, and 20–30 siphosome elements, the portion of the colony behind the propulsive units. Most Nanomia migrate in concert with their krill prey and form a prominent constituent of the local sonic scattering layer (Barham, 1963). Nanomia itself is preyed upon by the abundant, non-migratory narcomedusae Solmissus incisa and S. marshalli (Raskoff, 2002), which broadly overlap Nanomia’s entire depth range.
Nanomia shows stereotypical behavior during prey capture and handling. It typically positions itself in a J-shaped fishing posture with its tentacles splayed outward and its nectosome angled up (Figure 1). When krill contact and struggle against a tentacle, Nanomia begins swimming rapidly, which aligns the body with the trailing tentacle and its captured prey. While swimming, Nanomia contracts the tentacle and the prey is drawn in until it can be grasped by other tentacles and then maneuvered into a nearby gastrozooid. This behavior explains why the posterior gastrozooids are more likely to contain food than those near the nectosome, although we commonly observe Nanomia continuing to “fish” after one or more gastrozooids are already full. After ingestion Nanomia settles again into its feeding posture and relocates every few minutes. These tactics are well-suited for feeding on prey that aggregate in patches (Robison and Connor, 1999; Robison, 2004). However, such movements are not accounted for in our model.
When predators like Nanomia migrate vertically along with their prey, encounter rates will vary based on their respective swimming speeds (Gerritsen and Strickler, 1977; Harvey et al., 2013). If fast-moving prey can outswim their predators, then survival depends on the length of the gauntlet through which they move and not the speed at which they swim. However, since krill swim more slowly than Nanomia, the speed of migration is important and their survival will vary proportionally to it (Anderson et al., 2005). Swimming speeds for these animals may be calculated based on various traits, such as size and life history stage (Torres and Childress, 1983; Dorman et al., 2015), some of which we have documented. However, we do not know how the presence of one affects the swimming behavior of the other. In the laboratory, the gastrozooids of Nanomia elongate and show increased movement in the presence of krill and can readily attach to a stationary krill without assistance from any tentacles. So, Nanomia can clearly sense the presence of nearby krill. While we know how Nanomia fishes, we do not know how often they cast their nets to fish while migrating, nor how that changes in the presence of prey.
Seasonal cycles of local primary production are clearly reflected in the abundance of Nanomia. Upwelling-driven phytoplankton blooms occur during the summer, followed about a month later by large increases in grazer populations. These, in turn, lead to rapid expansion of the Nanomia population, which reaches its maximum abundance approximately 3 months after the onset of seasonal upwelling and 1–2 months after krill numbers are at their peak (Robison et al., 1998).
Threat potential for Nanomia bijuga = 8.1% (SML), 4.4% (DML).
Some Additional Threats to Krill
Thalassocalyce inconstans is a diaphanous and delicate lobate ctenophore that feeds on krill, copepods, and other small zooplankton. It occurs throughout the deep water column of Monterey Bay but is concentrated above 300 m during the day (Figures 2C,D; MBARI Deep-Sea Guide1). Individual T. inconstans are not particularly abundant nor are they known to undertake vertical migrations. In its fishing posture, Thalassocalyce spreads its two lobes broadly into a thin, flattened plane. Small prey, such as copepods, are trapped by a sticky mucus coating on the inner surface of a lobe and are transported to the mouth by cilia (Harbison et al., 1978). Larger prey, like krill, become trapped within a globe-like enclosure formed by rapid contraction of the lobes when they are touched (Swift et al., 2009). Subsequent contractions reduce the size of the enclosed volume and direct the krill toward the ctenophore’s mouth (Figure 3A). Within the enclosed volume krill gently probe the walls of the interior with their antennae, seeking a gap between the lobes that will allow escape (Swift et al., 2009). Additional ctenophores that prey upon krill are the periodically abundant cydippids Hormiphora californiensis and Pleurobrachia bachei, both are sit-and-wait predators that deploy multiple tentilla from each of their two tentacles; each tentillum is tipped with a sticky colloblast for capturing prey. Typically, Hormiphora sits with its tentacles held above the body, while Pleurobrachia holds them below.
Threat potential for Thalassocalyce inconstans = 0.5% (SML), 0.4% (DML).
The calycophoran siphonophore P. dubia can attain lengths of as much as 30–40 m (Robison and Connor, 1999; Robison, 2004), with a thousand or more zooids in its siphosome. Large siphonophores can deploy their tentacles in a curtain that hangs below the chain of zooids along the stem, or they can be spread out radially from the stem like the bristles of a bottle brush. Because they are passive predators, Praya colonies capture whatever encounters their tentacles and cannot swim away, and thus they consume a broad spectrum of zooplankton and micronekton, including krill. Praya typically occupies depths between 50 and 400 m. Two additional elongate siphonophores, the physonects Apolemia uvaria and A. rubriversa, overlap the lower portion of Praya’s depth range (MBARI Deep-Sea Guide) and extend a similar predatory threat down to 950 m.
Threat potential for Praya dubia = 53.9% (SML), 39.2% (DML).
Giant larvaceans of the genus Bathochordaeus do not feed on krill, however, their large mucus houses pose a potential threat to many vertically migrating species by presenting an obstacle that can entangle smaller zooplankters (Figure 3B). Functioning to prevent large detritus particles from clogging the finer mesh of the larvacean’s inner filters, the outer structure can reach dimensions as large as a meter across (Hamner and Robison, 1992). The three species of Bathochordaeus in Monterey Bay (Sherlock et al., 2017) produce new filter houses on a daily basis (Robison et al., 2005). A factor in this timing is likely to be that many of these delicate structures are shredded by the passage of animals like fishes and larger crustaceans during DVM.
Threat potential for Bathochordaeus spp. = 27.6% (SML), 17.1% (DML).
Krill are also consumed by many species, which, like Nanomia, also undertake DVM. These include myctophid fishes, the bathylagid fish Leuroglossus stilbius, and sergestid shrimp.
Myctophids and Squid
Myctophid lanternfish comprise a significant biomass component of the SSL in Monterey Bay and they are regarded as quintessential vertical migrators (Marshall, 1979). Their predators include several species of squid whose prey-capture tactics involve either direct attack (e.g. Gonatus onyx and Dosidicus gigas) or aggressive mimicry using lures (e.g. C. calyx and Grimalditeuthis bonplandi). G. onyx and its congener G. berryi have a wide depth range within the mesopelagic of the study area but they show little evidence of an intrinsic diel vertical migration behavior. Instead, it appears that they remain below the mixed layer and seize myctophids, principally Stenobrachius leucopsarus and Tarletonbeania crenularis, during the myctophids’ vertical migratory runs and at depth during the day (Hoving and Robison, 2016). As is typical of piscivorous squid, once captured, the spinal cord of the myctophid is severed by the squid’s beak and the fish is then manipulated into a head-first position for ingestion (Figure 3C). The two species of Gonatus also exhibit a significant level of cannibalism, feeding on their own species as well as their congeners (Hoving and Robison, 2016). We have observed the large Humboldt squid, D. gigas, on several occasions feeding within aggregations of S. leucopsarus. These squid grab the fish individually with one or both feeding tentacles and transfer the prey to their mouth, while the dexterous arm tips are used for smaller prey.
Threat potential for Gonatus onyx = 19.4% (SML), 3.9% (DML).
Chiroteuthis calyx exhibits a complex behavioral repertoire, especially for an animal that lives perpetually in a habitat of little or no ambient illumination (Burford et al., 2015). The fourth arm on each side of C. calyx is thicker and longer than the other three, and has a groove through which the slender feeding tentacle is deployed. The tentacle slides through the groove then out of the supporting arm to hang suspended below. Serial light organs along the tentacle flash while the tentacle is moved up and down, presumably to attract prey (Robison, 2004). We have observed C. calyx grasping captured myctophids on several occasions. Another squid that lures its prey is Grimalditeuthis bonplandi, which is unique in that the club at the terminus of its feeding tentacle is capable of self-propulsion (Hoving et al., 2013). The actions of the club, which are deployed at the terminus of a very long filamentous tentacle, resemble the movements of a small swimming animal and are believed to be employed in attracting the squid’s prey.
Threat potential for Chiroteuthis calyx = 18.0% (SML), 3.9% (DML).
We have not calculated threat potentials for D. gigas or G. bonplandi because in the former case, their presence in Monterey Bay is episodic (Field et al., 2007; Zeidberg and Robison, 2007) and for the latter species our observations are much too rare.
Some Additional Threats to Myctophids and Other Micronekton, Not Quantified
Threats to vertically migrating myctophids include both sit-and-wait predators as well as wide-ranging, highly mobile forms. Medusae and siphonophores comprise the bulk of the passive gelatinous piscivores and both utilize toxin-injecting nematocyst batteries to catch and immobilize their prey. We typically see smaller myctophids caught by medusae like Periphylla periphylla, while larger fishes seem more likely to be seized by siphonophore colonies. Many of these cnidarians have red or orange pigmentation (Figure 3D) which selectively absorbs blue light – the principal wavelengths available at these depths. This renders the predators essentially invisible. With siphonophores, the diel danger to a myctophid is a dense, unseen cloud of fine tentacles deployed in the path of its migration.
For many highly mobile predators of vertically migratory micronektonic fishes, depth changes made during periods of DVM do not appear to be an intrinsic pattern. Fast-moving fishes like Pacific hake, Merluccius productus, actively pursue myctophids, often in schools, and we see them near the surface during daytime as well as at night. Stomiid dragonfish, like Tactostoma macropus, Idiacanthus antrostomus, and Chauliodus macouni, are solitary hunters with broad vertical ranges. As is the case with the squid C. calyx, dragonfish appear to use bioluminescent lures to bait their prey.
Discussion
It is becoming clear that the DVM of most deep-sea zooplankton and nekton are driven by the selective advantage of avoiding visually cued predation in near-surface waters during the hours of daylight (Bollens et al., 1992; Childress, 1995; Robison, 2003). It is equally apparent that there is a diverse aggregation of predators who lie in wait for the migrators during their daily travels through the water column. Analyzing and assessing these predator/prey interactions is one of the goals of MBARI’s ROV-based Midwater Ecology Program (Choy et al., 2017; Robison et al., 2017).
In the present case, threat potential is an assessment of the inherent risk of confronting a potential predator or obstacle during diel vertical migration. The calculations of threat potential derived here are based on average numbers of predators measured during hundreds of transecting dives between 1997 and 2015. During that time span we also recorded many variations of environmental conditions, differences in relative abundance within predator and prey populations, as well as changes in the composition of the midwater community overall. Dynamic variables are rife in the deep pelagic habitat and they occur on day-to-day time scales, seasonally, episodically, and in patterns we cannot yet resolve or link to any particular explanation. Despite the vagaries imposed by such variability, one great value of a multi-decadal time series is that consistent and repeating patterns emerge during analysis which can reveal some of the fundamental ecological characteristics of the animals that comprise these vast communities (Robison et al., 2005; Zeidberg and Robison, 2007; Burford et al., 2015).
The threats we have enumerated here are only a fraction of the full range of predatory challenges that confront diel vertical migrators, who regularly face a wide array of predatory strategies, tactics, and mechanisms. Collectively, these risks would make the odds of successful migration seem very small. However, high threat potentials are unlikely to result in equally high rates of mortality for vertically migrating prey. Indeed, vertical migration occurs in large part to avoid predation (Bollens et al., 1992). Vertical migrators have many ways to mitigate the threats, including mimicry (Robison, 1999; Burford et al., 2015), bioluminescence (Case et al., 1977; Widder, 2010), schooling or swarming (Hamner et al., 1983), and finely tuned sensory systems (Frank, 2017); overall, displaying a variety of behavioral responses to environmental conditions as well as to encounters with other species (Bollens and Frost, 1991; Visser and Thygesen, 2003).
Given the multitude of predators that lie in wait for individual vertical migrators, the threat potentials we have calculated would seem to be overwhelming but clearly, the prey populations persist. Other factors that reduce the likelihood of predation impact reaching calculated threat potential include: handling time (e.g. squid cannot gulp down a meal directly as most fishes can, instead with typical prey, they must secure, immobilize, and then chop their food into bite-size chunks with their beaks); partial tentacle deployment (e.g. Nanomia seldom appear with all of their tentacles fully extended, thus effectively reducing their CSA); satiation (e.g. many predators with obviously full guts are quiescent, apparently not in active feeding mode); prey manipulation (Thalassocalyce cannot use its lobes to capture additional prey when they are being used to enclose and direct prey toward the mouth); relocation (many ambush predators, like small siphonophores, change their location when feeding in one spot is not productive).
The threat potentials calculated here provide a metric for comparison of risk for migrators beyond other measures such as predator abundance or biomass. For example, Nanomia bijuga is typically more abundant than P. dubia by several orders of magnitude (Figures 2A,C,D), yet the threat to migrators posed by P. dubia on average (53.9%) is comparable to that of N. bijuga at the highest daytime densities we have observed (up to 1.4/m3 which equates to threat potential of 46.1%).
One key difference between the direct, in situ approach used here for studying DVM ecology, and the traditional, indirect approach is that nets and acoustics grossly underestimate the great abundance and diversity of gelatinous predators (Haddock, 2004; Robison, 2004; Choy et al., 2017). The advent of undersea vehicles as research platforms in midwater has revealed not only the predatory roles of medusae, ctenophores, and siphonophores in DVM dynamics, but also their very broad depth distribution through the deep oceanic water column (Robison et al., 2010).
A second advantage conferred by HOVs and ROVs is the ability to document behavior. In situ observations have revealed the behavior patterns of many predators, both hard-bodied and gelatinous. Understanding a predator’s behavior provides a new dimension for quantifying and predicting their impact on prey populations. Likewise, learning the avoidance tactics of prey species will help us to anticipate the effects of shifting predator populations in the face of unbridled exploitation. Looking forward, the advent of autonomous vehicles is providing extended dive time for day/night comparisons of DVM (Reisenbichler et al., 2016) and promises to expand the scope of in situ investigations to mesoscale levels. These perspectives will become increasingly important as we strive to understand and measure (and consider exploiting) DVM, an enormous energy-exchange process in the changing global ocean.
Data Availability Statement
The datasets generated for this study are available on request to the corresponding author.
Author Contributions
BR formulated the study. RS and PM managed the data extraction and manipulation. PM is responsible for modeling threat potential in Mathematica. BR, KR, and RS contributed to data collection and in situ observations. All authors contributed to writing the manuscript.
Funding
This work was supported by the David and Lucile Packard Foundation.
Conflict of Interest
The authors declare that the research was conducted in the absence of any commercial or financial relationships that could be construed as a potential conflict of interest.
Acknowledgments
We are grateful to Daniel Davis for his insights and guidance in developing the mathematics presented here. Joost Daniels and Kakani Katija provided images and measurements from Deep-PIV. We thank the crews of MBARI’s R/Vs Point Lobos, Rachel Carson, and Western Flyer, and the pilots of our ROVs Ventana, Tiburon, and Doc Ricketts. The three reviewers added to the clarity of the manuscript.
Footnotes
References
Anderson, J. J., Gurarie, E., and Zabel, R. W. (2005). Mean free-path length theory of predator-prey interactions: application to juvenile salmon migration. Ecol. Modell. 186, 196–211. doi: 10.1016/j.ecolmodel.2005.01.014
Archibald, K. M., Siegel, D. A., and Doney, S. C. (2019). Modeling the impact of zooplankton diel vertical migration on the carbon export flux of the biological pump. Global Biogeochem. Cycles 33, 181–199. doi: 10.1029/2018gb005983
Barham, E. G. (1957). The Ecology of Sonic Scattering Layers in Monterey Bay. Ph.D. thesis, Stanford University, Palo Alto, CA.
Barham, E. G. (1963). Siphonophores and the deep scattering layer. Science 140, 826–828. doi: 10.1126/science.140.3568.826
Barham, E. G. (1966). Deep scattering layer migration and composition: observations from a diving saucer. Science 151, 1399–1403. doi: 10.1126/science.151.3716.1399
Bolin, R. L., and Abbott, D. P. (1963). Studies on the marine climate and phytoplankton of the central coast area of California, 1954–1960. Calif. Coop. Fish. Invest. Rep. 9, 23–45.
Bolin, R. L., and Hopkins Marine Station, (1964). Hydrographic Data From the Area of the Monterey Submarine Canyon, 1951-1955: Final Report, July 30, 1964. Pacific Grove. California: Stanford University.
Bollens, S. M., and Frost, B. W. (1991). Diel vertical migration in zooplankton: rapid individual response to predators. J. Plankton Res. 13, 1359–1365. doi: 10.1093/plankt/13.6.1359
Bollens, S. M., Frost, B. W., Thoreson, D. S., and Watts, S. J. (1992). Diel vertical migration in zooplankton: a field test of the predator avoidance hypothesis. Hydrobiologia 234, 33–39. doi: 10.1007/bf00010777
Burford, B. P., Robison, B. H., and Sherlock, R. E. (2015). Behaviour and mimicry in the juvenile and subadult life stages of the mesopelagic squid Chiroteuthis calyx. J. Mar. Biol. Assoc. U.K. 95, 1221–1235. doi: 10.1017/S0025315414001763
Case, J. F., Warner, J., Barnes, A. T., and Lowenstine, M. (1977). Bioluminescence of lantern fish (Myctophidae) in response to changes in light intensity [34]. Nature 265, 179–181. doi: 10.1038/265179
Childress, J. J. (1995). Are there physiological and biochemical adaptations of metabolism in deep-sea animals? Trends Ecol. Evol. 10, 30–36. doi: 10.1016/S0169-5347(00)88957-0
Choy, C. A., Haddock, S. H. D., and Robison, B. H. (2017). Deep pelagic food web structure as revealed by in situ feeding observations. Proc. Biol. Sci. 284:20172116. doi: 10.1098/rspb.2017.2116
Curran, J. (2013). Bolstad2: Bolstad Functions. R Package Version 1.0-28. Available at: https://Cran.R-project.org/package=Bolstad2 (accessed February, 2019).
Davison, P. C., Checkley, D. M., Koslow, J. A., and Barlow, J. (2013). Carbon export mediated by mesopelagic fishes in the northeast Pacific Ocean. Prog. Oceanogr. 116, 14–30. doi: 10.1016/j.pocean.2013.05.013
Dorman, J. G., Sydeman, W. J., Bograd, S. J., and Powell, T. M. (2015). An individual-based model of the krill Euphausia pacifica in the California Current. Prog. Oceanogr. 138, 504–520. doi: 10.1016/j.pocean.2015.02.006
Field, J. C., Baltz, K. E. N., and Walker, W. A. (2007). Range expansion and trophic interactions of the jumbo squid, Dosidicus gigas, in the California Current. CalCOFI Rep. 48, 131–146.
Frank, T. M. (2017). Ontogenetic adaptations in the visual systems of deep-sea crustaceans. Philos. Trans. R. Soc. B Biol. Sci. 372:20160071. doi: 10.1098/rstb.2016.0071
Gerritsen, J., and Strickler, J. R. (1977). Encounter probabilities and community structure in zooplankton: a mathematical model. J. Fish. Res. Bd. Can. 34, 73–82. doi: 10.1139/f77-008
Haddock, S. H. D. (2004). A golden age of gelata: past and future research on planktonic ctenophores and cnidarians. Hydrobiologia 530, 549–556. doi: 10.1007/978-1-4020-2762-8_62
Hamner, W. M., Hamner, P. P., Strand, S. W., and Gilmer, R. W. (1983). Behavior of Antarctic krill, Euphausia superba: chemoreception, feeding, schooling, and molting. Science 220, 433–435. doi: 10.1126/science.220.4595.433
Hamner, W. M., and Robison, B. H. (1992). In situ observations of giant appendicularians in monterey bay. Deep-Sea Res. A 39, 1299–1313. doi: 10.1016/0198-0149(92)90070-A
Hansen, A. N., and Visser, A. W. (2016). Carbon export by vertically migrating zooplankton: an optimal behavior model. Limnol. Oceanogr. 61, 701–710. doi: 10.1002/lno.10249
Harbison, G. R., Madin, L. P., and Swanberg, N. R. (1978). On the natural history and distribution of oceanic ctenophores. Deep Sea Res. 25, 233–256. doi: 10.1016/0146-6291(78)90590-8
Harvey El, L., Jeong, H. J., and Menden-Duer, S. (2013). Avoidance and attraction: chemical cues influence predator-prey interactions of planktonic protists. Limnol.Oceanogr. 58, 1176–1184. doi: 10.4319/lo.2013.58.4.1176
Hoving, H. J. T., and Robison, B. H. (2016). Deep-sea in situ observations of gonatid squid and their prey reveal high occurrence of cannibalism. Deep-Sea Res. I 116, 94–98. doi: 10.1016/j.dsr.2016.08.001
Hoving, H. J. T., Zeidberg, L. D., Benfield, M. C., Bush, S. L., Robison, B. H., and Vecchione, M. (2013). First in situ observations of the deep-sea squid Grimalditeuthis bonplandi reveal unique use of tentacles. Proc. R. Soc. B Biol. Sci. 280:20131463. doi: 10.1098/rspb.2013.1463
Jackson, G. A., Najjar, R. G., and Toggweiler, J. R. (1993). Flux feeding as a mechanism for zooplankton grazing and its implications for vertical particulate flux. Limnol. Oceanogr. 38, 1328–1331. doi: 10.4319/lo.1993.38.6.1328
Katija, K., Sherlock, R. E., Sherman, A. D., and Robison, B. H. (2017). New technology reveals the role of giant larvaceans in oceanic carbon cycling. Sci. Adv. 3, e1602374. doi: 10.1126/sciadv.1602374
Marinovic, B. B., Croll, D. A., Gong, N., Benson, S. R., and Chavez, F. P. (2002). Effects of the 1997-1999 El Niño and La Niña events on zooplankton abundance and euphausiid community composition within the Monterey Bay coastal upwelling system. Prog. Oceanogr. 54, 265–277. doi: 10.1016/S0079-6611(02)00053-8
Ohman, M. D., and Romagnan, J.-B. (2016). Nonlinear effects of body size and optical attenuation on diel vertical migration by zooplankton. Limnol. Oceanogr. 61, 765–770. doi: 10.1002/lno.10251
Olivieri, R. A., and Chavez, F. P. (2000). A model of plankton dynamics for the coastal upwelling system of Monterey Bay. California. Deep-Sea Res. II 47, 1077–1106. doi: 10.1016/S09670645(99)00137-X
Pennington, T. J., and Chavez, F. P. (2000). Seasonal fluctuations of temperature, salinity, nitrate, chlorophyll and primary production at station H3/M1 over 1989–1996 in Monterey Bay. California. Deep-Sea Res. II Top. Stud. Oceanogr. 47, 947–973. doi: 10.1016/S0967-0645(99)00132-0
R Core Team, (2013). R: A Language and Environment for Statistical Computing. Vienna: R Foundation for Statistical Computing. doi: 10.1016/s0967-0645(99)00132-0
Raskoff, K. A. (2002). Foraging, prey capture, and gut contents of the mesopelagic narcomedusa Solmissus spp. (Cnidaria: Hydrozoa). Mar. Biol. 141, 1099–1107. doi: 10.1007/s00227-002-0912-8
Reisenbichler, K. R., Chaffey, M. R., Cazenave, F. C., McEwen, R. S., Henthorn, R. H., Sherlock, R. E., et al. (2016). “Automating MBARI’s midwater time-series video surveys: the transition from ROV to AUV,” in OCEANS 2016 MTS/IEEE Monterey (Monterey, CA: IEEE).
Robinson, C., Steinberg, D. K., Anderson, T. R., Arístegui, J., Carlson, C. A., Frost, J. R., et al. (2010). Mesopelagic zone ecology and biogeochemistry - a synthesis. Deep-Sea Res. II 57, 1504–1518. doi: 10.1016/j.dsr2.2010.02.018
Robison, B. H. (1999). Shape change behavior by mesopelagic animals. Mar. Freshw. Behav. Physiol. 32, 17–25. doi: 10.1080/10236249909379034
Robison, B. H. (2003). What drives the diel vertical migrations of Antarctic midwater fish? J. Mar. Biol. Assoc. U.K. 83, 639–642. doi: 10.1017/S0025315403007586h
Robison, B. H. (2004). Deep pelagic biology. J. Exp. Mar. Bio. Ecol. 300, 253–272. doi: 10.1016/j.jembe.2004.01.012
Robison, B. H., and Connor, J. (1999). The Deep Sea. Monterey B. Monterey, CA: Monterey Bay Aquarium Press.
Robison, B. H., Reisenbichler, K. R., and Sherlock, R. E. (2017). The coevolution of midwater research and ROV technology at MBARI. Oceanography 30, 26–37. doi: 10.5670/oceanog.2017.421
Robison, B. H., Reisenbichler, K. R., Sherlock, R. E., Silguero, J. M. B., and Chavez, F. P. (1998). Seasonal abundance of the siphonophore. Nanomia bijuga, in Monterey Bay. Deep-Sea Res. II 45, 1741–1751. doi: 10.1016/S0967-0645(98)80015-5
Robison, B. H., Sherlock, R. E., and Reisenbichler, K. R. (2010). The bathypelagic community of Monterey Canyon. Deep-Sea Res. II 57, 1551–1556. doi: 10.1016/j.dsr2.2010.02.021
Robison, B. H. H., Reisenbichler, K. R., and Sherlock, R. E. (2005). Giant larvacean houses: rapid carbon transport to the deep sea floor. Science 308, 1609–1611. doi: 10.1126/science.1109104
Schlining, B. M., and Stout, N. J. (2006). MBARI’s Video Annotation and Reference System. in OCEANS 2006. IEEE Computer Society, doi: 10.1109/OCEANS.2006.306879
Sherlock, R. E., Walz, K. R., Schlining, K. L., and Robison, B. H. (2017). Morphology, ecology, and molecular biology of a new species of giant larvacean in the eastern North Pacific: Bathochordaeus mcnutti sp. nov. Mar. Biol. 164:20. doi: 10.1007/s00227-016-3046-0
Silguero, J. M. B., and Robison, B. H. (2000). Seasonal abundance and vertical distribution of mesopelagic calycophoran siphonophores in Monterey Bay, CA. J. Plankt. Res. 22, 1139–1153. doi: 10.1093/plankt/22.6.1139
Skogsberg, T. (1936). Hydrography of Monterey Bay, California. Thermal conditions, 1929-1933. Trans. Am. Philos. Soc. 29, i–152.
Skogsberg, T., and Phelps, A. (1946). Hydrography of Monterey Bay, California. Thermal Conditions, Part II (1934-1937). Proc. Am. Philos. Soc. 90, 350–386.
Steinberg, D. K., and Landry, M. R. (2017). Zooplankton and the ocean carbon cycle. Ann Rev Mar Sci 9, 413–444. doi: 10.1146/annurev-marine-010814-015924
Swift, H. F., Hamner, W. M., Robison, B. H., and Madin, L. P. (2009). Feeding behavior of the ctenophore Thalassocalyce inconstans: Revision of anatomy of the order Thalassocalycida. Mar. Biol. 156, 1049–1056. doi: 10.1007/s00227-009-1149-6
Torres, J. J., and Childress, J. J. (1983). Relationship of oxygen consumption to swimming speed in Euphausia pacifica. Mar. Biol. 74, 79–86. doi: 10.1007/bf00394278
Visser, A. W., and Thygesen, U. H. (2003). Random motility of plankton: diffusive and aggregative contributions. J. Plankton Res. 25, 1157–1168. doi: 10.1093/plankt/25.9.1157
Widder, E. A. (2010). Bioluminescence in the ocean. Science 328, 704–708. doi: 10.1126/science.1174269
Keywords: vertical migration, mesopelagic, predators, prey, ROV
Citation: Robison BH, Sherlock RE, Reisenbichler KR and McGill PR (2020) Running the Gauntlet: Assessing the Threats to Vertical Migrators. Front. Mar. Sci. 7:64. doi: 10.3389/fmars.2020.00064
Received: 29 March 2019; Accepted: 28 January 2020;
Published: 14 February 2020.
Edited by:
Amy Elizabeth Maas, Bermuda Institute of Ocean Sciences, BermudaReviewed by:
Michael R. Stukel, Florida State University, United StatesRudi Schuech, University of Lincoln, United Kingdom
Copyright © 2020 Robison, Sherlock, Reisenbichler and McGill. This is an open-access article distributed under the terms of the Creative Commons Attribution License (CC BY). The use, distribution or reproduction in other forums is permitted, provided the original author(s) and the copyright owner(s) are credited and that the original publication in this journal is cited, in accordance with accepted academic practice. No use, distribution or reproduction is permitted which does not comply with these terms.
*Correspondence: Bruce H. Robison, cm9ickBtYmFyaS5vcmc=