 Marié E. Smith
 Stewart Bernard
95% of researchers rate our articles as excellent or good
Learn more about the work of our research integrity team to safeguard the quality of each article we publish.
Find out more
ORIGINAL RESEARCH article
Front. Mar. Sci. , 14 February 2020
Sec. Ocean Observation
Volume 7 - 2020 | https://doi.org/10.3389/fmars.2020.00061
This article is part of the Research Topic Remote Sensing for Aquaculture View all 8 articles
The aquaculture industry of southern Africa faces environmental threats from harmful algal blooms (HABs), which have the potential to cause devastating economic losses (Pitcher et al., 2019). Satellite earth observation offers a systematic and cost effective method for operational monitoring of HABs over large areas. Whilst the chlorophyll-a concentration ([Chl-a]) product, often used as a proxy for phytoplankton biomass, can be used to indicate high biomass blooms (elevated biomass against a background signal of 5–10 mgChl m−3), there is a clear need for value-added products that not only alert on bloom presence, but also on the bloom type and persistence. This study demonstrates the identification of different phytoplankton communities that can feasibly be identified in bloom concentrations from space, relevant to the aquaculture industry of South Africa. In terms of water-leaving reflectance, 76 % of the variance in the red and NIR spectral region is significantly positively correlated to phytoplankton abundance, [Chl-a], and the maximum line height (MLH) (defined as the height of the maximum reflectance peak above a baseline between 665 and 753 nm). The MLH is related to dominant phytoplankton types derived from phytoplankton count data, in order to identify thresholds which represent blooms that pose a high hypoxia and/or toxicity risk; whilst 0.0016 < MLH < 0.003 represent low to moderate concern mixed assemblage blooms, MLH > 0.003 has a strong likelihood of indicating high biomass dinoflagellate or Pseudo-nitzschia blooms. These techniques are routinely used by the aquaculture industry in South Africa for decision support and risk mitigation. The high biomass nature of the South African regional waters provide strong assemblage-related spectral variability, which can be exploited with the spectral bands of OLCI and MERIS. Application to these sensors not only ensures future monitoring capability, but also allows the creation of a historical risk climatology that can guide the site selection of industries sensitive to the presence of HABs, such as aquaculture facilities and desalination plants.
Aquaculture is a burgeoning industry in South Africa and plays a vital role in the country's blue economy. The marine aquaculture sector centers around mussel Mytilus galloprovincialis, Pacific oyster Crassostrea gigas and abalone Haliotis midae farming (DAFF, 2017), with most facilities situated along the west coast in close proximity to the productive Benguela current upwelling system.
Most mussel and oyster farms utilize in-water culture methods such as rafts and cages (DAFF, 2017) located in Saldanha Bay (Figure 1). Abalone are farmed commercially along the west and southwest coasts of the country, with the majority of abalone operations situated near Walker Bay; the most common production methods utilize land-based flow-through systems (Urban-Econ Development Economists, 2018) which necessitates a close proximity to the ocean to allow large volumes of sea-water to be pumped up to the farm for optimal water exchange, temperature control, and removal of metabolic waste.
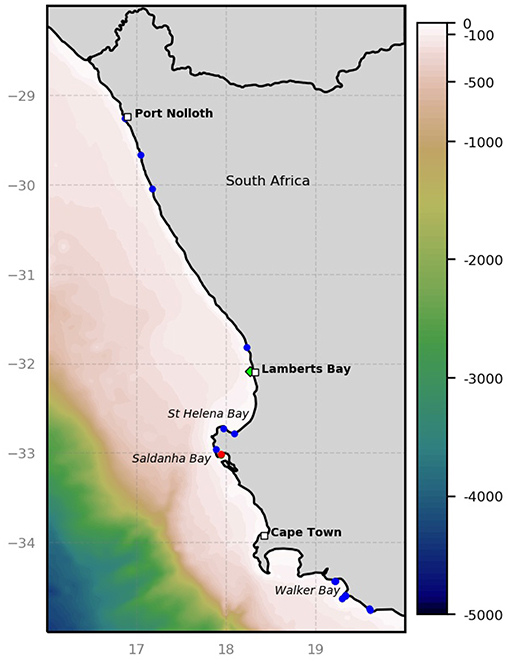
Figure 1. Map showing the west coast aquaculture facilities, with important bays and towns for reference. The location of the sampling station off Lamberts Bay is indicated by a green diamond. Abalone farms are shown as blue dots and mussel farms are shown in red (adapted from DAFF, 2017).
The global marine aquaculture sector faces environmental threats from harmful algal blooms (HABs), with impacts from these events amounting to approximately 8 $billion/yr (Brown et al., 2019). Within the South African aquaculture industry the HAB-related risk factors and mitigation strategies differs within the various sub-sectors. Whilst the herbivorous abalone are at risk of physical damage and paralysis attributed to some dinoflagellate species (e.g., Pitcher et al., 2019), the filter-feeders (i.e., mussels and oysters) are vulnerable to growth arrest (Pitcher and Calder, 2000) and the accumulation of biotoxins which affects their safety of consumption and can cause poisoning syndromes in humans. On a larger environmental scale, some non-toxic dinoflagellate blooms can result in marine mortalities and anoxia following the collapse of blooms with very high biomass (e.g., Ndhlovu et al., 2017).
Routine management and risk assessment at aquaculture facilities includes monitoring the flesh of mussels and oysters for specific biotoxins and regular phytoplankton counts of water samples. Counts include total abundance counts and HAB species monitoring focusing on toxic dinoflagellates known to cause paralytic shellfish poisoning (PSP) (e.g., Alexandrium spp.) and diarrhetic shellfish poisoning (DSP) (e.g., Dinophysis spp.), diatoms known to cause amnesic shellfish poisoning (ASP) (e.g., some Pseudo-nitzschia spp.), as well as dinoflagellates known to produce yessotoxins (e.g., Lingulodinium polyedrum).
HABs have the potential to cause devastating economic losses in the aquaculture and fisheries industries. The Saldanha Bay mussel aquaculture industry was first affected in 1994 due to PSP (Pitcher et al., 1994), while the presence of brown tides in 1997–1999 resulted in reduced growth rates of the filter feeding bivalves and 80 % reduction in monthly sales (Probyn et al., 2001); in 2015 farms were closed 13 times due to the presence of bio-toxins in shellfish flesh above acceptable regulatory limits (DAFF, 2017). Dinoflagellate blooms have previously impacted wild and farmed abalone (Pitcher et al., 2001; Botes et al., 2003) in South Africa, even leading to mortalities of wild adult abalone (Horstman et al., 1991); abalone have been known to contain paralytic shellfish toxins following some dinoflagellate blooms (Harwood et al., 2014; Hallegraeff and Bolch, 2016). HABs can also pose a threat to the physical condition of sardines and associated fisheries (Van der Lingen et al., 2016). The decay of high biomass dinoflagellate blooms have often lead to marine mortalities and mass rock-lobster strandings in the St Helena Bay region (e.g., Pitcher et al., 2011, 2014) with losses valued up to 50 million US dollars in some cases (Ndhlovu et al., 2017).
Ocean color remote sensing provides a cost-effective and valuable tool in the detection and monitoring of various types of phytoplankton blooms (see references in Blondeau-Patissier et al., 2014). The most common method, using the concentration of Chlorophyll a ([Chl-a]) as a proxy for biomass, has often been used to define blooms as anomalous [Chl-a] above a pre-determined threshold (e.g., Stumpf et al., 2003). [Chl-a] has traditionally been used to detect phytoplankton blooms and HABs in the southern Benguela (Bernard et al., 2014; Smith and Bernard, 2018) where concentrations in the coastal waters are known to vary from <1 mg m−3 in newly upwelled water (Barlow, 1982) to well over 100 mg m−3 in bloom conditions (Pitcher and Weeks, 2006). Although [Chl-a] is routinely derived from satellite reflectance using regionally optimized algorithms (e.g., Smith and Bernard, 2018), it does not provide direct information about inherent phytoplankton-related risk.
The optical environment off the west coast of South Africa can be described as phytoplankton dominated, with other constituents (e.g., colored dissolved organic matter and suspended inorganic material) contributing relatively little to the water-leaving reflectance signal (Bernard et al., 2009). The blue-green water-leaving reflectance signal generally dominates in low biomass open ocean environments, which is considered to be [Chl-a] <1 mg m−3 in the context of this study. As the phytoplankton biomass increases, the reflectance signal is increasingly affected by a combination of the peaks of Chl-a absorption near 465 and 665 nm, the Chl-a fluorescence peak near 685 nm, as well as increased phytoplankton-related backscattering and the absorption of water; these effects result in the shift of the dominant reflectance signal to the red-NIR spectral region at Chlorophyll a concentrations ([Chl-a]) of approximately >15 mg m−3 (Robertson Lain et al., 2014).
It should be noted that the term “bloom” and “HAB” should be considered within a specific ecological and environmental context; some HABs can be toxic at low biomass or do not manifest as high [Chl-a], and there are generally no set abundance values to define when a HAB species is considered to be a “bloom” (Glibert et al., 2018). When contextualized within the highly productive waters of the southern Benguela, a phytoplankton “bloom” needs to be identifiable against a background biomass signal of approximately [Chl-a] of 5 to 10 mg m−3 (Demarcq et al., 2003); since a variety of different phytoplankton types commonly reach [Chl-a] of 20–50 mg m−3 and above (Bernard et al., 2014), a detection technique focusing on the red/NIR was deemed most appropriate for regional harmful bloom identification.
Spectral band difference algorithms are often used to relate the reflectance peak in the red/NIR to phytoplankton biomass, the most well-known version of which is arguably the fluorescence line height (FLH) (Letelier and Abbott, 1996; Gower et al., 1999); FLH provides a quantification of the height of the Chl-a fluorescence peak above a baseline formed by the Chl-a absorption trough near 665 and a NIR wavelength (usually near 750 nm). Several studies have used a variant of this line height detection method, whether on its own or in combination with other optical properties (e.g., backscattering) or true color imagery, for the detection of HABs in coastal waters using ocean color remote sensing (Gower et al., 2005; Ryan et al., 2008; Matthews et al., 2012; Al Shehhi et al., 2013; Ghanea et al., 2016).
This study aims to relate spectral features of water-leaving reflectance in the red-NIR directly to phytoplankton types of particular concern to the marine aquaculture industry of South Africa. We focus on application to reflectance data from the MEdium Resolution Imaging Spectrometer (MERIS) and the Ocean and Land Colour Imager (OLCI), as both sensors have good spectral covarage in the red-NIR region and high (300 m) spatial resolution. The objective is to determine probabilistic ecosystem-contextualized identifiers for waters dominated by either dinoflagellates or the diatom Pseudo-nitzschia (PN) as these are high risk HAB types that offer distinct ocean color signals.
In situ water samples were collected at a station in St Helena Bay approximately 4 km off of Lambert's bay (32.0845oS 18.2691oE) in late summer (between February and April) of 2004–2008. Chlorophyll a concentration was measured by fluorometric analysis (Holm-Hansen et al., 1965) using 90% acetone with the use of a Turner Designs 10-AU Fluorometer according to accepted protocols (Knap et al., 1996; Mueller et al., 2003). Phytoplankton samples were taken at the surface, fixed in buffered formalin to a concentration of 0.5%, and counted using the Utermöhl method (Hasle, 1978). Count data were grouped into diatoms, dinoflagellates, flagellates, cilliates, and coccolithophores; PN was treated separately, in an attempt to determine unique spectral characteristics. A >50 % abundance threshold was used as the primary simplistic phytoplankton population metric.
In-water radiometric measurements were made with a hyperspectral Tethered Satlantic Radiometric Buoy (TSRB); further details on measurements, processing, and uncertainties can be found in Smith and Bernard (2018). The in situ radiometric data (N = 68) were resampled to MERIS/OLCI wavelength bands centered at 665, 681.25, 708.75, and 753.75 nm.
A line height (or spectral band difference) algorithm, similar to the fluorescence line height (Gower et al., 1999), with a baseline formed by the water-leaving reflectance (ρw) between 665 and 753 nm was applied to all spectra. In the case of the hyperspectral in situ data the remote sensing reflectance (Rrs) were converted to ρw by multiplying spectra by π (Antoine and Morel, 2005) prior to application of the line height algorithms. The line heights at both 681 (LH681) and 709 nm (LH709) were calculated as follows:
The maximum line height (MLH) was calculated as follows:
The reflectance peak at 681 nm is generally associated with Chl-a fluorescence emission; however, at higher biomass this peak shifts to longer wavelengths due to the combined effects of increased phytoplankton absorption and backscattering, as well as pure water absorption. The ratio of LH709 to LH681, also known as the line height ratio (LHR) (Tao et al., 2011), provides an indication of this red shift, and was calculated as follows:
Principal component analysis (PCA) was applied as an exploratory data analysis step in order to assess the variance structure within the dataset. This analysis technique reduces the dimensionality of a dataset by breaking it down into a set of geometrically independent (orthogonal) modes of oscillation which represent all the variability in the data (Craig et al., 2012). PCA was performed on the resampled and standardized (i.e., removing the mean and scaling to unit variance) reflectance data using eigenvalue decomposition of the data covariance matrix. The scores of the first three principal components (modes) of variance were use in correlation analysis with the following variables: [Chl-a], MLH, LHR, the percentage compositions by abundance of diatoms, PN, dinoflagellates, flagellates, cilliates, coccolithophores, and the total cell counts for each sample. The authors note that although PN is a diatom it was assessed separately in an attempt to find an unique identification criteria given that is the only potentially toxic diatom genus appearing in the Benguela.
Satellite data from the Ocean and Land Colour Imager (OLCI) on board Sentinel-3A (processing baseline 2.23; IPF version 06.11) were obtained from the Copernicus online data access website (https://coda.eumetsat.int/) while data from the 3rd reprocessing for the Medium Resolution Imaging Spectrometer (MERIS) were obtained from the MERIS catalog and inventory (MERCI) website. In the case of both sensors the bright pixel (atmospheric) correction (Moore and Lavender, 2011) is universally applied over the coastal waters of the southern Benguela. The water-leaving reflectance (ρw) from the Level 2 data files were used in all calculations. The flags that were applied to maintain the quality of the data during the phytoplankton type detection algorithm application to MERIS data included “CLOUD,” “LAND,” uncorrected sun glint (“HIGLINT”), and reflectance confidence flags (“PCD1_13”); for OLCI data these included land and cloud flags (“LAND,” “CLOUD,” “CLOUD_AMBIGUOUS,” “CLOUD_MARGIN”) missing, invalid or transmission errors (“INVALID,” “SUSPECT,” and “COSMETIC”), suspect atmospheric correction and saturated pixels (“AC_FAIL,” “SATURATED”), and unreliable sun glint correction flags (“RISKGLINT”).
The first three principal components accounted for 98.8 % of the total variance in the red-NIR region of the remote sensing reflectance (Rrs) dataset (Figure 2). The first mode, which accounts for 76% of the total variance within the dataset, represents an amplitude effect with a significant positive correlation to MLH, total cell count, [Chl-a] and LHR; this indicates that the biomass drives the magnitude of the Rrs spectra in the red-NIR. The second mode indicates significant yet opposing spectral responses between Rrs(665) and Rrs(709) to variations in [Chl-a], LHR, MLH, and total cell counts. Mode two also had a significant positive correlation to the percentage coccolithophores in the sample; the highly scattering nature of these cells tend to increase the magnitude of the reflectance in the green, which in turn can partially mask some of the Chl-a absorption near 665 nm. The third mode, although contributing to a relatively small percentage of the total variance, is significantly negatively and positively related to the percentage composition of PN and dinoflagellates respectively; increases in the percentage of PN and dinoflagellates in water samples respectively are associated with increases in the LH681 and LH709, respectively, indicating a potential approach for the optical distinction of these two phytoplankton types.
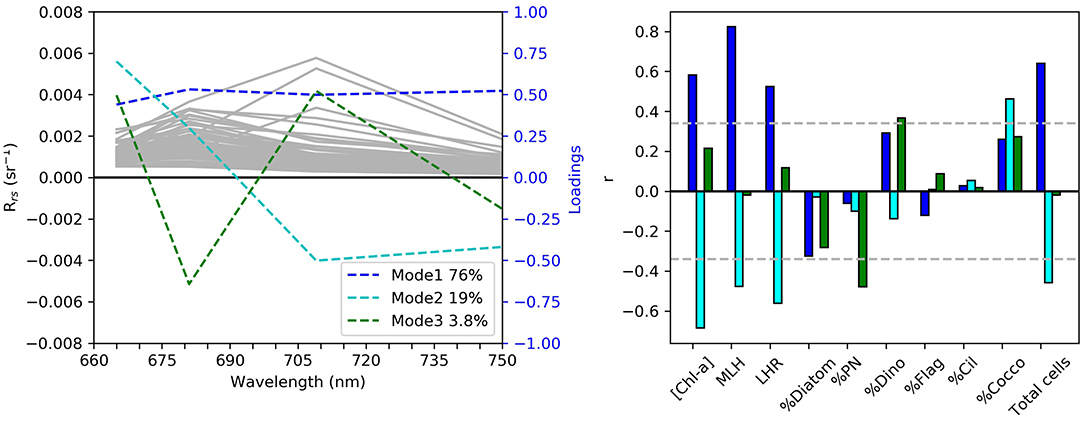
Figure 2. Results from the principal component analysis of the in situ reflectance between 665 and 754 nm (N = 68). In the left panel the gray lines indicate individual Rrs samples, while the colored lines show the loadings of the top three modes of variability in the Rrs dataset. In the right panel the bars are color-coded according to the corresponding modes of variance to show the correlation with [Chl-a], maximum line height, line height ratio, percentage composition of diatoms, Pseudo-nitzschia, dinoflagellates, flagellates, cilliates, and coccolithophores, as well as the total cell counts per sample. The gray horizontal lines indicate the 95 % significance level.
Figure 3 shows the statistics of the MLH, LHR, and [Chl-a] associated with the dominance (i.e., >50 %) of diatoms, PN, and dinoflagellates respectively; only samples with total cell concentration over 106 cells L−1 were included in order to capture scenarios of likely phytoplankton bloom conditions. As the sample sizes were quite small, the Kruskal-Wallis H Test was used to compare the distributions of the three samples (diatom, PN, and dinoflagellates) for each variable (MLH, LHR, and [Chl-a]); this test found no significant differences between any of the samples. Bloom conditions dominated by diatoms tend to have a MLH < 0.0038; thus there is a high probability that conditions with MLH > 0.0038 is either PN or dinoflagellate dominated. For all three phytoplankton types approximately 75 % of the bloom samples had MLH > 0.0019; this was chosen as the lower threshold for mixed bloom conditions. Approximately half of the PN and 25 % of the diatom bloom samples had a MLH > 0.0027; this was chosen as the lower threshold for mixed bloom conditions that have a slightly higher potential for harm. All bloom conditions dominated by diatoms and PN displayed a LHR under 0.6; thus it is very likely that LHR > 0.6 would be dinoflagellate dominated. Similarly, valid samples of blooms dominated by either PN or other diatoms had maximum [Chl-a] under approximately 30 mg m−3. Therefore, it is very likely that a bloom with [Chl-a]>30 mg m−3 is dinoflagellate dominated; Bernard et al. (2014) also defined the lower end of the probabilistic range of dinoflagellate dominance as [Chl-a] above 30 mg m−3. It should be noted that dinoflagellate dominance is entirely possible at lower [Chl-a] and/or LHR < 0.6, but would most likely be associated with low total cell concentrations and related risk.
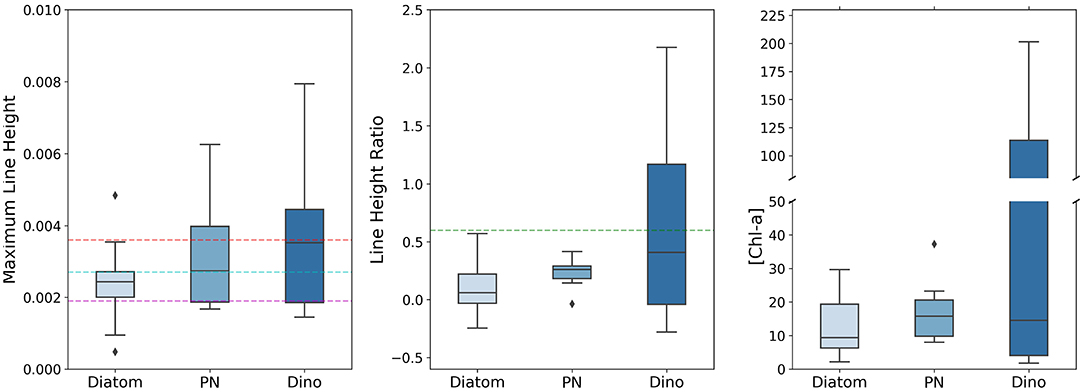
Figure 3. Boxplots of the MLH, LHR, and [Chl-a] for samples with total cell concentration over 106 cells L−1. Each column represents the statistics associated with the dominance (i.e., >50 % composition as relative abundance to the total cell count) of a given phytoplankton type, i.e., diatoms, Pseudo-nitzschia, and dinoflagellates. The horizontal lines of the boxes represent the 25th, 50th (median), and 75th percentiles, whereas the whiskers represent the valid minimum and maximum; outliers are indicated as diamonds. The colored dashed horizontal lines indicate the thresholds used in the initial probabilistic phytoplankton community classification.
Some of the key values indicated above are used as baseline thresholds for a reflectance classification framework to determining phytoplankton types, which is presented in Table 2. An LHR > 0.6 is used as a probabilistic dinoflagellate identifier, while the MLH of 0.0019, 0.0027, and 0.0038 is used to represent increasing likelihood and potential severity of either dinoflagellates or PN blooms. Figure 4 shows the total cell counts and [Chl-a] that roughly corresponds to these in situ MLH thresholds; when using the regression lines of these figures there is a 63 % chance that a MLH of 0.0038 relates to total cell counts of approximately 6.4 million cells L−1, and a 70% chance of it relating to [Chl-a] of approximately 23 mg m−3. A small sample (N = 19) of coincident MERIS reflectance data were available to enable the comparison of satellite-derived MLH to in situ total cell counts and [Chl-a] (Figure 5); the coefficient of determination decreased from 0.63 to 0.52 for total cell counts, but increased from 0.70 to 0.74 for [Chl-a]. The thresholds for MLH were adjusted using the [Chl-a] associated with the original threshold values in Figure 3 and the new regression equation between satellite MLH and in situ [Chl-a]; the adjusted thresholds are shown in bold in Table 2, and are used for all satellite image classification.
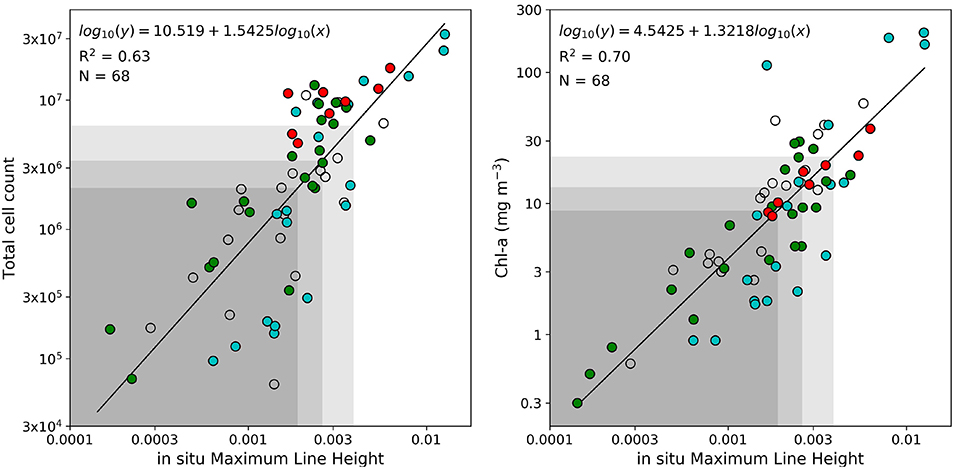
Figure 4. Linear regression analysis between maximum line height and total cell counts (left) and between maximum line height and [Chl-a] (right); all data were log-transformed before analysis. The black line represents the regression line with the corresponding equation, coefficient of determination (R2) and the sample size (N). Samples with more than 50% Pseudo-nitzschia, diatoms, or dinoflagellates are shown in red, green, and blue, respectively. The shaded areas represent cell counts and [Chl-a] associated with MLH below 0.0019, 0.0027, and 0.0038, respectively.
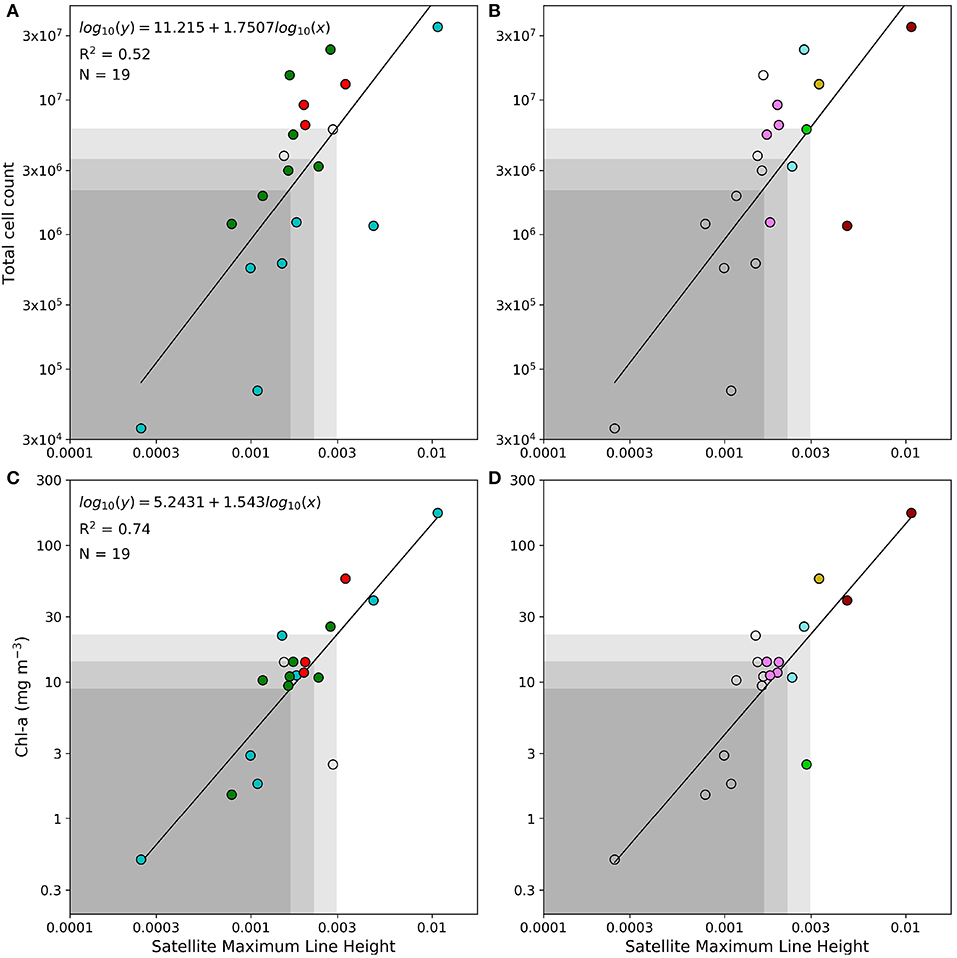
Figure 5. (A–D) Linear regression analysis between maximum line height and in situ total cell counts (top) and between maximum line height and [Chl-a] (bottom); all data were log-transformed before analysis. The black line represents the regression line with the corresponding equation, coefficient of determination (R2) and the sample size (N). The shaded areas represent cell counts and [Chl-a] associated with MLH below 0.0016, 0.0022, and 0.003, respectively. Samples with more than 50% Pseudo-nitzschia, diatoms, or dinoflagellates are shown in red, green, and blue, respectively in the left panels. Right-hand panels show the classification of these samples using the satellite derived MLH and LHR. Please refer to Table 2 for a detailed color key.
Assessing the performance of algorithms designed to classify satellite data into discrete groups can be challenging, particularly when sample sizes are small, and often requires indicators other than the standard metrics (e.g., bias, RMSD) used for ocean color product validation (Melin et al., 2019); in these cases confusion/contingency/error matrices can be more useful (e.g., Carvalho et al., 2011; Wang and Hu, 2017). In the present study the performance of the satellite classification algorithm was assessed (in terms of correctly identifying pixels as either “bloom” or “non-bloom”) using Figure 5D as a reference; three confusion matrices (depicted in Table 1) were created to represent classification results of samples with in situ [Chl-a] above approximately 8.9, 14.2, and 22.1 mg m−3, corresponding to MLH above the thresholds of 0.0016, 0.0022, and 0.003, respectively. Note that for the purpose of this assessment it is assumed that all samples above the specified [Chl-a] are true “blooms”. The classification accuracy is lowest (64%) at the low [Chl-a], with the satellite-derived classification indicating some false negatives; classification accuracy increases with increasing [Chl-a], with the highest accuracy obtained at [Chl-a] > 22.1 mg m−3. These results are based on very small sample sizes and are only used to provide an indication of the classification algorithm's operational limits.
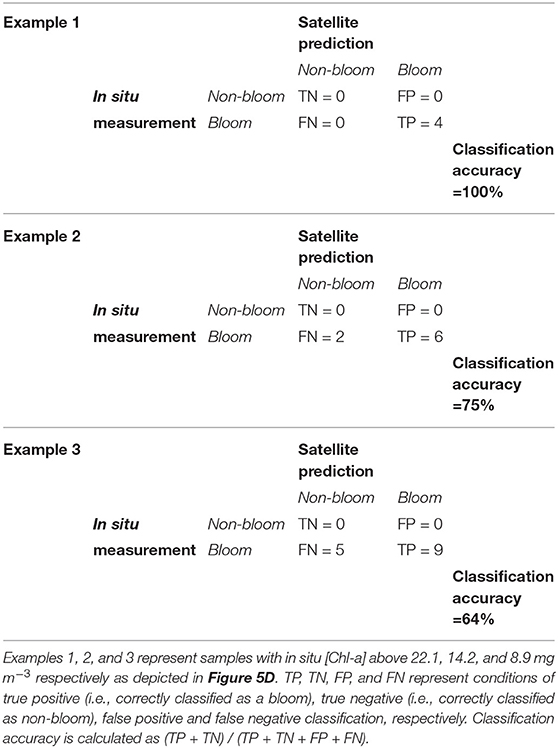
Table 1. Confusion matrices describing the performance of the satellite classification model in terms of correctly identifying satellite-derived pixels as either “bloom” or “non-bloom.”
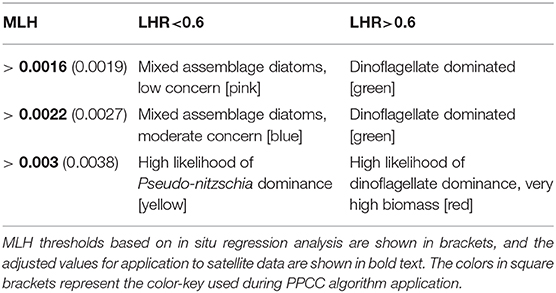
Table 2. The framework for probabilistic phytoplankton community classification (PPCC), based on thresholds of maximum line height (MLH) and line height ratio (LHR).
Several studies have noted that the line height algorithms operating in the red/NIR can be affected by high concentrations of suspended sediment or atmospheric dust, producing apparent reflectance peaks in this spectral region (e.g., Zhao et al., 2015) or masking the reflectance peak signal (e.g., McKee et al., 2007; Gilerson et al., 2008). For the purposes of this study the area under the baseline of the MLH, i.e., the integral of the water-leaving reflectance values between the 665 and 753 nm wavebands, was used as a quality control measure for highly scattering (possibly inorganic) substances. The maximum MLH baseline integral of both the in situ and satellite-derived reflectance datasets was 0.5; thus for satellite application the classification algorithm was not applied to pixels where the integral was > 0.5 (i.e., these pixels are displayed as unclassified).
The southern Benguela is a wind-driven, pulsed upwelling system forced by equatorward winds from the south Atlantic high pressure system, and modulated by low-pressure systems moving eastwards past the southern tip of Africa; these conditions supports elevated phytoplankton biomass over the wide continental shelf (Verheye et al., 2016) dominated by primarily large celled diatoms (Hutchings et al., 2012) that thrive in the nutrient-rich turbulent environment of upwelling systems (Sathyendranath et al., 2014). Succession within the system generally follows known conceptual frameworks (Margalef, 1987) where diatoms dominate during turbulent upwelling phases, followed by a shift to dinoflagellate dominance during quiescent periods. A decrease in upwelling-favorable winds toward the end of austral summer (between January and May) are usually associated with more frequent dinoflagellate-dominance in the near-shore waters of the southern Benguela during the latter stages of the upwelling season (Pitcher and Calder, 2000). HABs within the southern Benguela are largely attributable to dinoflagellates (Pitcher and Weeks, 2006). Although the prevalence of PN has been established in both the northern (Louw et al., 2016) and the southern (Fawcett et al., 2007) Benguela, there are no recorded impacts to the aquaculture industry (Pitcher et al., 2014). The type of harm caused by HABs within upwelling systems are diverse, with the impact attributed to organism type, concentrations they occur in, and whether toxins are present (Pitcher et al., 2017).
Whilst HABs were considered to be relatively scarce along the southern coastline of South Africa prior to 1997 (Pitcher and Calder, 2000), several extensive dinoflagellate blooms, some consisting of previously unobserved species, have notably impacted the region in recent years (Pitcher et al., 2014); these events included Gonyaulax polygramma blooms that negatively affected physical condition of the regional sardine stock in 2011 (Van der Lingen et al., 2016), and blooms of Lingulodinium polyedrum impacting hundreds of kilometers along the south coast during 2013/2014 (Pitcher et al., 2014). Most notably for the aquaculture industry was the bloom co-dominated by Lingulodinium polyedrum and Gonyaulax spinifera at the end of 2016 which lead to the mortalities of over 250 tons of farmed abalone by February 2017 (Pitcher et al., 2019).
The occurrence and frequency of HABs are thought to be increasing worldwide, and within the context of a changing climate the global distribution and occurrence of different HAB species are likely to change in the future (Glibert and Burford, 2017). Pitcher et al. (2017) noted the continuously changeable nature of the species that constitute HABs in upwelling systems, and the inherently diverse threats posed to industries and humans relying on these systems. These concepts support the notion that the southern Benguela aquaculture industries requires adaptable and robust HAB monitoring strategies to safeguard the economic viability of these facilities.
There are a multitude of methods to obtain information on phytoplankton functional types from remotely sensed ocean color data (see Sathyendranath et al., 2014), however many of these techniques were designed for oligotrophic and mesotrophic waters and/or operate in the blue-green spectral region. At lower biomass levels the spectral features in the blue-green wavelengths are potentially more useful for distinguish certain HABs from non-harmful blooms and other water types from an ocean color perspective (e.g., Cannizzaro et al., 2008; Kurekin et al., 2014; Tao et al., 2015); particularly the phytoplankton backscaterring-driven signal in the 520–600 nm range has shown potential for phytoplankton functional type applications (Lain and Bernard, 2018). However, at the relatively high concentration of biomass that regularly occurs in the southern Benguela, the largest spectral signal is often found in the red/NIR.
It was shown in Figure 2 that the variability in the red-NIR is largely driven by total phytoplankton biomass, and has the greatest correlation with the MLH. The position of the reflectance peak in the red/NIR, indicated in this study by the LHR, together with the MLH, provides some information on the phytoplankton communities present in the water. Diatoms have developed rapid photo-protective capability in response to the dynamic light levels of a high-mixing upwelling environment, which can manifest as elevated fluorescence (Lavaud et al., 2002); it appears as though PN might have additional spectrally-based advantage linked to its fluorescence quantum yield (Brunet et al., 2014). As a result, also impacted by differences in IOPs, the fluorescence peak remains evident even at relatively high concentrations, meaning that the fluorescence signal (LH681) exceeds the phytoplankton backscattering-related signal (LH709), producing lower LHR values.
For application to the MERIS and OLCI sensors, the traditional FLH utilizes wavebands centered at 665, 681, and 709 nm, while the Maximum Chlorophyll Index (MCI) uses 681, 709, and 753 nm (Gower et al., 2005). This relatively narrow positioning of the baseline and signal bands limits the application of the FLH to low-moderate biomass waters, whereas the MCI only functions in high biomass waters (i.e., [Chl-a] >20 mg m−3 when the red-shift, associated with increasing phytoplankton biomass, produces a discernible reflectance peak in the red/NIR). Zhao et al. (2015) found that using a wide baseline modified FLH provided improved results compared to either the traditional FLH or MCI for qualitatively distinguish HABs from other blooms in the Arabian Gulf. The wide baseline and the dominant peak selection method are similar in functioning to the maximum peak-height (MPH) algorithm (Matthews et al., 2012) and the adaptive reflectance peak height (ARPH) algorithm (Ryan et al., 2014), which are both used in the operational quantification of different phytoplankton populations in eutrophic waters.
The generally weaker positive correlation between total cell counts, dominant phytoplankton types, and the reflectance-based signal in the red-NIR indicates that this relationship is not straight-forward, and that care should be taken when attempting to quantify phytoplankton abundance from remotely sensed information. Although not directly related to probabilistic phytoplankton community information, accurate [Chl-a] can provide a valuable supplementary indication on phytoplankton-related risk.
Both MERIS and OLCI offer good spectral resolution in the red/NIR region as well as high spatial resolution (300 m) which is often necessary at the small spatial scale and near coastal aquaculture applications. With two satellites in orbit (Sentinel 3A and 3B), the OLCI sensor provides near daily coverage. In the generally eutrophic conditions of the southern Benguela it is useful to avoid the blue-green spectral region when using satellite-derived reflectance data, where the uncertainty resulting from aerosol extrapolation can be more extreme than in the red-NIR. The use of thresholds based on line height algorithms and ratios, instead of absolute reflectance values, also mitigates the potential spectral offsets and errors that might result from the atmospheric correction process. MERIS and OLCI utilize the bright pixel correction (Moore and Lavender, 2011) in addition to the standard atmospheric correction, which was universally applied across the satellite images. This atmospheric correction is considered generally appropriate for the southern Benguela (Bernard et al., 2014), as it is capable of adjusting for non-zero reflectance in the NIR.
Although the algorithm was validated with MERIS matchup data, the similar radiometric heritage between sensors means that this classification scheme is applicable to OLCI (example image shown in Figure 7), ensuring utility of this classification technique for the next 20 years, whilst also being application to ten years of archive MERIS data. In the current study we demonstrate the application of the PPCC to MERIS and OLCI images representing two different HAB events.
Yessotoxin producing blooms of Lingulodinium polyedrum and Gonyaulax spinifera impacted the Walker Bay abalone industry in December 2016 to February 2017 (Pitcher et al., 2019). A similar dinoflagellate bloom was recorded in the Walker Bay area during February of 2019, which persisted until May 2019; during the stages of the bloom depicted in Figure 6, cell concentrations of over 2 million cells L−1 (dominated by Gonyaulax spinifera) were measured at some of the aquaculture farm intake pipes (personal communication with farm managers). The probabilistic classification clearly shows the spatial extent and associated patches of this dinoflagellate bloom; the [Chl-a] map shows good spatial coherence with the classification while providing an indication of bloom intensity.
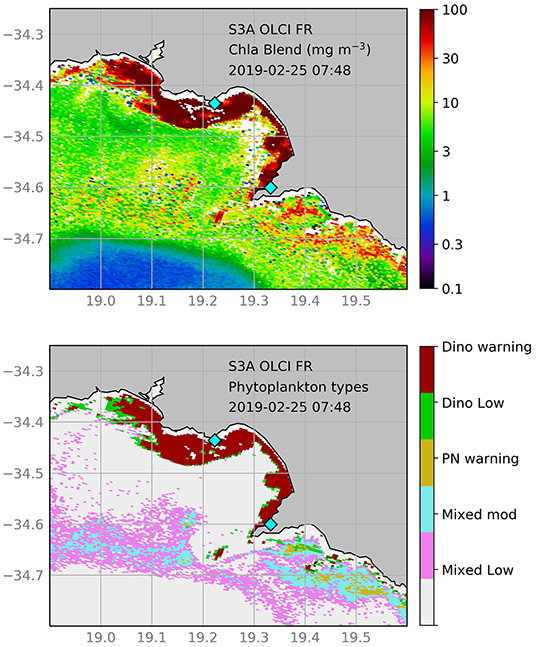
Figure 6. Satellite products derived from full resolution S3A-OLCI for the 25th of February 2019. The top panel shows [Chl-a], whilst the bottom panel shows the probabilistic phytoplankton community classification (PPCC); classes include dinoflagellate (red) and Pseudo-nitzschia (yellow) dominated waters, as well as high (green) and moderate (blue) biomass mixed assemblages. Please refer to Table 2 for a detailed PPCC color key. The locations of two of the primary water intake pipes for abalone farms in the area are indicated by blue diamonds.
The probabilistic classification method was applied to four MERIS images (Figure 7) that coincided with the March 2006 field campaign where a Pseudo-nitzschia bloom was sampled off Lambert's Bay (Fawcett et al., 2007). The PPCC correctly identified the presence of PN at the sampling station on the 12th of March, where [Chl-a] of 57.1 mg m−3 and PN concentrations of 8 million cells L−1 were measured in situ. Although the highest number of PN cells were measured on the 18th of March, the PPCC indicated only a high biomass mixed assemblage; this could potentially be due to the relatively lower in situ [Chl-a] (compared to the 12th of March), producing a poorer optical signal in the red/NIR. Both the 15th and 22nd of March coincided with decreased phytoplankton counts and [Chl-a], which were similarly reflected in the unclassified pixels over the sampling site. It is clear that the highest chance of successful classification is achieved under conditions of the highest biomass (i.e., on the 12th of March). Special precaution is also advised for regions classified as “high biomass mixed assemblages,” as they could likely contain high concentrations of PN.
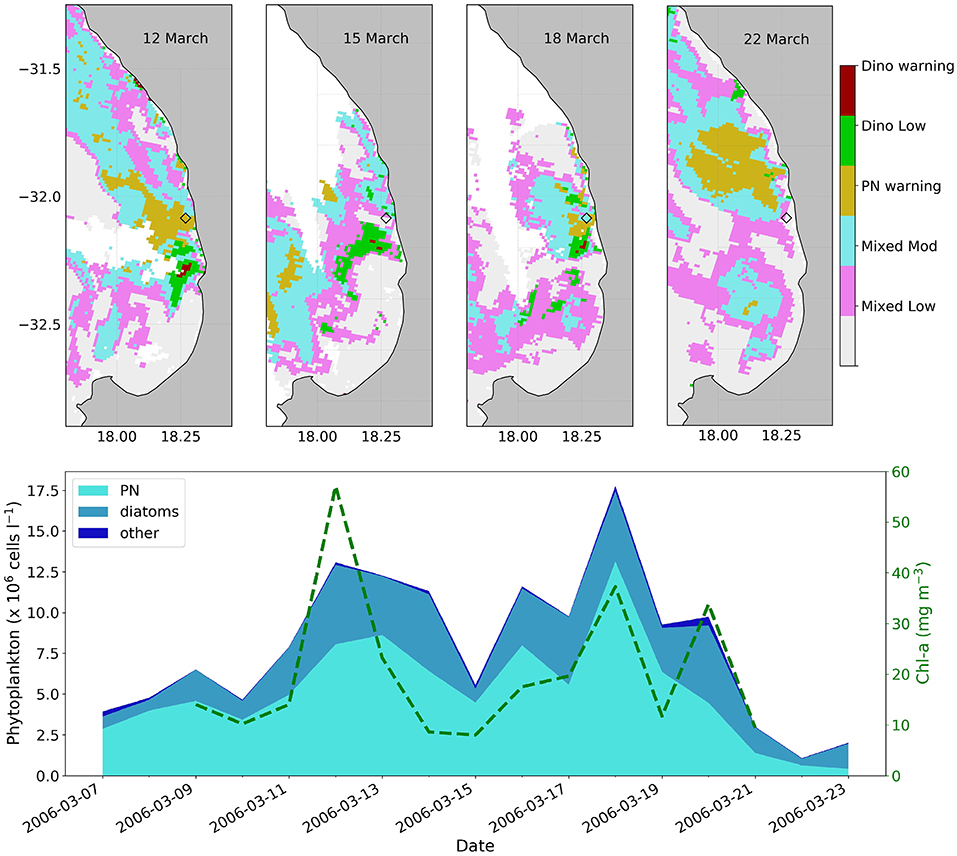
Figure 7. The top panels show the satellite-derived probabilistic phytoplankton community classification (PPCC) from MERIS for the 12th, 15th, 18th, and 22nd of March 2006, with the location of the Lambert's Bay sampling station indicated by a diamond; classes include high biomass dinoflagellate blooms (red), dinoflagellate dominated blooms of moderate biomass (green), Pseudo-nitzschia (yellow) dominated waters, as well as high (blue) and low (pink) biomass mixed assemblages. Please refer to Table 2 for a detailed PPCC color key. The lower panel provides the phytoplankton count data at the Lambert's Bay station for the 2006 sampling period (adapted from Fawcett et al., 2007), with available in situ [Chl-a] overlayed.
This study is based on a relatively small in situ dataset (N = 68) with only a limited number of samples that included coincident radiometric measurements and phytoplankton counts; however, it did comprise a wide range of phytoplankton types and biomass concentrations enabling a first order determination of ecosystem-contextualized thresholds. Although these thresholds are based upon statistical indicators, the algorithm is not specifically meant to be a quantitative translation between MLH and cell counts or [Chl-a]. The aim was to provide simple intuitive map-based indication of probabilistic phytoplankton-related risk to the aquaculture industry of southern Africa. If/when more data become available these classification methods and detection accuracy could potentially be refined further.
The application of the PPCC to coincident satellite reflectance demonstrated that there was the highest likelihood of correct classification of phytoplankton community dominance at [Chl-a] > 23 mg m−3. Although it is possible that HAB identification could be more straight-forward at lower biomass levels under mono-specific bloom conditions, it is unlikely for any one species of phytoplankton to out-compete others under nutrient-rich upwelling conditions. DSP toxin producing species of the genus Dinophysis, usually D. acuminata or D. fortii, often form small components of blooms dominated by other dinoflagellates in the southern Benguela (Pitcher and Calder, 2000); these species also pose different threat levels to shellfish cultivation, as mussels are more susceptible to the accumulation of DSP toxins (Pitcher et al., 2011). Conversely it is also possible for some very high biomass dinoflagellate blooms to not result in any harmful impacts.
It should be noted that in situ and in vitro techniques far outweigh current remote sensing capabilities when it comes to phytoplankton identification at the species level. The strength of using remote sensing for HAB detection lies in the repeatability of measurements over the same location at higher spatial scales than is attainable by in situ methods. The utility of ocean color remote sensing for in HAB monitoring is most powerful when informed by coincident in situ information such as species-level phytoplankton identification and abundance, and toxicity. Remote sensing should ideally be utilized as part of a larger multi-scale monitoring approach: where a bloom has been identified as harmful, the PPCC method can aid in the continued monitoring of the bloom's spatial extent, trajectory, and possible intensification or dissipation, thereby supporting decision making and risk mitigation processes at environmental and aquaculture management level.
The successful application of the algorithm to remote sensing data is dependent on the appropriate and successfully applied atmospheric correction and the resultant reflectance product quality. The algorithm functions in the red/NIR where the problems associated with aerosol correction are generally less than in the blue-green wavelengths. Line height algorithms are also generally less affected by absolute magnitude changes than ratios. Caution is advised when interpreting the Chl-a fluorescence signal from phytoplankton for quantitative determination of phytoplankton biomass, as the fluorescence efficiency of phytoplankton can be affected by various factors including taxonomy, physiology, nutrient availability, light history, and temperature (Babin et al., 1996). Increased backscattering across the red/NIR, as might be caused by inorganic matter, could dampen the effect of the red/NIR reflectance peaks by increasing the reflectance of the baseline; studies have demonstrated that the FLH signal could be masked by non-algal materials in turbid waters (McKee et al., 2007; Gilerson et al., 2008).
This study represents a spectral classification scheme, applicable to both in situ and satellite reflectance, for the detection of phytoplankton communities relevant to the aquaculture industry of South Africa. Although the classification is primarily qualitative, it is based on species-related optical signatures and abundance data, and provides more direct risk-related information for aquaculture management than traditional maps of [Chl-a]. Future models could potentially incorporate environmental and/or nutrient information within the phytoplankton risk probability, as changes in these variables have been linked with bloom toxicity (e.g., Torres Palenzuela et al., 2019).
Whilst the classification system was contextualized for the southern Benguela, its utility is potentially appropriate to similar upwelling systems; for instance the northern Benguela is also known to experience frequent occurrences of toxic dinoflagellates (Dijerenge, 2015) and PN blooms (Louw et al., 2016), which could negatively impact regional marine aquaculture in Namibia. Following several years of severe drought in the western Cape province, there has been a rise in the number of planned desalination plants in the region; these facilities require appropriate phytoplankton monitoring practices, as both toxic and non-toxic algae can impact operations by clogging pre-treatment filters, causing saltwater reverse osmosis membrane fouling, and affecting the taste and odor of the water (Al Shehhi et al., 2017; Anderson et al., 2017). The PPCC could potentially be applied to 10 years of MERIS data and recent OLCI data to produce probability maps (e.g., Ryan et al., 2008) which could be used to guide future aquaculture and desalination site selection.
The routine high spatial information provided by the PPCC, used together with corroborative in situ phytoplankton cell counts, provides a powerful combination for operational HAB monitoring and daily decision support within the aquaculture industry. It is important that the limitations and strengths of the classifier be clearly delineated to users to ensure the appropriate level of response and mitigation, allowing different industries to use the information as they see fit.
The datasets generated for this study are available on request to the corresponding author.
MS and SB conceptualized the study. MS prepared figures, conducted analyses, and wrote the first draft of the manuscript. All authors contributed to the manuscript revision, read, and approved the submitted version.
The authors declare that the research was conducted in the absence of any commercial or financial relationships that could be construed as a potential conflict of interest.
Grant Pitcher, Andre du Randt, and Trevor Probyn from the department of agriculture, forestry and fisheries for in situ data; GMES&Africa MarCOSouth and OCIMS for project funding. The original concept of this work was presented at the 2018 International Ocean Optics conference in Dubrovnik, Croatia (Smith and Bernard, 2018), and has been expanded upon in this manuscript.
Al Shehhi, M. R., Gherboudj, I., and Ghedira, H. (2017). “Chapter 9 - Satellites-based monitoring of harmful algal blooms for sustainable desalination,” in Desalination Sustainability, ed H. A. Arafat (Elsevier), 341–366. doi: 10.1016/B978-0-12-809791-5.00009-2
Al Shehhi, M. R., Gherboudj, I., Zhao, J., Mezhoud, N., and Ghedira, H. (2013). “Evaluating the performance of MODIS FLH ocean color algorithm in detecting the Harmful Algae Blooms in the Arabian Gulf and the Gulf of Oman,” in Oceans-San Diego, 2013 (San Diego, CA: IEEE), 1–7.
Anderson, D. M., Boerlage, S. F. E., and Dixon, M. (2017). Harmful Algal Blooms (HABs) and Desalination: A Guide to Impacts, Monitoring, and Management. Paris: Intergovernmental Oceanographic Commission of UNESCO. doi: 10.25607/OBP-203
Antoine, D., and Morel, A. (2005). Atmospheric correction of the meris observations over ocean case 1waters. MERIS ATBD 2.7.
Babin, M., Morel, A., and Gentili, B. (1996). Remote sensing of sea surface sun-induced chlorophyll fluorescence: consequences of natural variations in the optical characteristics of phytoplankton and the quantum yield of chlorophyll a fluorescence. Int. J. Remote Sens. 17, 2417–2448. doi: 10.1080/01431169608948781
Barlow, R. (1982). Phytoplankton ecology in the southern Benguela current. I. Biochemical composition. J. Exp. Mar. Biol. Ecol. 63, 209–227. doi: 10.1016/0022-0981(82)90179-4
Bernard, S., Pitcher, G., Evers-King, H., Robertson, L., Matthews, M., Rabagliati, A., et al. (2014). “Ocean colour remote sensing of harmful algal blooms in the Benguela system,” in Remote Sensing of the African Seas, eds V. Barale and M. Gade (Dordrecht: Springer), 185–203.
Bernard, S., Probyn, T., and Quirantes, A. (2009). Simulating the optical properties of phytoplankton cells using a two-layered spherical geometry. Biogeosci. Discuss. 6, 1497–1563. doi: 10.5194/bgd-6-1497-2009
Blondeau-Patissier, D., Gower, J. F., Dekker, A. G., Phinn, S. R., and Brando, V. E. (2014). A review of ocean color remote sensing methods and statistical techniques for the detection, mapping and analysis of phytoplankton blooms in coastal and open oceans. Prog. Oceanogr. 123, 123–144. doi: 10.1016/j.pocean.2013.12.008
Botes, L., Sym, S. D., and Pitcher, G. C. (2003). Karenia cristata sp. nov. and Karenia bicuneiformis sp. nov. (Gymnodiniales, Dinophyceae): two new Karenia species from the South African coast. Phycologia 42, 563–571. doi: 10.2216/i0031-8884-42-6-563.1
Brown, A. R., Lilley, M., Shutler, J., Lowe, C., Artioli, Y., Torres, R., et al. (2019). Assessing risks and mitigating impacts of harmful algal blooms on mariculture and marine fisheries. Rev. Aquacult. doi: 10.1111/raq.12403. [Epub ahead of print].
Brunet, C., Chandrasekaran, R., Barra, L., Giovagnetti, V., Corato, F., and Ruban, A. V. (2014). Spectral radiation dependent photoprotective mechanism in the diatom Pseudo-nitzschia multistriata. PLoS ONE 9:e87015. doi: 10.1371/journal.pone.0087015
Cannizzaro, J. P., Carder, K. L., Chen, F. R., Heil, C. A., and Vargo, G. A. (2008). A novel technique for detection of the toxic dinoflagellate, Karenia brevis, in the Gulf of Mexico from remotely sensed ocean color data. Continent. Shelf Res. 28, 137–158. doi: 10.1016/j.csr.2004.04.007
Carvalho, G. A., Minnett, P. J., Banzon, V. F., Baringer, W., and Heil, C. A. (2011). Long-term evaluation of three satellite ocean color algorithms for identifying harmful algal blooms (Karenia brevis) along the west coast of Florida: a matchup assessment. Remote Sens. Environ. 115, 1–18. doi: 10.1016/j.rse.2010.07.007
Craig, S. E., Jones, C. T., Li, W. K., Lazin, G., Horne, E., Caverhill, C., et al. (2012). Deriving optical metrics of coastal phytoplankton biomass from ocean colour. Remote Sens. Environ. 119, 72–83. doi: 10.1016/j.rse.2011.12.007
DAFF (2017). Aquaculture Yearbook 2016, South Africa. Department of Agriculture, Forestry and Fisheries, Cape Town, South Africa.
Demarcq, H., Barlow, R. G., and Shillington, F. A. (2003). Climatology and variability of sea surface temperature and surface chlorophyll in the Benguela and Agulhas ecosystems as observed by satellite imagery. Afr. J. Mar. Sci. 25, 363–372. doi: 10.2989/18142320309504022
Dijerenge, K. J. (2015). Analysis of marine biotoxins: paralytic and lipophilic shellfish toxins in Mussels (Mytilus Galloprovincialis) along the Namibia coastline (Ph.D. thesis). University of Namibia, Windhoek, Namibia.
Fawcett, R., Pitcher, G., Bernard, S., Cembella, A., and Kudela, R. (2007). Contrasting wind patterns and toxigenic phytoplankton in the southern Benguela upwelling system. Mar. Ecol. Prog. Ser. 348, 19–31. doi: 10.3354/meps07027
Ghanea, M., Moradi, M., and Kabiri, K. (2016). A novel method for characterizing harmful algal blooms in the Persian Gulf using MODIS measurements. Adv. Space Res. 58, 1348–1361. doi: 10.1016/j.asr.2016.06.005
Gilerson, A., Zhou, J., Hlaing, S., Ioannou, I., Gross, B., Moshary, F., et al. (2008). Fluorescence component in the reflectance spectra from coastal waters. II. performance of retrieval algorithms. Opt. Express 16, 2446–2460. doi: 10.1364/OE.16.002446
Glibert, P. M., Berdalet, E., Burford, M. A., Pitcher, G. C., and Zhou, M., (eds.). (2018). “Harmful algal blooms and the importance of understanding their ecology and oceanography,” in Global Ecology and Oceanography of Harmful Algal Blooms, (Cham: Springer), 9–25.
Glibert, P. M., and Burford, M. A. (2017). Globally changing nutrient loads and harmful algal blooms: recent advances, new paradigms, and continuing challenges. Oceanography 30, 58–69. doi: 10.5670/oceanog.2017.110
Gower, J., Doerffer, R., and Borstad, G. (1999). Interpretation of the 685nm peak in water-leaving radiance spectra in terms of fluorescence, absorption and scattering, and its observation by MERIS. Int. J. Remote Sens. 20, 1771–1786. doi: 10.1080/014311699212470
Gower, J., King, S., Borstad, G., and Brown, L. (2005). Detection of intense plankton blooms using the 709 nm band of the MERIS imaging spectrometer. Int. J. Remote Sens. 26, 2005–2012. doi: 10.1080/01431160500075857
Hallegraeff, G., and Bolch, C. (2016). Unprecedented toxic algal blooms impact on Tasmanian seafood industry. Microbiol. Aust. 37, 143–144. doi: 10.1071/MA16049
Harwood, D. T., Selwood, A. I., van Ginkel, R., Waugh, C., McNabb, P. S., Munday, R., et al. (2014). Paralytic shellfish toxins, including deoxydecarbamoyl-STX, in wild-caught Tasmanian abalone (Haliotis rubra). Toxicon 90, 213–225. doi: 10.1016/j.toxicon.2014.08.058
Hasle, G. R. (1978). “The inverted-microscope method,” in Phytoplankton Manual, ed A. Sournia (Paris: Unesco Monographs on Oceanographic Methodology), 88–96.
Holm-Hansen, O., Lorenzen, C. J., Holmes, R. W., and Strickland, J. D. (1965). Fluorometric determination of chlorophyll. J. Conseil 30, 3–15. doi: 10.1093/icesjms/30.1.3
Horstman, D., McGibbon, S., Pitcher, G., Calder, D., Hutchings, L., and Williams, P. (1991). Red tides in False Bay, 1959-1989, with particular reference to recent blooms of Gymnodinium sp. Trans. R. Soc. South Afr. 47, 611–628.
Hutchings, L., Jarre, A., Lamont, T., Van den Berg, M., and Kirkman, S. (2012). St Helena Bay (southern Benguela) then and now: muted climate signals, large human impact. Afr. J. Mar. Sci. 34, 559–583. doi: 10.2989/1814232X.2012.689672
Knap, A., Michaels, A., Close, A., Ducklow, H., and Dickson, A. (1996). “Protocols for the joint global ocean flux study (JGOFS) core measurements,” in JGOFS, Reprint of the IOC Manuals and Guides No. 29, JGOFS Report, 19 (Paris: UNESCO).
Kurekin, A., Miller, P., and Van der Woerd, H. (2014). Satellite discrimination of Karenia mikimotoi and Phaeocystis harmful algal blooms in European coastal waters: merged classification of ocean colour data. Harmful Algae 31, 163–176. doi: 10.1016/j.hal.2013.11.003
Lain, L. R., and Bernard, S. (2018). The fundamental contribution of phytoplankton spectral scattering to ocean colour: implications for satellite detection of phytoplankton community structure. Appl. Sci. 8:2681. doi: 10.3390/app8122681
Lavaud, J., Rousseau, B., Van Gorkom, H. J., and Etienne, A.-L. (2002). Influence of the diadinoxanthin pool size on photoprotection in the marine planktonic diatom Phaeodactylum tricornutum. Plant Physiol. 129, 1398–1406. doi: 10.1104/pp.002014
Letelier, R. M., and Abbott, M. R. (1996). An analysis of chlorophyll fluorescence algorithms for the moderate resolution imaging spectrometer (MODIS). Remote Sens. Environ. 58, 215–223. doi: 10.1016/S0034-4257(96)00073-9
Louw, D. C., Doucette, G. J., and Voges, E. (2016). Annual patterns, distribution and long-term trends of Pseudo-nitzschia species in the northern Benguela upwelling system. J. Plankton Res. 39, 35–47. doi: 10.1093/plankt/fbw079
Margalef, R. (1987). Life-forms of phytoplankton as survival alternatives in an unstable environment. Oceanol. Acta 1, 493–509.
Matthews, M. W., Bernard, S., and Robertson, L. (2012). An algorithm for detecting trophic status (chlorophyll-a), cyanobacterial-dominance, surface scums and floating vegetation in inland and coastal waters. Remote Sens. Environ. 124, 637–652. doi: 10.1016/j.rse.2012.05.032
McKee, D., Cunningham, A., and Dudek, A. (2007). Optical water type discrimination and tuning remote sensing band-ratio algorithms: application to retrieval of chlorophyll and Kd (490) in the Irish and Celtic Seas. Estuar. Coast. Shelf Sci. 73, 827–834. doi: 10.1016/j.ecss.2007.03.028
Melin, F., Wang, M., Werdell, J., and Hiroshi, K. (2019). Uncertainties in Ocean Colour Remote Sensing. Reports of the International Ocean-Colour Coordinating Group (IOCCG); 18. International Ocean-Colour Coordinating Group.
Moore, G., and Lavender, S. (2011). “Case IIS bright pixel atmospheric correction,” in MERIS ATBD, 2. MERIS ATBD, 2.6 (Plymouth: ARGANS).
Mueller, J. L., Pietras, C., Hooker, S. B., Austin, R.W., Miller, M., Knobelspiesse, K. D., et al. (2003) Ocean Optics Protocols for Satellite Ocean Color Sensor Validation, Revision 5. Volume V: Biogeochemical and Bio-Optical Measurements and Data Analysis Protocols (NASA/TM-2003). Greenbelt, MD: Goddard Space Flight Space Center. 1–43.
Ndhlovu, A., Dhar, N., Garg, N., Xuma, T., Pitcher, G. C., Sym, S. D., et al. (2017). A red tide forming dinoflagellate Prorocentrum triestinum: identification, phylogeny and impacts on St Helena Bay, South Africa. Phycologia 56, 649–665. doi: 10.2216/16-114.1
Pitcher, G., and Calder, D. (2000). Harmful algal blooms of the southern Benguela Current: a review and appraisal of monitoring from 1989 to 1997. South Afr. J. Mar. Sci. 22, 255–271. doi: 10.2989/025776100784125681
Pitcher, G., Calder, D., Davis, G., and Nelson, G. (1994). Harmful algal blooms and mussel farming in Saldanha Bay. Proc. Aquacult. Assoc. Southern Afr. 5, 87–93.
Pitcher, G., Krock, B., and Cembella, A. (2011). Accumulation of diarrhetic shellfish poisoning toxins in the oyster Crassostrea gigas and the mussel Choromytilus meridionalis in the southern Benguela ecosystem. Afr. J. Mar. Sci. 33, 273–281. doi: 10.2989/1814232X.2011.600372
Pitcher, G. C., Foord, C. J., Macey, B. M., Mansfield, L., Mouton, A., Smith, M. E., et al. (2019). Devastating farmed abalone mortalities attributed to yessotoxin-producing dinoflagellates. Harmful Algae 81, 30–41. doi: 10.1016/j.hal.2018.11.006
Pitcher, G. C., Franco, J. M., Doucette, G. J., Powell, C. L., and Mouton, A. (2001). Paralytic shellfish poisoning in the abalone Haliotis midae on the west coast of South Africa. J. Shellfish Res. 20, 895–904.
Pitcher, G. C., Jiménez, A. B., Kudela, R. M., and Reguera, B. (2017). Harmful algal blooms in eastern boundary upwelling systems: a GEOHAB core research project. Oceanography 30, 22–35. doi: 10.5670/oceanog.2017.107
Pitcher, G. C., Probyn, T. A., du Randt, A., Lucas, A., Bernard, S., Evers-King, H., et al. (2014). Dynamics of oxygen depletion in the nearshore of a coastal embayment of the southern Benguela upwelling system. J. Geophys. Res. Oceans 119, 2183–2200. doi: 10.1002/2013JC009443
Pitcher, G. C., and Weeks, S. J. (2006). The variability and potential for prediction of harmful algal blooms in the southern Benguela ecosystem. Large Mar. Ecosyst. 14, 125–146. doi: 10.1016/S1570-0461(06)80012-1
Probyn, T., Pitcher, G., Pienaar, R., and Nuzzi, R. (2001). Brown tides and mariculture in Saldanha Bay, South Africa. Mar. Pollut. Bull. 42, 405–408. doi: 10.1016/S0025-326X(00)00170-3
Robertson Lain, L., Bernard, S., and Evers-King, H. (2014). Biophysical modelling of phytoplankton communities from first principles using two-layered spheres: Equivalent Algal Populations (EAP) model. Opt. Express 22, 16745–16758. doi: 10.1364/OE.22.016745
Ryan, J., Davis, C., Tufillaro, N., Kudela, R., and Gao, B.-C. (2014). Application of the hyperspectral imager for the coastal ocean to phytoplankton ecology studies in Monterey Bay, CA, USA. Remote Sens. 6, 1007–1025. doi: 10.3390/rs6021007
Ryan, J. P., Gower, J. F. R., King, S. A., Bissett, W. P., Fischer, A. M., Kudela, R. M., et al. (2008). A coastal ocean extreme bloom incubator. Geophys. Res. Lett. 35:L12602. doi: 10.1029/2008GL034081
Sathyendranath, S., Aiken, J., Alvain, S., Barlow, R., Bouman, H., Bracher, A., et al. (2014). Phytoplankton Functional Types From Space. Reports of the International Ocean-Colour Coordinating Group (IOCCG); 15 (International Ocean-Colour Coordinating Group), 1–156.
Smith, M., and Bernard, S. (2018). Satellite ocean colour based harmful algal bloom identification for improved risk assessment and mitigation. Environ. Sci. doi: 10.1002/essoar.10500045.1. [Epub ahead of print].
Stumpf, R., Culver, M., Tester, P., Tomlinson, M., Kirkpatrick, G., Pederson, B., et al. (2003). Monitoring Karenia brevis blooms in the Gulf of Mexico using satellite ocean color imagery and other data. Harmful Algae 2, 147–160. doi: 10.1016/S1568-9883(02)00083-5
Tao, B., Mao, Z., Lei, H., Pan, D., Shen, Y., Bai, Y., et al. (2015). A novel method for discriminating Prorocentrum donghaiense from diatom blooms in the East China Sea using MODIS measurements. Remote Sens. Environ. 158, 267–280. doi: 10.1016/j.rse.2014.11.004
Tao, B., Mao, Z., Wang, D., Lu, J., and Huang, H. (2011). “Remote sensing of the ocean, sea ice, coastal waters, and large water regions 2011,” in Proceedings of SPIE, Vol. 8175 (Prague).
Torres Palenzuela, J. M., González Vilas, L., Bellas, F. M., Garet, E., González-Fernández, Á., and Spyrakos, E. (2019). Pseudo-nitzschia blooms in a coastal upwelling system: Remote sensing detection, toxicity and environmental variables. Water 11:1954. doi: 10.3390/w11091954
Urban-Econ Development Economists (2018). Abalone Feasibility Study, Final report. Report prepared for the Department of Agriculture, Forestry and Fisheries, South Africa.
Van der Lingen, C., Hutchings, L., Lamont, T., and Pitcher, G. (2016). Climate change, dinoflagellate blooms and sardine in the southern Benguela Current Large Marine Ecosystem. Environ. Dev 17, 230–243. doi: 10.1016/j.envdev.2015.09.004
Verheye, H. M., Lamont, T., Huggett, J. A., Kreiner, A., and Hampton, I. (2016). Plankton productivity of the Benguela current large marine ecosystem (BCLME). Environ. Dev. 17, 75–92. doi: 10.1016/j.envdev.2015.07.011
Wang, M., and Hu, C. (2017). Predicting Sargassum blooms in the Caribbean Sea from MODIS observations. Geophys. Res. Lett. 44, 3265–3273. doi: 10.1002/2017GL072932
Keywords: ocean color, remote sensing, HABs, aquaculture, OLCI, MERIS, South Africa, Southern Benguela
Citation: Smith ME and Bernard S (2020) Satellite Ocean Color Based Harmful Algal Bloom Indicators for Aquaculture Decision Support in the Southern Benguela. Front. Mar. Sci. 7:61. doi: 10.3389/fmars.2020.00061
Received: 31 October 2019; Accepted: 28 January 2019;
Published: 14 February 2020.
Edited by:
Pierre Gernez, Université de Nantes, FranceReviewed by:
Michelle Christine Tomlinson, National Centers for Coastal Ocean Science (NOAA), United StatesCopyright © 2020 Smith and Bernard. This is an open-access article distributed under the terms of the Creative Commons Attribution License (CC BY). The use, distribution or reproduction in other forums is permitted, provided the original author(s) and the copyright owner(s) are credited and that the original publication in this journal is cited, in accordance with accepted academic practice. No use, distribution or reproduction is permitted which does not comply with these terms.
*Correspondence: Marié E. Smith, bXNtaXRoMkBjc2lyLmNvLnph
Disclaimer: All claims expressed in this article are solely those of the authors and do not necessarily represent those of their affiliated organizations, or those of the publisher, the editors and the reviewers. Any product that may be evaluated in this article or claim that may be made by its manufacturer is not guaranteed or endorsed by the publisher.
Research integrity at Frontiers
Learn more about the work of our research integrity team to safeguard the quality of each article we publish.