 Rebecca Haughey
 Tim Hunt1
 Robert William Rankin
 Guido J. Parra
- 1Cetacean Ecology, Behaviour and Evolution Lab, Flinders University, Adelaide, SA, Australia
- 2Stenella Marine & Social Science, Perth, WA, Australia
- 3Thomson Reuters, Toronto, ON, Canada
Little is known about the ecology of Indo-Pacific bottlenose dolphins (Tursiops aduncus) inhabiting the coastal waters of tropical north-western Australia. We used photo-identification data collected between 2013 and 2015, site fidelity indexes and capture-recapture models to estimate the abundance and site fidelity patterns of Indo-Pacific bottlenose dolphins (T. aduncus) inhabiting the coastal waters off the North West Cape (NWC), Western Australia. A standardized site fidelity index (SSFI) indicated low site fidelity (SSFI = 0.019) at the population level to the 130 km2 study area. Agglomerative hierarchical clustering (AHC) of individual re-sight rates classified 58% of individuals as “non-residents.” Open POPAN modeling estimated a super-population size of 311 (95% CI: 249–373) individuals over the study period. A maximum likelihood transient model which considers both resident and non-resident individuals in a population, estimated a resident population of 141 (95% CI: 121–161) individuals and a super-population of 370 (95% CI: 333–407) individuals. These models indicate that a large population of Indo-Pacific bottlenose dolphins of relatively high density (an average of 2.4–2.8 bottlenose dolphins per km2) inhabits the waters off the NWC. The large number of both resident and non-resident bottlenose dolphins found throughout the coastal waters off the NWC suggest this area, as well as neighboring waters outside our study area, are of high importance to this species.
Introduction
The abundance and density of individuals in a population are among the most commonly used predictors of extinction risk and the conservation status of the world’s land and marine mammals (Cardillo et al., 2005; Davidson et al., 2009; Lotze et al., 2017). Consequently, conservation and management decisions with the intention of protecting wildlife require a robust estimation of population demographic parameters and site fidelity patterns (Williams et al., 2002; Krebs, 2015). These demographic attributes are variable within and between species and are influenced by the survival, rate of movement, and the site fidelity (i.e., tendency to return to a previously occupied place) patterns of individuals (Lebreton et al., 1992; Switzer, 1993).
Estimating demographic parameters of species that are highly mobile and wide ranging can be difficult due to varying detection probability, unequal sampling effort, and non-random movement patterns (Thompson et al., 1998; Williams et al., 2002). Due to varying levels of individual site fidelity within a population, there is the potential to capture individuals that do not frequently occur in the study area and are often only present for short periods of time, often termed “transients” or “non-residents” (Hines et al., 2003; Clavel et al., 2008). Estimating demographic parameters of populations can be difficult when there is considerable spatial overlap of resident and non-resident individuals (Conn et al., 2011). Failure to account for the non-resident individuals can lead to biased, incorrect estimates of survival and abundance. Therefore, it is important to be aware of both “non-residents” and “residents” (Conn et al., 2011). Population demographic estimates which ignore the presence of non-resident individuals can lead to misleading estimates, incorrect interpretations about ecological relationships (e.g., predator–prey dynamics, species-habitat relationships), flawed impact assessments, and inappropriate implementation of conservation actions and resources, which would all be detrimental for populations and species that are vulnerable to human activities (Schaub et al., 2007; Clavel et al., 2008).
Marine mammals are often exposed to cumulative anthropogenic pressures as a result of increasing human interaction within their habitats which creates challenges to their conservation (Maxwell et al., 2013; Avila et al., 2018). Coastal dolphins in particular, face a variety of threats including habitat loss and degradation (Jefferson et al., 2009; Cagnazzi et al., 2013b; Karczmarski et al., 2017), exposure to environmental contaminants (Storelli and Marcotrigiano, 2000; Balmer et al., 2011; Cagnazzi et al., 2013a), boat strikes (Wells and Scott, 1997; Ross, 2006; Dwyer et al., 2014), net entanglement (Jones, 1995; Bannister et al., 1996; Shaughnessy et al., 2003), and noise disturbance (Dolman et al., 2003; Buckstaff, 2004; Bejder et al., 2006). In Australia, most of the human population growth is near the coast, with 85% of the population currently living within 50 km of the coastline (Clark and Johnston, 2016). As a result, the demand for industrial and residential infrastructure, shipping, aquaculture, and tourism activities has accelerated rapidly and so too has the pressure on marine mammals inhabiting coastal waters (Hawkins et al., 2017). This is particularly the case for north Western Australia (WA), where large-scale coastal habitat modification to support expansion of mining and petroleum industries has occurred (and is increasing), and assessment of the impacts to coastal dolphins continues to be limited due to a lack of baseline information (Preen et al., 1997; Allen et al., 2012; Bejder et al., 2012; Brown et al., 2012; Hanf et al., 2016).
The coastal waters of the North West Cape (NWC) experience variable levels of protection, with waters to the West and North of the NWC falling within the Ningaloo Coast World Heritage Area (NCWHA) and the Ningaloo Marine Park (Commonwealth and State Waters) (NMP). Australia provides a high degree of protection to its World Heritage properties and marine parks. Three levels of government (National, State, and Municipal) work in conjunction with community, indigenous custodians and the Ningaloo Coast World Heritage Advisory Committee to manage and maintain the World Heritage values of the area (DoEWHA, 2010). The NMP is a single marine protected area with an ecosystem-based management approach managed under a cooperative arrangement. Only approved commercial and recreational activities that are consistent with the conservation and restoration of the natural environment are permitted in these waters (DoEWHA, 2010). The State waters extend to three nautical miles from the reef and are divided into different zones with different restrictions (general use, special purpose, recreational and sanctuary zones) (DoEH, 2002). The Commonwealth waters extend to another 3–9 nautical miles from the State waters and are managed with uniform restrictions throughout (DoEH, 2002). On the eastern side of the NWC lies the Exmouth Gulf, which although is recognized as an important ecosystem, lacks formal protection.
Due to the outstanding natural values of the NCWHA and NMP, the NWC has been subject to a large magnitude of scientific research with variable areas of interest (i.e., geomorphology of the area, benthic ecology, marine flora and fauna, oceanography and the social impacts of tourism in the area among others). The area also supports a substantial marine megafauna wildlife tourism industry (Sanzogni et al., 2015; Raudino et al., 2016), a major humpback whale (Megaptera novaeangliae) nursery (Bejder et al., 2019); a high density of threatened Australian humpback dolphins (Sousa sahulensis) (Hunt et al., 2017) and WA’s second largest prawn fishery (Kangs et al., 2006; Pitcher et al., 2016).
The Indo-Pacific bottlenose dolphin (Tursiops aduncus, hereafter IP bottlenose dolphin) is known to occur in the coastal waters of the NWC (Allen et al., 2012; Brown et al., 2012). Australian humpback and IP bottlenose dolphins are recognized as being of ecological value to the biodiversity of the NMP, the NCWHA (CALM and MPRA, 2005; DBCA, 2018) and north WA in general (DoE, 2015), but targeted ecological studies have so far only focused on the threatened humpback dolphins (Hunt et al., 2017, 2019). IP bottlenose dolphins are currently listed as Near Threatened by the International Union for the Conservation of Nature (IUCN) (Braulik et al., 2019). The lack of information on the ecology of this species in north WA has prevented an accurate assessment of their conservation status; hampering management and conservation decisions.
In this study, we used capture-mark-recapture methods and population models to investigate site fidelity patterns (i.e., the tendency of dolphins to remain in, or return to, and reuse the study area) and estimate abundance of IP bottlenose dolphins around the NWC whilst taking into account the presence of non-resident individuals. Results from this study provide important information on the population demographics of IP bottlenose dolphins at the NWC that will aid their future conservation and management.
Materials and Methods
Study Site
The study area encompasses the coastal waters surrounding the NWC peninsula located north-west of the Australian mainland (Figure 1). The NWC study area is located in the northern section of the Ningaloo Reef (Australia’s largest fringing reef). Two-thirds of the total study area falls within the protected NMP (State Waters) (Figure 1).
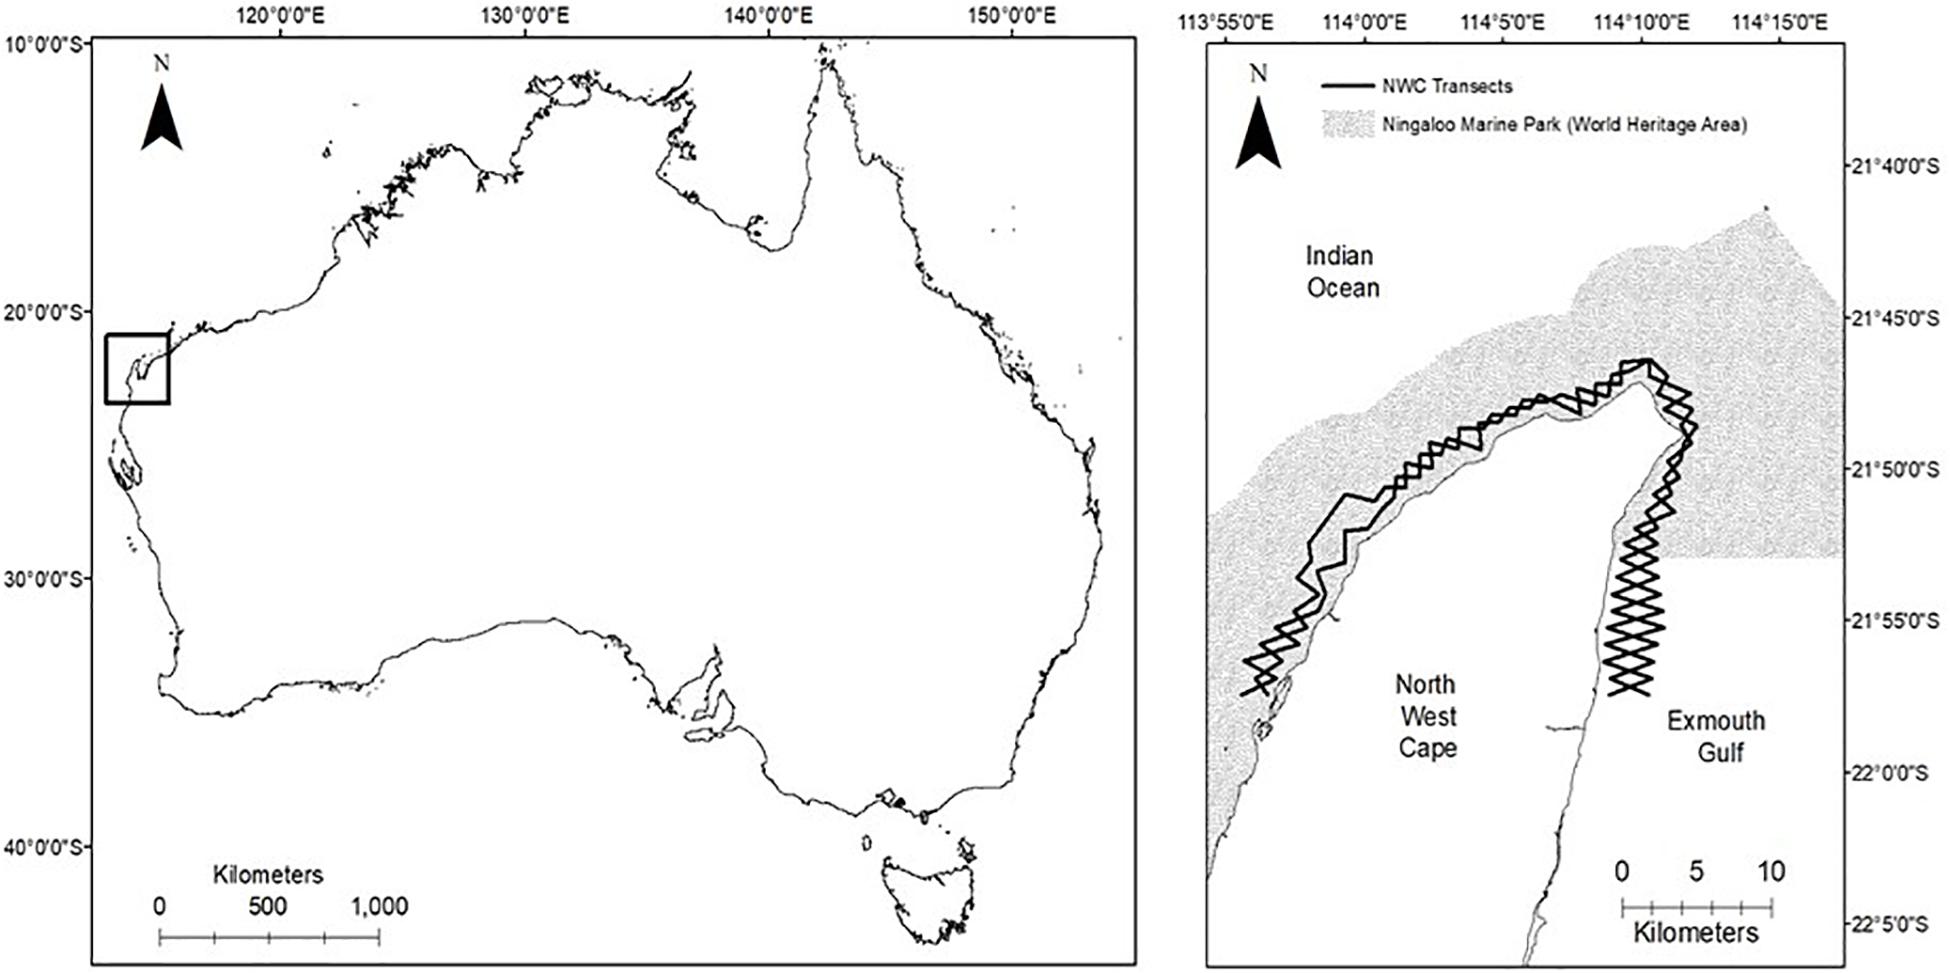
Figure 1. (Left) Map of Australia, showing the location of the North West Cape (pictured inside box). (Right) The North West Cape study site and opposing zigzag line transect sampling design (2 × 93 km in length).
Data Collection
Boat-based surveys targeting both IP bottlenose dolphins and Australian humpback dolphins were conducted in favorable weather conditions (Beaufort Sea State ≤3 and no rain) with six 3-month long sampling periods conducted over 3 years (2013–2015) covering the austral seasons of Autumn (April–June), Winter (July–August), and Spring (September–October). The 3-month long sampling periods spanned over multiple austral seasons and for the purpose of examining any seasonal changes in abundance in this study were classified as either Autumn/Winter (AW) (April–June) or Winter/Spring (WS) (July–October). Summer months (November–April) were not surveyed due to consistently unfavorable wind conditions, the higher risk of tropical cyclones and extreme temperatures. Surveys were conducted from 0700 to 1800 h (depending on suitable conditions) on board a 5.6 m center console aluminum vessel with a 100 HP outboard motor. Surveys followed a systematic line transect layout which was developed based on accessibility and in order to adequately sample the wide range of habitats, human use areas and environmental variables within the study area. The transect layout consisted of two 93 km long opposing zig-zag lines (Figure 1). The study area covered approximately 130 km2 along 50 km of coastline, and extended up to five km offshore, encompassing water depths up to 45 m.
During surveys a crew of three to five (mode = four) observers searched for dolphins forward of the vessel’s beam, alternating between the naked eye and 7 × 50 binoculars. Schools of dolphins were defined as dolphins with relatively close spatial cohesion (i.e., each member within 100 m of any other member) involved in similar (often the same) behavioral activities [modified from Connor et al. (1998)]. When a dolphin school was sighted, survey effort was suspended and dolphins were slowly approached to within 30 m to collect photo-identification images and record location (using a GPS unit), school size, school age composition (number of calves, juveniles, and adults) and predominant school behavior (i.e., behavioral state in which more than 50% of the animals in a school are involved (Mann, 1999). All dolphins within a school were photographed regardless of their level of marking. The three age classes were distinguished based on behavioral cues and visual assessment using the average adult size as a reference: (1) adults: individuals >2 m long; (2) juveniles: individuals between 1/2 and 2/3 the body length of an adult, usually swimming in close association with an adult, but sometimes swimming independently; and (3) calves: animals ≤1/2 the length of an adult, in close association with an adult, and swimming regularly beside or slightly behind an adult. Once all individuals within a school were photographed or sight of dolphins was lost, the boat returned to the transect line where dolphins were first sighted and resumed survey effort. All data were collected under permit and with ethics approval.
Photo-Identification
All photographs taken were processed using the DISCOVERY photo-identification data-management system software (Gailey and Karczmarski, 2012). Images were examined and scored according to strict quality and distinctiveness protocols (see Supplementary Material 1). To develop capture histories of individuals and for all subsequent analyses, we used only images of distinctive (D1 and D2) adult individuals deemed to be of excellent and good quality. Juveniles and calves were excluded due to their lack of distinctive markings and dependence on their mothers, violating common model assumptions that captures are independent (Pollock et al., 1990).
Proportion of Marked Individuals
The proportion of identifiable individuals in the study population (θ) was determined by dividing the number of recognizable (D1 and D2) individuals by the total number of individuals observed in each encounter, averaged over all encounters (Silva et al., 2009; Gore et al., 2016). Abundance estimates and confidence intervals were adjusted considering the proportion of marked individuals in the study population using the following formula:
Site Fidelity
We investigated the monthly, sampling period, and yearly sighting rates of individuals to determine the tendency of dolphins to return to the study area (Zanardo et al., 2016; Hunt et al., 2017; Passadore et al., 2018).
1. Monthly sighting rate: the number of months an individual was identified as a proportion of the total number of study months. Monthly sighting rates could range between 0.05 (i.e., animals sighted in only 1 month out of the 19 months surveyed) and 1 for an individual sighted in all months.
2. Sampling period sighting rate: the number of 3-month long sampling periods an individual was identified as a proportion of the total number of sampling periods in our study. Sampling period sighting rates could range between 0.16 (i.e., animals sighted in only one sampling period out of the six sampling periods) and 1 for an individual sighted in all sampling periods.
3. Yearly sighting rate: the number of years an individual was identified as a proportion of the total number of study years. Yearly sighting rates could range between 0.33 (i.e., animals sighted in only 1 year out of the 3 years surveyed) and 1 for an individual sighted in all years.
We used Pearson’s correlation to quantify the relationship between the three individual site fidelity measures using R version 3.4.4 (R Core Team, 2018). The variables with the lowest level of correlation were analyzed using agglomerative hierarchical clustering (AHC) (Legendre and Legendre, 2012), to assess if there were clusters of individual dolphins who exhibited similar patterns of site fidelity. AHC analysis was run in Primer/PERMANAOVA + v7 software using Euclidean distance as the dissimilarity measure. For each cluster identified, we used Primer to calculate p-values to determine statistical significance (at 5% significance level), assess the confidence in the strength of each of the clusters identified and to specify a dissimilarity threshold to represent the most appropriate number of clusters. To assess how faithfully clusters in the dendrogram represented the dissimilarities among observations, we used the cophenetic correlation coefficient (CPCC), with a CPCC-value >0.8 indicating a reliable representation of the data (Sokal and Rohlf, 1962).
Additionally, we calculated a standardized site fidelity index (SSFI) at the population level using the following formula (Tschopp et al., 2018):
followed by:
where IT (Permanence) is the amount of time in the study area expressed as the average number of days between the first and last capture of each individual as a proportion of the total number of days from the beginning to the end of sampling (non-constant effort). It (Periodicity) is the average recurrence of an individual, expressed as an inverse fraction of the number of days between an individual’s first, and last capture as a proportion of the individual’s total number of captures minus one. The SSFI varies between zero (indicating low site fidelity for the population) and one (indicating high site fidelity for the population).
Abundance, Density, and Apparent Survival of Individuals
Estimating demographic parameters of highly mobile and wide-ranging species is difficult, particularly when dealing with populations containing a high proportion of “non-resident” or “transient” individuals. Site fidelity analysis suggested the population was open to individual movement within and between sampling periods, and tests of population closure conducted in CloseTest (Stanley and Burnham, 1999) indicated the population was not closed (Otis test p-value = 0.99854 and Stanley and Burnham test p-value = 0.00). To overcome the challenges posed by the high levels of transience within this population, two different open population-modeling techniques [POPAN and an maximum likelihood estimation (MLE) transient model] were chosen to quantify baseline population demographics of the IP bottlenose dolphins inhabiting our study area.
Abundance of IP bottlenose dolphins across the six sampling periods (Table 1) in the study area was estimated using a POPAN parameterization of the Jolly–Seber model (Schwarz and Arnason, 1996). This model provides abundance estimates while allowing entries (i.e., births and immigration) and losses (i.e., death and permanent emigration) in the population under study and is suitable for long-term studies where the use of models assuming population closure is not reasonable. POPAN models were run in Program MARK (White and Burnham, 1999) and estimated super-population size (N) (i.e., the number of animals that theoretically used the study area during the course of the study, including those not captured (Schwarz and Arnason, 1996), apparent survival (phi), capture probability (p) and the probability of an individual from the super-population entering the sampled population for that sampling occasion (pent). Due to the nature of the sampling design (six 3-month long sampling periods spaced over 3 years) and weather constraints, time intervals between sampling periods were uneven. Time intervals were calculated as the number of days between the last day of the previous period to the first day of the corresponding period as a yearly proportion and were accounted for in the models. We ran a total of eight models allowing for fixed (•) or time-varying (t) effects on phi, p and pent in the study area throughout the survey period (see Supplementary Material 2 for model details). The most parsimonious model was selected based on the Quasi Akaike Information Criterion (QAICc) values (Burnham and Anderson, 2002).
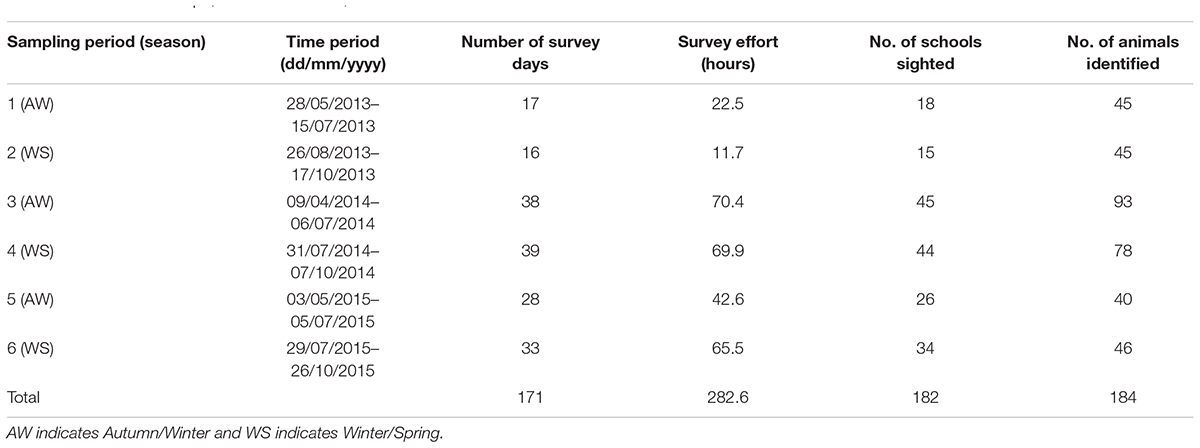
Table 1. Summary of survey effort, number of schools of Indo-Pacific bottlenose dolphins sighted and number of marked individuals identified per sampling period around the North West Cape, Western Australia, between 2013 and 2015.
We also used a MLE transient model (Conn et al., 2011) to estimate the abundance of resident individuals (NRes) and the super-population size (N, combined abundance of resident and non-residents). The model assumes that individuals sampled more than once were residents, and individuals only seen once were either resident individuals that by chance were only observed once or non-residents, which had entered the study area and become available for sampling. Four maximum likelihood transient models were run in R (R Core Team, 2018) using the package DeRiv [R code obtained from Conn et al. (2011)] allowing for fixed (•) or time-varying (t) effects on Pit and πt in the study area throughout the survey period. These models estimated super-population size (N∗), the probability that an individual selected at random is a resident (α), capture probability (Pi), probability of transients entering the study area and becoming available for sampling (π), and the population size of residents (Nres). The most parsimonious model was selected based on AICc values (see Supplementary Material 3 for these models).
Goodness of Fit and Validation of Model Assumptions
Goodness of fit of the POPAN model was calculated using program RELEASE in MARK and program U-CARE with chi−squared tests (and Fisher’s exact tests when needed) for transients and trap−dependence (Lebreton et al., 1992). First, T3. SR considered individuals seen in a particular sampling period, and how many were then seen again and when, essentially testing for transience in the population. Second, Test 3. SM tested for a difference in individuals in the time between an individual’s first capture and its first recapture. Third, Test 2. C (program RELEASE) and Test 2. CT (program U-CARE), tested for trap dependence. Fourth, a global test (Test 2 + 3) tests for homogeneity in individual capture histories. We estimated the variance inflation factor (c) to quantify over-dispersion in the data using the chi-square statistic divided by its degrees of freedom. Goodness of fit tests for the MLE transient model have not yet been developed.
POPAN and the MLE transient model have a few assumptions, which if violated can lead to bias in population estimates (Pollock, 1982; Pollock et al., 1990; Kendall and Bjorkland, 2001; Conn et al., 2011). We used population information obtained in this study, information on dolphin biology and ecology and evaluated our study design in combination with a variety of tests to validate the assumptions of these models (see Supplementary Material 4).
Results
Survey Effort, Photo-Identification, and Proportion of Marked Individuals
We completed a total of 283 h of survey effort across the six sampling periods over the 3 years (2013–2015) of this study (Table 1). During this time, we sighted 182 schools of IP bottlenose dolphins, ranging in size from 1 to 30 individuals (mean ± SD = 6.42 ± 5.22). The cumulative discovery curve of identified individuals (Figure 2) continued to gradually increase over the 3-year study period indicating that new individuals were continually sighted within the study area. A total of 184 distinctly marked individuals were photo-identified and included in statistical analysis. The proportion of marked individuals within the study population (θ ± SE) was estimated at 0.80 ± 0.36.
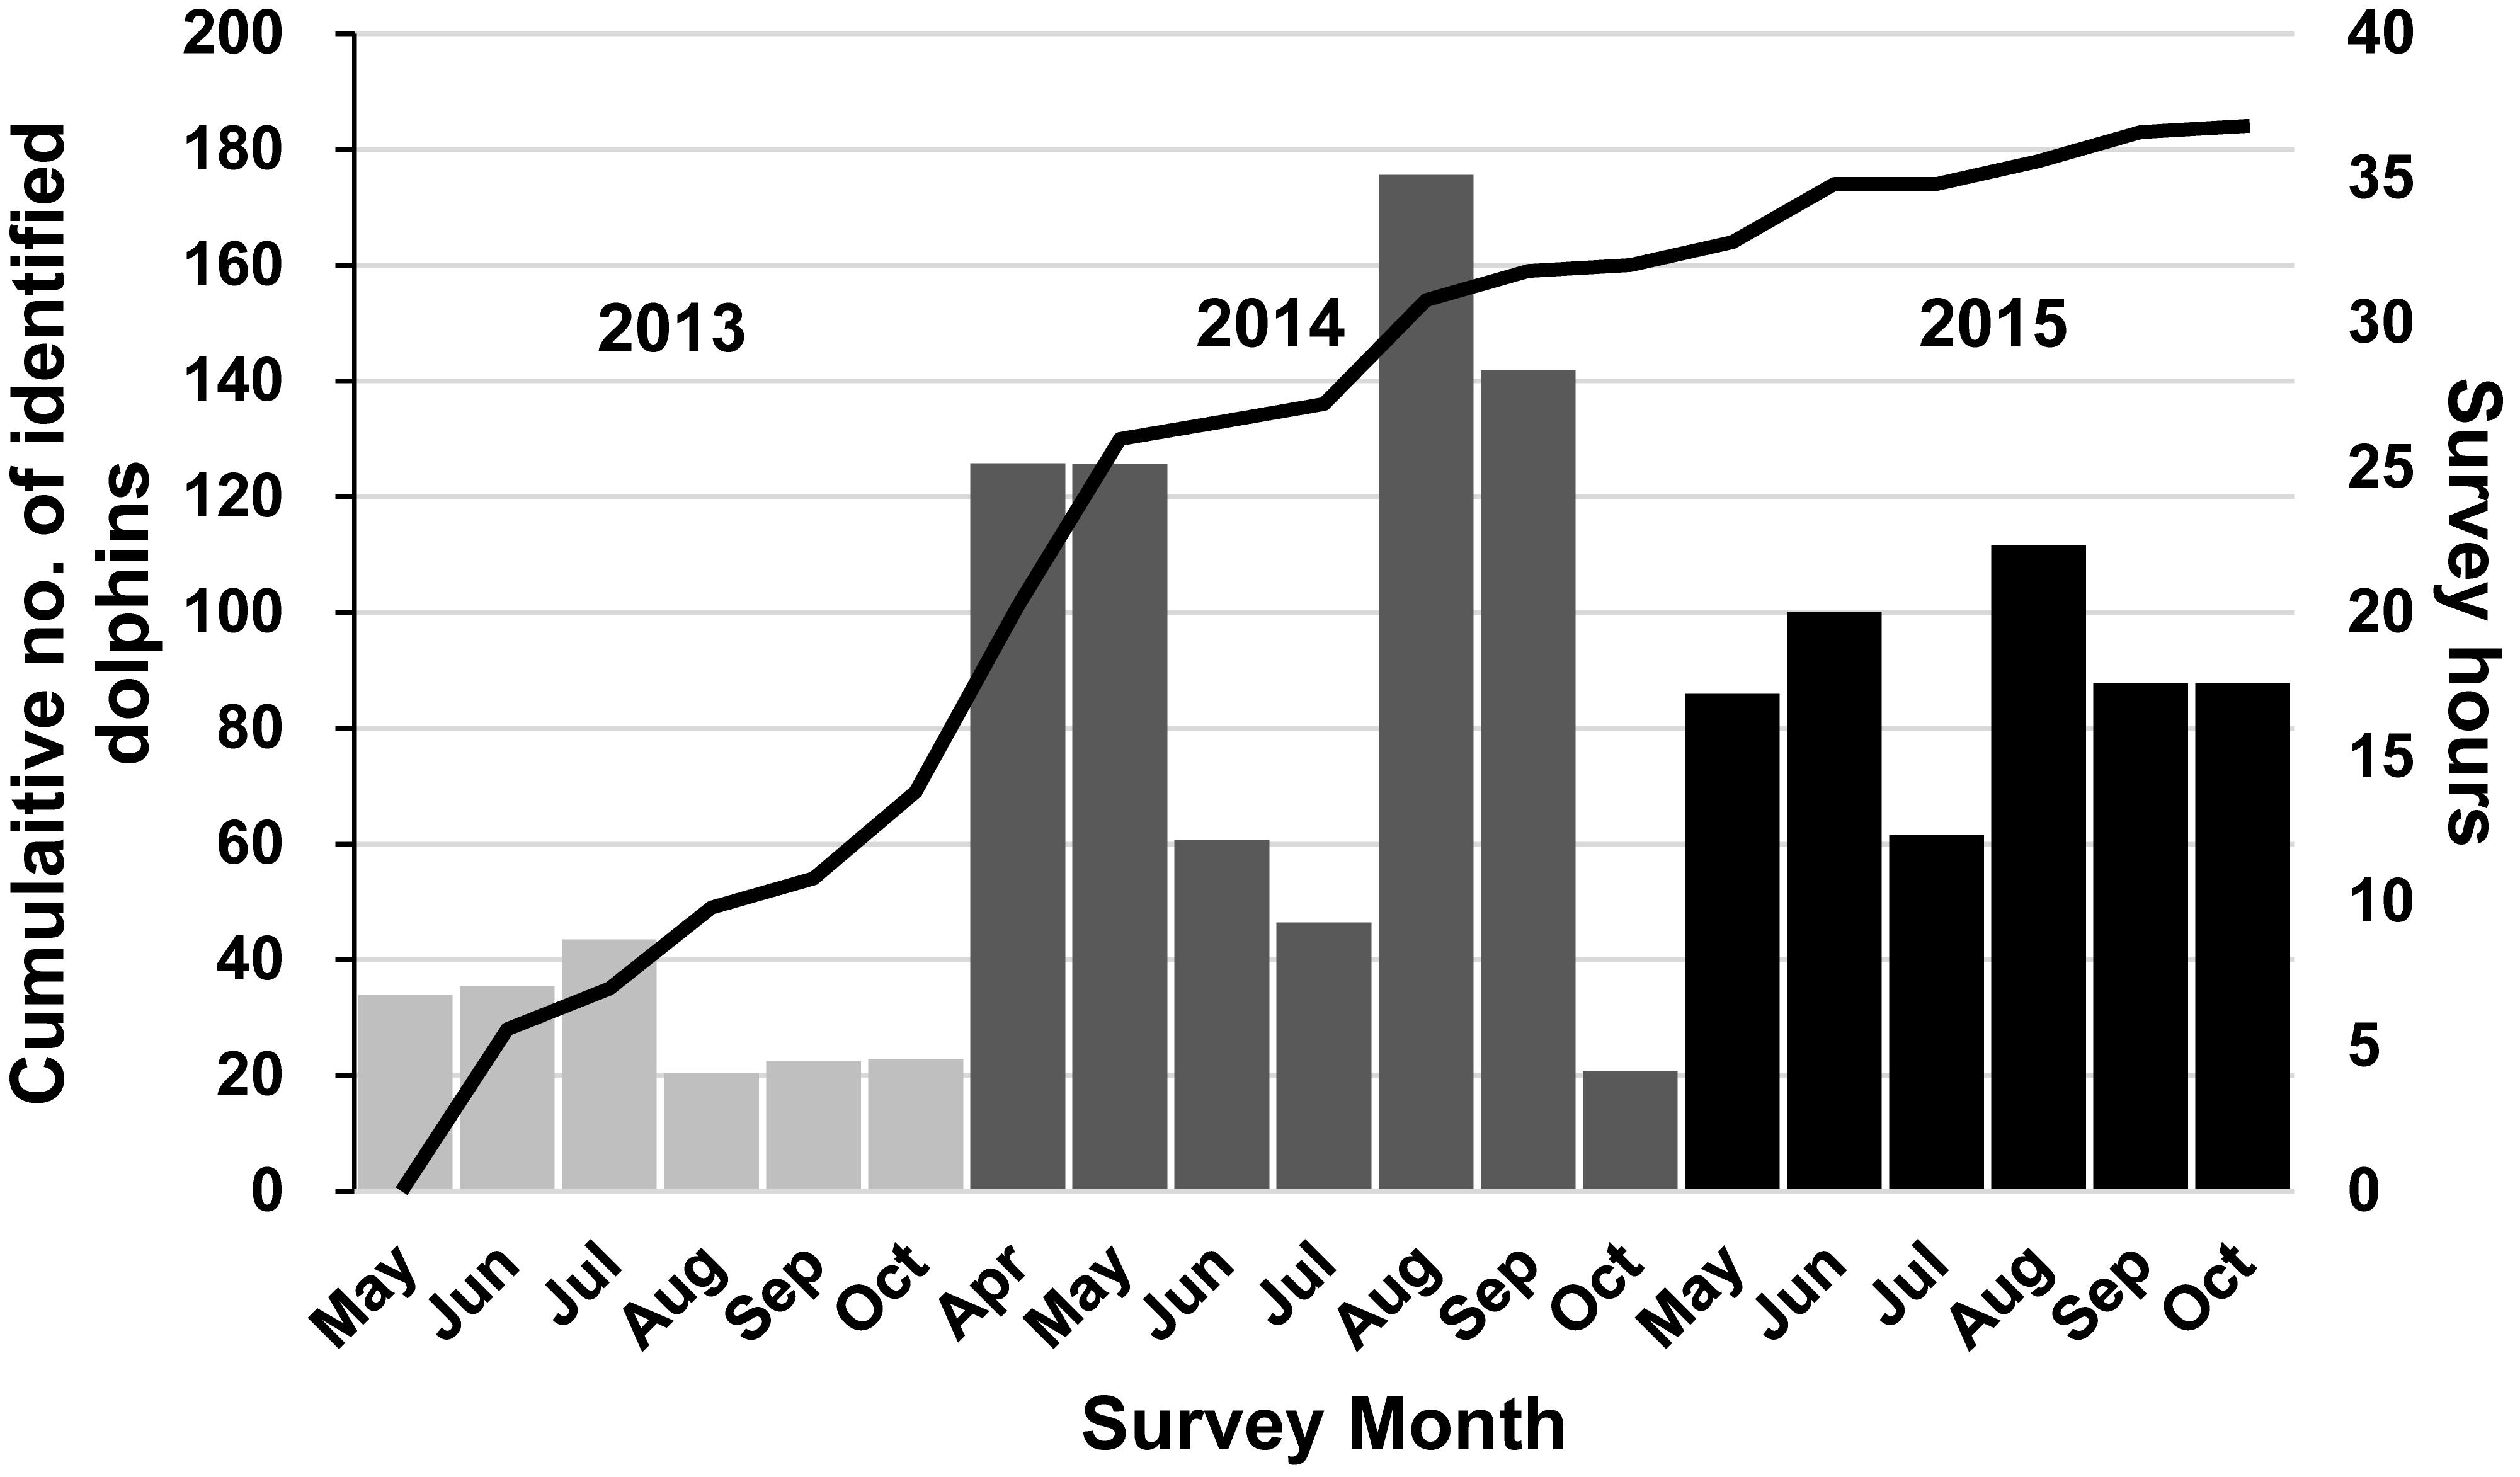
Figure 2. Cumulative discovery curve of identified Indo-Pacific bottlenose dolphins (n = 184) within the North West Cape (NWC) study in Western Australia (WA) over the 2013 (May–October) and 2015 (May–October) survey periods (total 171 days). Columns represent the number of survey hours during each month of study.
Site Fidelity
Of the 184 individuals photo-identified, 73 (40%) were sighted only once, 62 (34%) individuals were sighted either two or three times. 49 (27%) were sighted four or more times (mean ± SD = 3.11 ± 3.11). The average monthly resight rate (±SD) was 0.13 ± 0.10 (95% CI: 0.11–0.14) indicating individuals were typically sighted in two out of 19 months surveyed. Only four individuals were sighted in more than 50% of the total months surveyed, and no individual was seen in all 19 months. The average yearly resight rate was 0.52 ± 0.24 (95% CI: 0.48–0.55) indicating that individuals were more commonly sighted in either one or two of the three surveyed years. In total, 107 individuals were sighted in only 1 year, 52 in 2 years and 25 in all 3 years. The average sampling period resight rate (±SD) was 0.32 ± 0.19 (95% CI: 0.29–0.35) showing that individuals were typically sighted in two out of the six sampling periods. Two individuals were seen in all six sampling periods and 94 individuals were only seen in one. Eighteen individuals were seen in over 50% of sampling periods (four or more sampling periods). The SSFI estimate was 0.019 indicating very low levels of site fidelity at the population level in the study area.
The correlation test found that sampling period resight rate was highly correlated with both the monthly and yearly resight rates (0.92 and 0.88, respectively). AHC clustering analysis was run using only the monthly and yearly resight rates which had a correlation of 0.76. AHC analysis separated individuals into three main clusters (largest dissimilarity threshold = 0.6). The cophenetic correlation coefficient (CPCC = 0.94) and p-values (0.001 at 5% significance level) indicated a strong representation of the dissimilarities among observations (Figure 3). Cluster 1 contained 25 individuals (14%) that were sighted in all 3 years of survey; cluster 2 contained 52 individuals (28%) that were sighted in 2 years of survey and cluster 3 contained 107 individuals (58%) seen in only 1 year. Thus, cluster 1 individuals are considered to be “full-time residents,” who display a high level of residency to the study area, cluster 2 are considered to be “part-time residents,” who were sampled more than once but display a lower level of site fidelity to the study area than the full-time residents and cluster 3 are considered to be “non-residents” (“transients”) with no site fidelity to the study area. For the purpose of this study, we consider residents as individuals of clusters 1 and 2 and non-residents as individuals of cluster 3. Average resight rates and standard deviations of the three clusters are shown in Table 2.
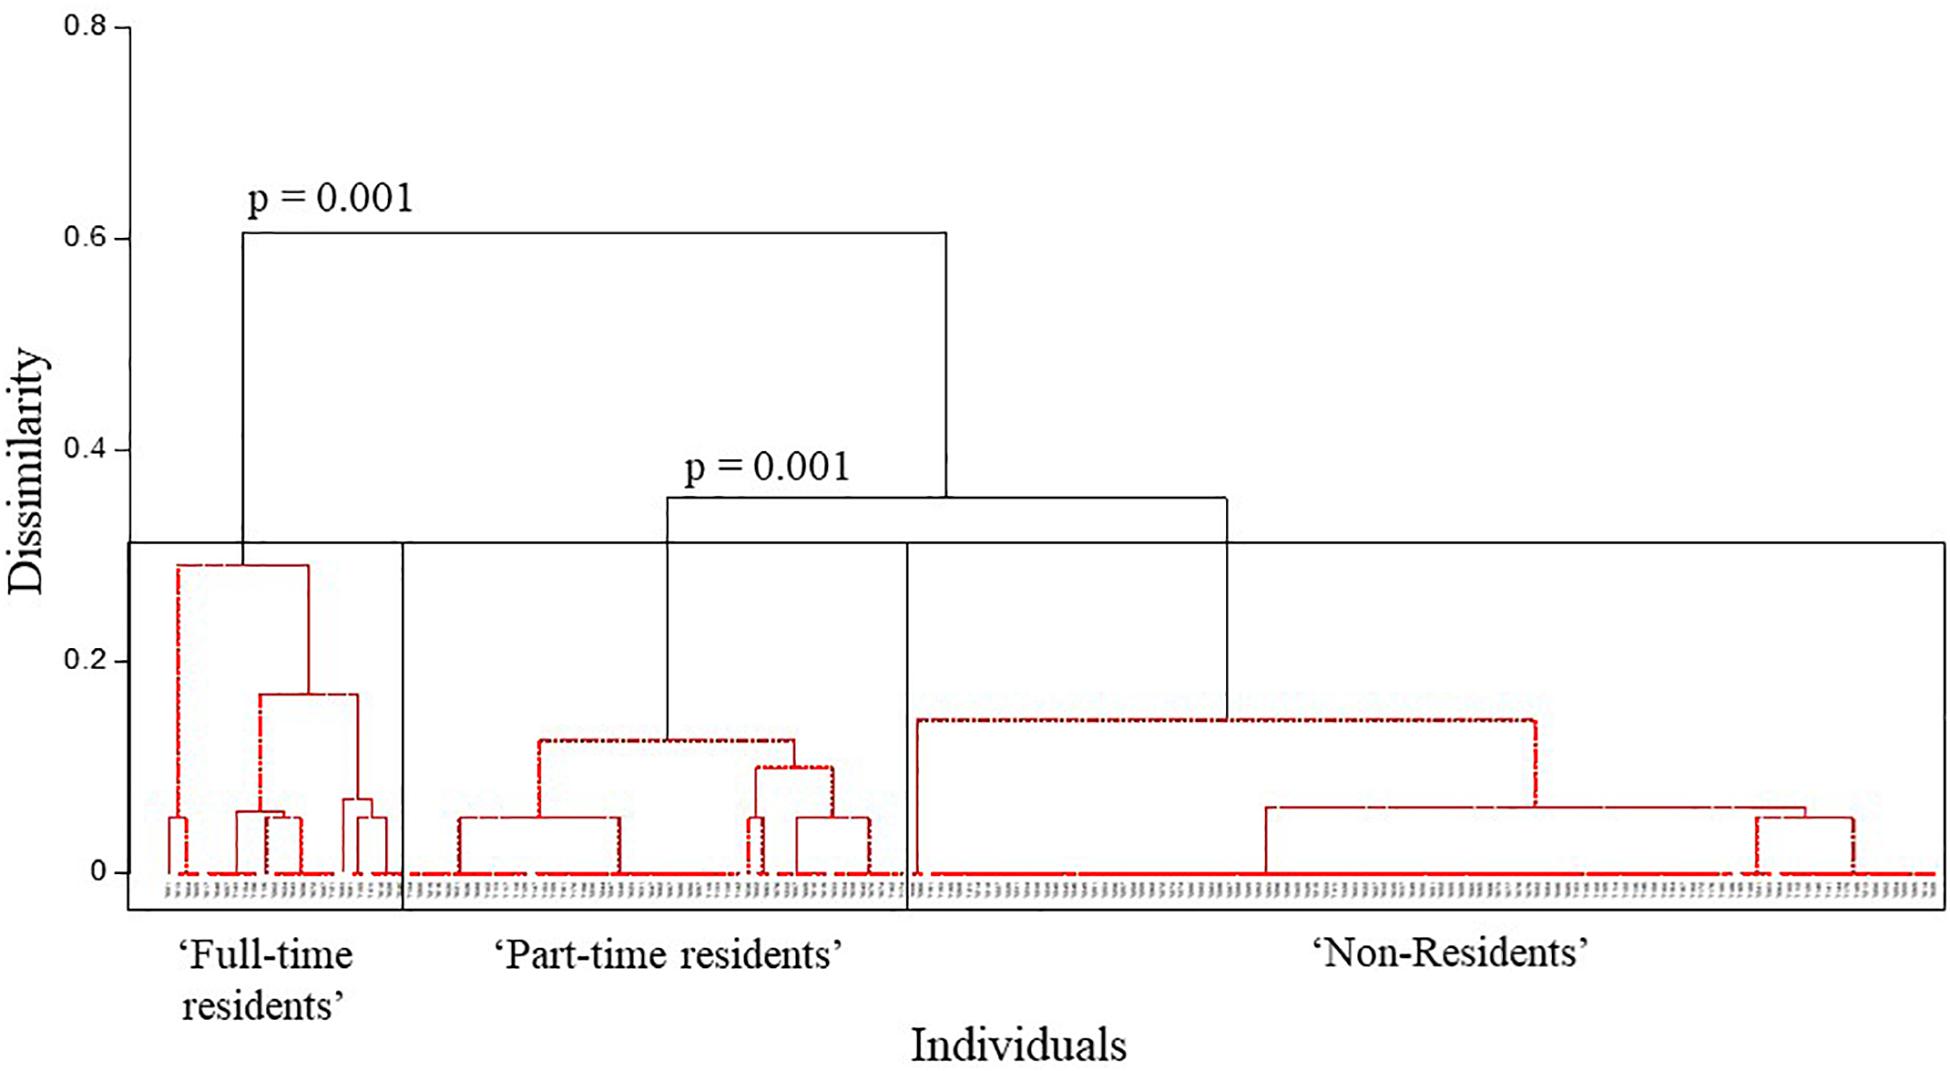
Figure 3. Agglomerative hierarchical clustering analysis displaying three main clusters based on the site fidelity patterns of the Indo-Pacific bottlenose dolphins of the North West Cape (NWC). Western Australia (WA) (“Full-time residents,” “Part-time residents,” and “Non-residents”) with the largest dissimilarity threshold = 0.6.
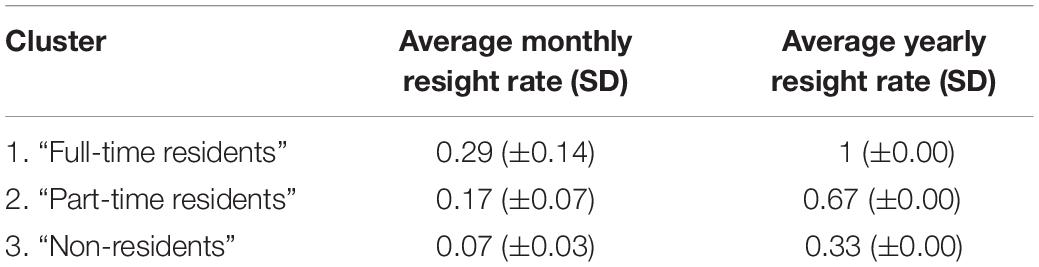
Table 2. Average monthly and yearly resight rates of the three clusters (“Full-time residents,” “Part-time residents,” and “Non-residents”) of Indo-Pacific bottlenose dolphins identified through agglomerative hierarchical clustering analysis at the North West Cape, Western Australia.
Abundance, Density, and Apparent Survival of Individuals
Results from POPAN models were averaged (Table 3) to account for model selection uncertainty (see Supplementary Table 2.1 for unadjusted unaveraged AICc models, Supplementary Table 2.2 for unaveraged QAICc models). Certain parameters are inestimable for sampling periods one and six so only sampling periods two, three, four and five are displayed in Table 3.
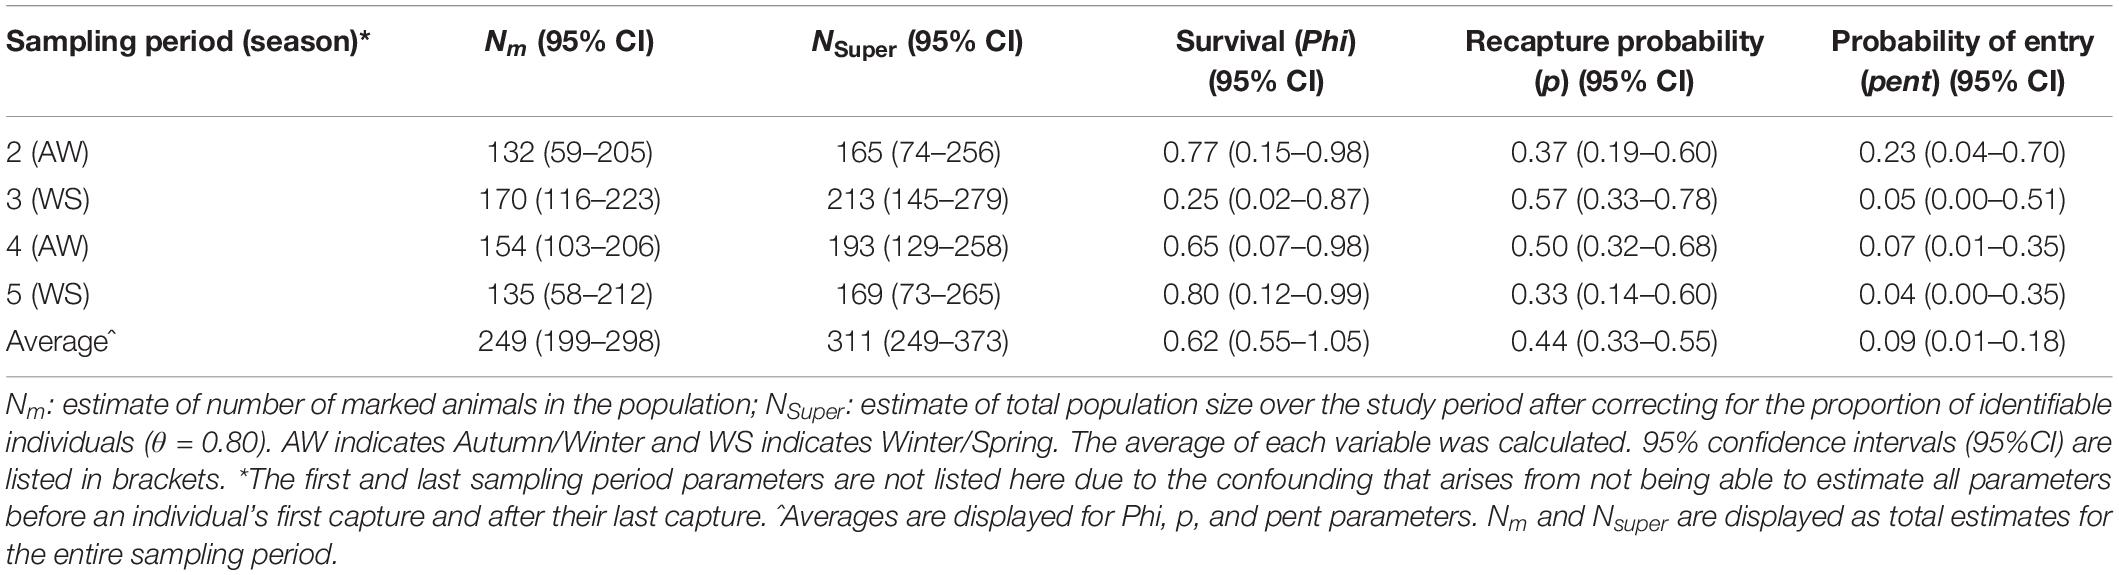
Table 3. Estimates of population size (N), apparent survival (Phi), capture probability (p), and probability of entry into the population (pent) of Indo-Pacific bottlenose dolphins around the North West Cape in Western Australia for each sampling period.
Model averaged results estimated that the total super-population size across the study period was N = 311 (95% CI: 249–373), average apparent survival (phi) = 0.62 (95% CI: 0.55–1.05), average recapture probability (p) = 0.44 (95% CI: 0.33–0.55), and the average probability of entry (pent) = 0.09 (95% CI: 0.01–0.18) (Table 3).
The transient MLE model with the lowest AICc (AICc = 1234.001) was the one with time varying capture probability (p) and constant entry probabilities (π) (see Supplementary Material 3). The super-population size of marked individuals was estimated at 296 (95% CI: 259–333) and resident population size at 113 (95% CI: 93–133). The total super-population and resident population size after accounting for both unmarked and marked individuals was 370 (95% CI: 333–407) and 141 (95% CI: 121–161), respectively. The probability that an individual selected at random is a resident (α) was 0.38.
Density of IP bottlenose dolphins within the 130 km2 NWC study area using the abundance estimates from POPAN and transient MLE models (taking into account the proportion of marked individuals) was estimated at an average of 2.4 and 2.8 dolphins per km2, respectively.
Goodness of Fit
Test 3. SR from RELEASE and U-CARE for the POPAN model indicated a transient effect in the population, which was expected after visual inspection of individual capture histories, site fidelity analyses and the results of the CloseTest. Test 3. SM showed no strong evidence to reject temporal heterogeneity in capture probabilities; Test 2. C (RELEASE) and Test 2. CT (U-CARE) showed no strong evidence to reject the null-hypothesis of no trap dependence. The global test (Test 2 + 3) showed no homogeneity in individual capture histories with 42 unique capture histories indicating that there is a large amount of variation in detection of individuals, likely due to the high proportion of non-residents. RELEASE and U-CARE estimated the variance inflation factor (c) as 2.28 and 2.37, respectively, indicating over dispersion of the data. In response to this, AICc values were adjusted to QAICc values (Richards, 2008). RELEASE and U-CARE goodness of fit test results are displayed in Table 4.
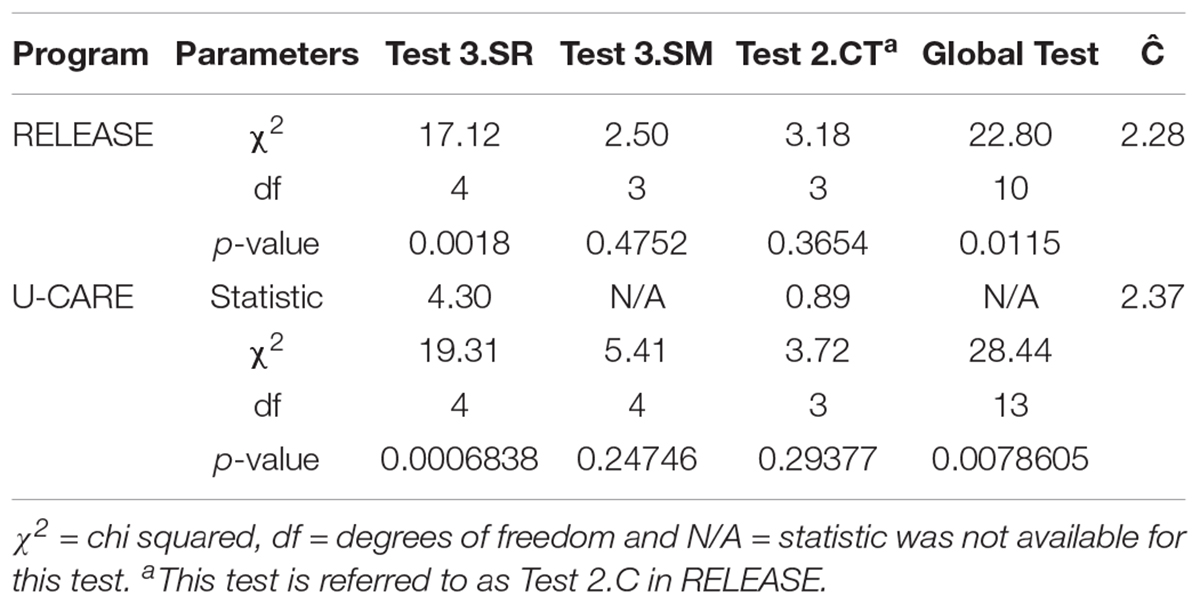
Table 4. Results from goodness of fit tests run in Program RELEASE and U-CARE for the sampling periods of Indo-Pacific bottlenose dolphin surveys conducted during 2013–2015 around the North West Cape, Western Australia.
Discussion
In this study, we provide the first assessment of baseline population demographic parameters (site fidelity, abundance, and survival) of IP bottlenose dolphins in the coastal waters of the NWC, WA. We provide relevant information to aid the management of a large population inhabiting an area of multiple use (wildlife tourism, scientific research, recreational activities, fisheries and resource extraction in neighboring waters) with mixed levels of protection. Site fidelity and abundance estimates indicated that the population of IP bottlenose dolphins using the coastal waters of the NWC is composed of a large proportion of animals that use the area occasionally, and a smaller proportion of animals that use the area regularly. An average of 2.4–2.8 dolphins per km2 reside in the coastal waters of the NWC, with a resident population of 141 individuals using the area year round. The low site fidelity displayed by a large proportion of individual dolphins, and slight variation in abundance estimates across sampling periods indicated that animals range beyond the limits of the study area. Despite the low levels of site fidelity observed, the high number of animals (both residents and non-residents) using the study area over time suggests that the NWC represents an important habitat within the home range of this species.
Site Fidelity
Worldwide, bottlenose dolphin populations (Tursiops sp.) display variation in their patterns of occurrence, distribution and site fidelity. Within a population, individuals have been observed showing varying levels of residency with individuals typically characterized as residents, migratory (semi-resident) or transient (non-resident). High levels of site fidelity and residency are characteristic of bottlenose dolphins in protected coastal areas with high prey availability and low predation risk (Gowans et al., 2007; Fury and Harrison, 2008; Chabanne et al., 2012; Webster et al., 2014; Brown et al., 2016; Zanardo et al., 2016; Dulau et al., 2017; Passadore et al., 2018). In contrast, low levels of site fidelity is often typical of individuals inhabiting lower productivity areas where prey availability is highly variable in space and time (Gowans et al., 2007; Silva et al., 2008; Edwards et al., 2009; Lafontaine et al., 2017).
The distribution of prey has been identified as one of the key factors influencing species distribution and movement (Shane et al., 1986; Hanson and Defran, 1993; Hart, 1997; Browning et al., 2014). The large proportion of non-resident individuals found at the NWC likely reflects high spatial and temporal variability in their prey resources. The coastal lagoon waters to the west of the Cape are influenced by two opposing current systems. The southward Leeuwin current is prevalent from April to September moving warm, low nutrient waters down the coast (Sleeman et al., 2007; Hanson and McKinnon, 2009). From September to April, strong southerly winds generate a northward current (Ningaloo Current) which creates an upwelling of cooler, higher nutrient waters from below the Leeuwin current (Sleeman et al., 2007; Hanson and McKinnon, 2009). The change in oceanographic conditions between seasons could potentially drive a shift in prey availability or preferable environmental conditions. A similar environment in North Central Chile which experiences productive upwelling driven by southward winds in summer and a down welling of less productive waters in winter is also home to a population with a large proportion of transient individuals (Santos-Carvallo et al., 2018). Transient individuals tended not to be present during unproductive winter months, likely as a result of a decrease in food supply (Santos-Carvallo et al., 2018). The diet of the IP bottlenose dolphins at the NWC is currently unknown and should be a topic of future research to further understand the distribution of IP bottlenose dolphins around the NWC.
Dietary divergence, differential use of space and habitat selection have been proposed as some of the major resource partitioning mechanisms promoting the coexistence of sympatric delphinids (Bearzi, 2005; Parra, 2006). The NWC apart from holding a large population of IP bottlenose dolphins is also home to a dense and sizeable population of Australian humpback dolphins (129 individuals 95% CI: 117–141, 0.90–1.09 individuals per km2) (Hunt et al., 2017). In contrast to the IP bottlenose dolphins, Australian humpback dolphins have high levels of site fidelity and high residency to the NWC (Hunt et al., 2017). Australian humpback dolphins at the NWC showed a preference for shallow waters (5–15 m deep) up to 2 km from the coast (Hunt, 2018). Habitat preferences of the IP bottlenose dolphins in these waters is a topic of current research. Differences in space use and habitat selection between humpback and IP bottlenose dolphins may be the principal mechanisms promoting their coexistence, which could be a possible explanation for low site fidelity of the IP bottlenose dolphins to the NWC.
In a number of bottlenose dolphin (Tursiops sp.) populations, individuals have segregated into different communities to cope with intraspecific competition (Wells, 1986; Rossbach and Herzing, 1999; Chilvers and Corkeron, 2001; Urian et al., 2009). These distinct communities may overlap in diet and home range and live in direct sympatry (Chilvers and Corkeron, 2001; Lusseau et al., 2006) or they may show different ranging patterns (Urian et al., 2009; Kiszka et al., 2012). It has been hypothesized that these communities have formed in order to optimize space and resource sharing (Kiszka et al., 2012). It is possible that the IP bottlenose dolphin population in the NWC consists of multiple communities that have formed to reduce space and resource competition. Studies involving stable isotope analysis, home range patterns and genetic sampling of the “resident” and “non-resident” individuals could be used to investigate this further.
Predation risk is also known to influence dolphin distribution and habitat use, which could influence the site fidelity of individuals to a particular area (Wirsing et al., 2008; Kiszka et al., 2015). Killer whales as well as tiger sharks, well−known predators of marine mammals including dolphins, are known to inhabit the waters of the NWC (Pitman et al., 2015). Successful predation attempts from killer whales on IP bottlenose dolphins have been reported by ecotourism charters in Coral Bay (100 km south) and several individuals of the NWC population exhibit scars and fresh wounds as a result of shark bites (Haughey, personal observations). Therefore, a high predation risk could be a possible explanation for low site fidelity of IP bottlenose dolphins to the NWC.
Movements of bottlenose dolphins along the northwest coast of WA are poorly understood. The large number of non-resident individuals within NWC waters suggests IP bottlenose dolphins frequently use areas beyond the study area. The presence of IP bottlenose dolphins in coastal waters adjacent to the NWC (Haughey, personal observations), and further offshore within the central and eastern parts of the Exmouth Gulf (Preen et al., 1997; Sleeman et al., 2007; Hanf, 2015), as well as in Coral Bay to the south and Onslow to the north (approx. 100 km either direction) (Allen et al., 2012; Raudino et al., 2018) suggest that movements beyond the study area are likely. Future monitoring of IP bottlenose dolphins integrating photo-identification, genetics, and telemetry in NWC and adjacent waters would shed further insight into their population boundaries, site fidelity and home range.
Abundance of Individuals
Dolphin abundance is typically influenced by the abundance and distribution of their prey and predators and habitat type, with protected and enclosed areas containing typically smaller populations than those that occupy semi-open habitats (Shane et al., 1986; Wells et al., 1987; Ballance, 1992). Differences in the methodologies used and sizes of study areas makes comparison of abundance estimates amongst studies difficult. Most estimates of abundance for other areas in Australia of similar size to our study area (130 km2) and generated using similar methodologies (photo-identification and capture-recapture models) range in size from 63 individuals to 160 individuals (Möller et al., 2002; Smith et al., 2013; Brown et al., 2016; Raudino et al., 2018) with the exception of Point Lookout, Australia, with estimates of 861–895 individuals (Chilvers et al., 2003). The NWC abundance estimates of 311–370 individuals are larger than most of these studies and thus indicate a moderately large population inhabits these waters. The NWC study area offers both protected and enclosed waters to the east in the Gulf, and semi open oceanic waters with lagoons on the inner side of the Ningaloo Reef to the west. Access to both open and enclosed habitats within our study area may explain the relatively large mix of resident and non-resident individuals inhabiting the NWC, further highlighting the need to study the adjacent waters of the Exmouth Gulf. The high abundance of both resident and non-resident individuals in NWC across seasons also suggests this area offers highly favorable year−round habitat conditions.
Apparent Survival and Permanent Emigration of Individuals
Due to the high longevity of IP bottlenose dolphins, we acknowledge that a 3-year study may not fully encapsulate the population processes of emigration and mortality and suggest that long-term monitoring of this population is needed to get a better baseline estimate of apparent survival. Survival is a key demographic parameter that is difficult to estimate from capture-recapture data, as models cannot separate mortality from permanent emigration (Ergon and Gardner, 2014). This difficulty is heightened when looking at species with high longevity and low levels of site fidelity. Unless site fidelity to a particular study area is very high, apparent survival is usually under estimated (Schaub and Royle, 2014). The level of underestimation depends on the size of the study area and the ranging patterns of the species (Zimmerman et al., 2007). If the geographical limits of a study area correspond perfectly with the ranges of the population of interest, treating both permanent emigration and survival as one parameter may be appropriate (Gilroy et al., 2012). However, if the study area falls within a wider area of interest, permanent emigrants surviving outside the study area may still have the potential to contribute to population processes (Gilroy et al., 2012). As discussed above, the low levels of site fidelity observed in this study and the presence of IP bottlenose dolphin in adjacent waters indicates that individuals range beyond the limits of our 130 km2 study area. The low average estimate of survival presented in this study (0.62, 95% CI: 0.55–1.05) that supports our site fidelity analysis, is likely a result of the high proportion of individuals only seen once and is therefore more likely to be representative of permanent emigration and transience than survival.
Model Selection and Evaluation of Model Reliability and Performance
Both POPAN and the MLE transient models have their advantages and limitations, with the only mutually estimable parameter being abundance (see sections “Abundance, Density, and Apparent Survival of Individuals,” “Goodness of Fit and Validation of Model Assumptions,” and Supplementary Material 4). The two models produced abundance estimates with a difference of 59 individuals, with POPAN producing the lower estimate (311) and MLE the larger estimate (370). The upper and lower confidence intervals of both models overlap at 333–373 individuals. The size of confidence intervals varied but the MLE models have smaller CI’s than POPAN.
POPAN was selected for its suitability for open populations and its widely accepted use for modeling open population demographics. In a simulation study by Gupta et al. (2017) POPAN’s ability to model population size for a wide-ranging species was investigated. Although the modeling technique was found to underestimate population size, bias levels were small. The least biased estimates occurred when there was a random trap arrangement, high trap density and high population density. In this study, our “trap arrangement” were non-random transects with an opposing zig-zag layout which remained constant and uniform throughout the study and had an average density of 0.8 transects per km2. Population density estimated from the POPAN abundance estimate was an average of 2.4 IP bottlenose dolphins per km2, which is relatively high compared with populations in similar sized study areas (Möller et al., 2002; Nicholson et al., 2012; Smith et al., 2013; Brown et al., 2016; Raudino et al., 2018). POPAN estimated capture probabilities at an average of 0.44 (0.33–0.55) with less than 50% of individuals likely to be recaptured in each sampling period suggesting individual heterogeneity and transience, violating the model assumption that individuals were equally likely to be captured. Goodness of fit testing supported this [Test 3.SR, Test 3. SM and global test (Test 2 + 3)]. Models were averaged to account for model selection uncertainty and AICc values were adjusted after the variance inflation factor indicated over dispersion of the data, suggesting that this model might have underestimated population size and may not be the most appropriate for estimating abundance of this population due to the high level of transience and non-resident individuals.
The MLE transient model which was primarily developed for dolphins, was selected in this study for its ability to account for individual heterogeneity in populations in which there is a spatial overlap of resident and non-resident individuals (Conn et al., 2011). The model assumes a strict dichotomy of two groups: residents and transients, which may not be appropriate for all study populations, but was deemed a suitable assumption for this population due to the high proportion of individuals only seen once. Although the model employs a “one sample availability,” Conn et al. (2011) simulated the effect of violations in the model assumptions if transients were to remain in the study area longer than one sampling period. If transients remained in the study area and were sampled on more than one occasion, resident abundance estimates exhibited an overall positive bias of less than 5%. In our study, 18% of individuals in the non-resident cluster were sampled more than once which we acknowledge may have created some bias in abundance estimates. However, the MLE model generates α which is the probability that a randomly encountered individual is a resident. This value was estimated at 38%, which is very similar to the proportion of residents produced in our AHC analysis (42%). As it is not higher than what was estimated in our site fidelity analysis and due to the high proportion of individuals only seen once (40%), we assume that overestimation of the resident population size has not occurred. Although goodness of fit testing has not been developed for this model we are confident in its estimates of population size.
Conservation Implications
Determining and monitoring the effect of coastal development on inshore dolphins is challenging in great part because of the lack of adequate baseline studies. This study provides the first demographic assessment of IP bottlenose dolphins inhabiting the coastal waters of the NWC, within the NCWHA, NMP and Exmouth Gulf and should aid wildlife agencies and future impact studies by serving as a point of reference to compare and evaluate changes over time and develop appropriate management and mitigation strategies.
Our results show that a large population inhabits the waters of the NWC and highlights the importance of the NWC for IP bottlenose dolphins. As large populations of megafauna are becoming increasingly rare in coastal habitats that are subject to increasing human activities (Jackson et al., 2001), this population is of high conservation value. Marine Parks are often established in order to protect vulnerable species and ecosystems, to conserve biodiversity and to minimize the risk of extinction (Holt, 2009). The NMP offers a regulatory framework for conservation and manages human activities (e.g., fishing) that are recognized as potential threats to the species inhabiting these waters (DoEH, 2002). Once outside the marine park boundaries, individuals are at risk from all the threats the established park aims to protect them from Holt (2009), Hartel et al. (2015). The low site fidelity to the NWC indicates that individuals of the IP bottlenose dolphin rely on and use habitat outside the 130 km2 study area and more importantly, move from the boundaries of the protected NMP and NCWHA and into the unprotected waters of Exmouth Gulf or other adjacent waters. Future management plans for the NMP and NCWHA should consider extending these boundaries so that the Exmouth Gulf is included. Future surveys should be completed in the Gulf to determine the true importance of this area to the population.
Data Availability Statement
The raw data supporting the conclusions of this article will be made available by the authors without undue reservation to any qualified researcher.
Ethics Statement
The animal study was reviewed and approved by the Flinders University Animal Welfare Committee (E383).
Author Contributions
GP conceived the study. TH and GP designed the study. TH and DH collected the data. RH analyzed the data with advice and contributions to data analysis from GP, TH, and RR. RH wrote the manuscript with contributions to drafting, critical review, and editorial input from GP, TH, DH, and RR.
Funding
The Australian Marine Mammal Centre (Project 12/11) and the Winifred Violet Scott Charitable Trust funded this research.
Conflict of Interest
RR was employed by the company Thomson Reuters.
The remaining authors declare that the research was conducted in the absence of any commercial or financial relationships that could be construed as a potential conflict of interest.
Acknowledgments
We thank all the research assistants that assisted with the data collection over the 3 years of survey. Data collection was permitted by the WA Department of Biodiversity, Conservation and Attractions (formerly Department of Parks and Wildlife) (Permit numbers SF009240, SF009768, and SF010289), WA Department of Agriculture and Food (U38/2013-2015), and the Australian Government Department of Defence (Harold Holt Naval Base Exmouth), with approval from the Flinders University Animal Welfare Committee (E383). We thank the community and businesses of Exmouth, the staff at DPaW Exmouth, the Cape Conservation Group, and MIRG Australia for supporting the North West Cape Dolphin Research Project (NWCDRP). We thank Paul Conn for providing the code for the maximum likelihood transient model. We thank Ryan Baring for his advice and providing access to Primer. We also thank Simon J. Allen and Lars Bejder for their contributions to the NWCDRP.
Supplementary Material
The Supplementary Material for this article can be found online at: https://www.frontiersin.org/articles/10.3389/fmars.2019.00781/full#supplementary-material
Abbreviations
AHC, Agglomerative hierarchical clustering; CPCC, Cophenetic correlation coefficient; IP, Indo-Pacific; IUCN, International Union for the Conservation of Nature; MLE, Maximum likelihood estimation; NCWHA, Ningaloo Coast World Heritage Area; NMP, Ningaloo Marine Park; NWC, North West Cape; SSFI, Standardized site fidelity index; WA, Western Australia.
References
Allen, S. J., Cagnazzi, D., Hodgson, A., Loneragan, N., and Bejder, L. (2012). Tropical inshore dolphins of north-western Australia: unknown populations in a rapidly changing region. Pacific Conserv. Biol. 18, 56–63.
Avila, I. C., Kaschner, K., and Dormann, C. F. (2018). Current global risks to marine mammals: taking stock of the threats. Biol. Conserv. 221, 44–58. doi: 10.1016/j.biocon.2018.02.021
Ballance, L. T. (1992). Habitat use patterns and ranges of the bottlenose dolphin in the Gulf of California, Mexico. Mar. Mammal Sci. 8, 262–274. doi: 10.1111/j.1748-7692.1992.tb00408.x
Balmer, B. C., Schwacke, L. H., Wells, R. S., George, R. C., Hoguet, J., Kucklick, J. R., et al. (2011). Relationship between persistant organic pollutants (POPs) and ranging patterns in common bottlenose dolphins (Tursiops truncatus) from coastal Georgia. USA. Sci. Total Environ. 409, 2094–2101. doi: 10.1016/j.scitotenv.2011.01.052
Bannister, J. L., Kemper, C. M., and Warneke, R. M. (1996). The Action Plan for Australian Cetaceans. Canberra: Australian Nature Conservancy.
Bearzi, M. (2005). Dolphin sympatric ecology. Mar. Ecol. Res. 1, 165–175. doi: 10.1080/17451000510019132
Bejder, L., Hodgson, A., Loneragan, N., and Allen, S. J. (2012). Coastal dolphins in North-Western Australia: the need for re-evaluation of species listings and short-comings in the environmental impact assessment process. Pacific Conserv. Biol. 18, 22–25. doi: 10.1071/PC120022
Bejder, L., Samuels, A., Whitehead, H., Gales, N. M., Mann, J., Connor, R. C., et al. (2006). Decline in relative abundance of bottlenose dolphins exposed to long term disturbance. Conserv. Biol. 20, 1791–1798. doi: 10.1111/j.1523-1739.2006.00540.x
Bejder, L., Videson, S., Hermannsen, M., Simon, M., Hanf, D. M., and Madsen, P. T. (2019). Low energy expenditure and resting behaviour of humpback whale mother-calf pairs highlights conservation importance of sheltered breeding areas. Sci. Rep. 9:771. doi: 10.1038/s41598-018-36870-7
Braulik, G., Natoli, A., Kiszka, J. J., Parra, G. J., Plön, S., and Smith, B. D. (2019). Tursiops aduncus. International Union for the Conservation of Nature. Available at: https://www.iucnredlist.org/species/41714/50381127 (accessed December 2019).
Brown, A., Bejder, L., Cagnazzi, D., Parra, G. J., and Allen, S. J. (2012). The North West Cape, Western Australia: a potential hotspot for Indo-Pacific humpback dolphins ‘Sousa Chinensis’? Pacific Conserv. Biol. 18, 240–246. doi: 10.1071/PC120240
Brown, A., Bejder, L., Pollock, K. H., and Allen, S. J. (2016). Site-Specific assessments of the abundance of three inshore dolphin species to inform conservation and management. Front. Mar. Sci. 3:4. doi: 10.3389/fmars.2016.00004
Browning, N. E., McCulloch, S. D., Bossart, G. D., and Worthy, G. A. J. (2014). Fine-scale population structure of estuarine bottlenose dolphins (Tursiops truncatus) assessed using stable isotope ratios and fatty acid signature analyses. Mar. Biol. 161, 1307–1317. doi: 10.1007/s00227-014-2420-z
Buckstaff, K. C. (2004). Effects of watercraft noise on the acoustic behaviour of bottlenose dolphin, Tursiops truncatus, in Sarasota Bay, Florida. Mar. Mammal Sci. 20, 709–725. doi: 10.1111/j.1748-7692.2004.tb01189.x
Burnham, K. P., and Anderson, D. R. (2002). Model Selection and Multimodel Inference: A Practical Information-Theoretic Approach. Berlin: Springer.
Cagnazzi, D., Fossi, M. C., Parra, G. J., Harrison, P. L., Maltese, S., Coppola, D., et al. (2013a). Anthropogenic contaminants in Indo-Pacific humpback and Australian snubfin dolphins from the central and southern Great Barrier Reef. Environ. Pollut. 182, 490–494. doi: 10.1016/j.envpol.2013.08.008
Cagnazzi, D., Parra, G. J., Westley, S., and Harrison, P. L. (2013b). At the heart of the industrial boom: Australian snubfin dolphins in the Capricorn Coast, Queensland, need urgent conservation action. PLoS One 8:E56729. doi: 10.1371/journal.pone.0056729
CALM, and MPRA, (2005). Management Plan for the Ningaloo Marine Park and Muiron Islands Marine Management Area, 2005-2015. Perth: Western Australian Government.
Cardillo, M., Mace, G. M., Jones, K. E., Bielby, J., Bininda-Emonds, O. R. P., Sechrest, W., et al. (2005). Multiple causes of high extinction risk in large mammal species. Science 309, 1239–1241. doi: 10.1126/science.1116030
Chabanne, D., Finn, H., Salgado-Kent, C., and Bejder, L. (2012). Identification of a resident community of bottlenose dolphins (Tursiops aduncus) in the Swan Canning Riverpark, Western Australia, using behavioural information. Pacific Conserv. Biol. 18, 247–262. doi: 10.1071/PC120247
Chilvers, B. L., and Corkeron, P. J. (2001). Trawling and bottlenose dolphins’ social structure. Proc. R. Soc. Lond. Ser. B 268, 1901–1905. doi: 10.1098/rspb.2001.1732
Chilvers, B. L., Corkeron, P. J., and Puotinen, M. L. (2003). Influence of trawling on the behaviour and spatial distribution of Indo-Pacific bottlenose dolphins (Tursiops aduncus) in Moreton Bay, Australia. Can. J. Zool. 81, 1947–1955. doi: 10.1139/z03-195
Clark, G. F., and Johnston, E. L. (2016). Australia State of the Environment: Coasts. Canberra: Australian Government.
Clavel, J., Robert, A., Devictor, V., and Julliard, R. (2008). Abundance estimation with a transient model under the robust design. J. Wildl. Manag. 72, 1203–1210. doi: 10.2193/2006-328
Conn, P. B., Gorgone, A. M., Jugovich, A. R., Byrd, B. L., and Hansen, L. J. (2011). Accounting for transients when estimating abundance of bottlenose dolphins in Choctawhatchee Bay, Florida. J. Wildl. Manag. 75, 569–579. doi: 10.1002/jwmg.94
Connor, R. C., Mann, J., Tyack, P. L., and Whitehead, H. (1998). Social evolution in toothed whales. Trends Ecol. Evol. 13, 228–232. doi: 10.1016/S0169-5347(98)01326-3
Davidson, A. D., Hamilton, M. J., Boyer, A. G., Brown, J. H., and Ceballos, G. (2009). Multiple ecological pathways to extinction in mammals. Proc. Natl. Acad. Sci. U.S.A. 106, 10702–10705. doi: 10.1073/pnas.0901956106
DBCA, (2018). Ningaloo Reef World Heritage Area Visitor Guide. Western Australia: Department of Biodiversity, Conservation and Attractions.
DoE, (2015). A Coordinated National Research Frameowrk to Inform the Conservation and Management of Australia’s Tropical Inshore Dolphins: the Australian Snubfin Dolphin, Orcaella heinsohni, the Australian Humpback Dolphin, Sousa sahulensis and the Indo-Pacific Bottlenose Dolphin, Tursiops aduncus. Canberra: DOE.
DoEWHA, (2010). Ningaloo Coast: World Heritage Nomination. Canberra: Department of the Environment, Heritage and the Arts.
Dolman, S., Owen, D., Parsons, E. C. M., Simmonds, M. P., Swift, R., and Weilgart, L. (2003). Oceans of Noise. Chippenham: Whale and Dolphin Conservation Society.
Dulau, V., Estrade, V., and Fayan, J. (2017). Identifying key demographic parameters of a small island-associated population of Indo-Pacific bottlenose dolphins (Reunion, Indian Ocean). PLoS One 12:e0179780. doi: 10.1371/journal.pone.0179780
Dwyer, S. L., Kozmian-Ledward, L., and Stockin, K. A. (2014). Short-term survival of severe propellor strike injuries and observations on wound progression in a bottlenose dolphin. New Zealand J. Mar. Freshw. Res. 48, 1–9. doi: 10.1080/00288330.2013.866578
Edwards, M. A., Nagy, J. A., and Derocher, A. E. (2009). Low site fidelity and home range drift in a wide-ranging, large Arctic omnivore. Anim. Behav. 77, 23–28. doi: 10.1016/j.anbehav.2008.09.025
Ergon, T., and Gardner, B. (2014). Separating mortality and emigration: modelling space use, dispersal and survival with robust-design spatial capture–recapture data. Methods Ecol. Evol. 5, 1327–1336. doi: 10.1111/2041-210X.12133
Fury, C. A., and Harrison, P. L. (2008). Abundance, site fidelity and range patterns of Indo-Pacific bottlenose dolphins (Tursiops aduncus) in two Australian subtropical estuaries. Mar. Freshw. Res. 59, 1015–1027. doi: 10.1071/MF08109
Gailey, G., and Karczmarski, L. (2012). DISCOVERY: Photo-Identification Data-Management s$Ystem for Individually Recognisable Animals. Hong Kong: University of Hong Kong.
Gilroy, J. T., Virzi, T., Boulton, R. L., and Lockwood, J. L. (2012). A new approach to the “apparent survival” problem: estimating true survival rates from mark-recapture studies. Ecology 93, 1509–1516. doi: 10.1890/12-0124.1
Gore, M. A., Frey, P. H., Ormond, R. F., Allan, H., and Gilkes, G. (2016). Use of photo-identification and mark-recapture methodology to assess basking shark (Cetorhinus maximus) Populations. PLoS One 11:e150160. doi: 10.1371/journal.pone.0150160
Gowans, S., Wursig, B., and Karczmarski, L. (2007). The social structure and strategies of delphinds: predictions based on an ecological framework. Adv. Mar. Biol. 53, 195–294. doi: 10.1016/S0065-2881(07)53003-8
Gupta, M., Joshi, A., and Vidya, T. N. C. (2017). Effects of social organization, trap arrangement and density, sampling scale, and population density on bias in population size estimation using some common mark-recapture estimators. PLoS One 12:e0173609. doi: 10.1371/journal.pone.0173609
Hanf, D. (2015). Species Distribution Modelling of Western Pilbara Inshore Dolphins. Dubai: Murdoch University.
Hanf, D. M., Hunt, T., and Parra, G. J. (2016). Humpback dolphins of western Australia: a review of current knowledge and recommendations for future management. Adv. Mar. Biol. 73, 193–218. doi: 10.1016/bs.amb.2015.07.004
Hanson, C. E., and McKinnon, A. D. (2009). Pelagic ecology of the Ningaloo region, Western Australia: influence of the leeuwin current. J. R. Soc. West. Aust. 92, 129–137.
Hanson, M. T., and Defran, R. H. (1993). The behavior and feeding ecology of the Pacific coast bottlenose dolphin, Tursiops truncatus. Aquatic Mammals 19, 127–142.
Hart, K. D. (1997). Foraging ecology and behavior of Atlantic bottlenose dolphins (Tursiops truncatus) in the Indian River Lagoon, Florida. Melbourne: Florida Institute of Technology.
Hartel, E. F., Constantine, R., and Torres, L. G. (2015). Changes in habitat use patterns by bottlenose dolphins over a 10-year period render static management boundaries ineffective. Aquatic Conserv. 25, aqc.2465. doi: 10.1002/aqc.2465
Hawkins, E. R., Harcourt, R. G., Bejder, L., Brooks, L., Grech, A., Christiansen, F., et al. (2017). Best practice framework and principles for monitoring the effect of coastal development on marine mammals. Front. Mar. Sci. 4:59. doi: 10.3389/fmars.2017.00059
Hines, J., Kendall, W. L., and Nichols, J. D. (2003). On the use of the robust design with transient capture-recapture models. Auk 120, 1151–1158. doi: 10.2307/4090285
Holt, E. (2009). “Marine protected areas,” in Encyclopedia of Marine Mammals, eds W. F. Perrin, B. Wursig, and J. G. M. Thewissen, (Cambridge, CA: Academic Press).
Hunt, T., Bejder, L., Allen, S. J., Rankin, R. W., Hanf, D. M., and Parra, G. J. (2017). Demographic characteristics of Australian humpback dolphins reveal important habitat toward the southwestern limit of their range. Endang. Spec. Res. 32, 71–88. doi: 10.3354/esr00784
Hunt, T. N. (2018). Demography, habitat use and social structure of Australian humpback dolphins (Sousa sahulensis) around the North West Cape, Western Australia: Implications for conservation and management. Doctor of Philosophy, Flinders University, Bedford Park SA.
Hunt, T. N., Allen, S. J., Bejder, L., and Parra, G. J. (2019). Assortative interactions revealed in a fission-fusion society of Australian humpback dolphins. Behav. Ecol. 29, 1–14. doi: 10.1093/beheco/arz029
Jackson, J. B. C., Kirby, M. X., Berger, W. H., Bjorndal, K. A., Botsford, L. W., Bourque, B. J., et al. (2001). Historical overfishing and the recent collapse of coastal ecosystems. Science 293, 629–638.
Jefferson, T. A., Hung, S. K., and Wursig, B. (2009). Protecting small cetaceans from coastal development: impact assessment and mitigation experience in Hong Kong. Mar. Policy 33, 305–311. doi: 10.1016/j.marpol.2008.07.011
Jones, M. M. (1995). Fishing debris in the Australian marine environment. Mar. Pollut. Bull. 30, 25–33. doi: 10.1016/0025-326X(94)00108-L
Kangs, M., McCrea, J., Fletcher, W., Sporer, E., and Weir, V. (2006). “Exmouth gulf prawn trawl fishery,” in ESD Report Series, (Nandanam: Department of Fisheries).
Karczmarski, L., Huang, S., Wong, W. H., Chang, W. L., Chan, S. C. Y., and Keith, M. (2017). Distribution of a coastal delphinid under the impact of long term habitat loss: Indo-Pacific humpback dolphins off Taiwan’s west coast. Estuar. Coasts 40, 594–603. doi: 10.1007/s12237-016-0146-5
Kendall, W. L., and Bjorkland, R. (2001). Using open robust design models to estimate temporary emigration from capture-recapture data. Biometrics 57, 1113–1122. doi: 10.1111/j.0006-341X.2001.01113.x
Kiszka, J. J., Heithaus, M. R., and Wirsing, A. J. (2015). Behavioural drivers of the ecological roles and importance of marine mammals. Mar. Ecol. Prog. Ser. 523, 267–281. doi: 10.3354/meps11180
Kiszka, J. J., Simon-Bouhet, B., Gastebois, C., Pusineri, C., and Ridoux, V. (2012). Habitat partitioning and fine scale population structure among insular bottlenose dolphins (Tursiops aduncus) in a tropical lagoon. J. Exp. Mar. Biol. Ecol. 41, 176–184. doi: 10.1016/j.jembe.2012.03.001
Krebs, C. J. (2015). One hundred years of population ecology: Successes, failures and the road ahead. Integr. Zool. 10, 233–240. doi: 10.1111/1749-4877.12130
Lafontaine, A., Drapeau, P., Fortin, D., and St-Laurent, M. H. (2017). Many places called home: the adaptive value of seasonal adjustments in range fidelity. J. Anim. Ecol. 86, 624–633. doi: 10.1111/1365-2656.12645
Lebreton, J., Burnham, K. P., Clobert, J., and Anderson, D. R. (1992). Modelling survival and testing biological hypotheses using marked animals: a unified approach with case studies. Ecol. Monogr. 62, 67–118. doi: 10.2307/2937171
Lotze, H. K., Flemming, J. M., and Magera, A. M. (2017). Critical factors for the recovery of marine mammals. Conserv. Biol. 31, 1301–1311. doi: 10.1111/cobi.12957
Lusseau, D., Wilson, B., Hammond, P. S., Grellier, K., Durban, J. W., Parsons, K. M., et al. (2006). Quantifying the influence of sociality on population structure in bottlenose dolphins. J. Anim. Ecol. 75, 14–24. doi: 10.1111/j.1365-2656.2005.01013.x
Mann, J. (1999). Behavioral sampling methods for cetaceans: a review and critique. Mar. Mammal Sci. 15, 102–122. doi: 10.1111/j.1748-7692.1999.tb00784.x
Maxwell, S. M., Hazen, E. L., Bograd, S. J., Halpern, B. S., Breed, G. A., Nickel, B., et al. (2013). Cumulative human impacts on marine predators. Nat. Commun. 4:3688. doi: 10.1038/ncomms3688
Möller, L. M., Allen, S. J., and Harcourt, R. G. (2002). Group characteristics, site fidelity and seasonal abundance of bottlenose dolphins Tursiops aduncus in Jervis Bay and Port Stephens, south-eastern Australia. Aust. Mammal. 24, 11–22. doi: 10.1071/AM02011
Nicholson, K., Bejder, L., Allen, S. J., Krützen, M., and Pollock, K. H. (2012). Abundance, survival and temporary emigration of bottlenose dolphins (Tursiops sp.) off useless loop in the western gulf of Shark Bay, Western Australia. Mar. Freshw. Res. 63, 1059–1068. doi: 10.1071/MF12210
Parra, G. J. (2006). Resource partitioning in sympatric delphinids: Space use and habitat preferences of Australian snubfin and Indo-Pacific humpback dolphins. J. Anim. Ecol. 75, 862–874. doi: 10.1111/j.1365-2656.2006.01104.x
Passadore, C., Möller, L. M., Diaz-Aguirre, F., and Parra, G. J. (2018). High site fidelity and restricted ranging patterns in southern Australian bottlenose dolphins. Ecol. Evol. 8, 242–256. doi: 10.1002/ece3.3674
Pitcher, C. R., Ellis, N., Jennings, S. H., Jan, G., Mazor, T., Kaiser, M. J., et al. (2016). Estimating the sustainability of towed fishing-gear impacts on seabed habitats: a simple quantitative risk assessment method applicable to data-limited fisheries. Methods Ecol. Evol. 8, 472–480. doi: 10.1111/2041-210X.12705
Pitman, R. L., Totterdell, J. A., Fearnbach, H., Ballance, L. T., Durban, J. W., and Kemps, H. (2015). Whale killers: prevalence and ecological implications of killer whale predation on humpback whale calves off Western Australia. Mar. Mammal Sci. 31, 629–657. doi: 10.1111/mms.12182
Pollock, K. H. (1982). A capture-recapture design robust to unequal probability of capture. J. Wildl. Manag. 46, 752–757.
Pollock, K. H., Nichols, J. D., Brownie, C., and Hines, J. (1990). Statistical inference for capture-recapture experiments. Wildl. Monogr. 107, 1–98.
Preen, A. R., Marsh, H., Lawler, I. R., Prince, R. I. T., and Shepherd, R. (1997). Distribution and abundance of dugongs, turtles, dolphins and other megafauna in shark bay, Ningaloo reef and Exmouth Gulf, Western Australia. Wildl. Res. 24, 185–208. doi: 10.1071/WR95078
R Core Team, (2018). R: A Language and Environment for Statistical Computing. Vienna: R Foundation for Statistical Computing.
Raudino, H., Douglas, C., and Waples, K. (2018). How many dolphins live near a coastal development? Region. Stud. Mar. Sci. 19, 25–32. doi: 10.1016/j.rsma.2018.03.004
Raudino, H., Rob, D., Barnes, P., Mau, R., Wilson, E., Gardner, S., et al. (2016). Whale shark behavioural responses to tourism interactions in Ningaloo Marine Park and implications for future management. Conserv. Sci. West. Aust. 10:2.
Richards, S. A. (2008). Dealing with overdispersed count data in applied ecology. J. Appl. Ecol. 45, 218–227. doi: 10.1111/j.1365-2664.2007.01377.x
Ross, G. J. B. (2006). Review of the Conservation Status of Australia’s Smaller Whales and Dolphins. Canberra: Australian Government.
Rossbach, K. A., and Herzing, D. L. (1999). Inshore and offshore bottlenose dolphin (Tursiops truncatus) communities distinguished by association patterns near Grand Bahama Island. Bahamas. Can. J. Zool. 77, 581–592. doi: 10.1139/z99-018
Santos-Carvallo, M., Sepulveda, M., Moraga, R., Landaeta, M. F., Oliva, D., and Perez-Alvarez, M. J. (2018). Presence, behavior, and resighting pattern of transient bottlenose dolphins (Tursiops truncatus) in the humboldt current system off north-central chile. Pacific Sci. 72, 41–56. doi: 10.2984/72.1.3
Sanzogni, R. L., Meekan, M. G., and Meeuwig, J. J. (2015). Multi-year impacts of ecotourism on whale shark (Rhincodon typus) visitation at Ningaloo Reef, Western Australia. PLoS One 10:E0127345. doi: 10.1371/journal.pone.0127345
Schaub, M., Gimenez, O., Sierra, A., and Arlettaz, R. (2007). Use of integrated modelling to enhance estimates of population dynamics obtained from limited data. Conserv. Biol. 21, 945–955. doi: 10.1111/j.1523-1739.2007.00743.x
Schaub, M., and Royle, J. A. (2014). Estimating true instead of apparent survival using spatial Cormack–Jolly–Seber models. Methods Ecol. Evol. 5, 1316–1326. doi: 10.1111/2041-210X.12134
Schwarz, C., and Arnason, A. (1996). A general methodology for the analysis of open-model capture recapture experiments. Biometrics 52, 860–873. doi: 10.2307/2533048
Shane, S. H., Wells, R. S., and Wursig, B. (1986). Ecology, behavior and social organisation of the bottlenose dolphin: a review. Mar. Mammal Sci. 2, 34–63. doi: 10.1111/j.1748-7692.1986.tb00026.x
Shaughnessy, P., Kirkwood, R., Cawthorn, M., Kemper, C. M., and Pemberton, D. (2003). Pinnipeds, Cetaceans and Fisheries in Australia: A Review of Operational Interactions. Collingwood: CSIRO Publishing.
Silva, M. A., Magalhaes, S., Prieto, R., Santos, R. S., and Hammond, P. S. (2009). Estimating survival and abundance in a bottlenose dolphin population taking into account transience and temporary emigration. Mar. Ecol. Prog. Ser. 392, 263–276. doi: 10.3354/meps08233
Silva, M. A., Prieto, R., Magalhaes, S., Seabra, M. I., Santos, R. S., and Hammond, P. S. (2008). Ranging patterns of bottlenose dolphins living in oceanic waters: implications for population structure. Mar. Biol. 156, 179–192. doi: 10.1007/s00227-008-1075-z
Sleeman, J., Meekan, M., Wilson, S. G., Jenner, C. K. S., Jenner, M. N., Boggs, G. S., et al. (2007). Biophysical correlates of relative abundance of marine megafauna at Ningaloo Reef, Western Australia. Mar. Freshw. Res. 58, 608–623. doi: 10.1071/MF06213
Smith, H., Pollock, K. H., Waples, K., Bradley, S., and Bejder, L. (2013). Use of the robust design to estimate seasonal abundance and demographic parameters of a coastal bottlenose dolphin (Tursiops aduncus) population. PLoS One 8:e0076574. doi: 10.1371/journal.pone.0076574
Sokal, R. R., and Rohlf, F. J. (1962). The comparison of dendrograms by objective methods. Taxon 11, 33–40. doi: 10.2307/1217208
Stanley, T., and Burnham, K. P. (1999). A closure test for time-specific capture-recapture data. Environ. Ecol. Stat. 6, 197–209. doi: 10.1023/A:1009674322348
Storelli, M. M., and Marcotrigiano, G. O. (2000). Environmental contamination in bottlenose dolphin (Tursiops truncatus): relationship between levels of metals, methylmercury and organochlorine compounds in an adult female, her neonate and a calf. Bull. Environ. Contamin. Toxicol. 64, 333–340. doi: 10.1007/s001280000004
Switzer, P. V. (1993). Site fidelity in predictable and unpredictable habitats. Evol. Ecol. 7, 533–555. doi: 10.1007/bf01237820
Thompson, W. L., White, G. C., and Gowan, C. (1998). Monitoring Vertebrate Populations. Cambridge, MA: Academic Press.
Tschopp, A., Ferrari, M. A., Crespo, E., and Coscarella, M. (2018). Development of a site fidelity index based on population recapture data. PeerJ 6:e4782. doi: 10.7717/peerj.4782
Urian, K. W., Hofmann, S., Wells, R. S., and Read, A. J. (2009). Fine-scale population structure of bottlenose dolphins (Tursiops truncatus) in Tampa Bay. Florida. Mar. Mammal Sci. 25, 619–638. doi: 10.1111/j.1748-7692.2009.00284.x
Webster, I., Cockcroft, V., and Cadinouche, A. (2014). Abundance of the indo-pacific bottlenose dolphin Tursiops aduncus off south-west Mauritius. Afr. J. Mar. Sci. 36, 293–301.
Wells, R. S. (1986). “Population structure of bottlenose dolphins: behavioral studies along the central west coast of Florida,” in Contract Report to National Marine Fisheries Service, Southeast Fisheries Center, Contrat N°.45-WCNF-5-00366, Seattle, WA.
Wells, R. S., and Scott, M. D. (1997). Seasonal incidence of boat strikes on bottlenose dolphins near Sarasota. Florida. Mar. Mammal Sci. 13, 475–480. doi: 10.1111/j.1748-7692.1997.tb00654.x
Wells, R. S., Scott, M. D., and Irvine, A. (1987). The social structure of free-ranging bottlenose dolphins. Curr. Mammol. 1, 247–305. doi: 10.1007/s10071-019-01274-1
White, G. C., and Burnham, K. P. (1999). Program MARK: Survival estimation from populations of marked animals. Bird Study 46, S120–S139. doi: 10.1080/00063659909477239
Williams, B. K., Nichols, J. D., and Conroy, M. J. (2002). Analysis and Management of Animal Populations: Modeling, Estimation and Decision Making. San Diego, CA: Academic Press.
Wirsing, A. J., Heithaus, M. R., Frid, A., and Dill, L. M. (2008). Seascapes of fear: evaluating sublethal predator effects experienced and generated by marine mammals. Mar. Mammal Sci. 24, 1–15. doi: 10.1111/j.1748-7692.2007.00167.x
Zanardo, N., Parra, G. J., and Moller, L. M. (2016). Site fidelity, residency, and abundance of bottlenose dolphins (Tursiops sp.) in Adelaide’s coastal waters, South Australia. Mar. Mammal Sci. 32, 1381–1401. doi: 10.1111/mms.12335
Keywords: abundance, site fidelity, Ningaloo Reef, Exmouth Gulf, Indo-Pacific bottlenose dolphins, Tursiops aduncus, capture-recapture
Citation: Haughey R, Hunt T, Hanf D, Rankin RW and Parra GJ (2020) Photographic Capture-Recapture Analysis Reveals a Large Population of Indo-Pacific Bottlenose Dolphins (Tursiops aduncus) With Low Site Fidelity off the North West Cape, Western Australia. Front. Mar. Sci. 6:781. doi: 10.3389/fmars.2019.00781
Received: 07 August 2019; Accepted: 03 December 2019;
Published: 28 January 2020.
Edited by:
Ana Micaela Martins Sequeira, The University of Western Australia, AustraliaReviewed by:
Chandra Paulina Salgado Kent, Curtin University, AustraliaVanessa Jordan Mintzer, Galveston Bay Foundation, United States
Copyright © 2020 Haughey, Hunt, Hanf, Rankin and Parra. This is an open-access article distributed under the terms of the Creative Commons Attribution License (CC BY). The use, distribution or reproduction in other forums is permitted, provided the original author(s) and the copyright owner(s) are credited and that the original publication in this journal is cited, in accordance with accepted academic practice. No use, distribution or reproduction is permitted which does not comply with these terms.
*Correspondence: Rebecca Haughey, cmViZWNjYS5oYXVnaGV5QGZsaW5kZXJzLmVkdS5hdQ==