
95% of researchers rate our articles as excellent or good
Learn more about the work of our research integrity team to safeguard the quality of each article we publish.
Find out more
ORIGINAL RESEARCH article
Front. Mar. Sci. , 12 December 2019
Sec. Marine Fisheries, Aquaculture and Living Resources
Volume 6 - 2019 | https://doi.org/10.3389/fmars.2019.00748
 Valentina R. Córdova-Alarcón1,2
 Cristián Araneda1
 Felipe Jilberto1
 Piero Magnolfi3
 María Isabel Toledo4
 Natalia Lam1*
The red cusk-eel (Genypterus chilensis, Guichenot, 1848) is an iconic species in Chilean gastronomy, with a cultural significance that extends beyond its economic value, worthy of conservation. Despite the decline in fishery productivity across most of the distribution range for this species, little effort has been devoted to assessing stock management. In the present study, seven heterologous microsatellite loci (cmrGb3.8.1, cmrGb5.2B, cmrGb4.2A, cmrGb4.2B, cmrGb5.9, cmrGb4.11, and cmrGb2.6.1) were genotyped in a total of 153 individuals from four locations in central and southern Chile (30.5–37.6°S), comprising ∼1,000 km of coastline. Five microsatellite loci were consistently amplified with a low frequency of null alleles (<2.5%). These markers showed high average heterozygosity (HO = 0.886 and HE = 0.884) and PIC (0.869). Significant genetic differentiation among locations (global FST = 0.043, global DJost = 0.252) suggested the presence of at least two genetic groups along the Chilean coast, with moderate levels of admixture between the two central populations (0.168 < Qmean < 0.822). The southern population showed no admixture with the central populations (Qmean = 0.985), less allelic richness and a small effective population size, indicating that urgent management measures must be developed for this fishery. The present study provides baseline information to assist fishery and aquaculture management and contribute to the recovery of declining populations.
Genypterus chilensis is an eel-like marine fish in the Ophidiidae family, endemic to the southeastern Pacific coast with a latitudinal distribution from Paita, Peru (5°05′S) to Chonos Archipelago, Chile (47°75′S) (Boré and Martínez, 1981). There is high demand for this fish in the local Chilean market, as it is an iconic species in Chilean gastronomy due to its nutritional value and taste. The red cusk-eel inhabits the rocky bottoms of the continental shelf at a depth of 20–150 m, shelters in caves and displays gregarious behavior (Chocair et al., 1969). G. chilensis reaches a maximum length of 100–250 cm and body weight of 5–15 kg and is sexually dimorphic in size, with females larger than males (Colorado Chile S.A., 2016). This iteroparous, partial spawner has a pelagic larval life span of 30–45 days, similar to other benthic marine organisms (Chong and González, 2009; Marshall and Morgan, 2011; Toledo et al., 2017). The pelagic larvae are expected to be distributed by ocean currents over wide geographic areas, contributing to panmixia (Cowen et al., 2007; Rojas-Hernandez et al., 2016). Thus, this fish is thought to have limited genetic structure due to the lack of oceanographic barriers, which promotes connectivity.
Natural red cusk-eel populations have been under considerable fishing pressure in recent years. Overfishing, loss of habitat and climate change have likely led to a decline in population size and captures, with reported landings under 1,000 tons per year since 1998 (FAO, 2016/2018) (Figure 1). Furthermore, studies have shown that this species prefers to migrate to shallower waters for spawning (Toledo et al., 2017) and fishing activity largely coincides with the reproductive season (October–March) (Servicio Nacional de Pesca y Acuicultura, SERNAPESCA, 2016). Unfortunately, 75% of individuals captured are under the sexual maturity size of females, 72–92 cm (Tascheri et al., 2003; Chong and González, 2009). Although the reasons for the decline in red cusk-eel production are uncertain, efforts to recover these populations through sustainable production (e.g., development of aquaculture) are emerging (Colorado Chile S.A., 2016).
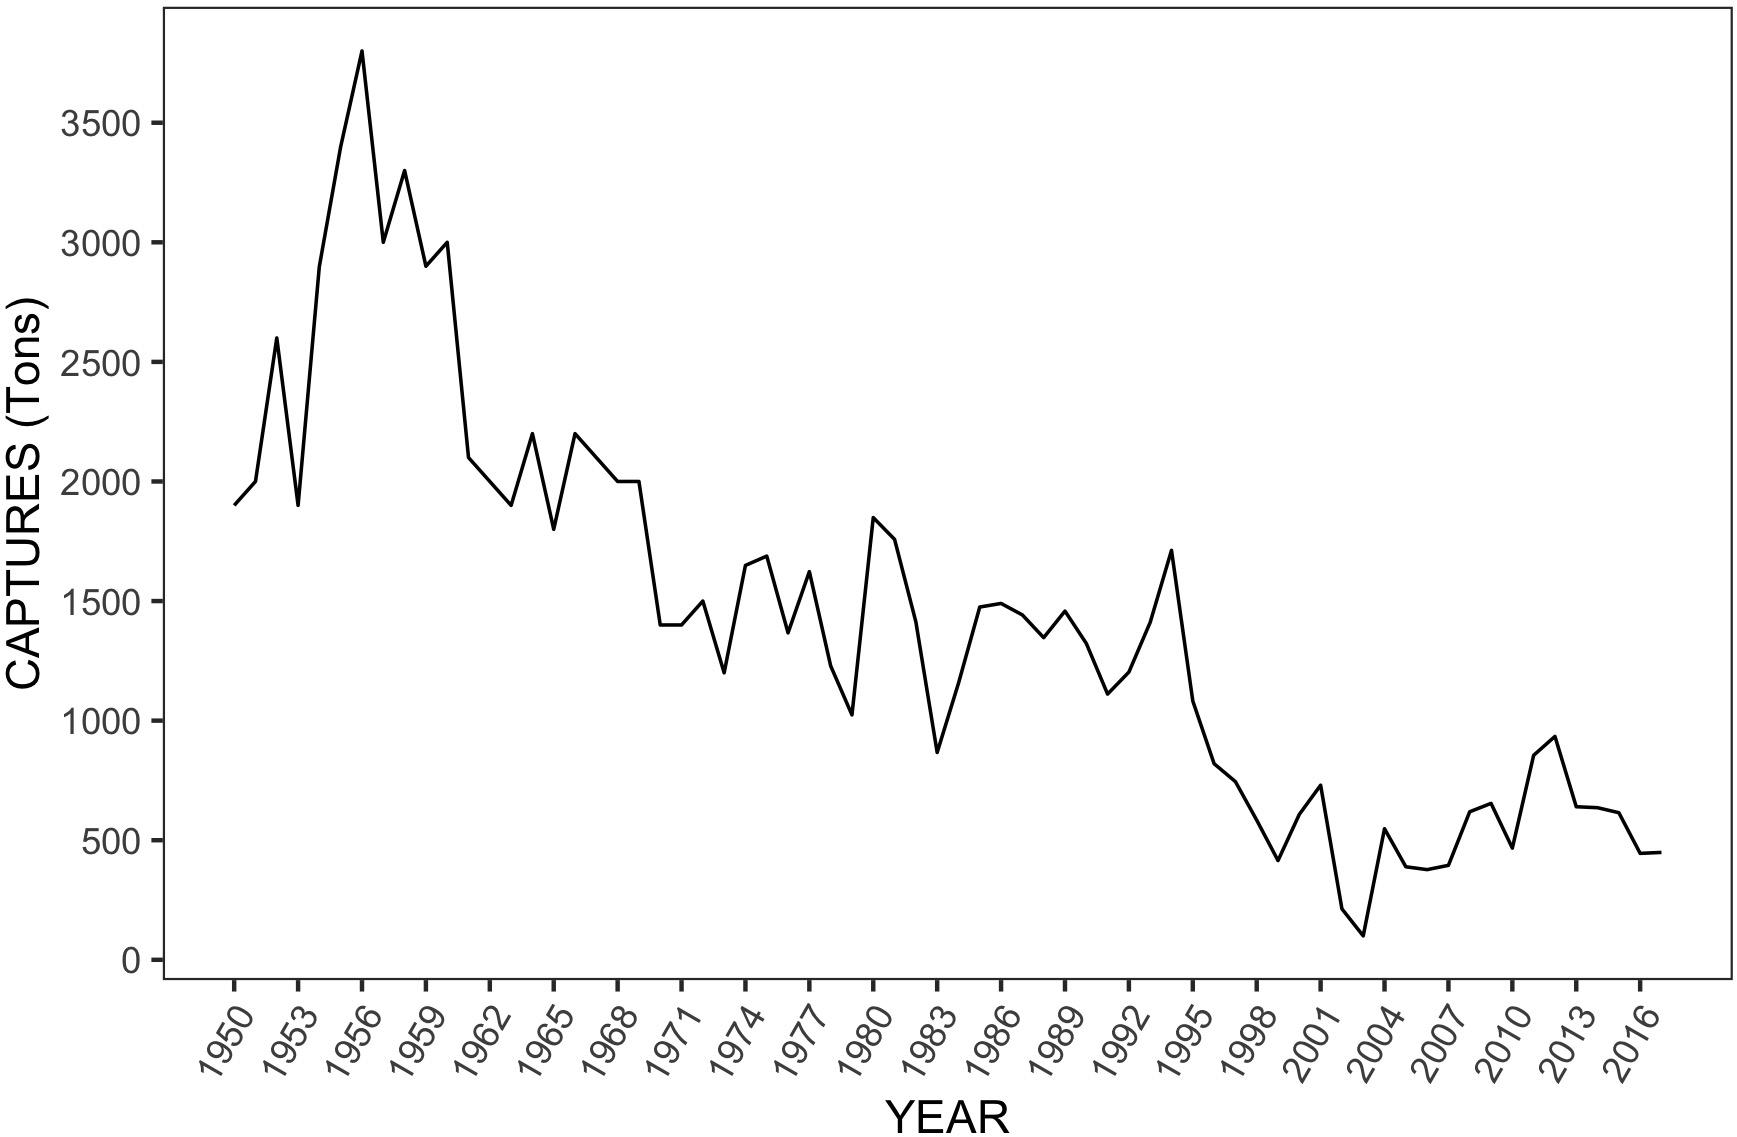
Figure 1. Reported captures of red cusk-eel in Chile from 1950 to 2017. Data obtained from FAO data base using FishStatJ©.
In Chile, stock assessment has been performed only for the most productive fisheries, leaving many endemic species, such as G. chilensis, unevaluated (Servicio Nacional de Pesca y Acuicultura, SERNAPESCA, 2016). Although a gap between population genetic research and conservation practices remains, genetic data has been successfully used to address assessment, management and conservation needs in many marine species for at least three decades in developed countries (Milner et al., 1985; Shaklee et al., 1999; Vera et al., 2016). However, implementing such strategies remains challenging in Chile.
In recent decades, genetic diversity and population structure have been assessed using microsatellites, one of the most widely used markers for conservation genetics, molecular ecology and population genetics studies in non-model species (Pérez-Espona and ConGRESS Consortium, 2017; Torres-Florez et al., 2017). Microsatellites are codominant, highly polymorphic and ostensibly neutral markers in natural populations, with mutation rates of 10–3–10–4 per generation (Ellegren, 2004; Lenstra et al., 2012). However, developing species-specific microsatellite markers is typically expensive and laborious. The application of cross-species microsatellite markers among closely related organisms is a common strategy used to mitigate these costs (Abdul-Muneer, 2014).
In Genypterus species, microsatellite loci were developed for the pink cusk-eel (Genypterus blacodes) and used in population structure studies in Australian waters (Ward and Reilly, 2001; Ward et al., 2001). These markers have also been used for assessing genetic diversity and differentiation in G. blacodes from Chilean waters (Canales-Aguirre et al., 2010a) and for cross-amplification in related species such as G. chilensis, Genypterus maculatus (Canales-Aguirre et al., 2010b) and, recently, Genypterus capensis (Henriques et al., 2017), using the same primer set. However, only a single geographic location has been studied for G. chilensis. Genetic characterization of wild populations is important for effective management and long-term sustainability of fisheries (Ward and Reilly, 2001) as well as for initiating the domestication process in newly aquacultured species (Lenstra et al., 2012). Therefore, these microsatellite studies must be extended to cover a wider geographic range, in line with the distribution of this species in Chile.
In this study, we describe the genetic diversity and population structure of G. chilensis from four Chilean locations (Coquimbo, Zapallar, Laguna Verde, and Lebu) along 1,000 km of coastline, with five microsatellite loci developed for G. blacodes (Ward and Reilly, 2001). This data will provide a baseline to inform decision-making for fisheries management of this species in Chile.
Fin clips of G. chilensis individuals (n = 153) caught by fishermen from four locations were collected and stored in 100% ethanol (Table 1 and Figure 2A). The selected locations show the highest fishing pressure for this resource, and the geographic scale comprise one third of the natural distribution of the species in Chile. Genomic DNA was extracted using the phenol-chloroform method according to the protocol described by Taggart et al. (1992). Concentration was evaluated using an EpochTM Microplate Spectrophotometer (BioTek Instruments, Inc., Winooski, VT, United States). The stock DNA was diluted to 20 ng/μL for PCR analysis.
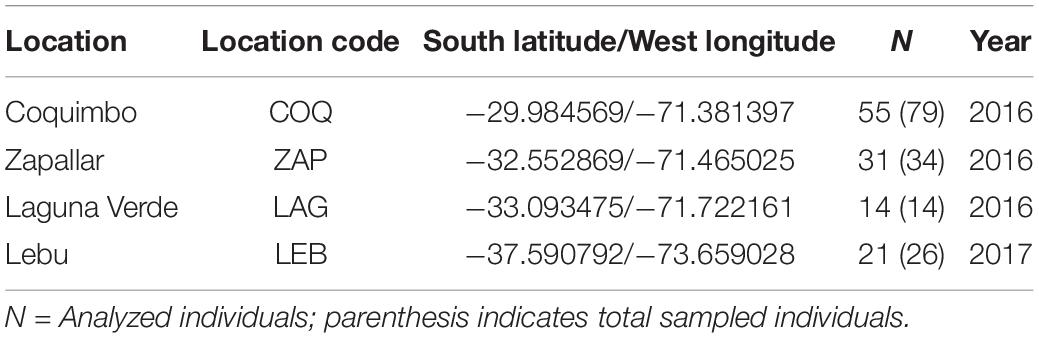
Table 1. Sampling location, coordinates and sample sizes (N) analyzed in this study.
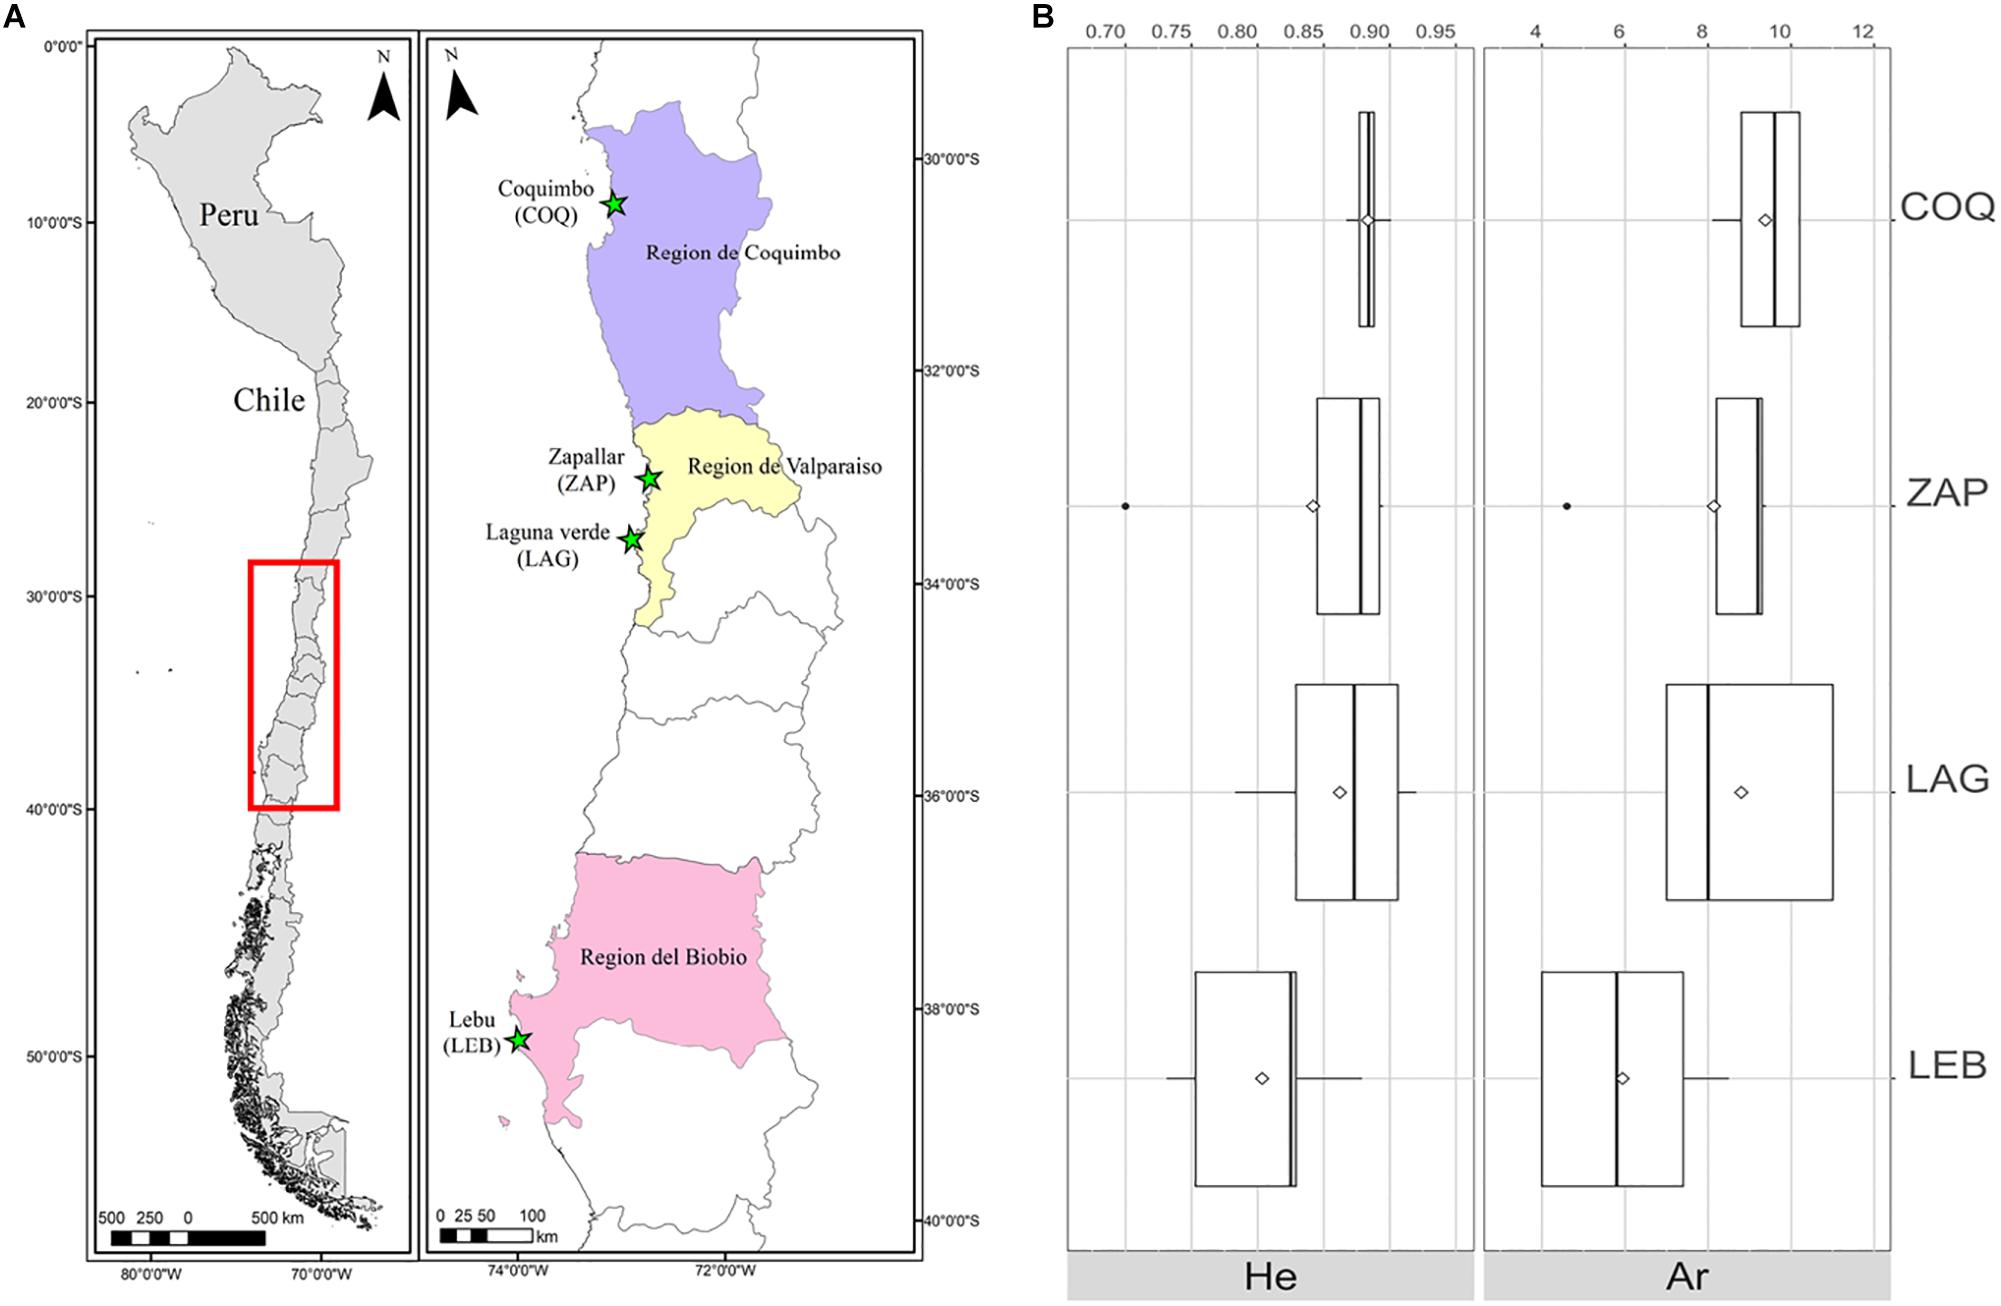
Figure 2. (A) Map of sampling locations in Chile. Stars show the four sampling locations across the Chilean coast, encompassing 1,000 kilometers of G. chilensis distribution range. (B) Boxplot of expected heterozygosity and Allelic richness per location. White diamonds represent the mean for each estimate.
Seven heterologous microsatellite loci isolated from G. blacodes (Ward and Reilly, 2001) were tested to assess allelic variation in G. chilensis (Supplementary Table S1). PCR reactions were performed following Ward and Reilly (2001) in a Gradient Palm-Cycler model CGI-96 (Corbett Life Science). Reaction mixtures were carried out in 15 μL containing 1× PCR reaction buffer, 1.5 mM of MgCl2, 200 μM of dNTPs, 0.4 μM of each primer, 0.5 U of DNA Taq polymerase (Thermo Fisher Scientific Inc.) and 20 ng of genomic DNA template. The thermal profile was: 95°C (3 min), followed by 35 cycles at 95°C (30 s), a marker-specific temperature (30 s) (Supplementary Table S1) and 72°C (30 s), with a final step at 72°C for 10 min. Microsatellite loci were genotyped using an automated fluorescence-based capillary electrophoresis system, Fragment AnalyzerTM (Advanced Analytical Technologies Inc.), using the dsDNA 901 Reagent Kit (35–500 bp) following manufacturer instructions. This kit resolves 2-bp size differences in DNA fragments. The data were normalized to a 35-bp lower marker and 500-bp upper marker and calibrated to the 75- to 400-bp range using PRO Size® 2.0 software (Advanced Analytical Technologies, Inc.). Negative controls (no DNA) were used in each run to check for laboratory contaminants.
To check for the presence of null alleles and scoring errors (large allele dropout and stuttering), genotype data were analyzed with MICRO-CHECKER 2.2.3 (Van Oosterhout et al., 2004). Loci cmrGb4.2A and cmrGb4.2B were discarded from further analysis due to a high proportion of null alleles (above 10%) in all locations except LEB, where cmrGb4.2B did not show a significant proportion of null alleles. Relatedness among individuals from each location was assessed with ML-RELATE (Kalinowski et al., 2006), discarding putative full siblings from further analysis.
Genetic diversity, assessed according to number of alleles (Na), and Nei’s (1987) unbiased gene diversity estimators as observed heterozygosity (HO), expected heterozygosity (HE) and polymorphism information content (PIC) for each locus, were estimated with CERVUS 3.0 (Kalinowski et al., 2007) and FSTAT 2.9.3 (Goudet, 2001). Comparisons of HE values across sampling locations were estimated with the Kruskal–Wallis test (Hollander and Wolfe, 1973). All loci were tested for deviations from Hardy-Weinberg expectations (HWE) using the FDR-BY correction method according to Narum (2006). Allelic richness was calculated by rarefaction method to account for uneven sample sizes using FSTAT 2.9.3 (Goudet, 2001) and compared across locations with a Kruskal–Wallis test, correcting for multiple testing using Gao’s method (Gao et al., 2008). To test the independent segregation of alleles, the linkage disequilibrium (LD) between each pair of loci by sample set was computed using Markov chain and Fisher’s procedures (10,000 dememorization steps; 1,000 batches; 10,000 iterations per batch) with GENEPOP v4.2 software (Rousset, 2008). Inbreeding coefficients (FIS) were computed with the R package diveRsity (Keenan et al., 2013).
Global and pairwise FST (Weir and Cockerham, 1984) and DJost (Jost, 2008) and 95% confidence intervals (95% CI) were estimated with the R package diveRsity using 10,000 permutations (Keenan et al., 2013). Two clustering methods were used to analyze the genetic population structure: (i) Discriminant analysis of principal components (DAPC) was implemented in the R package adegenet 2.1.0 (Jombart, 2008; Jombart et al., 2010). This analysis was performed without prior information regarding the population of the individual, using the find.clusters function. The number of clusters (K) was determined according to the lowest Bayesian information criterion (BIC) value. (ii) Bayesian analysis was implemented in STRUCTURE 2.3.4 (Pritchard et al., 2000), assuming the admixture model and correlated allele frequencies between clusters. One hundred runs from K = 1 to K = 7 with 100,000 burning periods and 1,000,000 MCMC repeats after burning were performed. To account for uneven sampling, STRUCTURE was run as described above on a random subsample of the data with 18 individuals per sampling location (except for LAG, N = 12). The optimum K value was assessed through analysis of the LnP(K) distribution plots using the Evanno method (Evanno et al., 2005), implemented using the STRUCTURE Harvester webpage (Earl and vonHoldt, 2012). The number of clusters was also estimated with the “MedMeaK,” “MaxMeaK,” “MedMedK,” and “MaxMedK” methods as described by Puechmaille (2016) for uneven sampling of the locations studied, using the whole data set. Scenarios from K = 2 to K = 7 were explored with CLUMPAK (Kopelman et al., 2015).
The assignment power of microsatellites was evaluated with GenoDive through leave-one-out tests (LOO) (Meirmans and Van Tienderen, 2004). In this supervised method, individuals are assigned to a population if the probability of assignment to that population is higher than to any other population (Araneda et al., 2016).
Finally, an isolation-by-distance (IBD) analysis using a Mantel test (Rousset, 1997) was performed on FST(1−FST) and the logarithm of geographic distance along the coast between pairs of locations, with 10,000 permutations, using the ISOLDE program and implemented in GENEPOP on the web1.
Contemporary effective population size (Ne) was estimated using LDNe (Waples and Do, 2008) with the LD model, random mating and a minimum allele frequency cutoff (Pcrit = 0.03) according to the recommendations of Waples and Do (2010) for small sample sizes. For this analysis, groups identified in STRUCTURE were set as separate populations. We also tested for a recent bottleneck using BOTTLENECK v1.2.02 (Piry et al., 2004) with the Wilcoxon test, based on 100,000 iterations using a stepwise mutation model (SMM), infinite allele model (IAM) and two-phase mutation model (TPM) (set at 70% SMM, 30% IAM).
A total of 153 individuals were genotyped. However, to avoid a Wahlund effect and overestimation of population structure, 34 samples were excluded from further analysis due to close relatedness between individuals from the same location (rxy > 0.45). The final dataset consisted of 119 individuals genotyped for five loci from four different sampling locations on the Chilean coast.
Average relatedness between pairs of individuals from the same location was not significantly higher than between pairs of individuals from different locations, at 0.1436 ± 0.0954 and 0.0569 ± 0.0349, respectively (p = 0.0667). However, the average relatedness within the LEB individuals was significantly higher than within individuals from the other locations (p < 0.05).
A total of 76 alleles were identified across all samples, with an average of 15 alleles per locus, ranging from 9 (cmrGb5.2B) to 20 (cmrGb4.11B) (Tables 2, 3). Five private alleles with a frequency above 5% were identified in LEB samples at loci cmrGb4.11B and cmrGb2.6.1 (Supplementary Tables S11, S12). All loci were highly polymorphic within each sampling location. The mean PIC values across all locations ranged from 0.819 (cmrGb3.8.1) to 0.906 (cmrGb5.2B) (Table 2). No significant deviations from HWE nor evidence of LD by locus or locus pair across locations were detected, respectively, after FDR-BY correction.
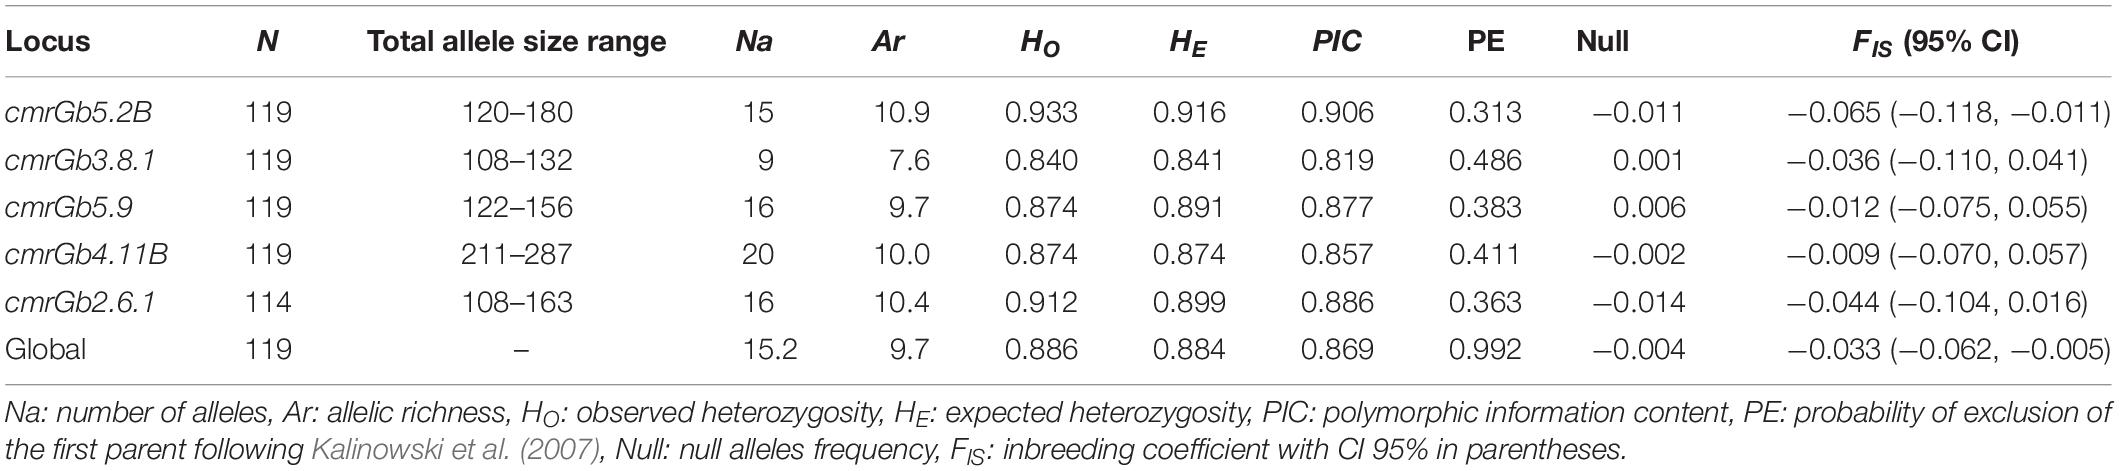
Table 2. Global genetic diversity estimators by locus in all analyzed samples (n = 153) of Genypterus chilensis in the coast of Chile using 5 SSR loci.
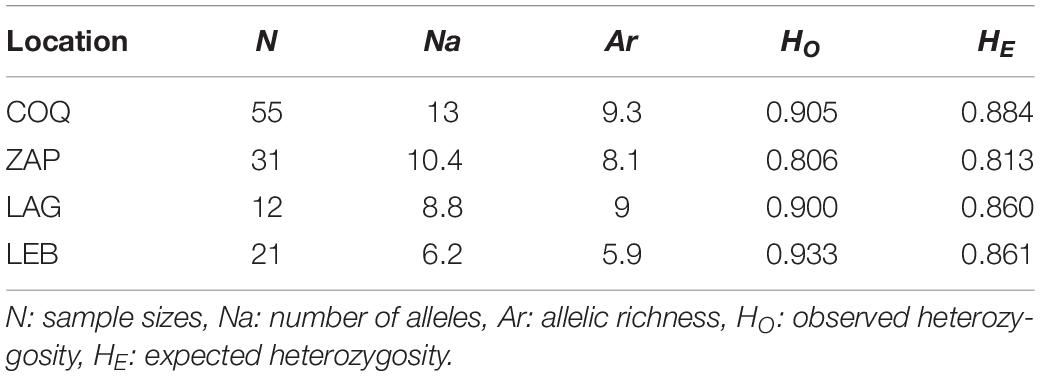
Table 3. Mean genetic diversity estimates of G. chilensis per location.
Expected heterozygosities (HE) were similar among locations (p > 0.05), ranging from 0.700 (cmrGb3.8.1, ZAP) to 0.920 (cmrGb5.2B, LAG) (Figure 2B and Supplementary Tables S2–S5), suggesting high genetic variability. The global allelic richness (Ar) estimated for a minimum sample size of 12 individuals ranged from 7.6 (cmrGb3.8.1) to 10.9 (cmrG5.2B) alleles (Figure 2B and Supplementary Tables S2, S5); however, LEB samples (Ar = 5.9) showed significantly lower allelic richness than COQ samples (Ar = 9.3) (p = 0.022) (Table 3). The average number of alleles (Na) per location ranged from 4 (cmrGb5.2B and cmrGb5.9, LEB) to 16 (cmrGB4.11B, COQ) (Supplementary Tables S2–S5).
The LEB sample showed modest but significant genetic differentiation from the other locations, with an FST ranging from 0.078 between LEB and COQ to 0.106 between LEB and ZAP, and DJost values ranging from 0.311 between LEB and COQ to 0.459 between LEB and ZAP (Table 4). The global FST value indicated that 4.3% (95% CI: 0.013, 0.044) of the total allele frequency variance lay among sampling locations, while 95.7% was explained by variation within locations. To test whether the genetic differentiation between LEB and the other populations might be driven by a single microsatellite marker, we performed a jackknife analysis to recalculate FST, obtaining similar results each time (p > 0.05). The global DJost also indicates population structure: 0.252 (95% CI: 0.110, 0.425).
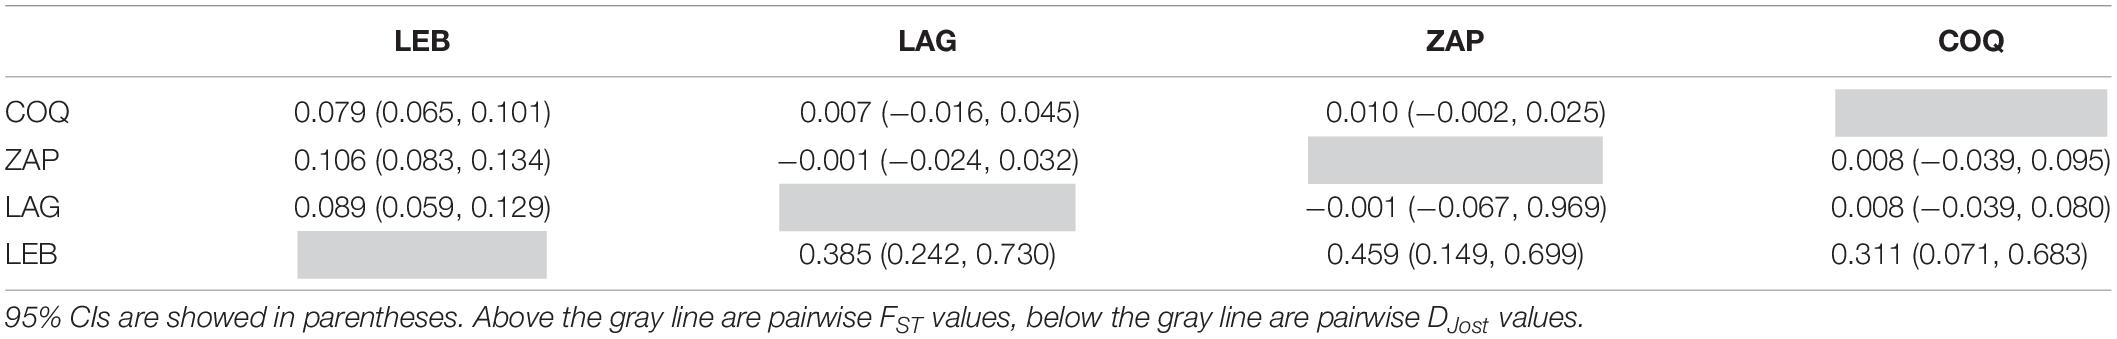
Table 4. Pairwise differentiation estimators between Genypterus chilensis localities in the coast of Chile.
The elbow of the BIC values in the DAPC with no prior individual population information was for K = 2, with three discriminant functions extracted with 40 principal components retaining 94.3% of conserved variance (Figure 3). LEB samples clustered separately with the first principal component. The populations from central Chile clustered in only one group when no a priori population information was used (Supplementary Table S6).
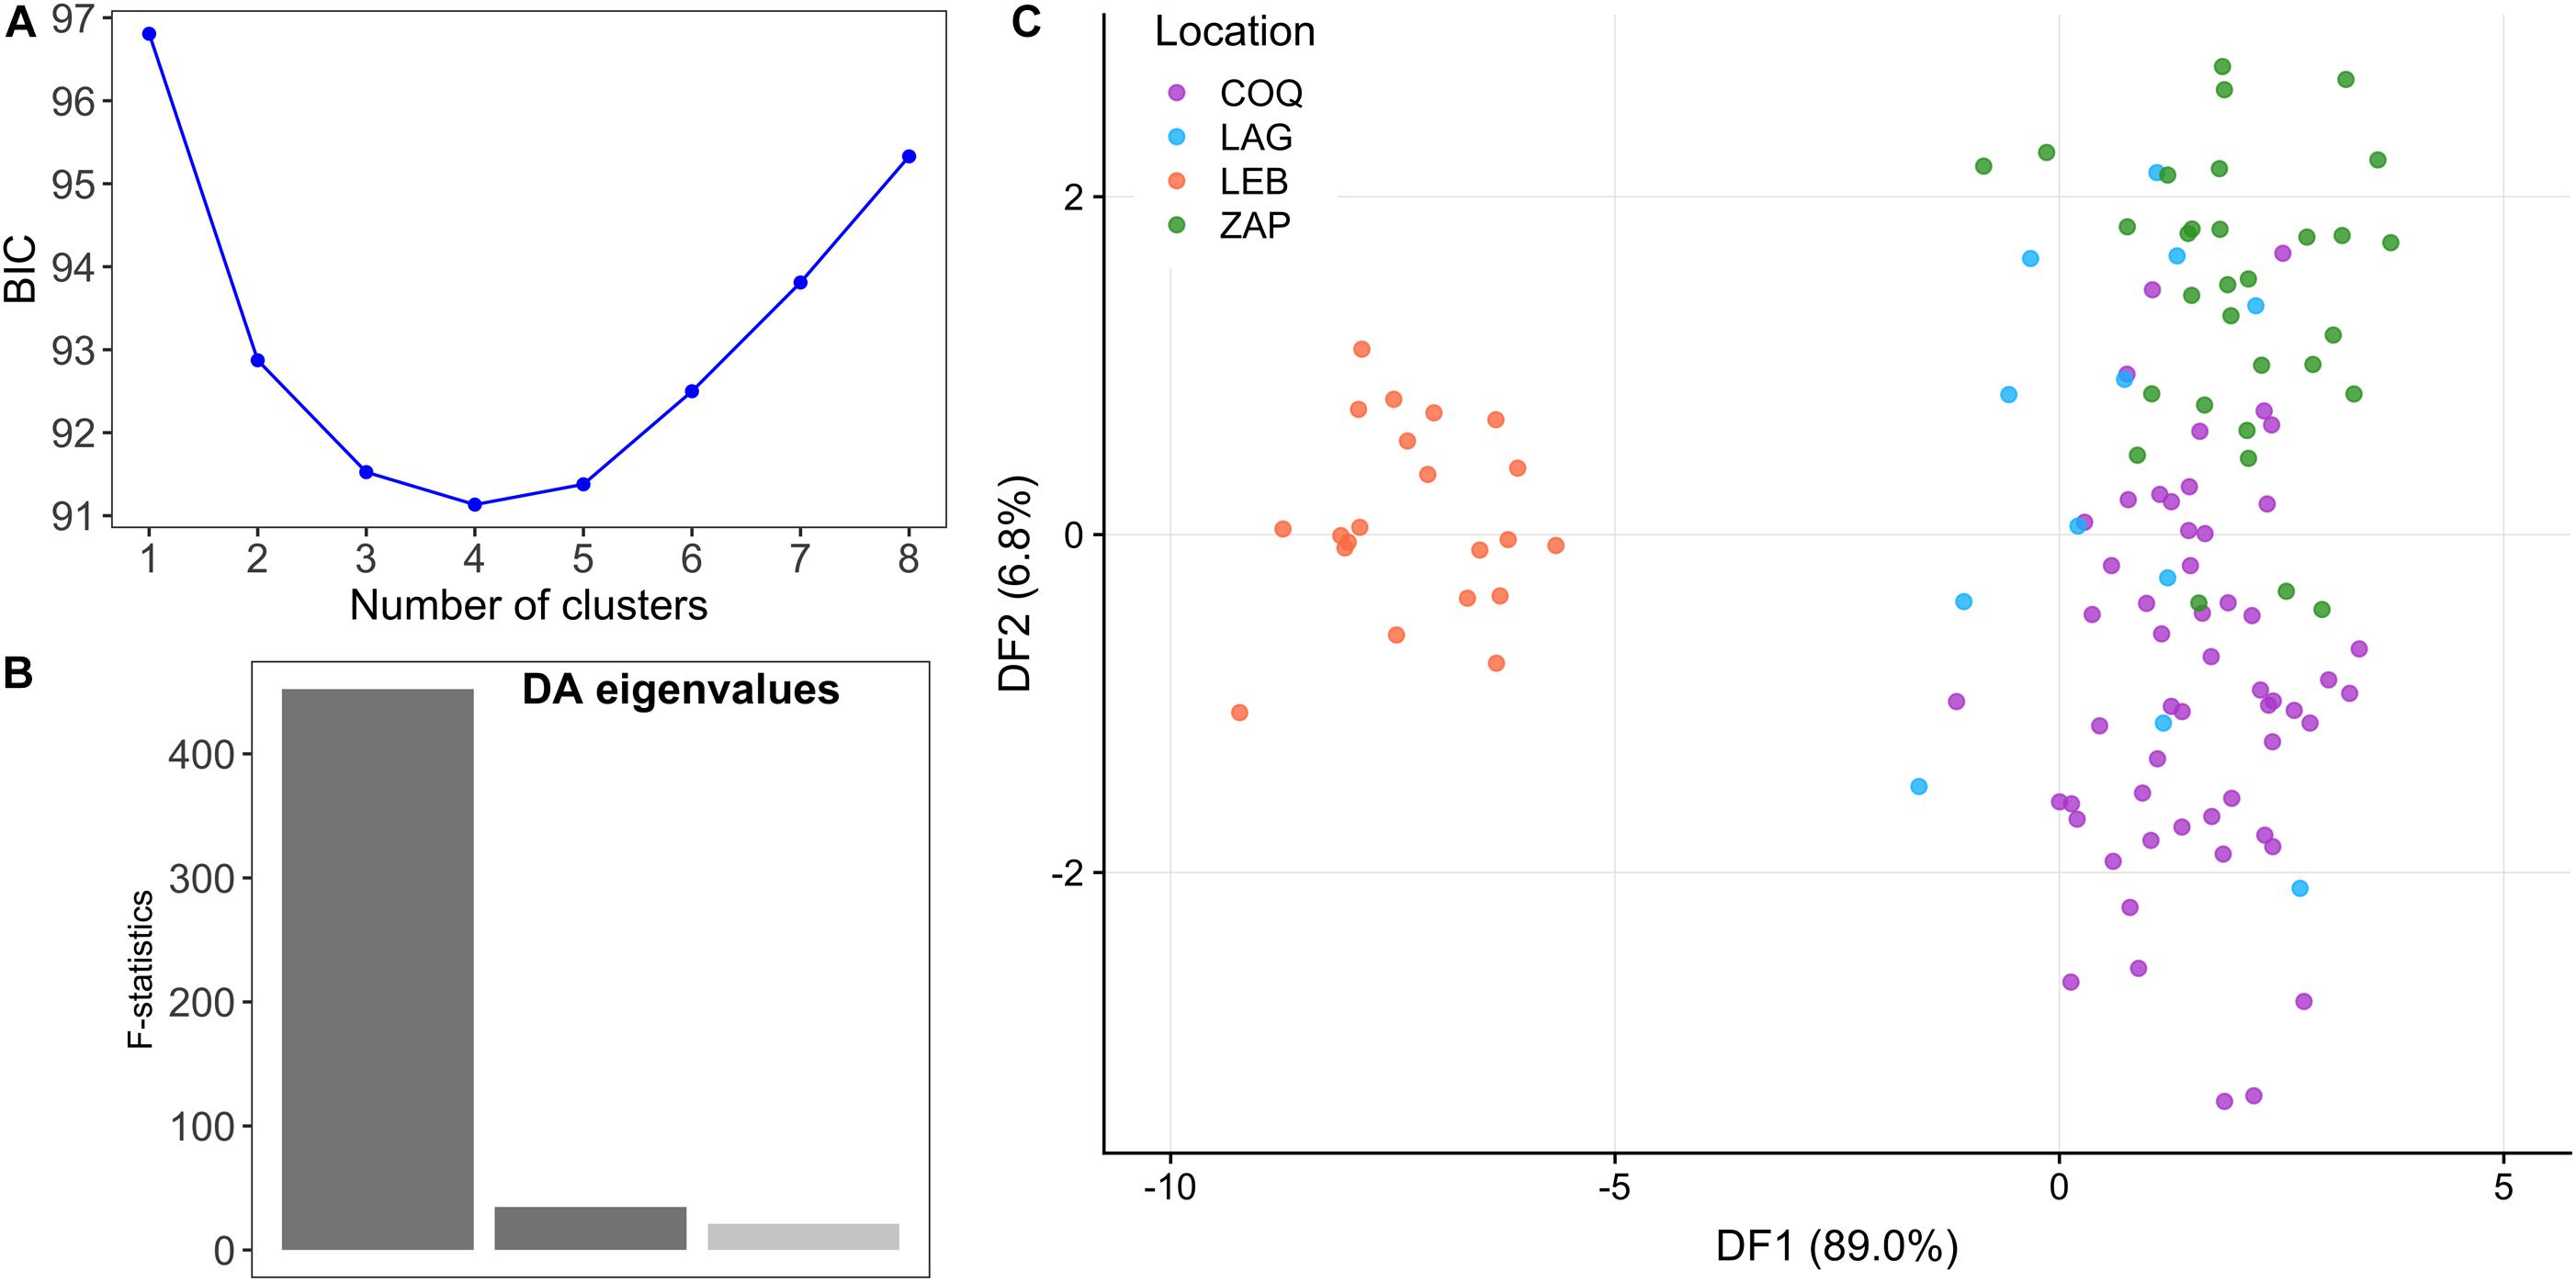
Figure 3. Discriminant analysis of principal components. (A) Bayesian Information criterion (BIC) values for increasing values of K, indicate that the number of clusters in the date set is between 2 and 4. (B) Discriminant analysis eigenvalues of the three retained discriminant functions. (C) Clusters obtained by discriminant analysis of principal components. Clusters are shown by different colors; each point represents an individual.
Bayesian clustering analysis in STRUCTURE indicated K = 3 as the most likely value for the sample set (Figure 4 and Table 5), with the highest LnP(K) and lowest standard deviation (Supplementary Figure S1) for the whole data set and subsample. The MedMeaK, MaxMeaK, MedMedK, and MaxMedK estimates also indicated K = 3 as the most likely number of clusters for the locations studied.
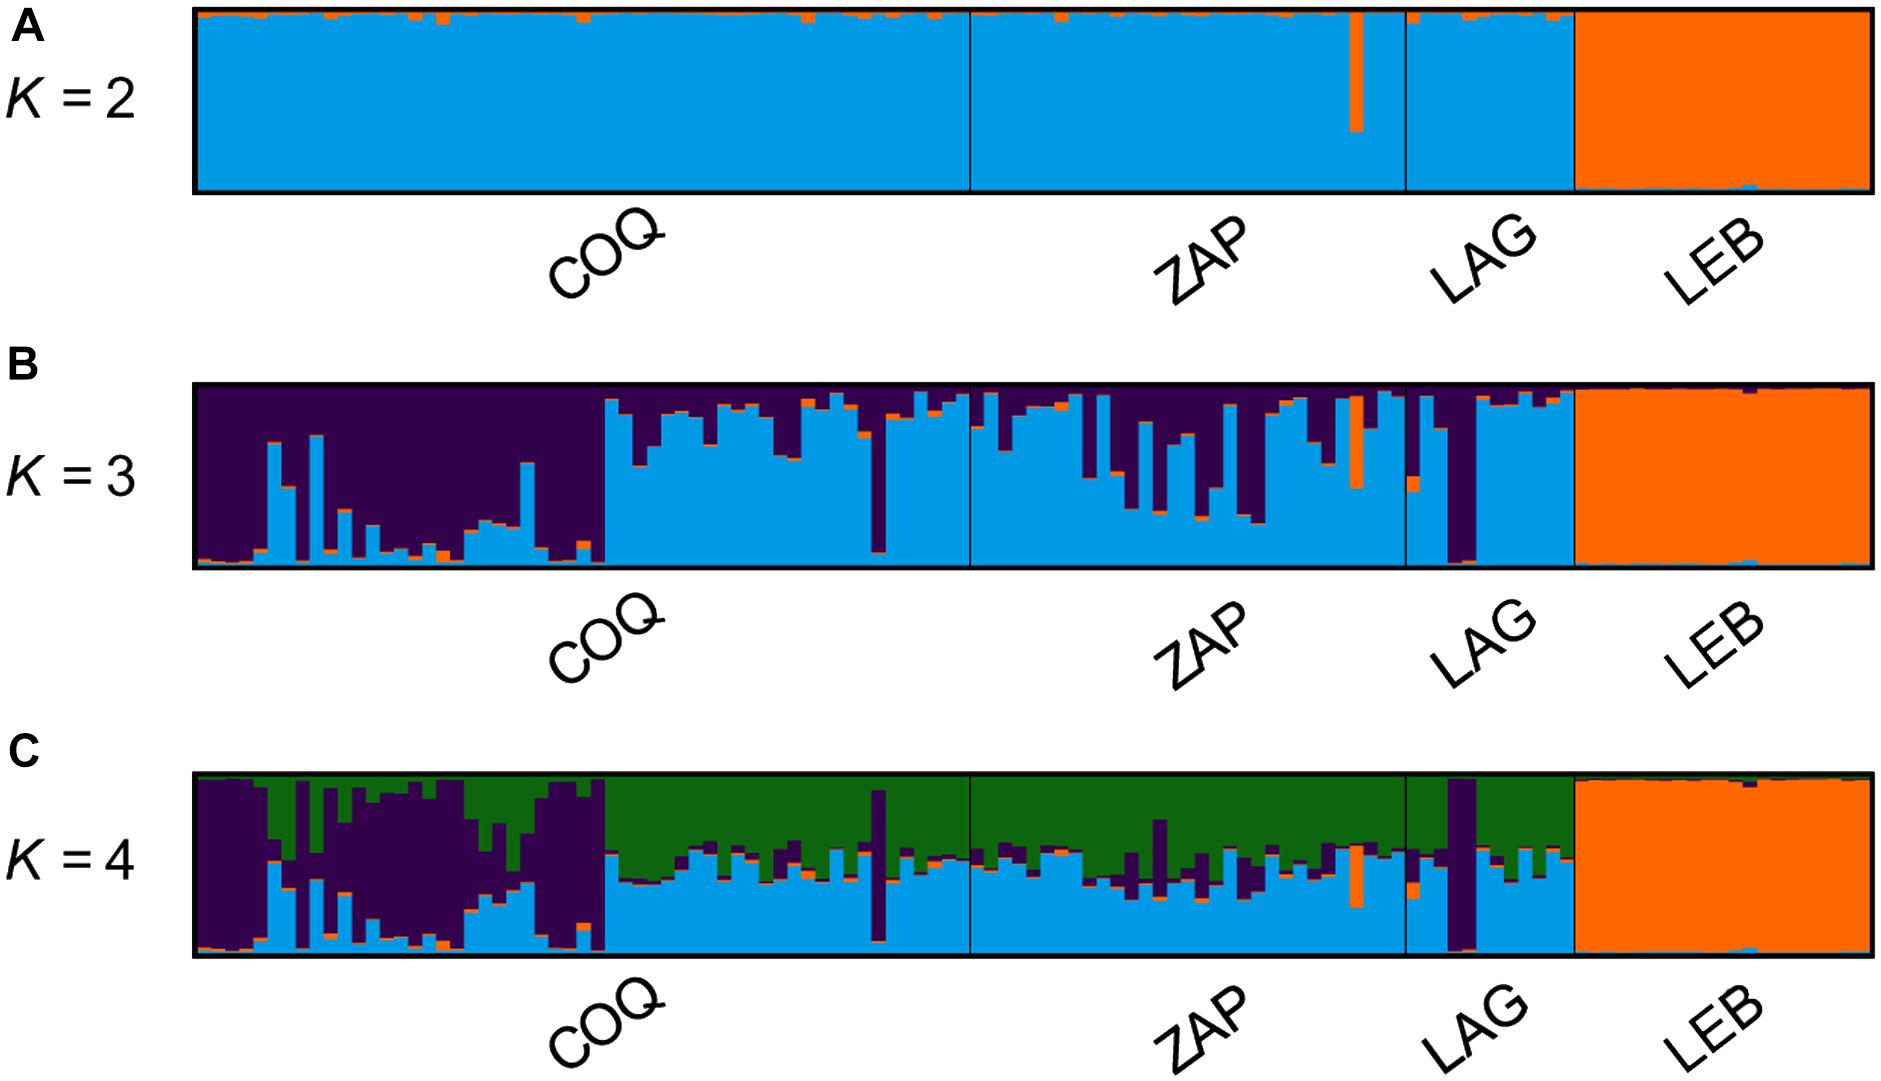
Figure 4. Bayesian analyses of population structure performed with STRUCTURE. Each vertical bar represents one individual, and the color proportion for each bar represents the posterior probability of assignment of each individual to the different groups (K) inferred. (A) At K = 2 LEB individuals formed a clear separate group from the other locations. (B) At K = 3, LEB individuals were grouped together in group I with a 98.5% average proportion of membership (Table 6), COQ was also grouped separately in group II, while LAG and ZAP were grouped together in group III. (C) No further changes were observed with K > 4.
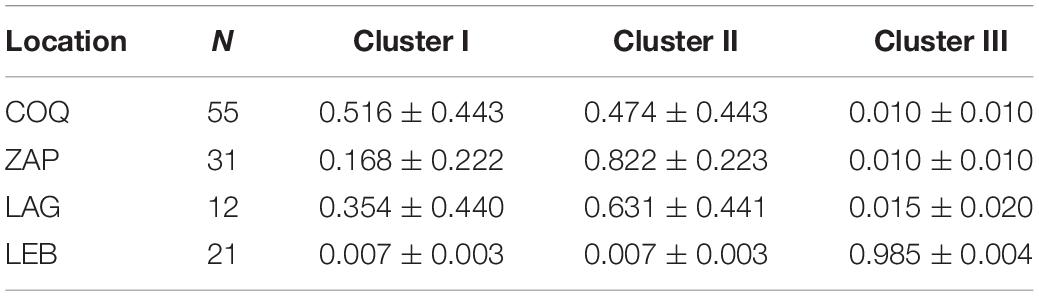
Table 5. Proportion of mean membership (Q ± SD) of G. chilensis individuals from each locality to each of the three genetic groups inferred by STRUCTURE.
Performance in terms of assignment to geographic origin for the five heterologous microsatellites had an average correct assignment of 66% over the whole sample set when considering the clusters (K = 3) identified by STRUCTURE (Table 6). Interestingly, all 21 LEB individuals were correctly re-assigned to this location of origin. Finally, the IBD analysis showed no significant correlation between genetic and geographic distance according to Spearman correlation coefficient values (rS = 0.043, right-tailed p = 0.196).
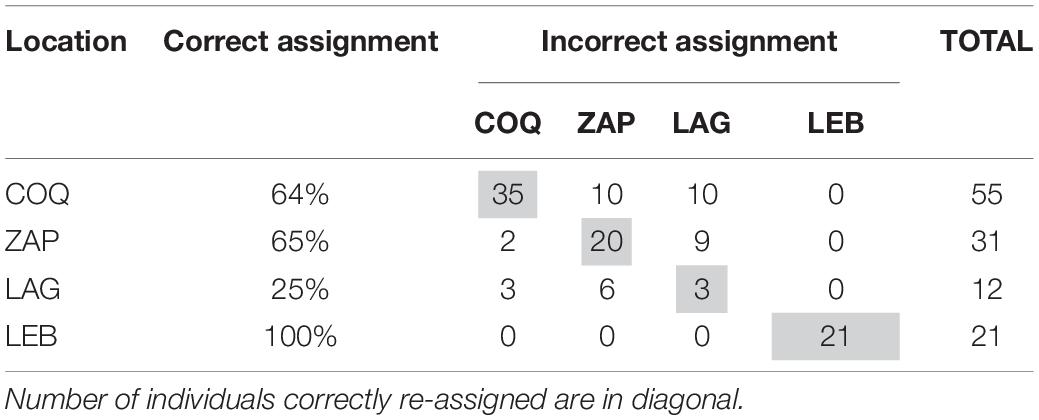
Table 6. Assignment performance of the heterologous microsatellite markers studied.
Contemporary effective sizes (Ne) for each STRUCTURE cluster were 97.7, 248.4, and 422.0 individuals for LEB, ZAP/LAG, and COQ, respectively. The confidence intervals had infinite upper limits for all three clusters, and the lower limits were 16.7, 69.0, and 109.0 individuals for LEB, ZAP/LAG, and COQ, respectively. The heterozygosity loss per generation ranged from 0.0012 in COQ to 0.0051 in LEB. Additionally, the bottleneck analysis showed no statistically significant differences between expected and observed heterozygosities across sampling locations from central Chile using the TPM, IAM or SMM mutation models. However, LEB showed a deviation from mutation-drift equilibrium (p = 0.0156 for HE excess) and a mode-shift distortion in the distribution of allele frequencies, suggesting a recent reduction in population size.
Despite the scarcity of information available for the red cusk-eel and the notable decline of local populations according to fishermen, little concern has been devoted to the species in terms of management and conservation. However, the economic potential, the cultural value and the unmet demand for this species in the local market suggest an opportunity to sustainably increase production. As red cusk-eel aquaculture approaches commercial scale (Colorado Chile S.A), genetic characterization of wild populations is essential for effective management of natural and domesticated populations, to safeguard the remaining genetic diversity of the species and assist in stock enhancement. In this study, we identify two genetic groups of red cusk-eel along the coast of Chile, and this population structure should be taken into account in designing species management strategies.
Cross-species amplification of the microsatellite markers used in this study was useful for assessing genetic diversity in G. chilensis, as previously demonstrated by Canales-Aguirre et al. (2010b). However, the number of individuals used in this previous study was limited, and all individuals sampled were from a single location. The loci cmrGb4.2B and cmrGb4.2A showed a null allele frequency >10%, and a similar pattern was observed for cmrGb4.2B in G. capensis (Henriques et al., 2017). The most obvious explanation for these null alleles is the presence of mutations at the primer annealing site in the G. chilensis DNA sequence, as the microsatellite loci were developed for G. blacodes, or an amplification bias toward shorter fragments. The occurrence of null alleles is the best-known reason for underestimation of heterozygosity and overestimation of genetic differentiation (measured as FST) using microsatellites (Chapuis and Estoup, 2007; Larrain et al., 2015). Therefore, these two loci were discarded from further analysis. Notwithstanding, the locus cmrGb4.2B showed a geographic pattern of null allele occurrence, as it was observed in all locations except LEB. The same locus has been successfully genotyped in G. chilensis from a location 150 km north of LEB (Canales-Aguirre et al., 2010b).
Moreover, five unique alleles with a frequency ≥5% were found in LEB (20% of the total alleles for the population) (Supplementary Tables S11, S12). Since allelic richness was lower for LEB than the other populations, this finding is not likely the effect of homoplasy. These alleles may have originated from mutations after an isolation process from the central populations. Thus, the null allele frequency and presence of private alleles in LEB suggest some genetic differentiation between the populations from central and southern Chile.
The use of heterologous markers can also result in different numbers of observed alleles. This study identified fewer alleles at three loci (cmrGb5.2B, cmrGb5.9, and cmrGb4.11B) than Ward and Reilly (2001) but five more at locus cmrGb2.6.1, indicating that this particular locus could be more informative in the red cusk-eel (Supplementary Tables S8–S12).
The four locations analyzed, showed high genetic diversity and similar levels of heterozygosity. Global FIS estimates suggest an excess of heterozygotes, but only the cmrGb5.2B locus showed significant levels of heterozygosity excess. Population sub-structuring, long generation times, gene flow or demographic changes due, for example, to a bottleneck effect from fishing pressure can result in transiently elevated heterozygosity, which could explain the high genetic diversity observed here (Frankham et al., 2004). Alternatively, despite fishing pressure, populations may maintain adequate genetic diversity. In G. chilensis, the average number of alleles and global allelic richness (Na = 15.2 ± 3.9, Ar = 8.1 ± 2.1) were lower than the values reported for G. blacodes (Na = 21.6, Canales-Aguirre et al., 2010a; Na = 23.4, Ward and Reilly, 2001) and G. capensis (Na = 25, Ar = 18.6, Henriques et al., 2017). The number of alleles (Na) and allelic richness (Ar) estimated for the southern location (LEB, 37°S) were lower than for the central locations (COQ, LAG and ZAP from 30°S to 33°S), suggesting latitudinal differentiation. This result may be attributable to greater fishing pressure on the red cusk-eel in the Región del BioBio (an important fishing zone in Chile, where LEB is located) (Figure 2), with declining catches reported in the 1980s, followed by a slight recovery in the late 1990s but remaining below 200 tons⋅year–1 since the year 2000 (except for 2009 with 261 tons and 2012 with 256 tons) (Servicio Nacional de Pesca y Acuicultura, SERNAPESCA, 2016).
Global HE in G. chilensis (HE = 0.884) was similar to the global HE found in G. blacodes from Australia (HE = 0.895, Ward and Reilly, 2001) and Chile (HE = 0.914, Canales-Aguirre et al., 2010a) and G. capensis from South Africa (HE = 0.802, Henriques et al., 2017), assessed with fifteen, three and nine microsatellite loci, respectively. These results suggest that, in general, the Genypterus species studied have high microsatellite genetic diversity (assessed as Na, Ar, and HE). The set of microsatellite markers developed for G. blacodes (Ward and Reilly, 2001) are informative for application in the other unassessed species in this genus and could be useful for relatedness and paternity exclusion analyses in wild and farmed populations of G. chilensis, to enhance future conservation, mating and farming strategies.
The heterologous microsatellite markers used in this study effectively identified two genetic clusters in the four sampling locations, Central and Southern clusters. The cluster from Central Chile (COQ, ZAP, and LAG), shows evidence of admixture and geographic connectivity in some individuals from all three sampling locations. The Southern genetic cluster grouped all individuals from LEB, showing no admixture with the first cluster, as shown by two clustering analyses to infer population structure. Values of FST using neutral molecular markers were similar to those reported for other marine fishes (mean FST = 0.062 ± 0.011) (Ward et al., 1994), and support the genetic differentiation between LEB and the Central populations found here. There were no statistically significant differences in FST and DJost between COQ and ZAP/LAG. Similarly, DAPC also identified two clusters separating LEB from Central Chile, probably due to high connectivity among Central populations. On the other hand, the results obtained in STRUCTURE indicate three clusters (Figure 4 and Supplementary Figure S1). The discordance between the DAPC and FST/DJost estimates with the STRUCTURE analysis can be explained because the assumptions of the Bayesian analysis are not completely fulfilled.
However, the results of assignment test support differentiation among the Central populations. If we consider the three clusters identified by STRUCTURE, that is LAG and ZAP as a unique cluster, assignment accuracy increases to 88% for that group and to 84% for the whole sample. This result suggests that this set of microsatellites is a promising molecular tool that could be useful in tracing the population of origin in captured individuals.
The low levels of differentiation (measured as FST) between the central populations may be attributable to high connectivity (gene flow) between the regions, due to larval drift in neighboring geographic areas, non-philopatric juvenile recruitment, large effective population size and/or shared ancestral alleles and recent divergence of the populations in question (Waples, 1998; Cano et al., 2008). The BIC curve from the DAPC analysis (Figure 3A) has an elbow at K = 2 and a minimum at K = 4, suggesting that there could be 2–4 clusters in our dataset (Supplementary Tables S6, S7). In any case, the analysis consistently separates the Southern (LEB) from Central populations with the first discriminant function. However, both the DAPC and STRUCTURE analyses show indications of potential population substructure within the central region of Chile that may not be detectable using this set of markers, or any set of neutral markers, as differentiation may be due to adaptive differences (Allendorf et al., 2010). The pattern observed in the STRUCTURE analysis could be attributable to temporal variability, especially in COQ, due to sampling of different generations (overlapping generations due to iteroparity) and/or the presence of reproductive sweepstakes in the red cusk-eel, where only a fraction of individuals contribute offspring to the next generation (Henriques et al., 2017). The latter is a probable consequence of the concurrence of fishing season and the reproductive season of the species. As little is known about the reproductive habits and temporal stability of the population, further research is needed to resolve the origin of distinct genetic groups in the central region of Chile.
Potential bias in the population sampling and selection of markers must also be considered. Great effort is required to standardize microsatellite markers across laboratories, and genotyping error rates are often high. As the statistical power to detect genetic differentiation can be affected by effective population size differences and data richness (such as the number of individuals, samples sites, loci, and alleles) (Benestan et al., 2016), a more exhaustive study with more loci and individuals per sample site is needed to confirm these findings and to support the IBD analysis (which showed no correlation between geographic distance and genetic differentiation). One potential solution for such issues is to develop genome-wide species-specific markers using genotyping-by-sequencing and widespread sampling across the species distribution range. This approach may help to increase the power and resolution of studies on genetic diversity, population structure and demographic processes in G. chilensis. As next-generation sequencing technologies continue to improve, it becomes easier to generate genomic information for non-model species. Furthermore, advancements will allow for the use of neutral and adaptive markers, which could be the best approach for delimiting conservation units of G. chilensis in Chile (Funk et al., 2012).
The red cusk-eel has rather a sedentary adult lifestyle; thus, larval dispersal would be the only source of population connectivity for this species. However, it has been reported that successful larval dispersal is not associated with pelagic larval time, decreasing exponentially with distance (Gilg and Hilbish, 2003; D’Aloia et al., 2015). Regardless, there is no agreement in the literature about the maximum extent of this phenomena in a marine environment, and these features are yet to be characterized in G. chilensis. Our findings show that genetic differentiation of red cusk-eel populations can occur on geographic scales of ∼600 km or less. Thus, the greater distances (isolation and genetic drift) and differences in habitat (adaptation to local conditions) between the LEB and central populations could be the main reason for the population differentiation found in this study. Also, we cannot discard the possibility that temporal variation in allele frequency is not necessarily associated with spatial differentiation. More research regarding the biology of this species, such as the possibility of natal homing, oceanographic features, ecological specialization and temporal stability of allele frequencies, are needed to elucidate the drivers of population structure in the red cusk-eel.
The locations studied here are the most exploited red cusk-eel fisheries in the country (Servicio Nacional de Pesca y Acuicultura, SERNAPESCA, 2016). These regions merit greater attention, as it is important to ensure that genetic diversity is maintained for the sustainability of the fishery and long-term survival of the species in times of rapid environmental change.
Our results suggest that LEB has gone through a recent bottleneck, demonstrated by the loss of rare alleles and expected heterozygosity excess (Luikart and Cournet, 1998). The fishing history of the LEB population may explain the bottleneck signal encountered here, as the population size seems to have gone through a reduction-expansion-reduction process in the last 40 years, according to fishing statistics. Moreover, although recent bottlenecks can downwardly bias Ne estimates for a few generations (Waples, 2005), the LEB population partially met assumptions for estimating Ne (described below). Consequently, the Ne estimation for this population is expected to be closer to the true Ne per generation than the estimates for the central populations. Overfishing may be the main reason for reduced Ne in the southern population. As the red cusk-eel shows sexual dimorphism in size at maturity, selectivity fishing toward larger individuals, in this case, females, will increase variance in reproductive success and trigger a skewed sex ratio. This scenario would lower Ne (Hare et al., 2011), supporting the idea of reproductive sweepstakes discussed above. Fortunately, efforts have been made to protect LEB population, through the construction of artificial niches (artificial reefs) for shelter (Toledo et al., 2017), however, seasonal sampling should be performed to assess temporal stability of the population and the performance of the niches.
The low Ne estimates as well as the infinite upper limit estimated for all populations is probably a consequence of decreased precision and statistical power due to small sample size (n < 50) and few genotyped loci (n < 10) (Waples and Do, 2010). The LD method provides Ne estimates for the parental generation, making several assumptions (selective neutrality of molecular markers, closed populations, discrete generations and independent segregation of loci) (Waples and Do, 2008). As these assumptions were not fully met in the central populations, with apparent gene flow among the three sites sampled, the Ne values could be overestimated due to the contribution of offspring from nearby populations (Waples and England, 2011). The presence of overlapping generations in our dataset, due to the iteroparity of this species, also biases the Ne estimates, as it is likely that only a fraction of the parents in the generation were sampled (Luikart et al., 2010). However, according to Waples et al. (2014), in the presence of overlapping generations, Ne estimates are closer to the true Ne when the number of cohorts sampled is closer to the generation time of the species, which is the case in the present study (calculated as in Waples et al., 2014, with AL = 25 and Gen = 5). Therefore, we expect our Ne estimates to be relatively unbiased. Furthermore, our results are in line with Ne estimates based on the LD method for other marine fishes with few genotyped microsatellites (e.g., European hake Ne = 291, Pita et al., 2017; Oblique-banded snapper Ne = 12.3–301, Kennington et al., 2017), including G. capensis (Ne = 703–1,023), which makes our finding of a low effective population size for the red cusk-eel worrisome. Small populations are more susceptible to genetic drift, increasing inbreeding, reducing genetic viability and promoting the loss of favorable alleles and fixation of deleterious alleles, which could threaten the adaptive potential of the species in response to selective pressures (Luikart and Cournet, 1998; Frankham et al., 2004). As the red cusk-eel population has been decreasing over the last decades due to fishing pressure, it is likely to reach an even lower Ne, potentially reducing gene flow between the remaining central populations, increasing genetic differentiation among populations and consequently heightening their vulnerability (Allendorf and Luikart, 2007). Therefore, additional studies involving greater numbers of genotyped loci and/or temporal sampling should be performed to better assess the effective population size of the central populations.
The five microsatellite markers analyzed here were informative for identifying the genetic structure of G. chilensis between central and southern populations, rejecting the hypothesis of panmixia for this species. Variation in oceanographic parameters between central and southern Chile might play an important role in modulating population structure, but environmental features were not assessed in the present study, and further research remains pending. However, the microsatellite panel tested could be useful for stock identification between central and southern red cusk-eel samples.
The southern population is at higher risk in terms of long-term survival, given the low estimated Ne and evidence of a recent bottleneck. However, lack of information regarding the life-history traits of this species hinders an unbiased estimation of Ne (Waples et al., 2013). Adult census population size (Nc) per generation should be determined to provide a more conclusive assessment of population status and conservation needs. Unfortunately, it is challenging to measure these characteristics given the nocturnal and hidden life style of the red cusk-eel. We also recommend that future studies include additional markers in order to increase power sufficiently to detect recent demographic events (Luikart and Cournet, 1998). Temporal sampling and mitochondrial DNA sequence analysis may also clarify the demographic phenomena that have affected the red cusk-eel along the coast of Chile.
The fishing pressure on this resource over time may have consequences that have yet to come to light. For example, size-selective fishing has the potential to reduce the size of individuals in future generations, lowering maturity age and generation time, as well as producing sex-biased ratios, since bigger individuals are usually females. Environmental factors may also influence reproductive features in the species, such as spawning timing and location, fecundity, fertilization, larval development and recruitment. The combination of these factors may lower effective size and reduce genetic diversity and resilience in this species.
To ensure the long-term sustainability of the red cusk-eel industry, we recommend that the decision-makers in Chile responsible for determining fishery management policies take the following steps: define harvest quotas or minimum landing size during the reproductive season of this species; monitor habitat and population status to assess the temporal stability of genetic diversity in this species; and consider the population structure demonstrated in this study in managing this species. That is, the red cusk-eel populations studied in this work should be treated as at least two distinct management units–central and southern Chile–until definitive studies have been performed.
The data that support the findings of this study are available from the corresponding author upon reasonable request. Moreover, the allele frequency data per loci is available in Supplementary Material.
Ethical review and approval was not required for the animal study because the fin clip fish samples were taken from dead individuals at fish markets in each location. We did not participate in the fishing or evisceration process; thus, we did not require an ethics committee approval.
VC-A, CA, FJ, and NL participated in the conception and design of the study. VC-A performed the analysis and wrote the manuscript with contributions from CA and NL. PM and MT provided the samples. All authors approved the manuscript for submission.
PM was employed by company Colorado Chile S.A.
The remaining authors declare that the research was conducted in the absence of any commercial or financial relationships that could be construed as a potential conflict of interest.
VC-A is a student in the Doctoral Program in Aquaculture at the University of Chile and was supported by a CONICYT Doctoral Fellowship N° 21160532. This study was funded by CORFO, Project 14PIE-28725, and partially by CORFO, Project 15PTE-C47381, both to PM and NL.
We thank the staff of the Laboratory of Genetics and Biotechnology in Aquaculture for constructive discussion and sample preparation, with special thanks to Raquel Becerra-Vera for her valuable assistance in DNA extraction. We are very grateful to the “Sindicato de Pescadores de la Caleta Zapallar” (Valparaiso), with special thanks to “Hermanos Allende” (Carlos, Gumercindo and Ruperto) for providing red cusk-eel fin clips to CA. Also, to the staff of Colorado Chile S.A., for assisting us in red cusk-eel sampling, specially to Cristian Vega and Victor Castelletto. We would also like to thank Grupo Bios, especially Susan Smalley, for facilitating the use of the Fragment Analyzer equipment and for the constant help with troubleshooting.
The Supplementary Material for this article can be found online at: https://www.frontiersin.org/articles/10.3389/fmars.2019.00748/full#supplementary-material
Abdul-Muneer, P. (2014). Application of microsatellite markers in conservation genetics and fisheries management: recent advances in population structure analysis and conservation strategies. Genet. Res. Int. 2014:691759. doi: 10.1155/2014/691759
Allendorf, F. W., and Luikart, G. (2007). Conservation and the Genetics of Populations. Malden, MA: Blackwell Publishing.
Allendorf, F. W., Hohenlohe, P. A., and Luikart, G. (2010). Genomics and the future of conservation genetics. Nat. Rev. Genet. 11, 697–709. doi: 10.1038/nrg2844
Araneda, C., Larraín, M. A., Hecht, B., and Narum, S. (2016). Adaptive genetic variation distinguishes Chilean blue mussels (Mytilus chilensis) from different marine environments. Ecol. Evol. 6, 3632–3644. doi: 10.1002/ece3.2110
Benestan, L. M., Ferchaud, A. L., Hohenlohe, P. A., Garner, B. A., Naylor, G. J., Baums, I. B., et al. (2016). Conservation genomics of natural and managed populations: building a conceptual and practical framework. Mol. Ecol. 25, 2967–2977. doi: 10.1111/mec.13647
Boré, D., and Martínez, C. (1981). Chilean fisheries resources catalogue. CORFO-IFOP: Anchoveta, Cabinza, Congrio Colorado, Congrio Negro, Merluza, Santiago, CL:CORFO, 92.
Canales-Aguirre, C. B., Ferrada, S., Hernandez, C., and Galleguillos, R. (2010a). Population structure and demographic history of Genypterus blacodes using microsatellite loci. Fish. Res. 106, 102–106. doi: 10.1016/j.fishres.2010.06.010
Canales-Aguirre, C. B., Ferrada, S., Hernandez, C., and Galleguillos, R. (2010b). Usefulness of heterologous microsatellites obtained from Genypterus blacodes (Schneider 1801) in species Genypterus off the Southeast Pacific. Gayana 74, 74–77.
Cano, J. M., Shikano, T., Kuparinen, A., and Merila, J. (2008). Genetic differentiation, effective population size and gene flow in marine fishes: implications for stock management. JIFS 5, 1–10.
Chapuis, M. P., and Estoup, A. (2007). Microsatellite null alleles and estimation of population differentiation. Mol. Biol. Evol. 24, 621–631. doi: 10.1093/molbev/msl191
Chocair, J., Orellana, F., and Serra, J. (1969). Estudio del Género Genypterus (congrios) en aguas chilenas (Pisces: Ophidiidae). Tesis de Biología Marina, Universidad de Chile, Valparaíso. 48.
Chong, J., and González, P. (2009). Ciclo reproductivo y talla media de madurez del congrio colorado, Genypterus chilensis (Guichenot, 1881) en el litoral de Talcahuano, Chile. Revista de Biología Marina y Oceanografía 44, 257–262.
Colorado Chile S.A, (2016). Available at: http://www.coloradochile.cl (accessed April 2, 2018).
Cowen, R. K., Gawarkiewicz, G., Pineda, J., Thorrold, S. R., and Werner, F. E. (2007). Population connectivity in marine systems; an overview. Oceanography 20, 14–21. doi: 10.5670/oceanog.2007.26
D’Aloia, C. C., Bogdanowicz, S. M., Francis, R. K., Majoris, J. E., Harrison, R. G., and Buston, P. M. (2015). Patterns, causes, and consequences of marine larval dispersal. PNAS 112, 13940–13945. doi: 10.1073/pnas.1513754112
Earl, D. A., and vonHoldt, B. M. (2012). Structure Harvester: a website and program for visualizing structure output and implementing the Evanno method. Conserv. Genet. Resour. 4, 359–361. doi: 10.1007/s12686-011-9548-7
Ellegren, H. (2004). Microsatellites: simple sequences with complex evolution. Nat. Rev. 5, 435–445. doi: 10.1038/nrg1348
Evanno, G., Regnaut, S., and Goudet, J. (2005). Detecting the number of clusters of individuals using the software structure: a simulation study. Mol. Ecol. 14, 2611–2620. doi: 10.1111/j.1365-294x.2005.02553.x
FAO, (2016/2018). Software Para la Pesca y la Acuicultura. FishStatJ - Programa Informático Para Series Cronológicas de Estadísticas Pesqueras. In: Departamento de Pesca y Acuicultura. Available at: http://www.fao.org/fishery/statistics/software/fishstatj/es (accessed Febraury 6, 2018).
Frankham, R., Ballou, J. D., and Briscoe, D. A. (2004). A Primer of Conservation Genetics. London: Cambridge University Press.
Funk, W. C., McKay, J. K., Hohenlohe, P. A., and Allendorf, F. W. (2012). Harnessing genomics for delineating conservation units. Trends Ecol. Evol. 27, 489–496. doi: 10.1016/j.tree.2012.05.012
Gao, X., Alvo, M., Chen, J., and Li, G. (2008). Nonparametric multiple comparison procedures for unbalanced one-way factorial designs. JSPI 138, 2574–2591. doi: 10.1016/j.jspi.2007.10.015
Gilg, M. R., and Hilbish, T. J. (2003). Patterns of larval dispersal and their effect on the maintenance of a blue mussel hybrid zone in southwestern England. Evolution 57, 1061–1077. doi: 10.1111/j.0014-3820.2003.tb00316.x
Goudet, J. (2001). FSTAT, A Program to Estimate and Test Gene Diversities and Fixation Indices, Version 2.9.3. Available at: http://www2.unil.ch/popgen/softwares/fstat (accessed July 8, 2018).
Guichenot, A. (1848). “Fauna Chilena, Peces,” in Historia física y política de Chile, Zoología II, ed. C. Gay (Paris & Santiago), 137–370.
Hare, M. P., Nunney, L., Scwartz, M. K., Ruzzante, D. E., Burford, M., and Waples, R. S. (2011). Understanding and estimating effective population size for practical application in marine species management. Conserv. Biol. 25, 438–449. doi: 10.1111/j.1523-1739.2010.01637.x
Henriques, R., Nielsen, E. S., Durholtz, D., Japp, D., and von der Heyden, S. (2017). Genetic population sub-structuring of kingklip (Genypterus capensis – Ophidiidae), a commercially exploited demersal fish off South Africa. Fish. Res. 187, 86–95. doi: 10.1016/j.fishres.2016.11.007
Hollander, M., and Wolfe, D. A. (1973). Nonparametric Statistical Methods. New York: John Wiley and Sons.
Jombart, T. (2008). Adegenet: an R package for the multivariate analysis of genetic markers. Bioinformatics 24, 1403–1405. doi: 10.1093/bioinformatics/btn129
Jombart, T., Devillard, S., and Balloux, F. (2010). Discriminant analysis of principal components: a new method for the analysis of genetically structured populations. BMC Genet. 11:94. doi: 10.1186/1471-2156-11-94
Jost, L. (2008). GST and its relatives do not measure differentiation. Mol. Ecol. 17, 4015–4026. doi: 10.1111/j.1365-294x.2008.03887.x
Kalinowski, S. T., Taper, M. L., and Marshall, T. C. (2007). Revising how the computer program CERVUS accommodates genotyping error increases success in paternity assignment. Mol. Ecol. 16, 1099–1106. doi: 10.1111/j.1365-294x.2007.03089.x
Kalinowski, S. T., Wagner, A. P., and Taper, M. L. (2006). ML-RELATE: a computer program for maximum likelihood estimation of relatedness and relationship. Mol. Ecol. Notes 6, 576–579. doi: 10.1111/j.1471-8286.2006.01256.x
Keenan, K., McGinnity, P., Cross, T. F., Crozier, W. W., and Prodöhl, P. A. (2013). diveRsity: an R package for the estimation and exploration of population genetics parameters and their associated errors. Methods Ecol. Evol. 4, 782–788. doi: 10.1111/2041-210x.12067
Kennington, W. J., Keron, P. W., Harvey, E. S., Wakefield, C. B., Williams, A. J., Halafihi, T., et al. (2017). High intra-ocean, but limited inter-ocean genetic connectivity in populations of the deep-water oblique-banded snapper Pristipomoides zonatus (Pisces: Lutjanidae). Fish. Res. 193, 242–249. doi: 10.1016/j.fishres.2017.04.015
Kopelman, N., Mayzel, J., Jackobson, M., Rosenberg, N. A., and Mayrose, I. (2015). CLUMPAK: a program for identifying clustering modes and packaging population structure inferences across K. Mol. Ecol. Resour. 15, 1179–1191. doi: 10.1111/1755-0998.12387
Larrain, M. A., Díaz, N., Lamas, C., Uribe, C., Jilberto, F., and Araneda, A. (2015). Heterologous microsatellite-based genetic diversity in blue mussel (Mytilus chilensis) and differentiation among localities in Southern Chile. Lat. Am. J. Aquat. Res. 43, 998–1010.
Lenstra, J., Groenevelld, L., Eding, H., Kantanen, J., Williams, J. L., Taberlet, P., et al. (2012). Molecular tools and analytical approaches for the characterization of farm animal genetic diversity. Anim. Genet. 43, 483–502. doi: 10.1111/j.1365-2052.2011.02309.x
Luikart, G., and Cournet, J. M. (1998). Empirical evaluation of a test for identifying recently bottlenecked populations from allele frequency data. Conserv. Biol. 12, 228–237. doi: 10.1046/j.1523-1739.1998.96388.x
Luikart, G., Ryman, N., Tallmon, D., Schwartz, M. K., and Allendorf, F. W. (2010). Estimation of census and effective population sizes: the increasing usefulness of DNA-based approaches. Conserv. Genet. 11, 355–373. doi: 10.1007/s10592-010-0050-7
Marshall, D. J., and Morgan, S. G. (2011). Ecological and evolutionary consequences of linked life-history stages in the sea. Curr. Biol. 21, 718–725. doi: 10.1016/j.cub.2011.08.022
Meirmans, P., and Van Tienderen, P. (2004). GENOTYPE and GENODIVE: two programs for the analysis of genetic diversity of asexual organisms. Mol. Ecol. Notes 4, 792–794. doi: 10.1111/j.1471-8286.2004.00770.x
Milner, G. B., Teel, D. J., Utter, F. M., and Winans, G. A. (1985). A genetic method of stock identification in mixed populations of Pacific salmon, Oncorhynchus spp. Mar. Fish. Rev. 47, 1–8.
Narum, S. (2006). Beyond Bonferroni: Less conservative analyses for conservation genetics. Conserv. Genet. 7, 783–787. doi: 10.1007/s10592-005-9056-y
Pérez-Espona, S., and ConGRESS Consortium, (2017). Conservation genetics in the European Union – Biases, gaps and future directions. Biol. Conserv. 209, 130–136. doi: 10.1016/j.biocon.2017.01.020
Piry, S., Alapetite, A., Cornuet, J. M., Paetkau, D., Baudouin, L., and Estoup, A. (2004). GENECLASS2: a software for genetic assignment and first-generation migrant detection. J. Heredity 95, 536–539. doi: 10.1093/jhered/esh074
Pita, A., Pérez, M., Velasco, F., and Presa, P. (2017). Trends of the genetic effective population size in the Southern stock of the European hake. Fish. Res. 191, 108–119. doi: 10.1016/j.fishres.2017.02.022
Pritchard, J., Stephens, M., and Donnelly, P. (2000). Inference of population structure using multilocus genotype data. Genetics 155, 945–959.
Puechmaille, S. J. (2016). The program structure does not reliably recover the correct population structure when sampling is uneven: subsampling and new estimators alleviate the problem. Mol. Ecol. Resour. 16, 608–627. doi: 10.1111/1755-0998.12512
Rojas-Hernandez, N., Véliz, D., Riveros, M., Fuentes, J. P., and Pardo, L. (2016). Highly Connected Populations and Temporal Stability in Allelic Frequencies of a Harvested Crab from the Southern Pacific Coast. PLoS One 11:e0166029. doi: 10.1371/journal.pone.0166029
Rousset, F. (1997). Genetic differentiation and estimation of gene flow from F-statistics under isolation by distance. Genetics 145, 1219–1228.
Rousset, F. (2008). genepop’007: a complete re-implementation of the genepop software for Windows and Linux. Mol. Ecol. Resour. 8, 103–106. doi: 10.1111/j.1471-8286.2007.01931.x
Servicio Nacional de Pesca y Acuicultura, SERNAPESCA (2016). Anuarios Estadísticos de Pesca y Acuicultura (1998 – 2015). Available at: http://sernapesca.cl/index.php?option=com_remository&Itemid=54&func=select&id =2 (accessed July 03, 2018).
Shaklee, J. B., Beacham, T. D., Seeb, L., and White, B. A. (1999). Managing fisheries using genetic data: case studies from four species of Pacific salmon. Fish. Res. 43, 45–78. doi: 10.1016/s0165-7836(99)00066-1
Taggart, J. B., Hynes, R. A., Prodohl, P. A., and Ferguson, A. (1992). A simplified protocol for routine total DNA isolation from salmonid fishes. J. Fish Biol. 40, 963–965. doi: 10.1111/j.1095-8649.1992.tb02641.x
Tascheri, R., Sateler, J., Merini, J., Díaz, E., Ojeda, V., and Montecinos, M. (2003). Estudio biológico-pesquero del congrio colorado, congrio negro y congrio dorado en la zona centrosur. Inf. Final FIP 2001-15, 1–300.
Toledo, M. I., Olivares, G., Zamora, V., Torres, P., Díaz, C., and Herrera, M. J. (2017). Manual de Construcción y Manejo de Nichos Artificiales para Congrio Colorado. Valparaíso,CN: Pontificia Universidad Católica de Valparaíso.
Torres-Florez, J. P., Johnson, W. E., Nery, M. F., Eizirik, E., Oliveira-Miranda, M. A., and Galetti, P. M. Jr. (2017). The coming of age of conservation genetic in Latin America: what has been achieved and what needs to be done. Conserv. Genet. 19, 1–15. doi: 10.1007/s10592-017-1006-y
Van Oosterhout, C., Hutchison, W. F., Wills, D. P. M., and Shipley, P. (2004). MICRO-CHECKER: software for identifying and correcting genotyping errors in microsatellite data. Mol. Ecol. Notes 4, 535–538. doi: 10.1111/j.1471-8286.2004.00684.x
Vera, M., Carlsson, J., Carlsson, J. E. L., Cross, T., Lynch, S., Kamermans, P., et al. (2016). Current genetic status, temporal stability and structure of the remnant wild European flat oyster populations: conservation and restoring implications. Mar. Biol. 163:239.
Waples, R. (1998). Separating the wheat from the chaff: patterns of genetic differentiation in high gene flow species. Am. Genet. Assoc. 89, 438–450. doi: 10.1093/jhered/89.5.438
Waples, R. (2005). Genetic estimates of contemporary effective population size: to what time periods do the estimates apply? Mol. Ecol. 14, 3335–3352. doi: 10.1111/j.1365-294x.2005.02673.x
Waples, R., and Do, C. (2008). LDNE: a program for estimating effective population size from data on linkage disequilibrium. Mol. Ecol. Resour. 8, 753–756. doi: 10.1111/j.1755-0998.2007.02061.x
Waples, R., and Do, C. (2010). Linkage disequilibrium estimates of contemporary Ne using highly variable genetic markers: a largely untapped resource for applied conservation and evolution. Evol. Appl. 3, 244–262. doi: 10.1111/j.1752-4571.2009.00104.x
Waples, R., and England, P. (2011). Estimating contemporary effective population size on the basis of linkage disequilibrium in the face of migration. Genetics 189, 633–644. doi: 10.1534/genetics.111.132233
Waples, R., Antao, T., and Luikart, G. (2014). Effects of overlapping generations on linkage disequilibrium estimates of effective population size. Genetics 197, 769–780. doi: 10.1534/genetics.114.164822
Waples, R., Luikart, G., Faulkner, J. R., and Tallmon, D. A. (2013). Simple life-history traits explain key effective population size ratios across diverse taxa. Proc. Biol. Sci.U.S.A. 208:20131339. doi: 10.1098/rspb.2013.1339
Ward, R. D., and Reilly, A. (2001). Development of microsatellite loci for population studies of the pink ling, Genypterus blacodes (Teleostei: Ophidiidae). Mol. Ecol. Notes 1, 173–175. doi: 10.1046/j.1471-8278.2001.00066.x
Ward, R. D., Appleyard, A., Daley, R. K., and Reilly, A. (2001). Population structure of pink ling (Genypterus blacodes) from south-eastern Australian waters, inferred from allozyme and microsatellite analyses. Mar. Freshw. Res. 52, 965–973.
Ward, R. D., Woodwark, M., and Skibinki, D. O. F. (1994). A comparison genetic diversity levels in marine, freshwater, and anadromous fishes. J. Fish Biol. 44, 213–232. doi: 10.1006/jfbi.1994.1021
Keywords: autosomal markers, Bayesian analysis, FST, heterozygosity, red cusk-eel
Citation: Córdova-Alarcón VR, Araneda C, Jilberto F, Magnolfi P, Toledo MI and Lam N (2019) Genetic Diversity and Population Structure of Genypterus chilensis, a Commercial Benthic Marine Species of the South Pacific. Front. Mar. Sci. 6:748. doi: 10.3389/fmars.2019.00748
Received: 29 July 2019; Accepted: 15 November 2019;
Published: 12 December 2019.
Edited by:
Rodrigo Vidal, Universidad de Santiago de Chile, ChileReviewed by:
Carlos Vergara-Chen, Technological University of Panama, PanamaCopyright © 2019 Córdova-Alarcón, Araneda, Jilberto, Magnolfi, Toledo and Lam. This is an open-access article distributed under the terms of the Creative Commons Attribution License (CC BY). The use, distribution or reproduction in other forums is permitted, provided the original author(s) and the copyright owner(s) are credited and that the original publication in this journal is cited, in accordance with accepted academic practice. No use, distribution or reproduction is permitted which does not comply with these terms.
*Correspondence: Natalia Lam, bmxhbUB1Y2hpbGUuY2w=
Disclaimer: All claims expressed in this article are solely those of the authors and do not necessarily represent those of their affiliated organizations, or those of the publisher, the editors and the reviewers. Any product that may be evaluated in this article or claim that may be made by its manufacturer is not guaranteed or endorsed by the publisher.
Research integrity at Frontiers
Learn more about the work of our research integrity team to safeguard the quality of each article we publish.