 Yuan Liu
 Gary H. Wikfors
 Julie M. Rose1
 Richard S. McBride
 Lisa M. Milke
- 1Milford Laboratory, Northeast Fisheries Science Center, National Marine Fisheries Service, National Oceanic and Atmospheric Administration, Milford, CT, United States
- 2Integrated Statistics, Woods Hole, MA, United States
- 3Woods Hole Laboratory, Northeast Fisheries Science Center, National Marine Fisheries Service, National Oceanic and Atmospheric Administration, Woods Hole, MA, United States
Environmental DNA (eDNA) metabarcoding was used to characterize finfish communities in the nearshore estuarine environment. Monthly sampling was conducted June – August 2017 at two sites with structured habitats: a natural rock reef and a shellfish aquaculture farm within the same coastal embayment of Long Island Sound (LIS), CT, United States. Seventeen common and 25 rare finfish taxa were detected using eDNA metabarcoding. Incomplete status of reference sequence databases for finfish species was identified as a methodological challenge. Confidence in molecular identification was improved appreciably through the use of publicly available data obtained from local trawling and seining surveys. Comparison between eDNA metabarcoding and trawling surveys on 6/27/2017, the only day when both data types were available, revealed more finfish species detected by eDNA metabarcoding. The high sensitivity of eDNA metabarcoding detected finfish species rarely observed in traditional surveys and showed the potential for this methodology to augment existing literature for finfish species distribution patterns and invasive species detection. Non-metric multidimensional scaling (NMS) analysis of finfish communities achieved a low-stress, 2D solution, and revealed greater variation between samples collected from different months than samples collected from the two habitats. Similarly, permutational analysis of variance (PERMANOVA) found both month and the interaction term (month × site) significant, with the latter identifying site as significant only in July and August. Different finfish assemblages were significantly associated with each axis, axes representing temporal and spatial variations, respectively. Additionally, polycarbonate and nylon filters were compared to optimize the sampling method; finfish communities retrieved using the two types of filters were statistically indistinguishable by NMS analysis, although the filtration time for nylon filters was shorter. If the objective is to detect rare species, nylon filters are recommended over polycarbonate filters because of higher capture rates of rare taxa. Our study demonstrates the potential for applying eDNA metabarcoding as a stand-alone method to conduct finfish surveys with high sensitivity.
Introduction
Coastal ecosystems are among the most productive and diverse ecosystems on the planet, hosting about 80% of the 13,200 known marine fish species (Costa-Pierce, 2016). As demand for fish protein grows, there is an increasing need to manage coastal fisheries effectively using accurate fisheries diversity information, including what, where, and when species are present. Scientific knowledge of fish distributions is not always current or complete because conventional surveying tools have limitations in capturing highly migratory species, and sampling methods can be destructive and expensive. New surveying methods that are rapid, robust, non-destructive, and affordable are needed to improve fisheries management.
One promising new technology collects traces of organismal DNA in the environment and uses DNA sequences to provide identification. Such DNA sources are referred to collectively as environmental DNA (eDNA), and include whole microorganisms, cellular materials such as tissue, feces, or scales, and free DNA released from cytoplasm. PCR-based eDNA methods include q-PCR for single species quantification and eDNA-metabarcoding for community analysis. The former approach relies upon taxon-specific primers to generate quantitative information on taxon-specific genes, an index of taxon abundance; the latter combines DNA-based identification with high-throughput, next-generation sequencing to characterize complex communities. In marine environments, eDNA metabarcoding was first applied to survey microbial diversity (Sogin et al., 2006) and more recently to survey macroorganisms (Thomsen et al., 2012; Valentini et al., 2016).
eDNA-based macroorganismal methods are preferred over traditional methods when: (1) target organism abundance is low; (2) presence of ephemeral species requires survey methods that are faster, cheaper, and more sensitive; and (3) habitats are inaccessible (Stat et al., 2017; Baker et al., 2018; Nevers et al., 2018; Taberlet, 2018; Ushio et al., 2018). To better realize the potential for eDNA methods to address a wide range of ecological questions, spatiotemporal variations of eDNA in marine environments must be more thoroughly understood, and targeted studies addressing technical details regarding eDNA sample collection and processing are required. One such technical detail revolves around the choice of eDNA concentrating matrix – membrane filters, with both filter material and pore size playing important roles in eDNA capture (Djurhuus et al., 2017; Tsuji et al., 2019).
Studying abundance and distribution of structure-oriented finfish can be challenging as irregular seafloor topography associated with oyster-cage farms and boulder reefs limits survey options and precludes the use of trawl nets (Rees et al., 2014). eDNA technology provides an alternative means of assessing finfish communities in hard-to-sample areas and could provide insights into finfish assemblages associated with structured habitats. Additionally, aquaculture of the eastern oyster Crassostrea virginica using off-bottom cages has become increasingly popular, allowing growers to raise greater numbers of shellfish on a smaller spatial footprint. Some evidence suggests that oyster aquaculture gear may provide structured habitat for local finfish communities (Tallman and Forrester, 2007). An understanding of ecosystem services provided to finfish by aquaculture gear relative to naturally structured seafloor may help to inform policymakers, regulators, and fishery managers who make decisions about siting shellfish farms.
The goals of this study were to: (1) assess the feasibility of using eDNA metabarcoding as a tool to characterize finfish communities associated with two structured habitats in close proximity within LIS; (2) test the spatial and temporal utility and sensitivity of eDNA for surveying finfish community composition; and (3) evaluate relative effectiveness of two commonly used filter types in capturing eDNA.
Materials and Methods
Study Sites
This field study was conducted in a coastal embayment near Milford, CT in the LIS (Figure 1) and leveraged an ongoing project that routinely sampled an oyster aquaculture cage farm (Farm) and nearby rock reef (Reef) that are <2 km apart. Connecticut Department of Energy and Environmental Protection (DEEP) conducts fisheries trawling surveys at various sites in LIS. On 6/27/2019 both eDNA analysis and trawling (Figure 1) were conducted. The farm was located on a 0.11 km2 shellfish lease and consisted of 40+ commercial oyster cages. The reef (discontinuous over 0.25 km2) contained cobble and boulders <1 m high covering up to 70% of the seafloor (Mercaldo-Allen et al., 2011). Approximate mean low water depths ranged 3–5 m at the study sites, with a 2-m tidal range. Temperature, salinity, and dissolved oxygen were measured at the same time as water sampling near the seafloor at each site using a handheld, Yellow Springs Instrument Co., (Yellow Springs, OH, United States) optical dissolved oxygen, salinity, and temperature meter.
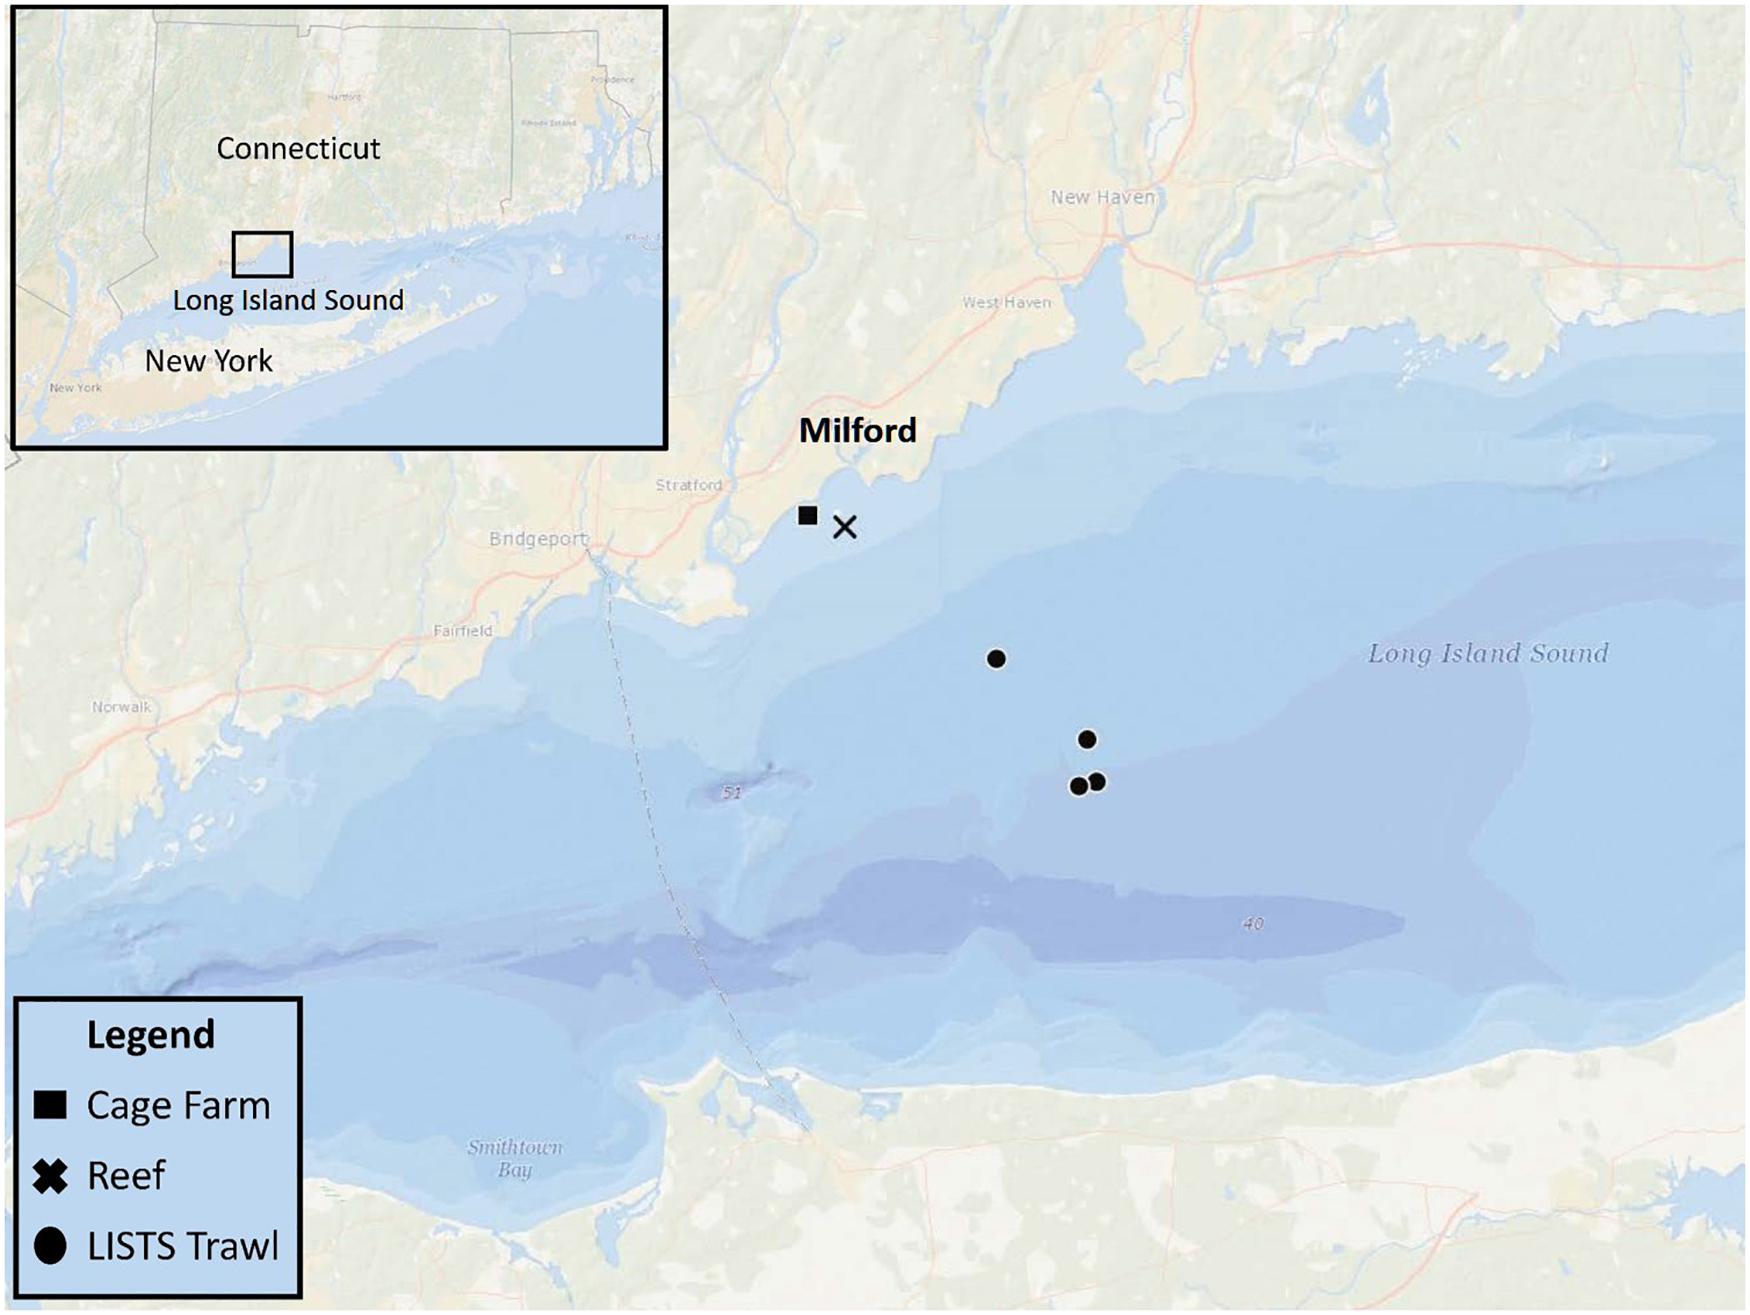
Figure 1. eDNA sampling sites: an oyster aquaculture cage farm (Cage Farm, 41° 11.379′ N, 73° 04.170′ W) and nearby cobble and boulder reef (Reef, 41° 1.175′ N, 73° 3.762′ W). Three CT DEEP trawling sites (LISTS Trawl) northeast to the eDNA sampling sites.
Sampling and Metabarcoding
Seawater samples were collected by boat on three occasions: 6/27, 7/18, and 8/15 during 2017. Four replicate, 1-L water samples were collected from 0.5 m above the seafloor at each site using a Niskin bottle. Water samples were kept on ice in Nalgene HDPE bottles until filtered in the laboratory, usually within 2 h of collection. Two replicate water samples from each site were filtered through Millipore nylon filters (47 mm, 0.45 μm), and the other two were filtered through Millipore polycarbonate filters (47 mm, 0.4 μm). The nylon filter was chosen because of its successful paired application with Qiagen DNeasy Power Water Kit (previous MoBio Power Water kit) (Djurhuus et al., 2017) and its common employment in other eDNA studies, such as a recent one in New York waters (Stoeckle M. et al., 2017). The polycarbonate filter was chosen because of its superiority in capturing marine microbes (Kemp et al., 1993), the focus when eDNA metabarcoding was first applied. Filters were stored at −20°C until DNA extraction, which occurred within 3 months of collection.
Filters were processed using Qiagen DNeasy PowerWater kit (Djurhuus et al., 2017), following the manufacturers’ protocol. A blank membrane of each filter type was treated the same way as other sample-containing filters, and resulting extracts were used as negative controls in PCR and other subsequent steps. DNA extracts were quantified using Qubit and typically measured 15 ng/μl (ranged 5–50 ng/μl). PCR was conducted following the Illumina 16S metabarcoding protocol. 12S-V5 primer pair (Riaz et al., 2011) amplifying ∼120 bp of the V5 variable region of mitochondrial 12S rRNA gene was used. Primer sequences including the overhang adapters (bold) were: Forward: 5′- TCG TCG GCA GCG TCA GAT GTG TAT AAG AGA CAG ACT GGG ATT AGA TAC CCC -3′, and Reverse: 5′- GTC TCG TGG GCT CGG AGA TGT GTA TAA GAG ACA GTA GAA CAG GCT CCT CTA G -3′. To reduce stochastic effects during PCR, triplicate amplifications for each seawater sample were run and then consolidated. PCR was run with GE Healthcare Illustra puRe Taq Ready-To-Go PCR beads in a 25 μL system wherein 5 μL of DNA (5 μL H2O for negative controls) was mixed with each primer at a final concentration of 200 nM. PCR conditions included 7 min at 95°C, 40 cycles of 30 s at 95°C, 30 s at 52°C, and 30 s at 72°C, followed by 10 min at 72°C before holding at 4°C (Stoeckle M. et al., 2017). After consolidating triplicate PCR products, a 5 μL subsample of the mixture was checked visually using gel electrophoresis, and remaining PCR reactions, including negative controls, were cleaned up using AMPure XP and re-suspended in 40 μL elution buffer (1X TE, pH = 8). Negative controls never formed visible bands on agarose gels but were sequenced nonetheless. Illumina sequencing adapters and dual-index barcodes were added to the purified amplicons using the Nextera XT Index kit through eight cycles of (30 s at 95°C, 30 s at 55°C, 30 s at 72°C), followed by 5 min at 72°C. The PCR reaction was prepared by mixing 10 μL PCR product from the previous step and 2.5 μL each of the Nextera primers in a 25 μL, GE Illustra PCR beads system. Indexed PCR products were cleaned up using AMPure XP, and the purified products were checked on an Agilent 2100 Bioanalyzer before being quantified with the KAPA qPCR Library Quantification Kit to ensure that 10 nM of each library flanked by the i5 and i7 index adapter sequences was pooled for Illumina MiSeq sequencing (MiSeq Reagent Kit v2, 2 × 150 bp) at Cold Spring Harbor Laboratory Genome Center.
Bioinformatics and Statistical Analysis
Paired FASTQ files (NCBI BioProject ID PRJNA498484) were processed using DADA2 (Callahan et al., 2016), with the output data matrix encompassing the abundance of amplicon sequence variants (ASVs) from the 24 samples. Standard parameters were applied in DADA2 where sequence reads with quality scores <2 and maximum number of expected errors >2 were filtered. All unique DADA2 ASVs were classified per reference sequences in GenBank using Basic Local Alignment Search Tool (BLAST). Query sequences with 100 and 99% full-length match to GenBank reference sequences were assigned identifications, which were further corroborated by species recorded in trawling and seining studies conducted by Connecticut DEEP in LIS [LIS Trawl Survey, Estuarine Seine Survey, and Inshore Seine Surveys in Connecticut and Thames rivers (CT-DEEP, 2016)].
Further data filtration was performed following methods applied in recent studies in European ponds and New York waters (Valentini et al., 2016; Stoeckle M. et al., 2017), wherein rare ASVs (<0.1% of reads per taxa or per library) were eliminated from multivariate analysis. Major ASVs were left behind, and non-finfish ASVs were removed to form the major finfish data matrix, which was then fed into PC-Ord (v7.06, MjM Software Design) for non-metric multidimensional scaling ordination analysis (NMS) using Bray-Curtis distance as the dissimilarity measure. NMS does not assume a linear relationship in species abundance data and is recommended for community ecology studies (McCune and Grace, 2002). One sample was identified as an outlier and excluded from NMS; ASV abundances from the remaining 23 samples (main matrix) were square-root transformed, per recommendation for abundance data with a high degree of variation (McCune and Grace, 2002; Peck, 2016). The second matrix included sampling site, sampling month, filter type, temperature, salinity, and dissolved oxygen concentration. Ordination was run on slow and thorough mode in PC-Ord. Permutational multivariate analysis of variance (PERMANOVA) was performed using the statistical software program Primer v7 with the PERMANOVA add-on (Primer-e, Quest Research Ltd.), which has the added capability of testing both main effects and interactions among factors. PERMANOVA was used to determine the main effects of sampling month, site, and filter type, as well as interactions among all three factors.
Results
Finfish Communities – Major Taxa and Ordination Patterns
No finfish ASVs were present in the negative PCR control, suggesting that no finfish contamination was introduced during PCR, cleanup or subsequent sequencing steps. There were 17 major finfish taxa (Table 1, Figure 2A and Supplementary Material) retained in the NMS analysis (Figure 3). All 17 taxa are among the most common species identified in CT DEEP surveys (CT-DEEP, 2016). Atlantic menhaden (Brevoortia tyrannus) and American shad (Alosa sapidissima) had fewer sequence reads during July, while Atlantic thread herring (Opisthonema oglinum) were detected in July only (Table 1 and Figure 2A). Although present throughout the sampling season, bay anchovy (Anchoa mitchilli) and bluefish (Pomatomus saltatrix) had the most sequence reads in July (Table 1 and Figure 2A). Structure-oriented species including cunner (Tautogolabrus adspersus), black sea bass (Centropristis striata), and tautog (Tautoga onitis) had more sequence reads in samples collected at the reef; whereas, hogchocker (Trinectes maculatus) had more sequence reads in samples collected at the farm (Table 1 and Figure 2B).
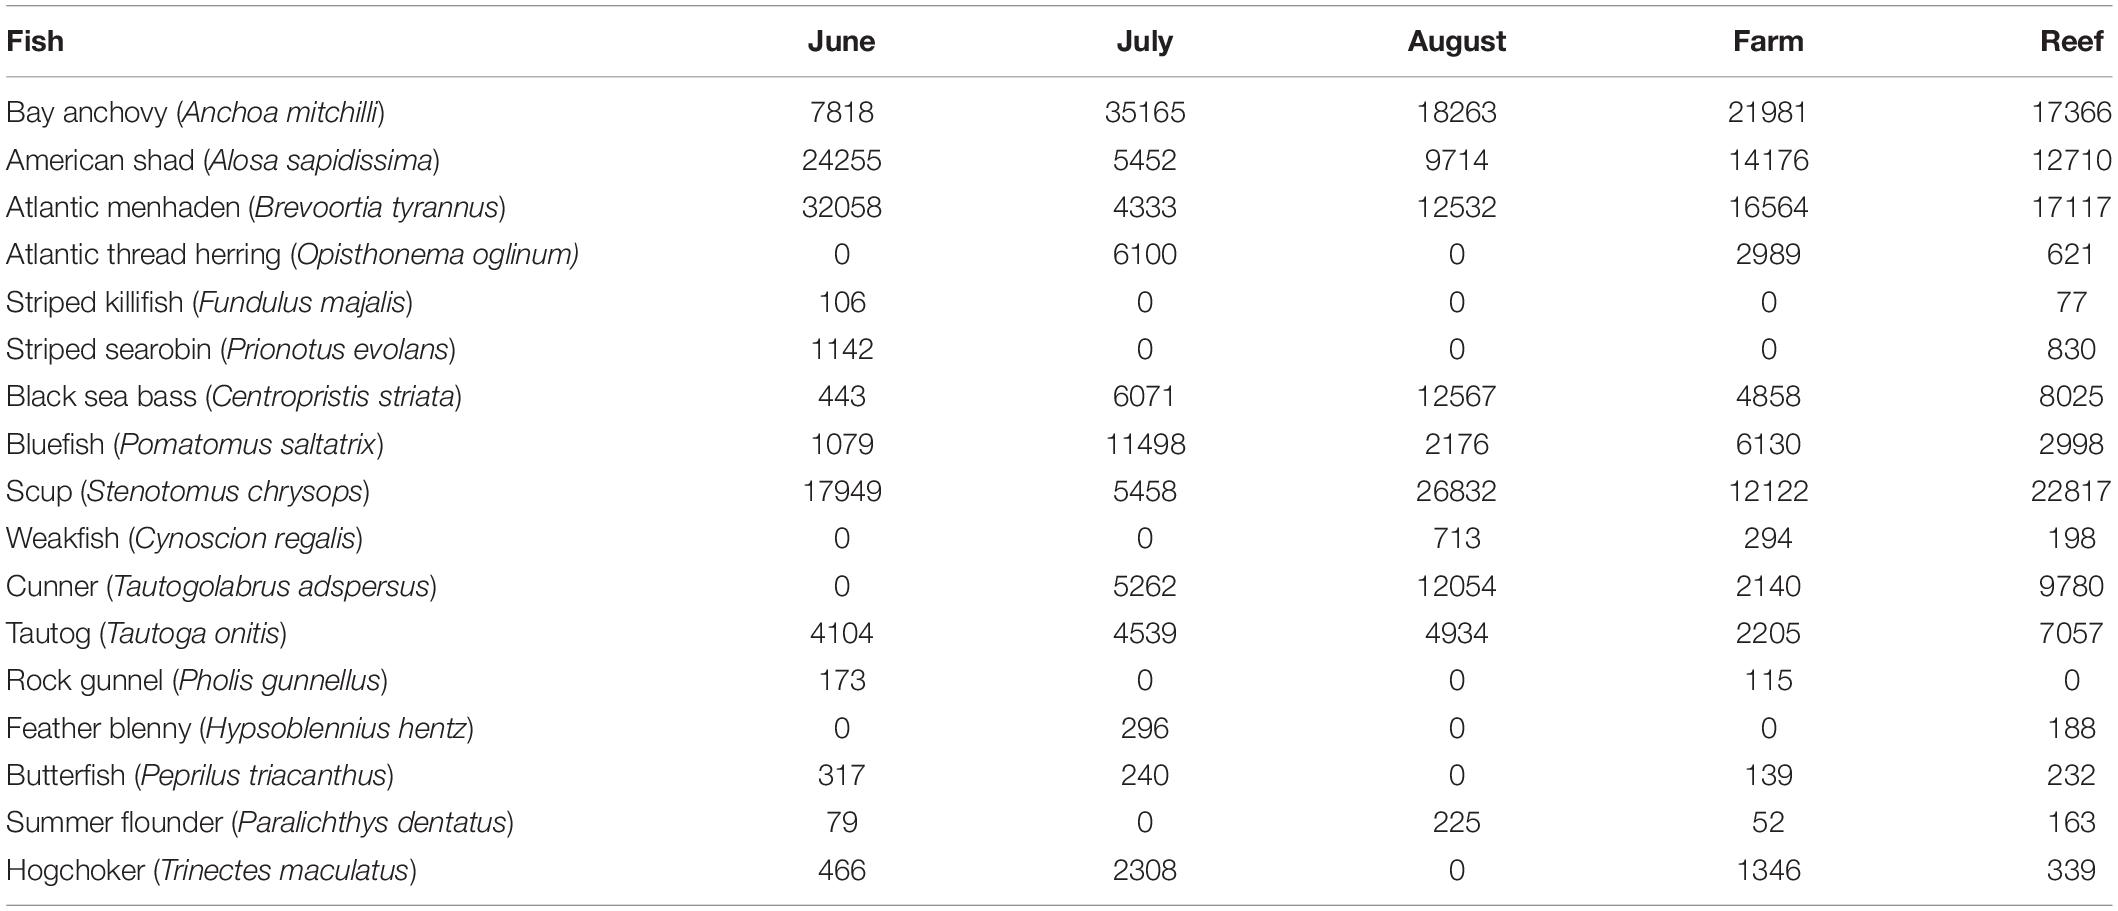
Table 1. Major finfish taxa and their average sequence abundance per month (8, 7, and 8 samples for June, July, and August, respectively) and per site (12 and 11 samples at Farm and Reef, respectively).
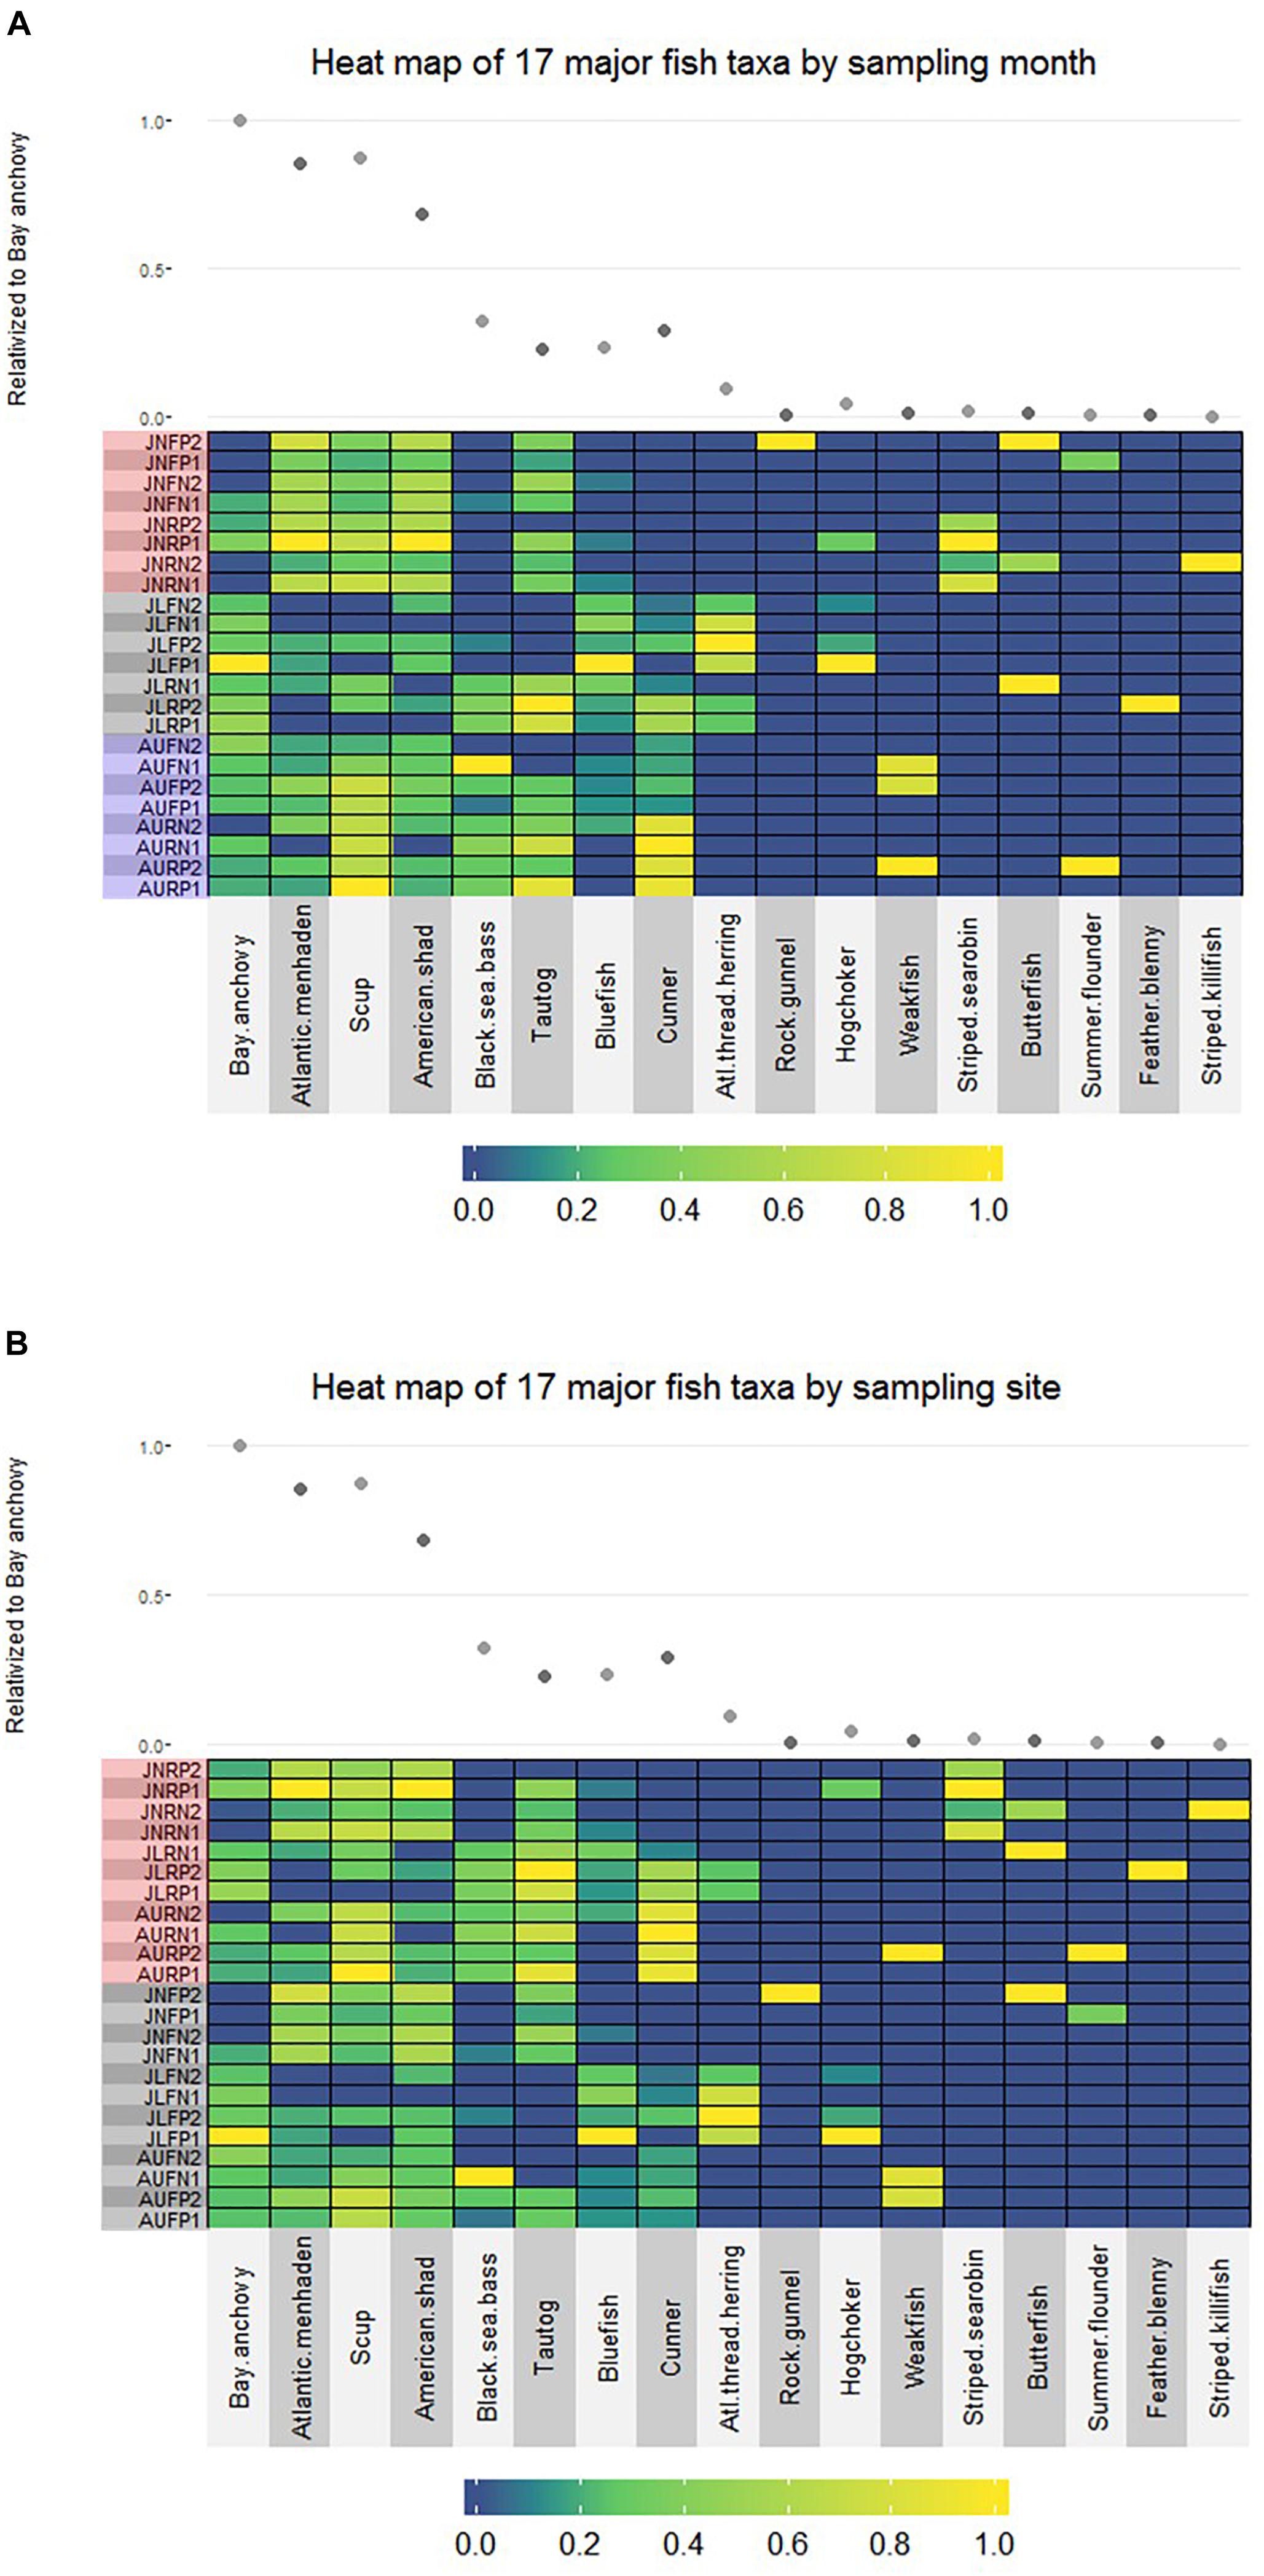
Figure 2. (A) Relative abundance of 17 major finfish taxa (JN: June; JL: July; AU: August; F: Farm; R: Reef; N: Nylon; P: Polycarbonate) organized by sampling month (red shadow: June; gray shadow: July; blue shadow: August). For each taxon, read number of individual sample is relativized to the highest value within the taxon; the average read number of each taxon is relativized to that of the bay anchovy (scatter plot), the species with the highest sequence abundance across all samples. (B) Relative abundance of 17 major fish taxa (JN: June; JL: July; AU: August; F: Farm; R: Reef; N: Nylon; P: Polycarbonate) viewed by sampling site (red shadow: Reef; gray shadow: Farm). For each taxon, read number of individual sample is relativized to the highest value within the taxon; the average read number of each taxon is relativized to that of the bay anchovy (scatter plot), the species with the highest sequence abundance across all samples.
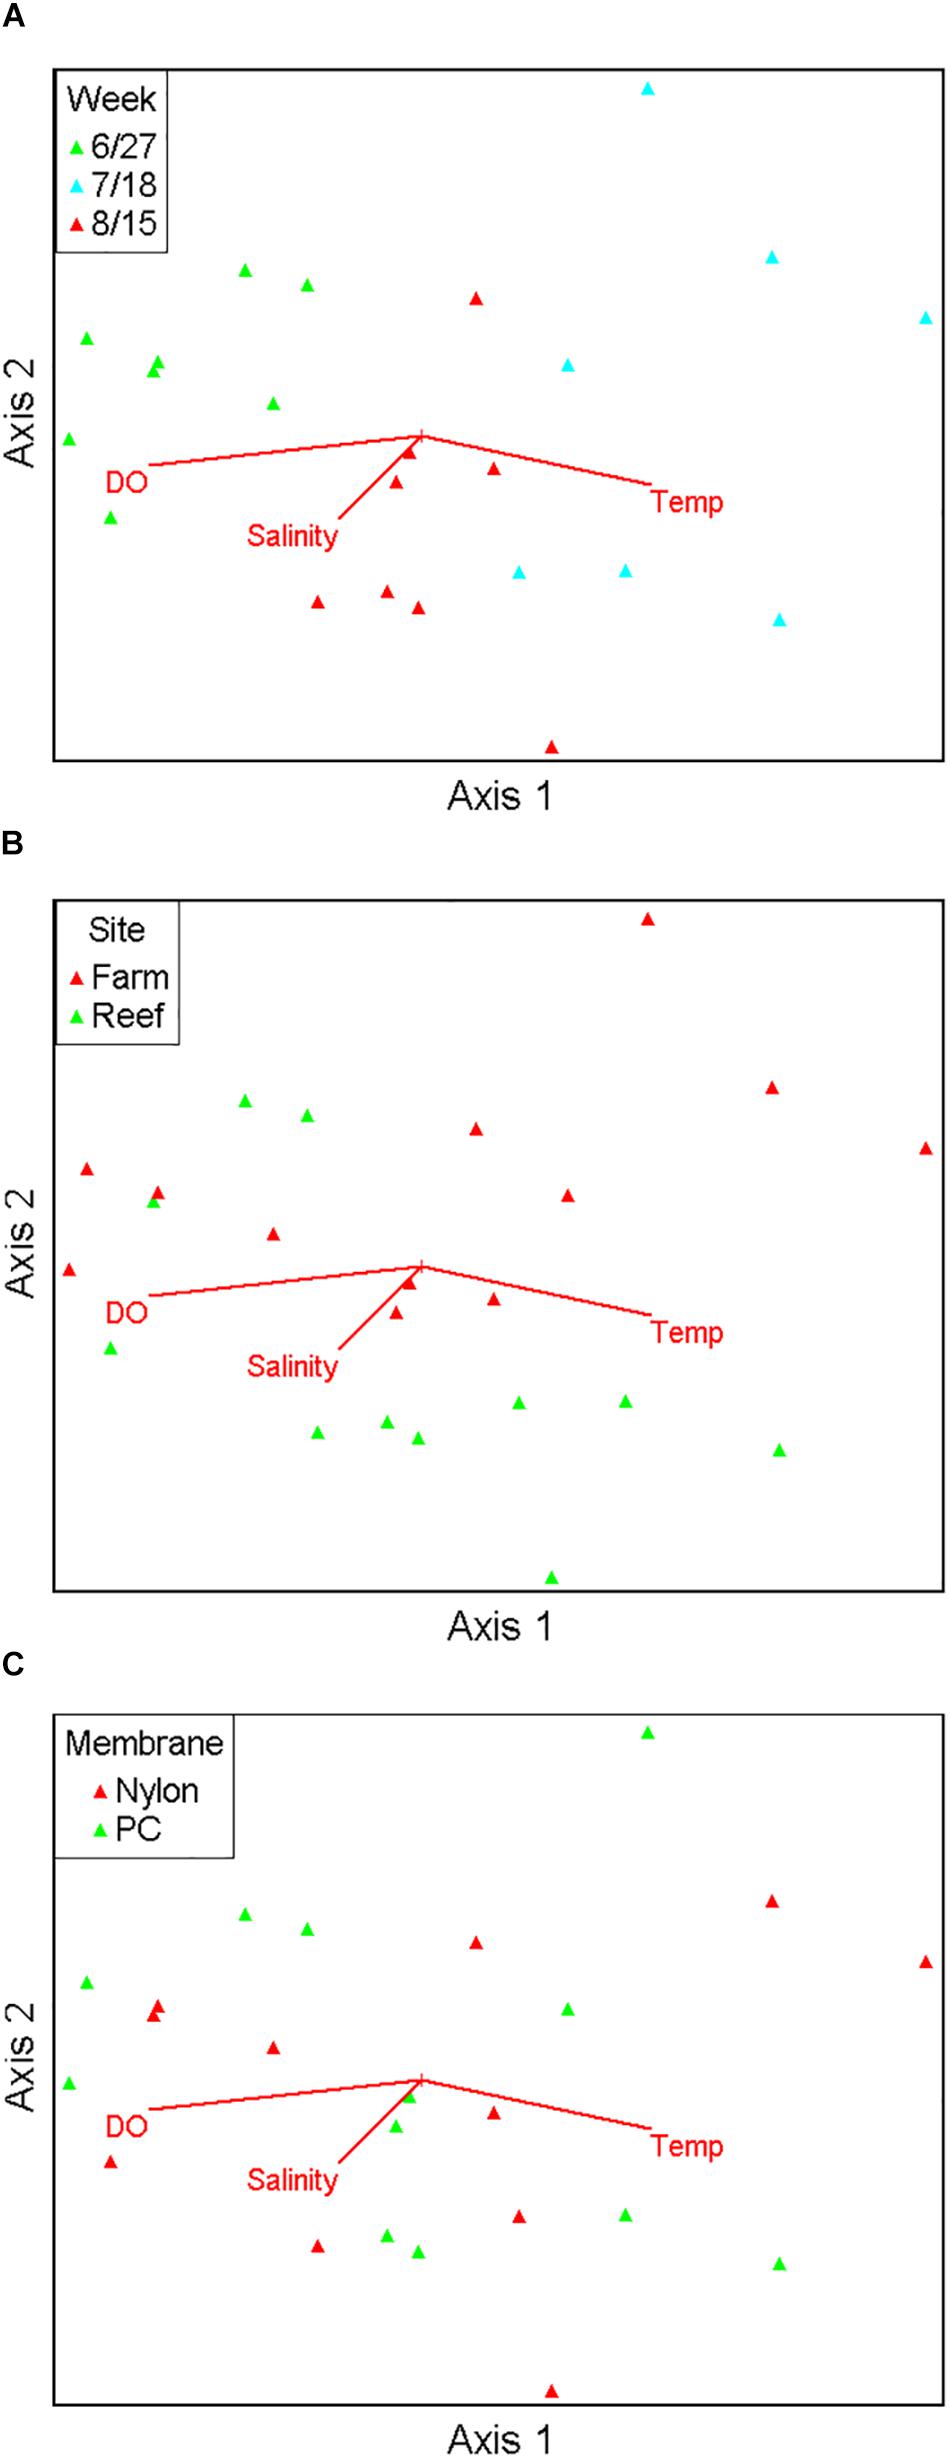
Figure 3. Non-metric multidimensional scaling ordination comprising 17 major fish taxa viewed as biplots grouped by sampling month (A), site (B), and filter type (C), with numerical environmental parameters superimposed as vectors.
Ordination analysis revealed a low-stress (stress = 10) 2D resolution in which axis 1 represented 73% of variance, and axis 2 represented 16% of variance among all samples (Figure 3). Temperature (r = 0.74) and dissolved oxygen (r = −0.77) were significantly associated with axis 1 whereas salinity was not significantly associated with either axis. The clearest separation between samples was among sampling months along axis 1 (Figure 3A). Separation of samples between sites was along axis 2, with some apparent separation of samples by site in July and August (Figure 3B). There was virtually no separation by filter type (Figure 3C). PERMANOVA results (Table 2) were consistent with the structure observed in the NMS ordination plots. Month was the only significant factor (p = 0.001). No interactions among month × site × filter type, month × filter type, or site × filter type were observed (p = 0.1615, 0.8771, and 0.2266, respectively). A significant interaction between month × site was observed (p = 0.0104), and subsequent pairwise tests indicated no significant differences in finfish communities between sites in June (p = 0.1928), but significant differences between sites in July and August (p = 0.0393 and 0.0468, respectively).
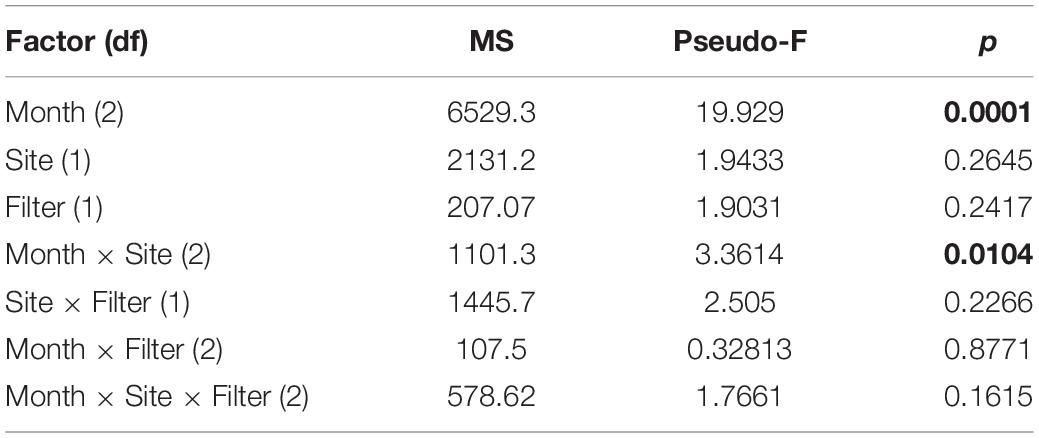
Table 2. Results of PerMANOVA analysis indicating main effects and interactions of main effects. Significant differences (p < 0.05) are in bold.
Pearson correlation analysis showed that finfish taxa significantly associated with axis 1 and axis 2 were different. Atlantic menhaden (Brevoortia tyrannus, r = −0.814), American shad (Alosa sapidissima, r = −0.687), bay anchovy (Anchoa mitchilli, r = 0.766), Atlantic thread herring (Opisthonema oglinum, r = 0.721), and bluefish (Pomatomus saltatrix, r = 0.610) were significantly associated with axis 1 (p < 0.01), the axis that demonstrated the temporal variation, and aligned with temperature as well as dissolved oxygen. Cunner (Tautogolabrus adspersus, r = −0.746), black sea bass (Centropristis striata, r = −0.738), tautog (Tautoga onitis, r = −0.698), and hogchoker (Trinectes maculatus, r = 0.619) were significantly associated with axis 2 (p < 0.01), the axis that was associated with the observed spatial variation in samples, but did not align with any environmental variable.
Rare Taxa and Their Detection With the Two Filter Types
Twenty of the 25 rare finfish taxa detected (Table 3 and Supplementary Material) are not only recorded in CT DEEP surveys but also have sequences matching 99–100% to those in GenBank (YES in the last column of Table 3). Four of the remaining 5 ASVs either have GenBank matches never recorded in DEEP surveys (NO in the last column of Table 3) or have other identification ambiguities, and these sometimes represent local genetic relatives to GenBank matches (yes in the last column of Table 3), based upon the following molecular and morphological criteria: (1) Giant trevally (Caranx ignobilis, 99%) and seaboard goby (Gobiosoma ginsburgi,100%) were identified as DEEP-recorded species yellow jack (Caranx bartholomaei)/crevalle jack (Caranx hippos)/blue runner (Caranx crysos) (McBride and McKown, 2000) and naked goby (Gobiosoma bosc), respectively, – local genetic relatives without reference sequences in GenBank. Although not recorded in DEEP surveys, seaboard goby (Gobiosoma ginsburgi) was also a suggested ID (Table 3) based upon its reported detection in LIS (Able and Fahay, 2010); (2) The species redbreast sunfish (Lepomis auritus) was identified based upon DNA sequences, but DEEP identified sunfish only to family level; and (3) One rare ASV matching multiple eel species in GenBank was identified as American eel (Anguilla rostrata), because it is the only eel species recorded in DEEP surveys. Another rare ASV never recorded in DEEP surveys matched perfectly with GenBank Pacific sand lance (Ammodytes hexapterus), but poorly (96%, not shown in Table 3) with the local relative American sand lance (Ammodytes americanus).
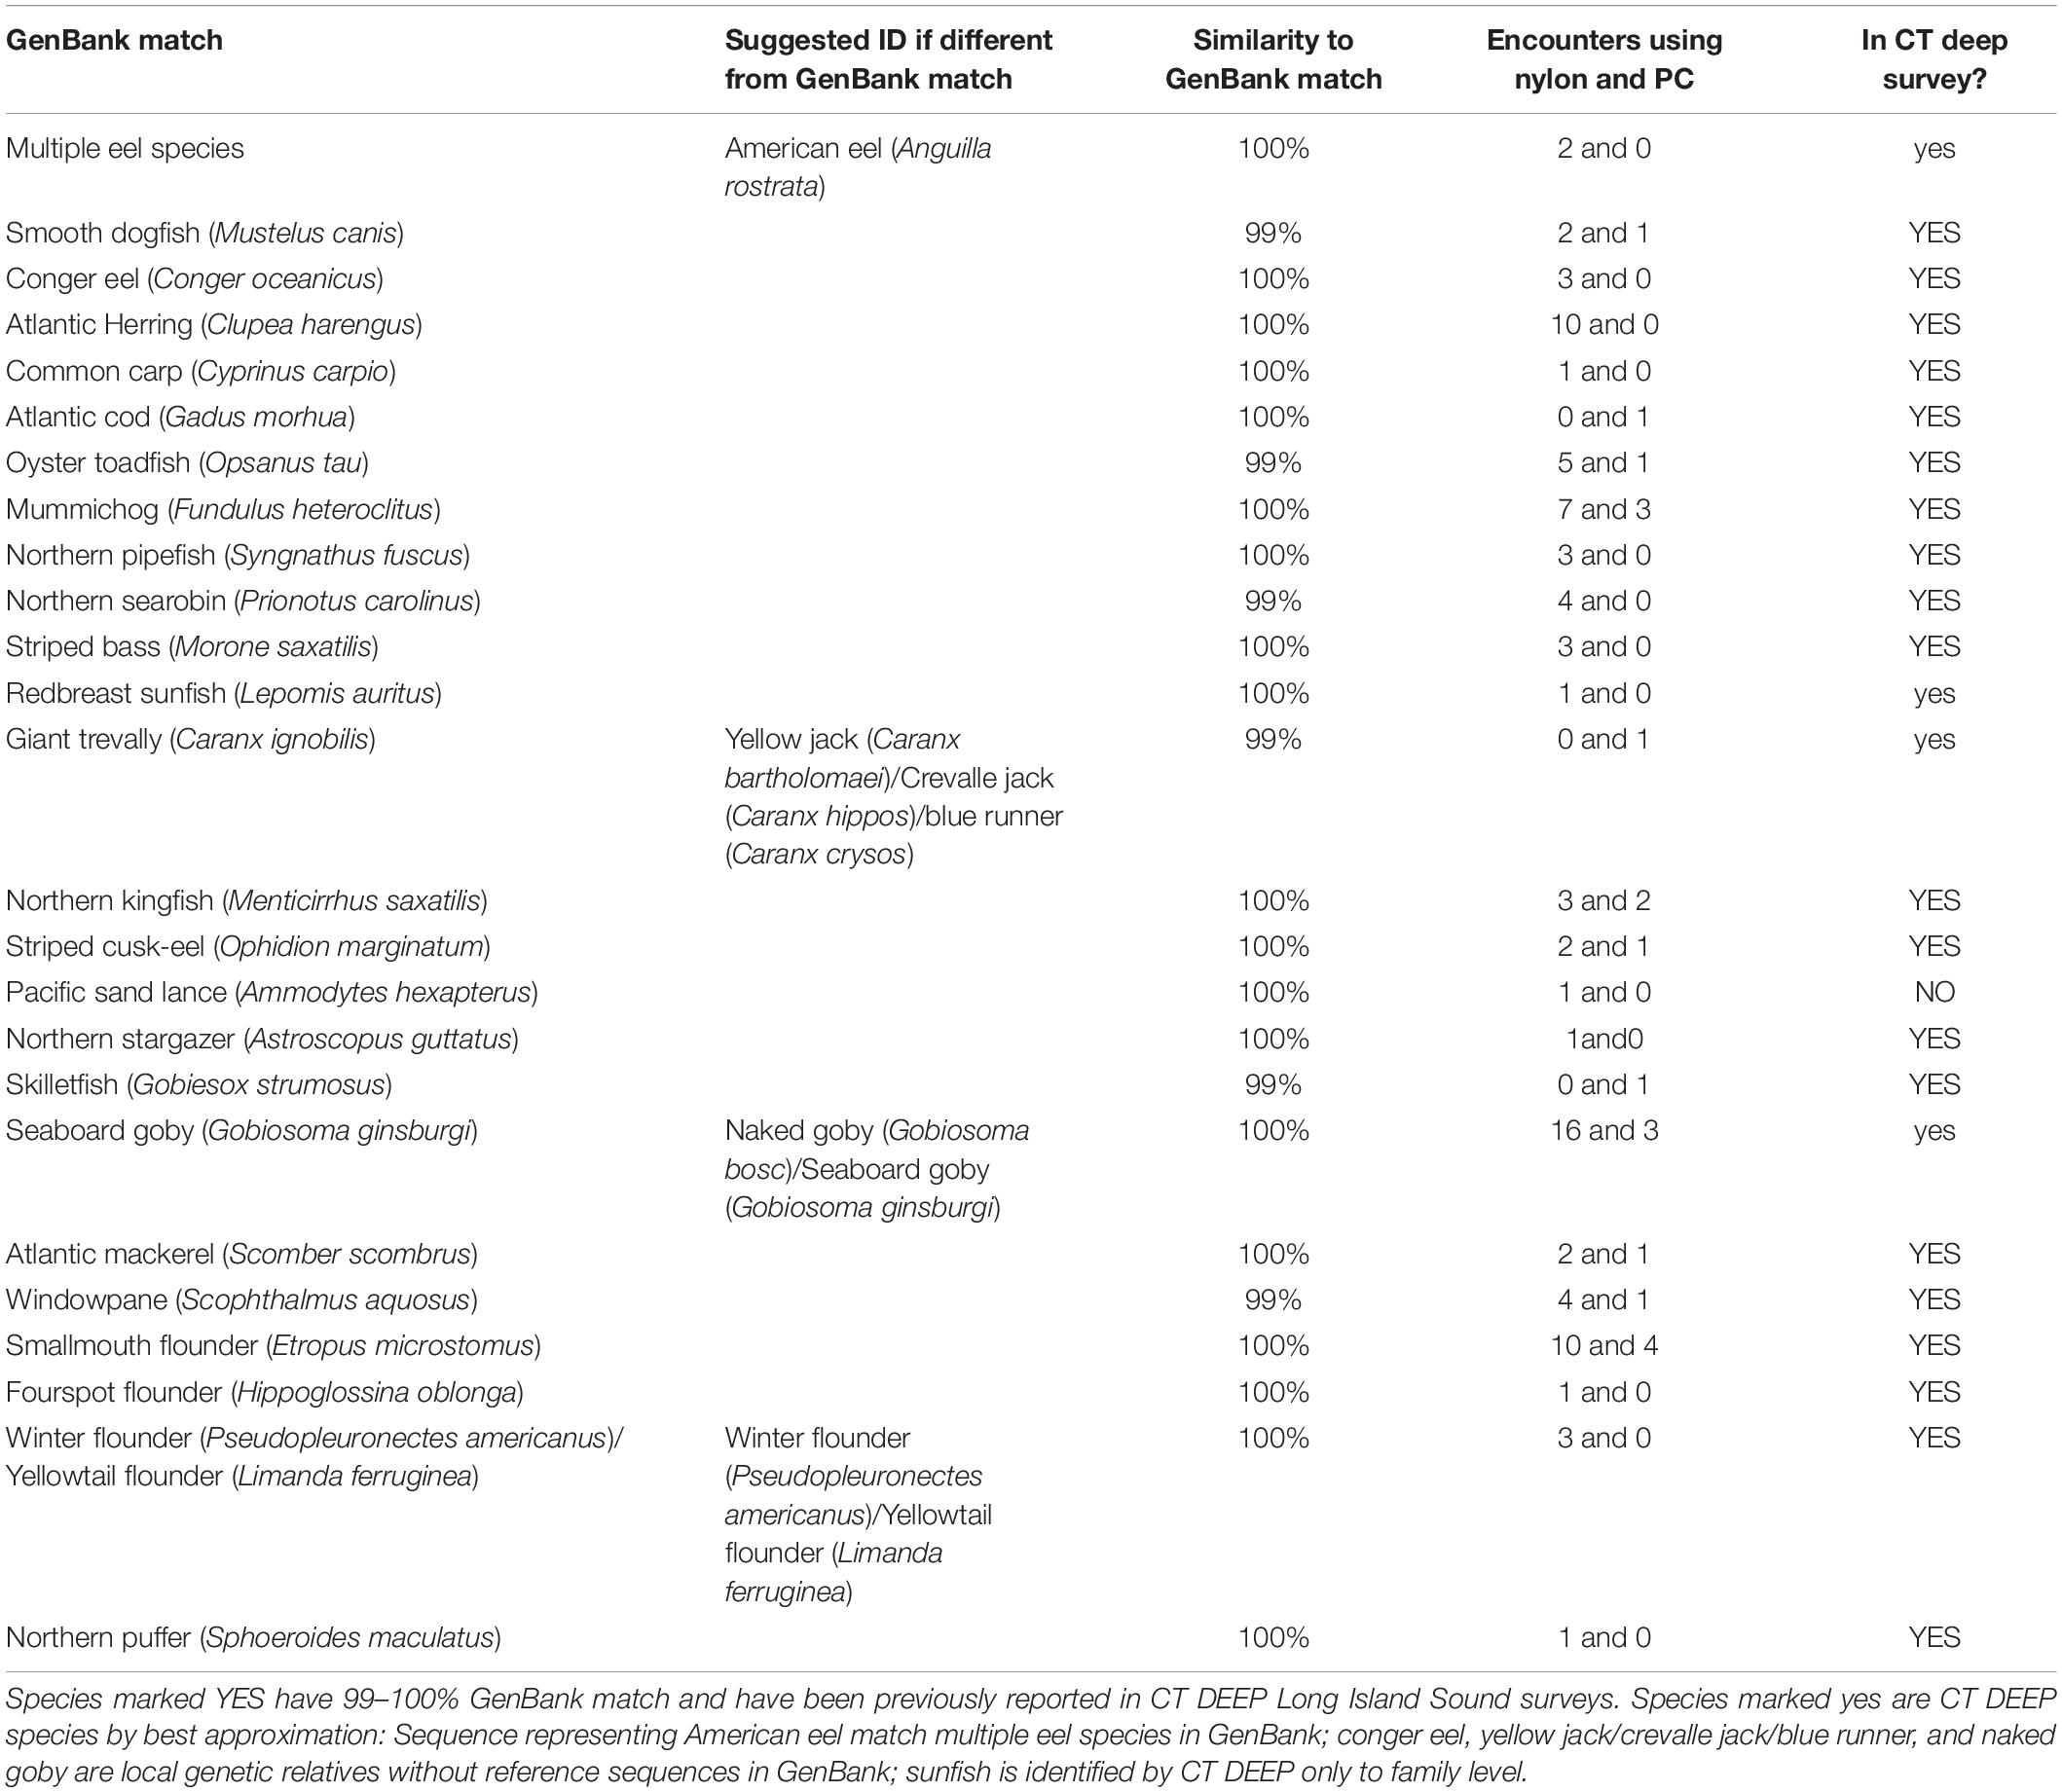
Table 3. Rare fish taxa (represented by <0.1% ASVs) detected in this study.
Although not a significant factor in the ordination analysis of the major finfish taxa, filter type influenced the efficiency in rare taxa capture. The nylon filter was associated with higher encounter rates than the polycarbonate filter for 22 of 25 rare fish taxa (Table 3, column 4). A paired, two-sample t-test of the means of encounter rates confirmed that the nylon filter was associated with higher average encounter rates across all rare taxa than the polycarbonate filter (nylon = 2.08, polycarbonate = 0.8, p = 0.001).
eDNA Metabarcoding and Trawl Survey
Corroboration of eDNA identification with historical DEEP survey data currently available (CT-DEEP, 2016) confirmed that all finfish taxa classified by eDNA have been caught in DEEP trawl surveys, with the exception of Pacific sand lance (Ammodytes hexapterus). Although the full DEEP 2017 report was still underway, a subset of trawling data was obtained and compared with eDNA data on 6/27/2017, the only day when both trawling and eDNA data were available. Four DEEP trawls covering a total bottom area of 104,268 m2 were towed at 10–17 km southeast to eDNA sampling sites in LIS (Figure 1). Collectively, eDNA and trawling detected 31 finfish species, with 10 overlapping detections, 14 unique eDNA detections, and 7 unique trawling detections (Table 4). While the 14 unique eDNA detections covered a wide range of finfish taxa, unique trawling detections pointed to four flounder species and three hake species. All four flounder species were also detected using eDNA metabarcoding at other sampling times (Tables 3, 4) whereas no hake species was ever detected using eDNA metabarcoding.
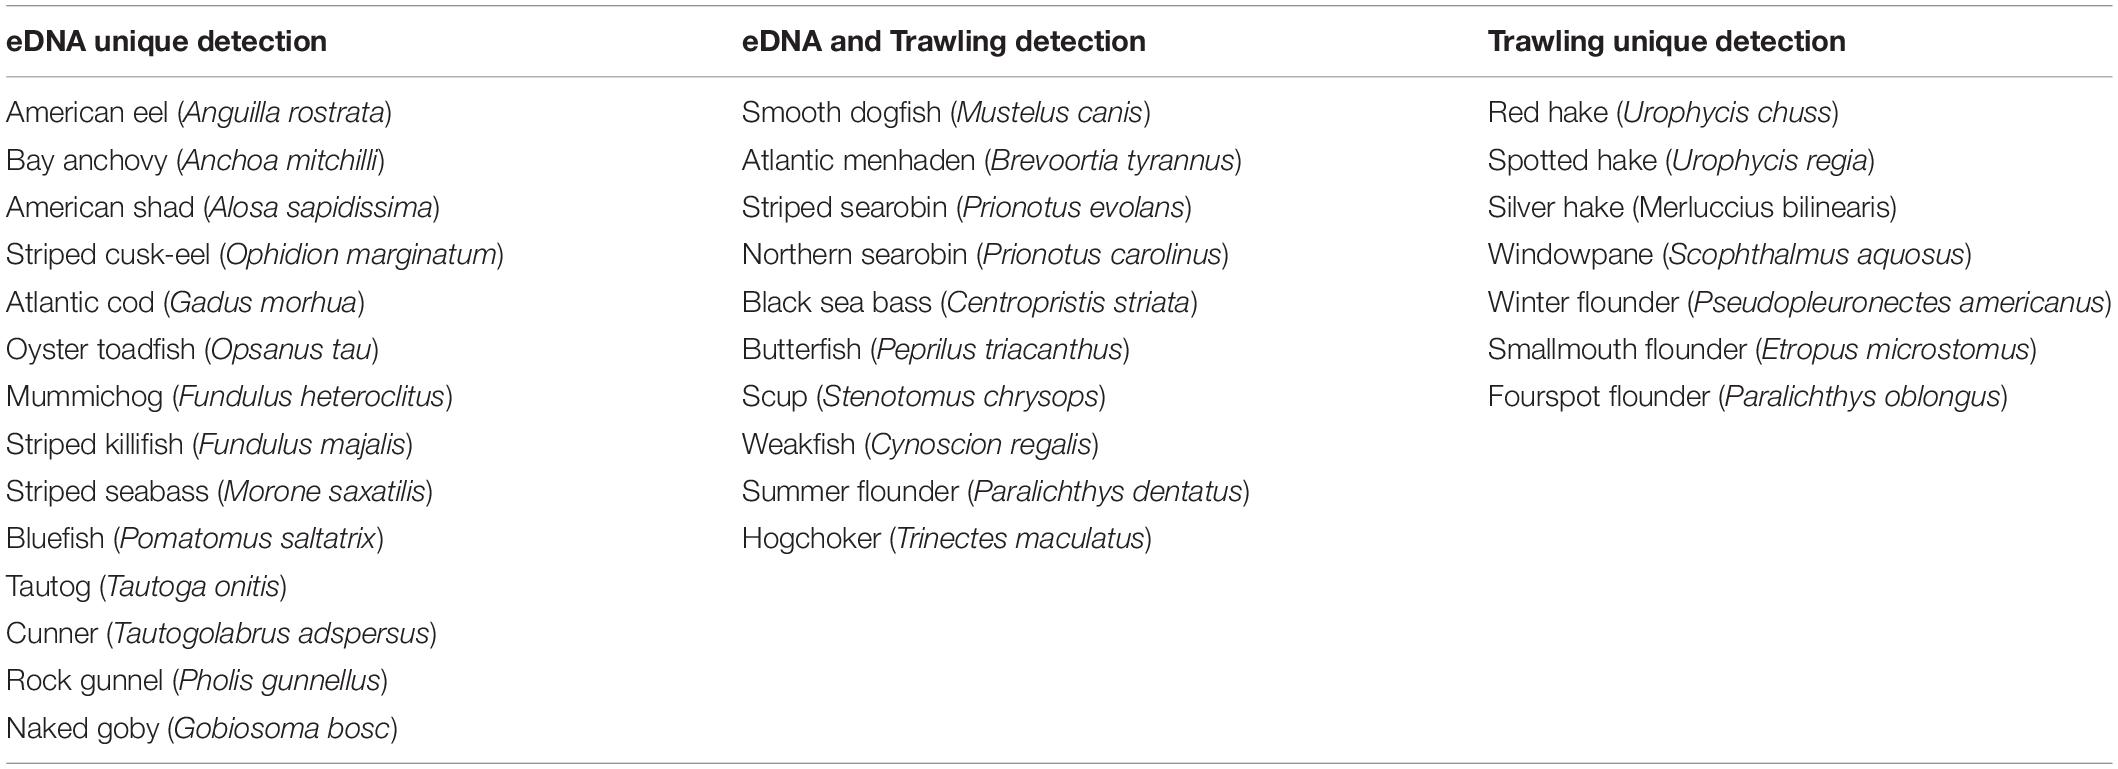
Table 4. Finfish uniquely detected by eDNA, commonly detected by eDNA and trawling, and uniquely detected by trawling on 6/27/2017 in Long Island Sound.
Discussion
Finfish Detected by eDNA Metabarcoding
Here, we demonstrate the utility of eDNA metabarcoding to survey finfish diversity in an estuarine environment and its potential to enhance fishery resources monitoring and management. Seventeen major and 25 rare finfish ASVs were identified during summer 2017. While this study benefited greatly from recent contribution of local reference sequences into GenBank (Stoeckle et al., 2018), and by validation of eDNA identification using historical DEEP trawl survey data, we suggest that the incomplete status of reference sequence databases for finfish species remains an important research gap. To improve reference databases, we recommend: (1) contributing known species sequences currently absent, especially those that are locally relevant; (2) updating low-quality sequences; and (3) incorporating multi-metabarcoding when single metabarcode does not provide definitive taxonomic information.
Increased availability of reference sequences, especially those from similar geographical regions, enhances confidence in eDNA identification. For instance, three rare ASVs were identified as goldtail angelfish (Pomacanthus chrysuru), unicorn leatherjacket (Aluterus monoceros), and ocellated flounder (Ancylopsetta quadrocellata) at 96, 91, and 97%, when classification was first done in 2018, prompting the conclusion that these rare ASVs represented finfish taxa that did not yet have reference sequences available. As reference sequences of under-documented northwestern Atlantic finfish became available in GenBank (Stoeckle et al., 2018), the 3 rare ASVs were re-classified as striped cusk-eel (Ophidion marginatum), northern stargazer (Astroscopus guttatus), and fourspot flounder (Paralichthys oblonga) with 99, 100, and 100% match. These examples demonstrate the value of acquiring reference sequences from species with currently low GenBank representation. Similarly, a reasonable next step for understanding the lack of eDNA detection of hake species would be to obtain reference sequences from red hake and spotted hake (see below). Acquiring sequences of endemic finfish currently absent from GenBank would also clarify many tentative identifications, e.g., yellow jack (Caranx bartholomaei)/crevalle jack (Caranx hippos)/blue runner (Caranx crysos), and naked (Gobiosoma bosc)/seaboard goby (Gobiosoma ginsburgi). Per BLAST algorithm on scoring, the best match of one major ASV was bay blenny (Hypsoblennius gentilis), later determined to be feather blenny (Hypsoblennius hentz), the second best match. Feather blenny (Hypsoblennius hentz) was scored second because its reference sequence covered only 109 bases of the query sequence (although with a perfect match); the bay blenny (Hypsoblennius gentilis) covered 120 bases of the query sequence (but only a 98% match). Acquiring full-length mitochondrial 12S-V5 rDNA sequence for feather blenny (Hypsoblennius hentz) would provide unambiguous molecular evidence for our taxonomic assignment. Query sequences identified as rock gunnel (Pholis gunnellus), butterfish (Peprilus triacanthus) (Table 1), and American eel (Anguilla rostrata) (Table 3) matched reference sequences covering multiple gunnel, butterfish, and eel species, although the confidence in molecular identification was not compromised, in this case attributable to the DEEP survey data. We chose mitochondrial 12S-V5 rDNA as the metabarcode over cytochrome c oxidase subunit 1 (CO1) because of the successful application of the former in studying northwestern Atlantic finfish (Stoeckle M. et al., 2017) and the lack of a conserved region of the latter to design a metabarcode (Deagle et al., 2014). When needed, a multi-metabarcode approach including regions such as CO1 could provide unequivocal molecular information to render wider applications of eDNA metabarcoding as a fisheries surveying tool, even when traditional survey data are not available, or occasionally, when two species with identical 12S rDNA sequence are both present in the trawl survey list (Table 3, winter flounder and yellowtail flounder).
Given that the distance between eDNA sampling sites and DEEP trawling sites (10–17 km) exceeded the distance between the two eDNA sites (<2 km), and that there is currently no convention on how to normalize the sampling effort of eDNA metabarcoding and established surveys (Kelly et al., 2017), the comparison between eDNA and trawling detections on 6/27/2017 was exploratory. Using the area of seafloor covered during trawling (104,268 m2, CT DEEP in prep) and size of the net opening (0.3 m, estimated), the amount of seawater passing through the net during finfish trawl collection was about 3.1 × 10⁷ L on 6/27/2017. Meanwhile, 8 L of seawater was concentrated from the two sites for eDNA analysis on the same day. Higher number and wider range of taxa detected using eDNA metabarcoding (16S, 18S and CO1) versus trawling was previously reported in a study comparing eDNA and manual surveys in nearshore eelgrass habitats (Kelly et al., 2017). Although not designed to compare the two methods, our study reached similar conclusions for finfish communities in a temperate coastal environment using the 12S metabarcode. All species uniquely detected by eDNA have been reported present during summer in LIS (CT-DEEP, 2016). The lack of detection of these species in trawl surveys on 6/27/2017 could reflect the spotty distribution of hard-to-catch-by-net species with DNA that mixes and lingers in seawater, allowing for more sensitive detection by eDNA metabarcoding. Additionally, the mesh of trawling nets dictates that smaller fish would not be caught whereas the eDNA method does not have such limitations.
Interestingly, no hake species were detected by eDNA metabarcoding. This could be a result of lower abundance of hake on 6/27/2017 than other finfish species, although trawling data does not support this as fewer summer flounder were collected versus silver hake and spotted hake (22 vs. 124 and 216, CT DEEP in prep). Alternatively, hake species may excrete less DNA than other finfish, or hake DNA may be poorly amplified during PCR reactions; both potential explanations could be tested using experiment tanks with hake and other finfish as well as mixing reference DNA from hake and other finfish as PCR templates. In the future, acquiring 12S reference sequences for red hake and spotted hake would be useful in confirming the negative detection of hake species using eDNA metabarcoding, as these two hake species have no 12S reference sequences available at the time this manuscript was prepared, i.e., a “no hit” does not necessarily mean no detection. Although the data sets for comparison are limited, our findings agree with the previous study (Kelly et al., 2017), and show that eDNA metabarcoding and trawl surveys provide different and complementary views of finfish communities. The higher sensitivity of eDNA methods provides an effective option to survey biodiversity in otherwise challenging or impossible to sample conditions.
The high sensitivity of eDNA metabarcoding revealed finfish species rarely observed in traditional surveys. Atlantic thread herring (Opisthonema oglinum, 100% match) was abundant in all July samples, which was unexpected given that the northernmost geographical distribution for this species is typically Maryland. Interestingly, this species was captured once in a 2015 trawl survey (CT-DEEP, 2016). Continued eDNA sampling is called for to clarify if there has indeed been northern expansion of this species. Occasionally, sequences from finfish commonly consumed but not expected to be present locally are captured using eDNA metabarcoding (Stoeckle M. et al., 2017). The one-time unambiguous (100%) detection of Pacific sand lance (Ammodytes hexapterus, Table 3) was unexpected because this species is endemic to the Pacific but not the Atlantic Ocean. By location, Ammodytes in LIS should be American sand lance (Ammodytes americanus) (Nizinski et al., 1990; Able and Fahay, 2010); however, there has been historic confusion about its taxonomy, particularly because the meristics used to identify Ammodytes species vary by latitude and inshore-offshore clines (Richards et al., 1963; Nizinski et al., 1990). For example, 23 nominal species have been described but far fewer are recognized, the synonyms vary by study (Nizinski et al., 1990), and molecular approaches have recently revealed cryptic species of Ammodytes in the Pacific (Orr et al., 2015). We propose three possibilities for this surprising detection. First, there could be errors in GenBank due to misidentification, unresolved synonyms, or yet to be revealed cryptic species that have confounded identification within this genus. For example, Pacific sand lance has been suggested to be circumpolar and synonymous with American sand lance and Raitt’s sand eel (Ammodytes marinus) (Richards et al., 1963). Second, mitochondrial 12S rDNA marker we used could have insufficient resolution among base pairs to distinguish between all Ammodytes spp., even between populations on two different coasts. Third, there could have been an invasion or introduction of Pacific sand lance into LIS, such that eDNA metabarcoding is in fact detecting distributional shifts of fishes. Given that Ammodytes spp. are an important forage fish in marine ecosystems (Richardson et al., 2014), more attention to basic taxonomy of this genus is warranted in the Atlantic Ocean, as has occurred recently in the Pacific (Orr et al., 2015). Our results demonstrate the value of eDNA metabarcoding for rapid and sensitive documentation to augment existing literature for finfish species distribution patterns. For invasive species surveillance using eDNA, we highlight the need to acquire high-quality reference sequences, sometimes of multi-metabarcodes, to achieve unequivocal molecular identification. Additionally, metabarcoding results can direct research efforts when designing qPCR assays specific for potential ecological invaders. Another question of concern to management and policymakers is whether or not a rare (protected, ephemeral, or cryptic) species is present in an ecosystem and how to confidently link detection of low-frequency eDNA to confirmed finfish presence. Replicate samplings to facilitate application of mathematical tools such as the occupancy model (Lahoz-Monfort et al., 2016; Kelly et al., 2017; Strickland and Roberts, 2018) may be the solution.
Temporal Variation and Spatial Separation of Finfish eDNA
Residence time and detection of aquatic eDNA are affected by many factors, such as finfish species, individual size, life stage, and environmental conditions (Lacoursière-Roussel et al., 2016; Sassoubre et al., 2016; Stoeckle B.C. et al., 2017). To precisely define and quantify these uncertainties a priori in aquatic environments that host a wide variety of highly migratory finfish is difficult, and this hinders our ability to interpret the quantitative information of eDNA metabarcoding. Recognizing the challenges associated with a snapshot approach when using eDNA metabarcoding in highly dynamic ecosystems, we included spatial and temporal components in our sampling. The PERMANOVA results indicated strong temporal separation in samples, weaker but still significant spatial separation during July and August, and no separation by filter type (Table 2). Given the close geographical proximity and limited number of the sites, it was not surprising that observed community differences were small relative to temporal differences across samples. The discovery of significant spatial variation in July and August suggested that associations between fish assemblages and the two structured habitats could be seasonal in nature. To summarize, eDNA metabarcoding is effective in identifying temporal and spatial variations in finfish assemblages, as well as different finfish taxa significantly associated with the axes demonstrating these variations.
Filter Type Influences Rare Taxa Detection
An urgent next step to facilitate incorporation of eDNA metabarcoding into biodiversity surveys is establishment of a standard operating procedure, ideally including eDNA concentrating methods, DNA extraction protocol, sequencing details, bioinformatics, and eDNA data interpretation in relation to existing surveys (Shelton et al., 2016). Different choices of DNA metabarcodes also can bias toward/against different taxa. To compare studies, technical details of eDNA protocols must be well documented. Our study shows that choice of filter type can affect sample collection and data interpretation.
Nylon filters (47 mm, 0.45 μm) were chosen initially for concentrating eDNA as they are hydrophilic, offer a relatively fast filtration speed, and have a small pore size to recover the majority of macroorganismal eDNA ranging from 1 to 10 μm (Turner et al., 2014). Although nylon filters are widely used (Thomsen et al., 2012; Stat et al., 2017; Stoeckle M. et al., 2017), other filter types are available (Kelly et al., 2014; Turner et al., 2014; Hinlo et al., 2017; Kelly et al., 2017; Lacoursière-Roussel et al., 2018; Tsuji et al., 2019). We compared the performance of nylon filters to that of polycarbonate filters, as the latter is most commonly used for concentrating microbial cells. Nylon filters were more efficient at detecting rare taxa of <0.1% occurrence (p = 0.001). A previous study suggested that specific filter sizes or material may target specific eDNA particles of interest (Barnes and Turner, 2016). Polycarbonate filters have been considered a superior choice in retaining particles from aqueous liquid and are used widely for microscopy. Although this could mean higher retention of particulate eDNA sources such as bacterial and phytoplankton cells, the relative contribution to eDNA from extracellular materials, a significant source for macroorganismal eDNA, could be reduced when polycarbonate filters are used. Such bias during sampling could also be magnified through PCR, further contributing to lower detection of rare finfish taxa.
Conclusion
We have demonstrated that eDNA metabarcoding is a sensitive and effective technique to study temporal and spatial distribution patterns of highly migratory marine finfish, and holds great potential as a tool for species detection, ecosystem monitoring, biodiversity surveys, and environmental conservation. As we collect more groundtruthing information using eDNA metabarcoding and begin to incorporate this tool into the existing biodiversity survey system, enrichment of reference sequence databases to provide a complete accounting of species will undoubtedly help by allowing unambiguous molecular identification. Careful consideration and detailed documentation of sample collection and analysis methods are also required to enhance the precision of eDNA metabarcoding, as this not only contributes to comparability between eDNA studies, but also provides a framework within which eDNA results can be appropriately compared to traditional finfish surveys.
Data Availability Statement
Data can be accessed at NCBI BioProject ID PRJNA498484.
Author Contributions
All authors listed have made a substantial, direct and intellectual contribution to the work, and approved it for publication.
Funding
This research was supported by the NOAA High Performance Computing Communications Program, Office of Aquaculture, and Northeast Fisheries Science Center.
Conflict of Interest
The authors declare that the research was conducted in the absence of any commercial or financial relationships that could be construed as a potential conflict of interest.
Acknowledgments
The authors thank Erick Estela for providing the site map and vessel operations, Paul Clark, Lena Donnarumma, Peter Hudson, Gillian Phillips, and Dylan Redman for technical support, David Carey and Kristin DeRosia-Banick (CT Dept Agriculture, Bureau of Aquaculture), and shellfish growers Robert Granfield, Gary Salce, and Chuck Viens. The authors also thank Mark Stoeckle (Rockefeller University) and Deb Pacileo (CT DEEP) for scientific support, and Sara Goodwin, Stephanie Muller, and Elena Ghiban (Cold Spring Harbor Lab Genome Center) for technical support of next generation sequencing.
Supplementary Material
The Supplementary Material for this article can be found online at: https://www.frontiersin.org/articles/10.3389/fmars.2019.00674/full#supplementary-material
References
Able, K. W., and Fahay, M. P. (2010). Ecology of Estuarine Fishes: Temperate Waters of the Western North Atlantic. Baltimore, MD: The John Hopkins University Press.
Baker, C. S., Steel, D., Nieukirk, S., and Klinck, H. (2018). Environmental DNA (eDNA) From the wake of the whales: droplet digital PCR for detection and species identification. Front. Mar. Sci. 5:133. doi: 10.3389/fmars.2018.00133
Barnes, M. A., and Turner, C. R. (2016). The ecology of environmental DNA and implications for conservation genetics. Conserv. Genet. 17, 1–17. doi: 10.1007/s10592-015-0775-4
Callahan, B. J., McMurdie, P. J., Rosen, M. J., Han, A. W., Johnson, A. J. A., and Holmes, S. P. (2016). DADA2: High-resolution sample inference from Illumina amplicon data. Nat. Methods 13, 581–583. doi: 10.1038/nmeth.3869
Costa-Pierce, B. A. (2016). “Ocean foods ecosystems for planetary survival in the anthropocene,” in World Nutrition Forum, ed. E. M. Binder (Austria: Driving the Protein Economy), 301–324.
Deagle, B. E., Jarman, S. N., Coissac, E., Pompanon, F., and Taberlet, P. (2014). DNA metabarcoding and the cytochrome c oxidase subunit I marker: not a perfect match. Biol. Lett. 10:4. doi: 10.1098/rsbl.2014.0562
Djurhuus, A., Port, J., Closek, C. J., Yamahara, K. M., Romero-Maraccini, O., Walz, K. R., et al. (2017). Evaluation of filtration and DNA extraction methods for environmental DNA biodiversity assessments across multiple trophic levels. Front. Mar. Sci. 4:314. doi: 10.3389/fmars.2017.00314
Hinlo, R., Gleeson, D., Lintermans, M., and Furlan, E. (2017). Methods to maximise recovery of environmental DNA from water samples. PLoS One 12:e0179251. doi: 10.1371/journal.pone.0179251
Kelly, R., Port, J., Yamahara, K., and Crowder, L. (2014). Using environmental DNA to census marine fishes in a large mesocosm. PLoS One 9:e86175. doi: 10.1371/journal.pone.0086175
Kelly, R. P., Closek, C. J., O’Donnell, J. L., Kralj, J. E., Shelton, A. O., and Samhouri, J. F. (2017). Genetic and manual survey methods yield different and complementary views of an ecosystem. Front. Mar. Sci. 3:283. doi: 10.3389/fmars.2016.00283
Kemp, P. F., Cole, J. J., Sherr, B. F., and Sherr, E. B. (1993). Handbook of Methods in Aquatic Microbial Ecology. Boca Raton, FL: CRC Press.
Lacoursière-Roussel, A., Howland, K., Normandeau, E., Grey, E. K., Archambault, P., Deiner, K., et al. (2018). eDNA metabarcoding as a new surveillance approach for coastal Arctic biodiversity. Ecol. Evol. 8, 7763–7777. doi: 10.1002/ece3.4213
Lacoursière-Roussel, A., Rosabal, M., and Bernatchez, L. (2016). Estimating fish abundance and biomass from eDNA concentrations: variability among capture methods and environmental conditions. Mol. Ecol. Resour. 16, 1401–1414. doi: 10.1111/1755-0998.12522
Lahoz-Monfort, J. J., Guillera-Arroita, G., and Tingley, R. (2016). Statistical approaches to account for false-positive errors in environmental DNA samples. Mol. Ecol. Resour. 16, 673–685. doi: 10.1111/1755-0998.12486
McBride, R. S., and McKown, K. A. (2000). Consequences of dispersal of subtropically spawned crevalle jacks, Caranx hippos, to temperate estuaries. Fish. Bull. 98, 528–538.
McCune, B., and Grace, J. B. (2002). Analysis of Ecological Communities. Gleneden Beach: MjM Software Design.
Mercaldo-Allen, R., Goldberg, R., Clark, P. E., and Kuropat, C. A. (2011). Observations of juvenile American Lobsters, Homarus americanus, on a rock-reef in Long Island Sound. Northeastern Nat. 18, 45–60. doi: 10.1016/j.ecoenv.2018.06.075
Nevers, M. B., Byappanahalli, M. N., Morris, C. C., Shively, D., Przybyla-Kelly, K., Spoljaric, A. M., et al. (2018). Environmental DNA (eDNA): A tool for quantifying the abundant but elusive round goby (Neogobius melanostomus). PLoS One 13:e0191720. doi: 10.1371/journal.pone.0191720
Nizinski, M. S., Collette, B. B., and Washington, B. B. (1990). Separation of two species of sand lances, Ammodytes americanus and dubius, A., in the western North Atlantic. Fish. Bull. 88, 241–255. doi: 10.3897/zookeys.617.8866
Orr, J. W., Wildes, S., Kai, Y., Raring, N., Nakabo, T., Katugin, O., et al. (2015). Systematics of North Pacific sand lances of the genus Ammodytes based on molecular and morphological evidence, with the description of a new species from Japan. Fish B-Noaa 113, 129–156. doi: 10.7755/fb.113.2.3
Peck, J. E. (2016). Multivariate Analysis for Ecologists: Step-by-Step, 2nd Edn. Gleneden Beach: MjM Software Design.
Rees, H. C., Maddison, B. C., Middleditch, D. J., Patmore, J. R. M., and Gough, K. C. (2014). REVIEW: The detection of aquatic animal species using environmental DNA – a review of eDNA as a survey tool in ecology. J. Appl. Ecol. 51, 1450–1459. doi: 10.1111/1365-2664.12306
Riaz, T., Shehzad, W., Viari, A., Pompanon, F., Taberlet, P., and Coissac, E. (2011). ecoPrimers: inference of new DNA barcode markers from whole genome sequence analysis. Nucleic Acids Res. 39:e145. doi: 10.1093/nar/gkr732
Richards, S., Perlmutter, A., and McAneny, D. (1963). A taxonomic study of the genus Ammodytes from the east coast of North America (Teleostei: Ammodytes). Copeia 1963, 358–377.
Richardson, D. E., Palmer, M. C., and Smith, B. E. (2014). The influence of forage fish abundance on the aggregation of Gulf of Maine Atlantic cod (Gadus morhua) and their catchability in the fishery. Can. J. Fish. Aqua. Sci. 71, 1349–1362. doi: 10.1139/cjfas-2013-0489
Sassoubre, L. M., Yamahara, K. M., Gardner, L. D., Block, B. A., and Boehm, A. B. (2016). Quantification of environmental DNA (eDNA) shedding and decay rates for three marine fish. Environ. Sci. Technol. 50, 10456–10464. doi: 10.1021/acs.est.6b03114
Shelton, A. O., O’Donnell, J. L., Samhouri, J. F., Lowell, N., Williams, G. D., and Kelly, R. P. (2016). A framework for inferring biological communities from environmental DNA. Ecol. Appl. 26, 1645–1659. doi: 10.1890/15-1733.1
Sogin, M. L., Morrison, H. G., Huber, J. A., Welch, D. M., Huse, S. M., Neal, P. R., et al. (2006). Microbial diversity in the deep sea and the underexplored “rare biosphere”. Proc. Natl. Acad. Sci. U.S.A. 103, 12115–12120. doi: 10.1073/pnas.0605127103
Stat, M., Huggett, M. J., Bernasconi, R., DiBattista, J. D., Berry, T. E., Newman, S. J., et al. (2017). Ecosystem biomonitoring with eDNA: metabarcoding across the tree of life in a tropical marine environment. Sci. Rep. 7:12240. doi: 10.1038/s41598-017-12501-5
Stoeckle, B. C., Beggel, S., Cerwenka, A. F., Motivans, E., Kuehn, R., and Geist, J. (2017). A systematic approach to evaluate the influence of environmental conditions on eDNA detection success in aquatic ecosystems. PLoS One 12:e0189119. doi: 10.1371/journal.pone.0189119
Stoeckle, M., Soboleva, L., and Charlop-Powers, Z. (2017). Aquatic environmental DNA detects seasonal fish abundance and habitat preference in an urban estuary. PLoS One 12:e0175186. doi: 10.1371/journal.pone.0175186
Stoeckle, M. Y., Das Mishu, M., and Charlop-Powers, Z. (2018). GoFish: A versatile nested PCR strategy for environmental DNA assays for marine vertebrates. PLoS One 13:e0198717. doi: 10.1371/journal.pone.0198717
Strickland, J. G., and Roberts, J. (2018). Utility of eDNA and occupancy models for monitoring an endangered fish across diverse riverine habitats. Hydrobiologia 826, 129–144. doi: 10.1007/s10750-018-3723-8
Taberlet, P. (2018). Environmental DNA : for Biodiversity Research and Monitoring. Oxford: Oxford University Press.
Tallman, J. C., and Forrester, G. E. (2007). Oyster grow-out cages function as artificial reefs for temperate fishes. Trans. Am. Fish. Soc. 136, 790–799. doi: 10.1577/t06-119.1
Thomsen, P. F., Kielgast, J., Iversen, L. L., Møller, P. R., Rasmussen, M., and Willerslev, E. (2012). Detection of a diverse marine fish fauna using environmental DNA from seawater samples. PLoS One 7:e41732. doi: 10.1371/journal.pone.0041732
Tsuji, S., Takahara, T., Doi, H., Shibata, N., and Yamanaka, H. (2019). The detection of aquatic macroorganisms using environmental DNA analysis—A review of methods for collection, extraction, and detection. Environ. DNA 1, 99–108. doi: 10.1002/edn3.21
Turner, C. R., Barnes, M. A., Xu, C. C. Y., Jones, S. E., Jerde, C. L., and Lodge, D. M. (2014). Particle size distribution and optimal capture of aqueous macrobial eDNA Methods. Ecol. Evol. 5, 676–684. doi: 10.1111/2041-210x.12206
Ushio, M., Murata, K., Sado, T., Nishiumi, I., Takeshita, M., Iwasaki, W., et al. (2018). Demonstration of the potential of environmental DNA as a tool for the detection of avian species. Sci. Rep. 8:4493. doi: 10.1038/s41598-018-22817-5
Keywords: aquaculture gear, diversity survey, DNA metabarcoding, environmental DNA (eDNA), filter type, habitat assessment, marine fisheries, rare species
Citation: Liu Y, Wikfors GH, Rose JM, McBride RS, Milke LM and Mercaldo-Allen R (2019) Application of Environmental DNA Metabarcoding to Spatiotemporal Finfish Community Assessment in a Temperate Embayment. Front. Mar. Sci. 6:674. doi: 10.3389/fmars.2019.00674
Received: 28 August 2019; Accepted: 17 October 2019;
Published: 01 November 2019.
Edited by:
Haiwei Luo, The Chinese University of Hong Kong, ChinaReviewed by:
Emre Keskin, Ankara University, TurkeyDaniel Garcia-Souto, University of Vigo, Spain
Mark Stoeckle, The Rockefeller University, United States
Copyright © 2019 Liu, Wikfors, Rose, McBride, Milke and Mercaldo-Allen. This is an open-access article distributed under the terms of the Creative Commons Attribution License (CC BY). The use, distribution or reproduction in other forums is permitted, provided the original author(s) and the copyright owner(s) are credited and that the original publication in this journal is cited, in accordance with accepted academic practice. No use, distribution or reproduction is permitted which does not comply with these terms.
*Correspondence: Yuan Liu, WXVhbi5MaXVAbm9hYS5nb3Y=