 Maria Fernanda Adame1*
 Melanie E. Roberts1
 David P. Hamilton1
 Christopher E. Ndehedehe1Vanessa Reis1Jing Lu1Matthew Griffiths2
 Graeme Curwen1Mike Ronan2
- 1Australian Rivers Institute, Griffith University, Nathan, QLD, Australia
- 2Department of Environment and Science, Wetlands Team, Queensland Government, Brisbane, QLD, Australia
Wetlands can increase resilience to extreme climatic events and have a key role in protection and water quality improvement in coastal ecosystems. Studies in tropical coastal wetlands at a catchment scale are scarce, and most work has been undertaken on small, temperate wetlands. In this study, we tested whether natural coastal wetlands in a tropical catchment (Tully-Murray, Queensland, Australia) could ameliorate nitrogen (N) exported to the Great Barrier Reef during a flood event. We measured denitrification rates in different types of coastal wetlands (mangroves, saltmarshes, waterbodies with macrophytes, and floodplain wetlands dominated by Melaleuca spp.) to assess their potential contribution to N losses during the 6-day duration of a flood in March 2018. Denitrification potential was variable across the landscape, and we identified “hotspots” in sub-catchments with high -N concentrations (0.4–0.6 mg L−1) and large areas of wetlands (>800 ha, >40% of the sub-catchment). These hotspots can denitrify up to 10 t of -N per day during a flood. We used our measured denitrification rates to provide input parameters for a model that includes the main biogeochemical processes affecting N transformations within wetlands (nitrification, denitrification, plant uptake, sedimentation, anammox, and mineralization), and accounts for transport via the duration, depth, and flow of water. Model simulations of a sub-catchment of the Tully-Murray indicate that flood inundation of large areas of natural wetlands (>40% of the sub-catchment area) could potentially remove 70% of the incoming -N load in the first 24 h of the flood. The management and restoration of coastal tropical wetlands could play a critical role in sustaining the health of coastal ecosystems through water quality improvement.
Introduction
Coastal wetlands are one of the most valuable ecosystems on Earth, considered essential for climate change adaptation and mitigation (Duarte et al., 2013). They provide key ecosystem services, including food provisioning, carbon sequestration, flood protection, and improvements in water quality (Barbier et al., 2011). Coastal wetlands are effective at improving water quality through three processes that remove nitrogen (N): plant uptake, soil accretion, and denitrification, with the latter accounting for most of the removal (>90%, Adame et al., 2019b,c, Figure 1). Denitrification is the conversion of nitrate () to nitrous oxide (N2O) and finally to nitrogen gas (N2) and is the major pathway for permanent N removal from an ecosystem (Kulkarni et al., 2008). More recently, anaerobic ammonium oxidation (anammox) has been highlighted as an additional pathway for N removal through the conversion of nitrite (NO2) and ammonium () to N2. Anammox is usually restricted to estuarine wetlands with low oxygen concentrations and accounts for 3–10% of N removal (Burgin and Hamilton, 2007; Zhou et al., 2014). Overall, denitrification is likely to be the most important pathway for N removal in coastal wetlands (Oliveira-Fernandes et al., 2012; Xiao et al., 2018), and thus a key process for the improvement of water quality by wetlands.
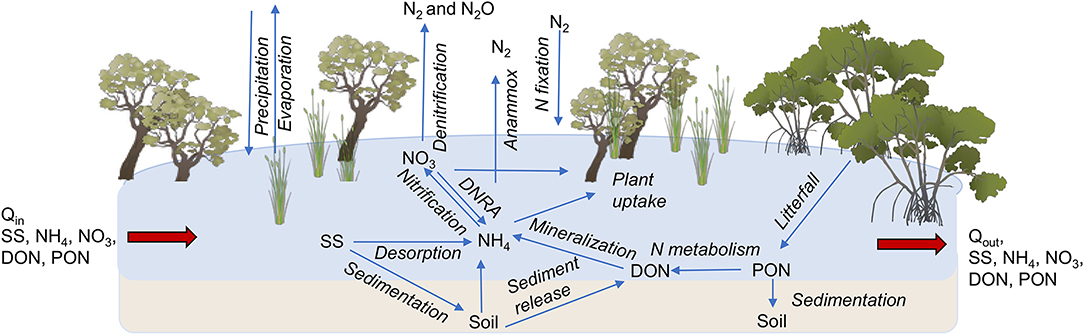
Figure 1. Conceptual model of N fluxes during a flood in estuarine and palustrine wetlands in tropical Australia, which was used for the derivation of the numerical model.
The potential to remove N through denitrification is closely associated with soil carbon and water concentration in many temperate (Piña-Ochoa and Álvarez-Cobelas, 2006; Zhou et al., 2014) and tropical wetlands (Adame et al., 2019b). Wetlands have carbon-rich soils due to high primary productivity (Mitsch and Gosselink, 2015), but concentrations can vary widely. The amount of a wetland receives is usually dependent on anthropogenic inputs (e.g., sewage, fertilizer) from the catchment (Wells et al., 2016). Additionally, wetlands obtain in-situ from nitrification, the conversion of to , which, in some tropical wetlands, accounts for 30% of the that is denitrified (Adame et al., 2019b).
Wetlands can only improve water quality if they are hydrologically connected, i.e., if they are in contact with water long enough for denitrification to occur. Thus, hydrological connectivity is critical for the provision of ecosystem services through improvement of water quality. Many tropical regions have high hydrological variability, with frequent storms and intense rainfall events that connect large areas through flooding. The inundation of tropical catchments causes the delivery of large quantities of water and nutrients into the coastal zone (Junk et al., 1989; Junk and Furch, 1993; Wallace et al., 2008). In many tropical catchments, particularly during the dry season, fertilizers can accumulate as N in the soil; after a rainfall event, the highly mobile is flushed into coastal wetlands (Davis et al., 2016). The inundation of coastal wetlands by floodwaters can create biogeochemical “hot spots,” which may contribute disproportionately to nutrient transformations, altering annual carbon, and N fluxes in the coastal zone (McClain et al., 2003). Denitrification fluxes occurring during floods are not easily accounted for but could be highly important.
In the Great Barrier Reef region, in the Wet Tropics of Australia, increased N loading from the catchment to the coastal zone due to intensification of agricultural activity has been highlighted as a significant stressor to the health of the reef (Hughes et al., 2015). Intense rainfall events are increasing in this region and are predicted to continue to increase as a result of climate change (ABM, 2019: 1970–2017, http://www.bom.gov.au/, Eccles et al., 2019). After intense rainfall, large areas of coastal wetlands are inundated, creating denitrification hotspots (Tomasek et al., 2019). Thus, coastal wetlands in tropical catchments could play a significant role in ameliorating the export of N into the coastal zone during flooding events.
In this study, we hypothesized that coastal wetlands could strongly influence N exports to the coastal zone. We tested the hypothesis in a catchment in north-east Australia that has intensive agricultural land use but also has large areas of coastal wetlands (Figures 2A,C). Rates of denitrification were measured in different types of coastal wetlands (mangroves, saltmarshes, waterbodies with macrophytes, and floodplain wetlands dominated by Melaleuca spp.) to assess their potential contribution to N losses during the 6-day duration of a flood in March 2018. We used the measured denitrification rates in a model to assess N losses during the flood. The model includes the main biogeochemical processes affecting N transformations within wetlands (nitrification, denitrification, anammox, plant uptake, sedimentation, and mineralisation) and accounts for transport via the duration, depth, and flow of water. We also tested for the presence of denitrification “hotspots” where large areas of wetland are flooded by water with relatively high concentrations.
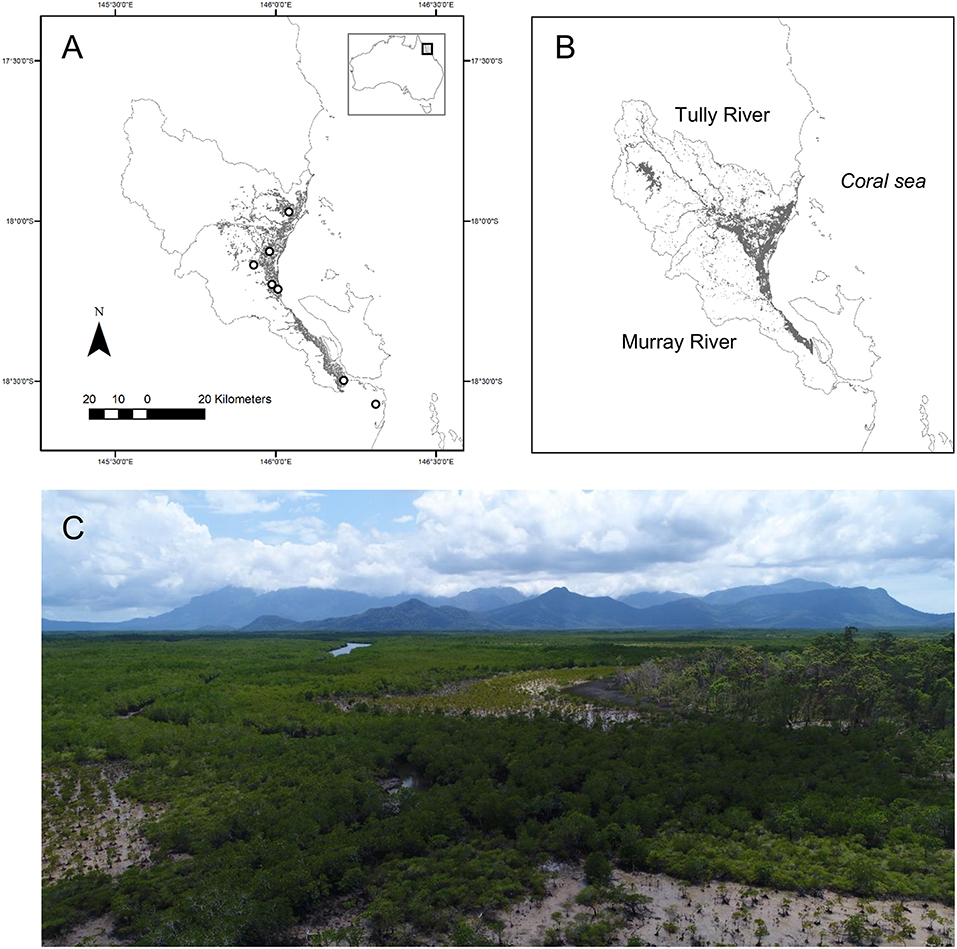
Figure 2. (A) Wetland area within the catchments of the Tully-Murray River in tropical north-east Australia, and sampling locations from south to north: saltmarsh and mangroves at Hinchinbrook Channel, Melaleuca quinquenervia forest and freshwater marsh at Girramay National Park, lagoon with macrophytes (Nymphae spp. and grass at Barrett's Lagoon), Melaleuca viridiflora forest at Hull Heads National Park, and Melaleuca-Eucalyptus spp forest at Djiru National Park, (B) flood extent after intense rainfall (863 mm in 11 days) in March 30, 2018, and (C) composition of coastal wetlands with a mixture of Melaleuca forest, marshes and mangroves. Photo by MF Adame.
Materials and Methods
Study Site
The Tully-Murray Rivers are located within the Wet Tropics region of north-east Australia. They drain a catchment of 279,200 ha and discharge into the Coral Sea and into the Great Barrier Reef (Figure 2). The climate is tropical with monthly mean temperatures ranging from 22 to 34°C (ABM, 2019: 1907–2018) and a mean annual rainfall of 2,700 mm (ABM, 2019: 1871–2018). The rivers in this region are characterized by dry periods during winter months and sporadic overbank floods in summer (between January and May) that inundate the adjacent wetlands from one to 12 days at a time (Karim et al., 2012). Contributions to flow from groundwater are also important, mainly after rainfall events, but also during the dry season (Rasiah et al., 2003). Tides in the region are classified as mesotidal with maximum amplitudes of 4 m (Lucinda Station, ABM, 2019).
The catchments of the Tully-Murray Rivers are characterized by alluvial fans in the lower slopes and an alluvial plain with swamps in wet areas close to the coast (Wilson and Baker, 1990). The soil types are typically Rudosol, Kandosol, and Sodosol on the alluvial fans, Dermosol, Kurosol, Vertosol, and Sodosol on the alluvial plain, Tenosol on the beach ridges, and Organosol in swamp areas (Isbell, 2002). The catchments have a total area of wetlands of 24,500 ha, defined according to the Ramsar convention as: “Areas of permanent or periodic/intermittent inundation with water that is static or flowing, fresh, brackish or salt.” To be considered wetlands, they should support plants or animals adapted and dependent on wet conditions for at least part of their life cycle and have anaerobic, undrained soils that are saturated, flooded or ponded (WetlandInfo, 2019, https://wetlandinfo.des.qld.gov.au). Of the total wetland area of the catchments, 10,910 ha are estuarine, 9,390 ha are palustrine, and 200 ha are non-riverine waterbodies. Estuarine wetlands are influenced by tidal inundation and include mangroves, salt flats, and saltmarshes. Palustrine wetlands are vegetated swamps that are non-riverine or non-channel systems with more than 30% cover of emergent vegetation of grass, sedges, herbs, palms, or trees (Melaleuca and Eucalyptus spp., WetlandInfo, 2019).
The catchments of the Tully-Murray Rivers are characterized by steep mountains covered with tropical rainforests and a floodplain dominated by intensive cultivation of sugarcane and banana, as well as cattle grazing and pine plantations. As a result of intensive agricultural land use, mean annual N loads from rivers draining the catchments have increased significantly since European settlement. Dissolved inorganic N (DIN = -N + NO2-N + -N) has increased by a factor of five (from 170 to 840 t yr−1) and particulate N by a factor of 27, from 14 to 380 t yr−1 in the Tully River and from 4 to 250 t yr−1 in the Murray River (Kroon et al., 2012). Current annual total nitrogen (TN) exports from the catchments are estimated at 2,320 t yr−1, of which 1,310 t yr−1 are DIN (Kroon et al., 2012).
We measured denitrification rates at eight sites representative of coastal wetlands of these catchments. Previous studies have shown no significant differences in denitrification potential between the dry and wet seasons (Adame et al., 2019b). Thus, all measurements were conducted once at each site at the end of the wet season (May to June) in either 2017 or 2018. We measured two Melaleuca spp. palustrine wetlands (Girramay and Hull Heads National park), an ephemeral Melaleuca–Eucalyptus spp. palustrine wetland (Djiru National Park), two marshes (saltmarsh in the southern of Hinchinbrook Channel and a freshwater marsh), dominated by Eleocharis spp. in Girramay National Park), a mangrove forest dominated by Brugueira guimnorriza, and a coastal lagoon (Barrett's lagoon) with water lilies (Nymphaea spp.) and emergent grasses (Figure 2A). Denitrification rates for the two Melaleuca sites have previously been published in Adame et al. (2019b). The denitrification rates were used in conjunction with a map and hydrological characteristics of a flood that occurred on March 2018 to identify hotspots of denitrification. Finally, a numerical model was developed to estimate fluxes of different forms of N (-N, -N), dissolved organic nitrogen (DON), and particulate organic nitrogen (PON) within a sub-catchment that was identified as a “denitrification hotspot.” Detailed information on the methodology is given below.
Wetland Characteristics
At each site, we measured physicochemical characteristics of water and soil, including water temperature, electrical conductivity (EC), and pH with a calibrated water quality meter (ProPlus, YSI meter, OH, USA). Soil samples were analyzed for bulk density (BD) by weighing a dry sample of soil of known volume. Soils were also analyzed for N (%) and organic carbon (OC%) (EA-IRMS, Serco System at Griffith University). Water samples were collected in triplicate, filtered through a 0.45 μm membrane filter, and stored frozen before being analyzed for nutrients within the next week (colorimetric analyses; Chemistry Center, Department of Industry, Innovation and Science, Brisbane, Australia). Detection limits (mg L−1) were: 0.002 for -N, and 0.001 for -N and -P.
Denitrification Rates
To measure denitrification rates, we used the isotope pairing technique (Nielsen, 1992; Steingruber et al., 2001), which consists of adding enriched -15N to water overlying sediments at a saturating concentration and estimating denitrification rates from 15N-N2 gas production. At each site, we collected intact sediment cores of ~8 cm-depth inside Perspex tubes (4.8 cm internal diameter × 30 cm long) that were capped at the bottom with a rubber bung, filled with water collected from each site, and left to equilibrate overnight. The cores were sampled within each wetland in a location that had soil and vegetation representative of the site. The cores were taken 50 cm apart from each other and included small roots and leaf litter. For each experiment, we collected 12 sediment cores to allow three cores to be sampled at time 0, 2, and 5 h. For each experiment, we ran a blank sample of distilled water.
Nutrients were measured in three cores per treatment after flooding them with water and left overnight to equilibrate. The day after collection, the experiments were run at a nearby town (Ingham, Queensland) with similar ambient light and air temperature as in the field. The sediment cores were set in large plastic rectangular containers (1030 × 510 × 495 mm) filled with water maintained at a relatively constant temperature, which was recorded throughout the experiment (ProPlus, YSI meter, OH, USA; 29–31°C). At the beginning of the experiment, -15N was added to each core, and water samples were taken to measure -N concentrations before and after 15N- additions. The experiments were run with final concentrations between 0.02 and 0.56 mg L−1, all within the range of natural background conditions (Water Monitoring Information Portal, Queensland Government, https://water-monitoring.information.qld.gov.au/). Cores were topped up with water and capped to minimize headspace. Natural water movement was simulated by a stirrer bar suspended ~3 cm above the sediment of each core driven by a magnet (rotating at ~60–70 rpm Adame et al., 2019a. After ~20 min, one core from each batch was sacrificed as a time zero measurement by adding 1 ml of 50% w/v of zinc chloride (ZnCl2) that was mixed throughout the sediment and overlying water to halt bacterial activity. Triplicate 10 mL-water samples from each core were collected using a syringe and placed in a 12.5-ml Exetainer vial (Labco, High Wycombe, UK) with 250 μL of 50% w/v ZnCl2. At each time interval, a new set of cores was sacrificed. The headspace gas was analyzed by continuous-flow mass spectrometry for 28N2, 29N2, and 30N2-gas (EA-IRMS, Serco System at Griffith University).
Denitrification rates were estimated from equations of Steingruber et al. (2001), from which we calculated the following:
D15: denitrification from labeled15 as from the production rate of 29N2 and 30N2:
where r29 and r30 are the production rates of 29N2 and 30N2, respectively,
D14: denitrification from unlabeled 14 :
Dt = total denitrification or potential denitrification:
Dwtot: total denitrification of derived from the water column:
where ε is enrichment during incubation from 15NO3 additions:
where a and b are NO3 concentrations after and before 15 addition,
Dw: denitrification from derived from the water column and corrected for tracer addition:
Dn: Coupled nitrification-denitrification:
Denitrification rates are reported for ambient light conditions, and detection limits were 0.01 mg N m−2 h−1.
Inundation Mapping
Between 18 and 29 March 2018, a major rainfall event occurred in the area (863 mm in 11 days; Tully Sugar Mill Station 32042, ABM, 2019) causing daily discharges in the Tully River to peak at 86,000 ML day−1 (Figure 2B, Supplementary Figure 1). During this event, the floodplain started to inundate, which usually occurs at river flows >37,000 ML day−1 (Wallace et al., 2009). This level of flooding is representative of an event with a return period of about 4 years (Wallace et al., 2009). River discharges into the coastal flooding zone are between 700,000 and 1,500,000 ML throughout an event of this magnitude (Wallace et al., 2009).
Three tiles of level 1C Sentinel-2 data were acquired for 30 March 2018 and combined to generate a mosaic for the Tully-Murray catchment. The image scenes were retrieved from the European Space Agency open access data portal (https://scihub.copernicus.eu/dhus/#/home). The data were calibrated to standard surface reflectance values using the QUick Atmospheric Correction Code (QUAC, Bernstein et al., 2005) module in ENVI 5.5 (Exelis Visual Information Solutions). The flood inundation extent was quantified from the mosaic by applying an automated water extraction metric, the Modified Normalized Difference Water Index (MNDWI, Xu, 2006), which combines the green (G) and mid-infrared (MIR) bands (B) as MNDWI = BG – BMIR/BG + BMIR.
Daily stream water level and river discharge data from the Tully River (2017–2018) observed at Euramo (ID: 113006A; −17.99 S,145.94 E) were used to assess flood characteristics. Discharge and water level were integrated based on a non-parametric approach that relies on the empirical joint probability of any two hydrological units to estimate multivariate standardized indicators (MSIs) (Farahmand and AghaKouchak, 2015; Ndehedehe et al., 2016). Daily steps (493) from four different time series (i.e., mean and maximum values each of discharge and water level) were used to estimate two sets of MSIs (i.e., mean discharge/water level and maximum discharge/water level). The MSIs are interpreted similarly to the range of variability approach in which the value of one standard deviation is used to set the thresholds in the characterization of hydrological conditions (e.g., values > 1.5 are very wet and < −1.5 are very dry).
Wetland Area and Flooded Area
We used the sub-catchment areas of the Tully-Murray Rivers obtained by the stream network and a digital elevation model (DEM) as defined by the Paddock to Reef Integrated Monitoring, Modeling, and Reporting Program (P2R, Paddock to Reef program, Queensland Government, https://www.reefplan.qld.gov.au/tracking-progress/paddock-to-reef). We selected 28 sub-catchments within 25 km of the coastal zone (Figure 4) and obtained their wetland area, including palustrine, estuarine, and water bodies (WetlandInfo, 2019). The area of wetlands within each sub-catchment that was flooded during the rainfall event was determined by subtracting total wetland area minus flooding area.
We estimated the volume of water overlying wetlands for one sub-catchment (SC187) located within the coastal floodplain of the lower Murray River (Figure 4C, the mouth of the Murray River). Wetlands represented repeated information 46% of the selected sub-catchment area (Supplementary Figure 2). A Lidar image of 1-m resolution (Queensland LiDar Data, Cassowary Coast Project 2016, www.qldspatial.information.qld.gov.au/) with a vertical accuracy of 30 cm and horizontal accuracy of 80 cm was used in conjunction with the Sentinel imagery to calculate the height threshold above the main channel of the lower Murray River. In the wetland areas that were flooded, water depth was calculated by subtracting the DEM land values from the water surface elevation. Data analyses were conducted with ArcMap (v10.3 and 10.6, Esri ArcGIS, CA, USA).
Nitrogen Fate and Transport
Daily water flows (m3 s−1), and dissolved inorganic N (DIN), dissolved organic N (DON) and particulate N (PN) loads (kg d−1) were obtained from the P2R Program for each of the sub-catchment units. The model uses the eWater CRC Source Catchments modeling framework (eWater Limited, ACT, Australia, www.ewater.org.au) to simulate sediment, nutrients and pesticide runoff within the Great Barrier Reef catchments. Simulated N outputs are obtained at the sub-catchment scale by dividing each sub-catchment into land-use types and estimating runoff from rainfall, constituent generation and a filter model (For further information, see www.reefplan.qld.gov.au/tracking-progress/paddock-to-reef). For this exercise, we obtained the daily flow of water, loads (kg d−1) and concentrations (mg L−1) of DIN, DON, and PN from 22 March to 1 April 2018.
We identified “denitrification hotspots” within sub-catchments during 1 day of flooding (March 30, 2018, see inundation map Figure 2B). The hotspots were identified by multiplying the denitrification potential for wetlands within each sub-catchment (Dt; mg m−2 h−1), by the area of wetlands that were flooded during the day. Total denitrification was predicted from the concentration of the floodwater, which is a major driver of denitrification for similar wetlands in the region (Adame et al., 2019b, this study, Figure 3) and other tropical and temperate wetlands (Piña-Ochoa and Álvarez-Cobelas, 2006). The concentrations were obtained from the Source Catchment model and corroborated by direct measurements obtained by the Water Quality Monitoring Program of the Great Barrier Reef (Euramo station at Tully River; Orr et al., 2014). The N concentrations during flooding are usually between 0.046 and 0.24 mg L−1 for PN, 0.14 and 0.26 mg L−1 for -N, 0.004 and 0.012 mg L−1 for -N and 0.08 and 0.19 mg L−1 for DON (Orr et al., 2014). Most of the DIN during floods is in the form of NOx -N (>95%, Orr et al., 2014).
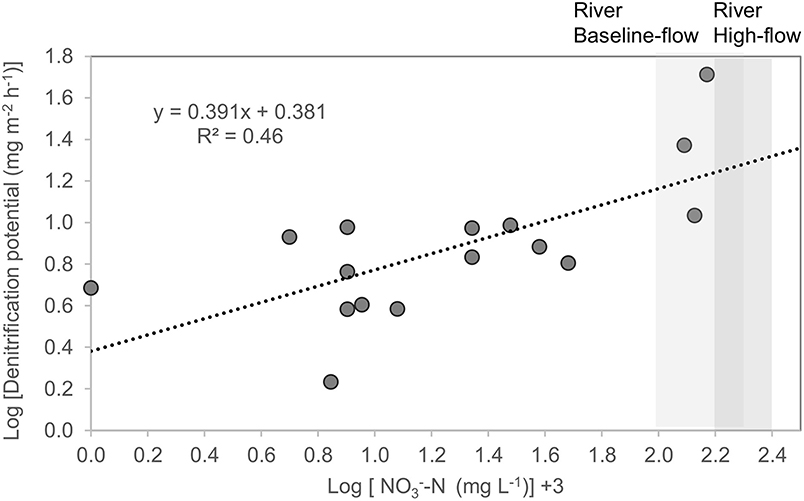
Figure 3. Denitrification potential [log] (mg m−2 h−1) of coastal wetlands (mangroves, Melaleuca spp. wetlands, saltmarsh, waterbodies with macrophytes) vs. -N concentration in the floodwater [log + 3] (mg L−1). Data from Melaleuca spp. wetlands has been previously been published in Adame et al. (2019b). Ranges of -N concentrations during baseline and high flows for the Tully River are shown as shaded areas (Orr et al., 2014).
Nitrogen Transformation Modeling
The fate of different forms of N (-N, -N, DON, and PON) was modeled for water flooding the sub-catchment SC187, our identified “denitrification hotspot.” The sub-catchment Supplementary Table 1 has a total wetland area of 2,574 ha, of which 62% is estuarine wetland, 36% palustrine wetland, and the remainder (2%) riverine and lacustrine wetlands. The model describes the variation in the quantity of each form of N together with fine suspended sediment in the wetland (Equations 8–13). The wetland within this sub-catchment was simulated as a single box model considering the most important N processes in wetlands (Figure 1). During a flood, N enters the wetlands as rainfall and runoff. Internal releases to water within the wetland are from leaf litter and bottom-sediment release of DON and . Water column ammonium is converted to by nitrification, can be denitrified to N gases (N2, N2O) according to our measured rates (see above) or through anammox ( and converted to N2), removing N permanently from the system. Both and can be taken up by plants and algae, and water column PON (estimated as 98% of PN, Garzon-Garcia et al., 2018) can be deposited to the wetland sediment. The equations representing these processes for each nitrogen constituent in the model are given below, first for -N mass in the wetland as a function of time:
where NO3 is the total mass of -N in the wetland, is the concentration of -N in the inflow, Qin and Qout are the inflow to and outflow from the wetland, respectively, A and V are the wetland area and volume, respectively, R is rainfall, is the concentration of -N in rainfall, k1 is the nitrification rate, K1 is the half-saturation constant for effect the ammonium concentration on nitrification, a1, a2, and a3 are the areal rates of plant uptake of nitrogen, denitrification, and anammox respectively, and Ka2 and Ka3 are the half-saturation constants for effect of nitrate concentration on denitrification and anammox. The nitrogen conversion rates are given for a reference temperature of 20°C with the influence of temperature (T) represented by a non-dimensional multiplier term θT−20. The value of the temperature multiplier was set at 1.073 (equivalent to doubling of the biogeochemical rate for each 10°C increase in temperature) for all processes as there was not enough information to vary it among all biogeochemical processes. f(N) is a preference factor for ammonium vs. nitrate uptake: where KN is the half saturation for plant uptake
Ammonium mass in the wetland is given as:
where is the concentration of -N in the inflow, is the concentration of -N in rainfall, k2 is the ammonification rate, K2 is the half-saturation constant for effects the DON on ammonification, a4 is the areal rate of release of -N from bottom sediments, k3 is the rate of ammonium desorption from fine suspended material <16 μm in diameter (SS16), and K3 is the half saturation constant for the ammonium desorption process.
The DON mass in the wetland is given as:
where is the concentration of DON in the inflow, a5 is the areal rate of release of DON from bottom sediments, k4 is conversion of PON to DON and K4 is the half-saturation constant for the conversion of PON to DON. For PON mass, the equation is:
where is the concentration of PON in the inflow, a6 is the areal rate of release of PON from leaf litter, wsPON is the settling rate of PON, and zav is the average depth of the wetland. Finally, for SS16, the equation is:
where ws is the settling rate of sediment.
Table 1 provides a summary of the variables and parameters in the model. The mathematical model was solved with MATLAB routine ode45, with the initial conditions given by the mass of the four N constituents and SS16 in the wetland. The volume of water in the wetland was determined through a water balance equating the change in volume to the net flux in and out of the wetland each day. Hourly rainfall data and mean water temperature for the flooding event were obtained from the Tully River at Euramo (Station 113006A, Queensland Water Monitoring Information Portal), with hourly evaporation rates obtained for Innisfail Aerodrome (Bureau of Meteorology Product Code IDCKWCDEA0). Time-dependent parameters (indicated by an asterisk in Table 1) were linearly interpolated with routine interp1 within the ode45 routine. The sensitivity of the model to the selected parameters was explored with a Monte Carlo simulation with 500 replicates, varying the parameters by ± 20% of the values set in the model (Table 1). Random sampling was obtained from uniform distributions for the N conversion rates, half-saturation constants and settling rates. The proportion of TN removed by wetlands was compared among replicate results (Supplementary Figure 3).
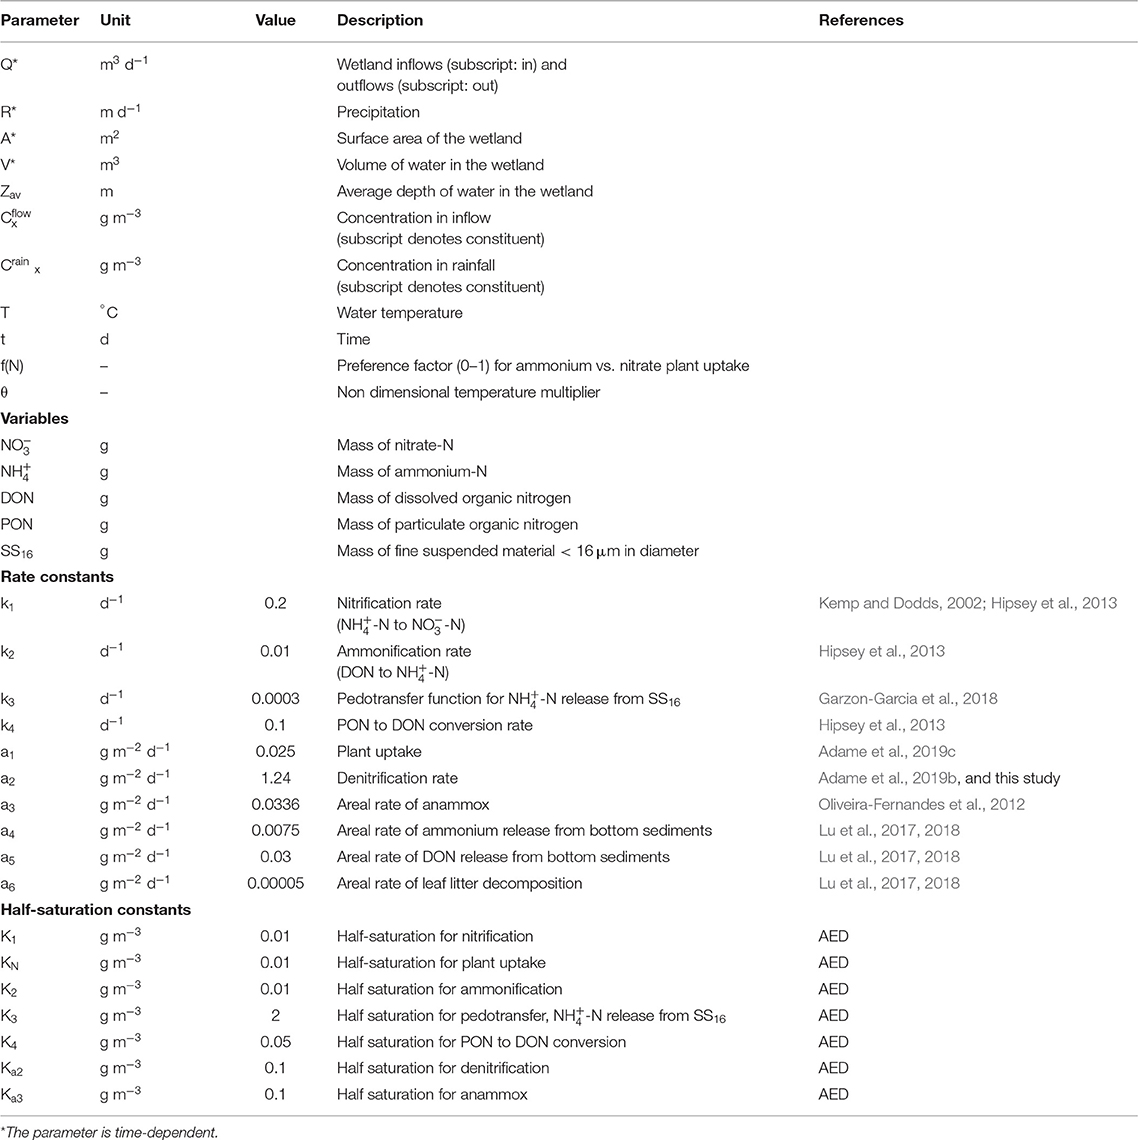
Table 1. Notation for the mathematical model of nitrogen dynamics in wetlands.
Results
Wetland Characteristics
Water flooding the wetlands had nutrient concentrations of (mean) 0.06 ± (standard error) 0.03 (range, 0.004–0.20) mg L−1 of -N and 0.13 ± 0.061 (0.02–0.53) mg L−1 of -N. Concentrations of -P were in general too low to be detected (<0.001 mg L−1). The water pH ranged from neutral to acidic (3.2–7.4) across the wetlands, with values close to neutral pH in estuarine wetlands (mangroves and saltmarsh). EC varied from freshwater to marine, with ranges between 5 and >25,000 μS cm−1. The OC in the soil across the wetlands was on average 9.7 ± 4.0 (1.1–35)%, and N was 0.48 ± 0.13 (0.1–1.5)%, with highest values in the water bodies with macrophytes and lowest in estuarine wetlands (Table 2).
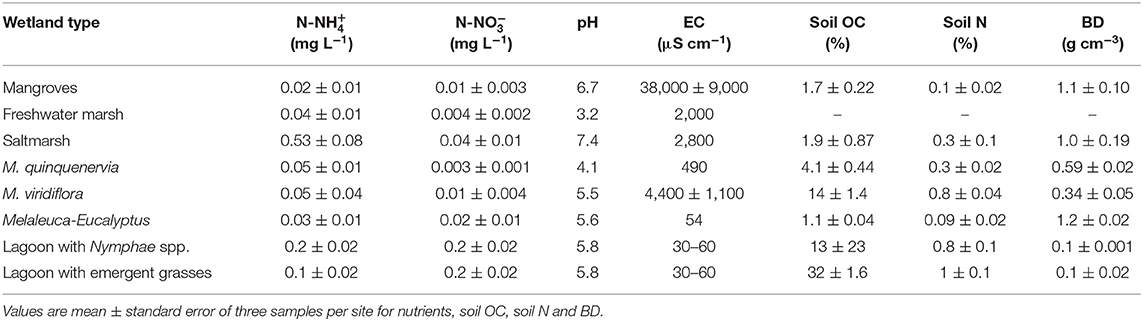
Table 2. Nutrient concentrations in water, pH, electrical conductivity (EC), soil organic carbon (OC), nitrogen (N), and bulk density (BD), from eight coastal wetlands in tropical Australia.
Denitrification Rates Among Different Wetlands
Mean Dt (total or potential denitrification) was 14 ± 5.8 mg m−2 h−1 and ranged from 3.8 to 52 mg m−2 h−1 with highest values in waterbodies with macrophytes and lowest in mangroves (Table 3, Supplementary Table 1). Mean Dwtot (denitrification corrected for N additions) was 4.5 ± 0.87 mg m−2 h−1, Dn (coupled denitrification-nitrification) was 3.0 ± 0.9 mg m−2 h−1, and Dw (denitrification of -N derived from the water column) was 9.1 ± 5.9 mg m−2 h−1, or 64% of total denitrification. Total denitrification was highest at elevated -N concentrations (Figure 3; log [Dt] = 0.391x + 0.381; R2 = 0.46, p = 0.004).
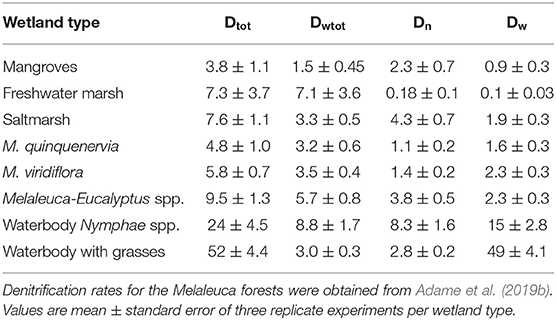
Table 3. Denitrification rates (Dt, total denitrification; Dwtot, denitrification corrected for N additions; Dn coupled denitrification-nitrification, Dw, denitrification of -N from the water column; mg m−2 h−1).
Flood Characteristics
The flooding lasted ~6 days from March 27 to April 1, 2018. In March 30, 2018, the total flooded area of the sub-catchment was 15,000 ha, of which 9,421 ha were coastal wetlands (Figures 2A,B, Supplementary Figure 1). At this time, all sub-catchments had some level of flooding from 0.2 to 45% of the total area inundated. This corresponds to the flooding of 43% of the total wetland area of the Tully-Murray catchment.
Denitrification Hotspots
The -N concentrations predicted from the Source Catchment model were highest at the sub-catchments at the mouth of the Murray River (Figure 4B). The denitrification potential calculated from -N concentrations and flooded wetland area for March 30 was highest (10 t day−1) in sub-catchments close to the mouth of the Tully and Murray-River (Figure 4C). However, some sub-catchments with low -N concentrations were also denitrification hotspots due to extensive wetland areas (southernmost coastal area, Figure 4C). There were also sub-catchments with a denitrification potential close to zero, highlighting the patchiness of denitrification at the landscape scale. We estimate that for a given day during a flood, wetlands in the Tully-Murray catchment can potentially remove 48.5 t of -N through denitrification. If considering lower rates of denitrification (5.3 mg m−2 h−1; denitrification of Melaleuca spp. and mangroves, which are the dominant vegetation types), the denitrification potential is 12.0 t d−1.
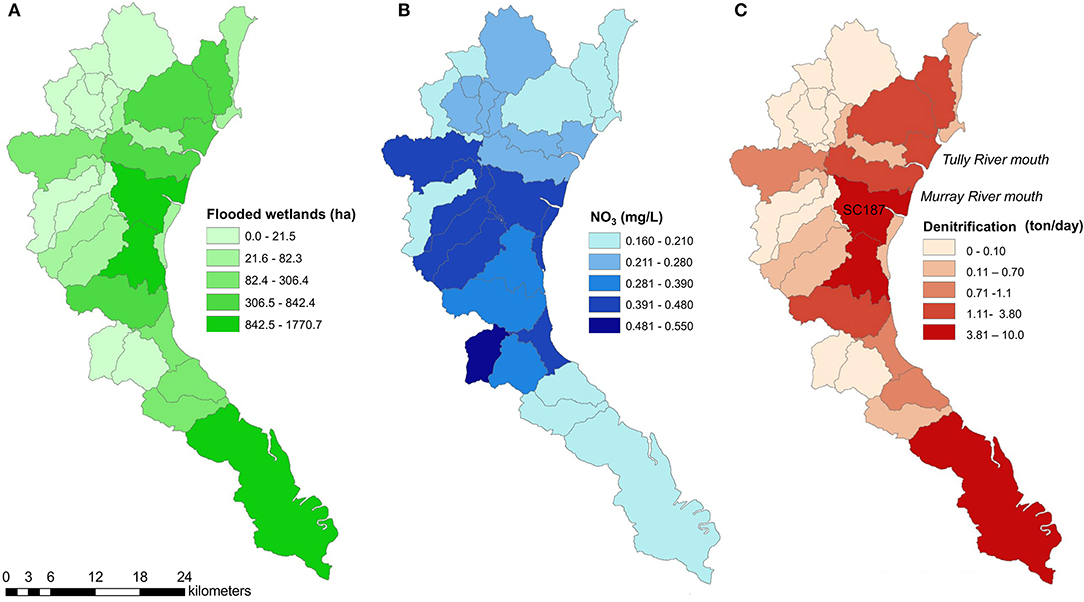
Figure 4. (A) Area of flooded wetlands (ha); (B) mean -N concentrations (mg L−1); and (C) denitrification potential (t -N d−1) for sub-catchments of the Tully-Murray Rivers in tropical Australia during a flood event (March 30, 2018).
N Flows and Transformation Model
The model was run for one sub-catchment (SC187) with an area of flooded wetlands of 2,213 ha and a peak volume of water of 51,000 ML during the flood that lasted 6 days. Total N inputs to this sub-catchment during the flood were 62.2 t DIN (-N + -N), 42.4 t DON, 24.5 t PN, and 5,183 t of suspended sediment. The model simulations showed a loss of 70.4% of the -N that entered the wetland during the flood on the day of flooding (Figure 5). By the end of the 6 days of flooding, 85.9% of the -N had been removed from the wetland through denitrification and anammox processes. For -N, despite the internal release as water flooded the wetland, the model simulations produced a reduction of 17.6% of the load 1 day after flooding; and 19.2% after 6 days of flooding. The PON load was also reduced by 34.9% by the end of the first day of flooding and 43.6% by the end of the 6 days of flooding. After 3 days of flooding DON load increased by 7%, and after 6 days, the DON load increased by 38.8%. Predictions from the model simulation indicated that the wetlands within this sub-catchment retained 29.3% of the TN load during this flooding event.
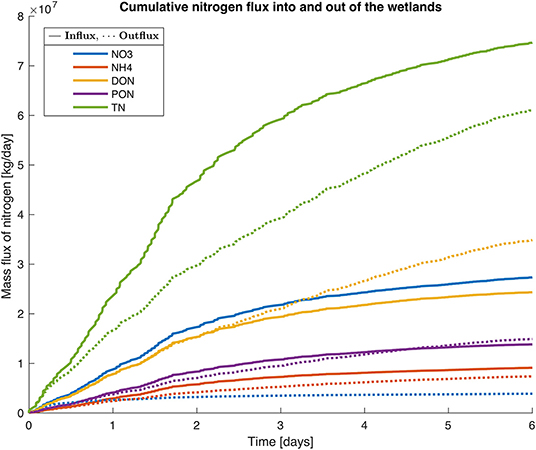
Figure 5. Simulation of N conversion (, , DON, PON, and TN) within a wetland during a flooding event for 6 days on 28 March 2018. The model was run for a sub-catchment in the mouth of the Murray River (SC 187, see Figure 4C), with an area of flooded wetlands of 2,213 ha, a peak volume of water of 51,000 ML. Total N inputs during the flooding event for the sub-catchment were 62.2 t DIN, 42.4 t DON, 24.5 t PON and 5,183 t of suspended sediment.
To assess the sensitivity of the model parameters, we ran the model varying the value for each parameter by ±20%. The change in parameter values did not have a great effect on the model output, with a range in TN retention of 26.0–32.0% (Supplementary Figure 3). Increasing internal release of DON by 20.0% resulted in a reduction of TN retention from 29.3 to 21.0%. For the range of parameter values tested through the sensitivity analysis, the model consistently showed TN retention when wetlands were flooded.
Discussion
During a flood with a recurrence time of ~4-years, coastal wetlands in the tropical catchment of the Tully-Murray River remove a large portion of the incoming -N through denitrification. The nutrient removal was variable across the landscape, but our model simulations indicated the existence of “denitrification hotspots” corresponding to sub-catchments with high -N concentrations (>0.20 mg L−1), and large areas of wetlands (>24%) that became inundated during the flood. These “hotspots” had the potential to remove up to 10 t of -N d−1 through denitrification. Hotspots were located at the mouth of rivers close to National Parks, which had large areas of protected and well-managed wetlands that effectively contributed an ecosystem service of protecting the coastal ecosystem from eutrophication through N removal. In other sub-catchments, the denitrification potential was close to zero due to very small areas of flooded wetlands. Our approach provided a comprehensive spatial and temporal distribution of “denitrification hotspots,” validating that the patchiness of denitrification extends to tropical catchments and is indeed a global scale process (Groffman et al., 2009).
The importance of coastal wetlands for removing -N can be interpreted at different spatial and temporal scales. From a spatial perspective, at the sub-catchment scale, large areas of frequently inundated wetlands can remove most of the -N during a flooding event (Figure 5). At the catchment scale, they could also contribute substantially to the removal of -N before it reaches the coast. For instance, a flooding event of similar magnitude as the one in March 2018, i.e., a 4-year return period, was associated with a load of 423 t of DIN (Wallace et al., 2009). Based on the range of denitrification rates measured in our study, we estimate that denitrification would remove between 17 and 68% of the -N that would otherwise be flushed into the coastal zone (lower and higher end of the denitrification rates measured).
From a temporal perspective, this study shows that periods of high flows and flooding will increase denitrification in regions with large areas of wetlands, creating “denitrification hot times” (McClain et al., 2003). Similar results have been shown in subtropical Australia, where mangroves reduced 71% of the -N after a rainfall event (Wadnerkar et al., 2019). Most of the removal was suggested to be due to high denitrification rates (12 mg m2 d−1); rates well within those derived from our denitrification measurements at similar -N concentrations (Figure 3). In riverine systems, -N uptake has been found to be highest after rainfall events (Wells et al., 2016) but removal rates from denitrification will also depend on the residence time and wetland area. Additionally, N loads after flooding events vary throughout the year, with highest concentrations during the first floods (Wallace et al., 2009). Thus, even though wetlands could remove large amounts of -N during major floods, proportionally, they will remove more -N per unit area during the first floods of the year, especially if they are of moderate intensity (Hansen et al., 2018).
During the dry season, much of the river flow is associated with baseflow from groundwater, and only sporadic rainfall events that generate some additional flow (Rasiah et al., 2010). Concentrations of -N in rivers are generally relatively low at the beginning of the dry season but increase as the season progresses with nutrient inputs accumulation in catchment soils (Davis et al., 2016). Thus, wetlands with groundwater flows or those receiving surface discharge via rivers might receive continuous inputs of water that is rich in -N (Karim et al., 2013). For these cases, there would be expected to be high denitrification rates throughout the year. Another major difference between the flooding season and the rest of the year is the tidal influence. During dry periods, mangroves, especially those in tidal channels, are flooded mainly by tidal water (Sadat-Noori et al., 2016), which is generally more diluted in nutrients than freshwater. Thus, removal rates could be lower during the dry compared to the wet season (Adame et al., 2010). The processes influencing nitrogen transformations are also likely to vary with rainfall; in wet periods, mangroves tend to be sinks of DIN, mostly due to microbial denitrification, but during dry periods, they can be sources of DIN associated with -N outputs (Adame et al., 2010), possibly due to dissimilatory -N reduction to -N (DNRA) which is common in coastal wetlands (Giblin et al., 2013). Overall, the value of these coastal wetlands for improvement of water quality at the catchment scale during dry periods is yet to be determined.
The model used to quantify N dynamics within a wetland provided insights into the main processes dominating N transformations during a flood. Denitrification was a key process which resulted in loss of a large portion of incoming -N loads within the first 24 h after flooding; sensitivity analysis based on the range of measured denitrification rates, revealed the same outcome. Anammox was also shown in model simulations to contribute to -N loss, but at a much lower rate (<10% of denitrification, Oliveira-Fernandes et al., 2012) than denitrification, resulting in TN removal of around 1% of the incoming load. Changes in -N and DON fluxes were even more uncertain, due to the scarcity of studies in similar wetlands and large variability in the reported rates of mineralisation and sediment releases (Fagherazzi et al., 2013). Nevertheless, it appeared that the model was not particularly sensitive to the range selected (±20% of calibrated values) for -N and DON fluxes, with TN removal by the wetlands varying only between 26 and 32% and concentrations in the outflow being continuously low. Physical and hydrological factors such as the surface area of the wetland and the volume of the flood are likely to be more critical compared to the variability of these parameters when assessing the role of wetlands for N removal.
There were some factors that were not included in the model that could be important and should be considered for future studies. For instance, in estuarine wetlands, dissimilatory -N reduction to -N (DNRA), is an important process in N removal (Giblin et al., 2013). The availability of -N and organic carbon could shift the dominance of DNRA over denitrification or vs. (Christensen et al., 2000; Hardison et al., 2015). Rates of denitrification and mineralisation in tropical wetlands could also vary greatly with oxygen availability and organic matter inputs (Chapman et al., 2019). Thus, direct field measurements of DNRA and organic N mineralisation in wetlands with different conditions will greatly improve the predictions of the fate of all forms of N during flooding. It would also be useful to differentiate N2 and N2O emissions in measurements of denitrification as the latter is a potent greenhouse gas that could affect evaluations of the role of coastal wetlands in greenhouse gas emissions (Murray et al., 2018).
Extreme flooding events are increasing in tropical and temperate regions (Eccles et al., 2019), resulting in large flushes of water and nutrients into the coastal zone, which may cause algal blooms and the development of anoxic zones (e.g., Voynova et al., 2017). At a process level, increasing flood magnitude could alleviate nutrient limitation in mangroves (Lovelock et al., 2011) and increase fish production (Burford et al., 2008). Including flooding episodes will significantly improve the accuracy of estimates of fluxes of nutrients into the coastal zone, especially as flooding risk may increase in the future (Wallace et al., 2009; Abril and Borges, 2019). For instance, global models of nutrient exports to the coastal zone are still limited to the quantification of the nutrient outputs from river networks, and have not yet considered the role of coastal wetlands in ameliorating nutrient exports (Kroeze et al., 2012; Vilmin et al., 2018).
The improved understanding of the role of coastal wetlands to ameliorate N exports into the coastal zone has major management implications. The Reef 2050 Water Quality Improvement Plan (Reef 2050 WQIP, www.reefplan.qld.gov.au/) has set targets for improving water quality in the catchments that flow into the Great Barrier Reef. The desired target for reduction for DIN is 60% by 2025. Significant investment has been made to achieve this target by encouraging the adoption of improved land management practices, such as optimizing fertilizer use and application. However, in 2014, the potential for improved management practice to meet the desired end-of-catchment reductions was modeled, and the conclusion was that even the adoption of best land management practices by all landholders would not be enough to meet the desired reductions. Thus, alternative nutrient management strategies need to be considered if current, and future targets are to be achieved (Waters et al., 2014). Restoration of existing wetlands or creation of new wetlands for the purpose of N mitigation have so far received relatively little attention as part of the Reef 2050 WQIP, partly because of uncertainty in the capacity of wetlands to achieve adequate levels of N removal. Our study provides an improved quantitative basis for wetlands to be assessed alongside other possible management actions to improve water quality of runoff entering the reef coastal zone.
Many waterways and floodplains in the Great Barrier Reef catchment have been drained and developed for agriculture and urban use. The regulation of river flows with dams and weirs has occurred to provide water storage for irrigation and levees to prevent floodwaters from entering agricultural lands (Dawson et al., 2017; Waltham et al., 2019). Restoration and rehabilitation of floodplain wetlands will require increased inundation frequency, depth and duration, and restoring peak flood events will be key to achieving this goal (Dawson et al., 2017). Management actions can include reconnecting waterways and their floodplains (Dawson et al., 2017; Waltham et al., 2019). Coastal wetlands within the catchments of the Great Barrier Reef are still abundant and are relatively well protected (Adame et al., 2019a), with opportunities to enhance their functionality with management actions. These wetlands provide a range of ecosystem services that are just now being incorporated into local management strategies (Adame et al., 2019a). Improved management and restoration of wetlands within tropical catchments can provide a complementary and cost-effective solution for improving water quality and the overall health of coastal and marine ecosystems.
Data Availability Statement
The datasets generated and analyzed for this study can be found as Supplementary Data.
Author Contributions
MA, MR, and MG designed the study. DH, MER, and JL designed, created, and solved the model. CN analyzed the flood hydrology. VR and GC did the geospatial analyses. MA did the field and laboratory experiments and wrote the manuscript with the help and input of all coauthors.
Funding
The study was funded by Griffith University and the Office of the Great Barrier Reef and Wetlands Team from the Department of Environment and Science. This work was also partially funded by the Australian Government's National Environmental Science Program, Tropical Water Quality Hub (Project 3.3.2).
Conflict of Interest
The authors declare that the research was conducted in the absence of any commercial or financial relationships that could be construed as a potential conflict of interest.
Acknowledgments
We acknowledge the Traditional Owners of the land in which the field study was conducted, especially the Girramay and Gulnay people. We thank Santo Silvestro from Barrett's lagoon for allowing us to work in his property and for sharing his knowledge on wetlands. We are also grateful to S. Rodriguez, E. Kavehei, M. Turschwell, and S. Balcombe for field support. We thank David Waters and Maria Askildsen for providing the data from the Source Catchment model.
Supplementary Material
The Supplementary Material for this article can be found online at: https://www.frontiersin.org/articles/10.3389/fmars.2019.00671/full#supplementary-material
References
Abril, G., and Borges, A. V. (2019). Ideas and perspectives: carbon leaks from flooded land: do we need to replumb the inland water active pipe? Biogeosciences 16, 769–784. doi: 10.5194/bg-16-769-2019
Adame, M. F., Arthington, A. H., Waltham, N., Hasan, S., Selles, A., and Ronan, M. (2019a). Managing threats and restoring wetlands within catchments of the Great Barrier Reef, Australia. Aquat. Conserv. Mar. Freshw. Ecosyst. 29, 829–839. doi: 10.1002/aqc.3096
Adame, M. F., Franklin, H., Waltham, N. J., Rodriguez, S., Kavehei, E., Turschwell, M. P., et al. (2019b). Nitrogen removal by tropical floodplain wetlands through denitrification. Mar. Freshw. Res. 70, 1513–1521. doi: 10.1071/MF18490
Adame, M. F., Reef, R., Wong, V. N. L., Balcombe, S. R., Turschwell, M. P., Kavehei, E., et al. (2019c). Carbon and nitrogen sequestration of Melaleuca floodplain wetlands in tropical Australia. Ecosystems. doi: 10.1007/s10021-019-00414-5. [Epub ahead of print].
Adame, M. F., Virdis, B., and Lovelock, C. E. (2010). Effect of geomorphological setting and rainfall on nutrient exchange in mangroves during tidal inundation. Mar. Freshw. Res. 61, 1197–1206. doi: 10.1071/MF10013
Australian Bureau of Meteorology (ABM) (2019). Available online at: http://www.bom.gov.au/
Barbier, E. B., Hacker, S., Kennedy, C., Kock, E., Stier, A., and Silliman, B. (2011). The value of estuarine and coastal ecosystem services. Ecol. Monogr. 81, 169–193. doi: 10.1890/10-1510.1
Bernstein, L. S., Adler-Golden, S. M., Sundberg, R. L., Levine, R. Y., Perkins, T. C., Berk, A., et al. (2005). “A new method for atmospheric correction and aerosol optical property retrieval for VIS-SWIR multi- and hyperspectral imaging sensors: QUAC (QUick atmospheric correction),” in Proceedings 2005 IEEE International Geoscience and Remote Sensing Symposium (Burlington, MA), 3549–3552.
Burford, M. A., Cook, A. J., Fellows, C. S., Balcombe, S. R., and Bunn, S. E. (2008). Sources of carbon fuelling production in an arid floodplain river. Mar. Freshw. Res. 59, 224–234. doi: 10.1071/MF07159
Burgin, A. J., and Hamilton, S. K. (2007). Have we overemphasized the role of denitrification in aquatic ecosystems? A review of nitrate removal pathways. Front. Ecol. Environ. 5, 89–96. doi: 10.1890/1540-9295(2007)5[89:HWOTRO]2.0.CO;2
Chapman, S., Hayes, M., Kelly, B., and Langley, J. (2019). Exploring the oxygen sensitivity of wetland soil carbon mineralization. Biol. Lett. 15:20180407. doi: 10.1098/rsbl.2018.0407
Christensen, P. B., Rysgaard, S., Sloth, N. P., Dalsgaard, T., and Schwærter, S. (2000). Sediment mineralization, nutrient fluxes, denitrification and dissimilatory nitrate reduction to ammonium in an estuarine fjord with sea cage trout farms. Aquat. Microb. Ecol. 21, 73–84. doi: 10.3354/ame021073
Davis, A., Pearson, R., Brodie, J., and Butler, B. (2016). Review and conceptual models of agricultural impacts and water quality in waterways of the Great Barrier Reef catchment area. Mar. Freshw. Res. 68, 1–19. doi: 10.1071/MF15301
Dawson, S. K., Kingsford, R. T., Berney, P., Catford, J. A., Keith, D. A., Stoklosa, J., et al. (2017). Contrasting influences of inundation and land use on the rate of floodplain restoration. Aquat. Conserv. Mar. Freshw. Ecosyst. 27, 663–674. doi: 10.1002/aqc.2749
Duarte, C. M., Losada, I. J., Hendriks, I. E., Mazarrasa, I., and Marba, N. (2013). The role of coastal plant communities for climate change mitigation and adaptation. Nat. Clim. Chang. 3, 961–968. doi: 10.1038/nclimate1970
Eccles, R., Zhang, H., and Hamilton, D. (2019). A review of the effects of climate change on riverine flooding in subtropical and tropical regions. J. Water Clim. Chang. doi: 10.2166/wcc.2019.175. [Epub ahead of print].
Fagherazzi, S., Wiberg, P. L., Temmerman, S., Struyf, E., Zhao, Y., and Raymond, P. A. (2013). Fluxes of water, sediments, and biogeochemical compounds in salt marshes. Ecol Proc. 2:3. doi: 10.1186/2192-1709-2-3
Farahmand, A., and AghaKouchak, A. (2015). A generalized framework for deriving nonparametric standardized drought indicators. Adv. Water Resour. 76, 140–145. doi: 10.1016/j.advwatres.2014.11.012
Garzon-Garcia, A., Burton, J., Franklin, H. M., Moody, P. W., Hayr, R. W., and De Burford, M. A. (2018). Indicators of phytoplankton response to particulate nutrient bioavailability in fresh and marine waters of the Great Barrier Reef. Sci. Total Environ. 636, 1416–1427. doi: 10.1016/j.scitotenv.2018.04.334
Giblin, A. E., Tobias, C. R., Song, B., Weston, N., Banta, G. T., and Rivera-Monroy, V. H. (2013). The importance of dissimilatory nitrate reduction to ammonium (DNRA) in the nitrogen cycle of coastal ecosystems. Oceanography 26, 124–131. doi: 10.5670/oceanog.2013.54
Groffman, P. M., Butterbach-Bahl, K., Fulweiler, R. W., Gold, A. J., Morse, J. L., Stander, E. K., et al. (2009). Challenges to incorporating spatially and temporally explicit phenomena (hotspots and hot moments) in denitrification models. Biogeochemistry 93, 49–77. doi: 10.1007/s10533-008-9277-5
Hansen, A. T., Dolph, C. L., Foufoula-Georgiou, E., and Finlay, J. C. (2018). Contribution of wetlands to nitrate removal at the watershed scale. Nat. Geosci. 11, 127–132. doi: 10.1038/s41561-017-0056-6
Hardison, A. K., Algar, C. K., Giblin, A. E., and Rich, J. J. (2015). Influence of organic carbon and nitrate loading on partitioning between dissimilatory nitrate reduction to ammonium (DNRA) and N2 production. Geochim. Cosmochim. Acta 164, 146–160. doi: 10.1016/j.gca.2015.04.049
Hipsey, M. F., Bruce, L. C., and Hamilton, D. P. (2013). Aquatic Ecodynamics (AED) Model Library. Science manual. Perth, WA: University of Western Australia.
Hughes, T. P., Day, J. C., and Brodie, J. (2015). Securing the future of the Great Barrier Reef. Nat. Clim. Chang. 5, 4–6. doi: 10.1038/nclimate2604
Junk, W. F., Bayley, P. B., and Sparks, R. E. (1989). “The flood pulse concept in river-floodplain systems,” in Proceedings of the International Large River Symposium, ed. D. P. Dodge (Honey Harbour, ON: Canadian Journal of Fisheries and Aquatic Sciences), 110–127.
Junk, W. J., and Furch, K. (1993). A general review of tropical South American floodplains. Wetl. Ecol. Manag. 2, 231–238. doi: 10.1007/BF00188157
Karim, F., Kinsey-henderson, A., Wallace, J., Arthington, A. H., and Pearson, R. G. (2012). Modelling wetland connectivity during overbank flooding in a tropical floodplain in north Queensland, Australia. Hydrol. Proces. 2723, 2710–2723. doi: 10.1002/hyp.8364
Karim, F., Kinsey-henderson, A., Wallace, J., Godfrey, P., Arthington, A. H., and Pearson, R. G. (2013). Modelling hydrological connectivity of tropical floodplain wetlands via a combined natural and artificial stream network. Hydrol. Proces. 28, 5696–5710. doi: 10.1002/hyp.10065
Kemp, M., and Dodds, W. (2002). The influence of ammonium, nitrate, and dissolved oxygen concentrations on uptake, nitrification, and denitrification rates associated with prairie stream substrata Limnol. Oceanogr. 47, 1380–1393. doi: 10.4319/lo.2002.47.5.1380
Kroeze, C., Bowman, L., and Seitzinger, S. (2012). Modeling global nutrient export from watersheds. Curr. Opin. Env. Sust. 4, 195–202. doi: 10.1016/j.cosust.2012.01.009
Kroon, F. J., Kuhnert, P. M., Henderson, B. L., Wilkinson, S. N., Kinsey-henderson, A., Abbott, B., et al. (2012). River loads of suspended solids, nitrogen, phosphorus and herbicides delivered to the Great Barrier Reef lagoon. Mar. Pollut. Bull. 65, 167–181. doi: 10.1016/j.marpolbul.2011.10.018
Kulkarni, M. V., Groffman, P. M., and Yavitt, J. B. (2008). Solving the global nitrogen problem: It's a gas! Front. Ecol. Environ. 6, 199–206. doi: 10.1890/060163
Lovelock, C. E., Feller, I. C., Adame, M. F., Reef, R., Penrose, H. M., Wei, L., et al. (2011). Intense storms and the delivery of materials that relieve nutrient limitations in mangroves of an arid zone estuary. Funct. Plant Biol. 38, 514–522. doi: 10.1071/FP11027
Lu, J., Bunn, S. E., and Burford, M. A. (2018). Nutrient release and uptake by littoral macrophytes during water level fluctuations. Sci. Total Environ. 623, 29–40. doi: 10.1016/j.scitotenv.2017.11.199
Lu, J., Faggotter, S. J., Bunn, S. E., and Burford, M. A. (2017). Macrophyte beds in a subtropical reservoir shifted from a nutrient sink to a source after drying then rewetting. Freshw. Biol. 62, 854–867. doi: 10.1111/fwb.12904
McClain, M. E., Boyer, E. W., Dent, C. L., Gergel, S. E., Grimm, N. B., Groffman, P. M., et al. (2003). Biogeochemical hot spots and hot moments at the interface of terrestrial and aquatic ecosystems. Ecosystems 6, 301–312. doi: 10.1007/s10021-003-0161-9
Murray, R., Erler, D., Rosentreter, J., Maher, D., and Eyre, B. (2018). A seasonal source and sink of nitrous oxide in mangroves: insights from concentration, isotope, and isotopomer measurements. Geochim. Cosmochim. Acta 238, 169–192. doi: 10.1016/j.gca.2018.07.003
Ndehedehe, C., Agutu, N., Okwuashi, O., and Ferreira, V. G. (2016). Spatio-temporal variability of droughts and terrestrial water storage over Lake Chad Basin using independent component analysis. J. Hydrol. 540, 106–128. doi: 10.1016/j.jhydrol.2016.05.068
Nielsen, L. (1992). Denitrification in sediment determined from nitrogen isotope pairing. FEMS Microbiol. Ecol. 86, 357–362. doi: 10.1016/0378-1097(92)90800-4
Oliveira-Fernandes, S. O., Bonin, P. C., Michotey, V. D., Garcia, N., and LokaBharathi, P. A. (2012). Nitrogen-limited mangrove ecosystems conserve N through dissimilatory nitrate reduction to ammonium. Sci Rep. 2:419. doi: 10.1038/srep00419
Orr, D., Turner, R. D. R., Huggins, R., Vardy, S., and Warne, M. S. J. (2014). “Wet Tropics water quality statistics for high and base flow conditions,” in Great Barrier Reef Catchment Loads Monitoring Program, Water Quality and Investigations (Brisbane, QLA: Department of Science, Information, Technology, innovation and the Arts, Environmental Monitoring and Assessment Sciences, Science Division Brisbane), 73.
Piña-Ochoa, E., and Álvarez-Cobelas, M. (2006). Denitrification in aquatic environments: a cross-system analysis. Biogeochemistry 81, 111–130. doi: 10.1007/s10533-006-9033-7
Rasiah, V., Armour, J. D., Cogle, A. L., and Florentine, S. K. (2010). Nitrate import-export dynamics in groundwater interacting with surface-water in a wet-tropical environment. Aus. J. Soil Res. 48, 361–370. doi: 10.1071/SR09120
Rasiah, V., Armour, J. D., Yamamoto, T., Mahendrarajah, S., and Heiner, D. H. (2003). Nitrate dynamics in shallow groundwater and the potential for transport to off-site water bodies. Water. Air. Soil Pollut. 147, 183–202. doi: 10.1023/A:1024529017142
Sadat-Noori, M., Santos, I. R., Tait, D. R., and Maher, D. T. (2016). Fresh meteoric versus recirculated saline groundwater nutrient inputs into a subtropical estuary. Sci. Tot. Environ. 566–567, 1440–1453. doi: 10.1016/j.scitotenv.2016.06.008
Steingruber, S., Friedrich, J., Gachter, R., and Wehrli, B. (2001). Measurement of denitrification in sediments with the 15N isotope pairing technique. Appl. Environ. Microbiol. 67, 3771–3778. doi: 10.1128/AEM.67.9.3771-3778.2001
Tomasek, A. A., Hondzo, M., Kozarek, J. L., Staley, C., Wang, P., Lurndahl, N., et al. (2019). Intermittent flooding of organic-rich soil promotes the formation of denitrification hot moments and hot spots. Ecosphere 10:e02549. doi: 10.1002/ecs2.2549
Vilmin, L., Mogollón, J. M., Beusen, A. H. W., and Bowmana, A. F. (2018). Forms and subannual variability of nitrogen and phosphorus loading to global river networks over the 20th century. Glob. Planet Change 163, 67–85. doi: 10.1016/j.gloplacha.2018.02.007
Voynova, Y. G., Brix, H., Petersen, W., Weigelt-Krenz, S., and Scharfe, M. (2017). Extreme flood impact on estuarine and coastal biogeochemistry: the 2013 Elbe flood. Biogeosciences 14, 541–557. doi: 10.5194/bg-14-541-2017
Wadnerkar, P. D., Santos, I. R., Looman, A., Sanders, C. J., White, S., Tucker, J. P., et al. (2019). Significant nitrate attenuation in a mangrove-fringed estuary during a flood-chase experiment. Environ. Pollut. 253, 1000–1008. doi: 10.1016/j.envpol.2019.06.060
Wallace, J., Stewart, L., Hawdon, A., and Keen, R. (2008). The role of coastal floodplains in generating sediment and nutrient fluxes to the Great Barrier Reef lagoon in Australia. Ecohydrol. Hydrobiol. 8, 183–194. doi: 10.2478/v10104-009-0014-z
Wallace, J., Stewart, L., Hawdon, A., Keen, R., Karim, F., and Kemei, J. (2009). Flood water quality and marine sediment and nutrient loads from the Tully and Murray catchments in north Queensland, Australia. Mar. Freshw. Res. 60, 1123–1131. doi: 10.1071/MF08356
Waltham, N. J., Burrows, D., Wegscheidl, C., Buelow, C., Ronan, M., Connolly, N., et al. (2019). Lost floodplain wetland environments and efforts to restore connectivity, habitat, and water quality settings on the Great Barrier Reef. Front. Mar. Sci. 6:71. doi: 10.3389/fmars.2019.00071
Waters, D. K., Carroll, C., Ellis, R., Hateley, L., McCloskey, J., Packett, R., et al. (2014). Modelling Reductions of Pollutant Loads due to Improved Management Practices in the Great Barrier Reef Catchments – Whole of GBR, Technical Report. Department of Natural Resources and Mines, Toowoomba, Queensland.
Wells, N., Baisden, W., Horton, T., and Clough, T. (2016). Spatial and temporal variations in nitrogen export from a New Zealand pastoral catchment revealed by stream nitrate isotopic composition. Water Resour. Res. 52, 2840–2854. doi: 10.1002/2015WR017642
WetlandInfo Department for Environment Science, Queensland Government. (2019). Available online at: https://wetlandinfo.des.qld.gov.au/wetlands/
Wilson, P., and Baker, D. (1990). Soils and Agricultural Land Suitability of the Wet Tropical Coast of North Queensland: Ingham area. Brisbane, QLA: Queensland Department of Primary Industries. Land Resources Bulletin. QV90001.
Xiao, K., Wu, J., Li, H., Hong, Y., Wilson, A. M., Jiao, J. J., et al. (2018). Nitrogen fate in a subtropical mangrove swamp: Potential association with seawater-groundwater exchange. Sci. Total Environ. 635, 586–597. doi: 10.1016/j.scitotenv.2018.04.143
Xu, H. (2006). Modification of normalised difference water index (NDWI) to enhance open water features in remotely sensed imagery. Int. J. Remote Sens. 27, 3025–3033. doi: 10.1080/01431160600589179
Keywords: denitrification, dissolved inorganic nitrogen, Great Barrier Reef, nitrate, mangroves, Melaleuca, Wet Tropics
Citation: Adame MF, Roberts ME, Hamilton DP, Ndehedehe CE, Reis V, Lu J, Griffiths M, Curwen G and Ronan M (2019) Tropical Coastal Wetlands Ameliorate Nitrogen Export During Floods. Front. Mar. Sci. 6:671. doi: 10.3389/fmars.2019.00671
Received: 17 June 2019; Accepted: 16 October 2019;
Published: 05 November 2019.
Edited by:
Eero Asmala, University of Helsinki, FinlandReviewed by:
Sanni Leea Aalto, University of Eastern Finland, FinlandNaomi Susan Wells, Southern Cross University, Australia
Copyright © 2019 Adame, Roberts, Hamilton, Ndehedehe, Reis, Lu, Griffiths, Curwen and Ronan. This is an open-access article distributed under the terms of the Creative Commons Attribution License (CC BY). The use, distribution or reproduction in other forums is permitted, provided the original author(s) and the copyright owner(s) are credited and that the original publication in this journal is cited, in accordance with accepted academic practice. No use, distribution or reproduction is permitted which does not comply with these terms.
*Correspondence: Maria Fernanda Adame, Zi5hZGFtZUBncmlmZml0aC5lZHUuYXU=