
94% of researchers rate our articles as excellent or good
Learn more about the work of our research integrity team to safeguard the quality of each article we publish.
Find out more
ORIGINAL RESEARCH article
Front. Mar. Sci., 15 October 2019
Sec. Marine Molecular Biology and Ecology
Volume 6 - 2019 | https://doi.org/10.3389/fmars.2019.00621
 Ulla von Ammon1,2*
 Susanna A. Wood1
 Olivier Laroche1,2
 Anastasija Zaiko1,2
 Shane D. Lavery2,3Graeme J. Inglis4
 Xavier Pochon1,3
Environmental DNA is increasingly being used in marine invasive species surveillance despite the inability to discriminate between contemporary intracellular (i.e., living) and extracellularly persistent (i.e., legacy) DNA fragments. Environmental RNA is emerging as a powerful alternative when distinguishing the living portion of a community is essential. A positive relationship between DNA and RNA signals may justify the use of DNA only for more rapid and cost-effective detections. In this study environmental DNA and RNA were co-extracted from settlement plates and water samples collected in an Auckland harbor, New Zealand. Samples were analyzed using a specific droplet digital PCR assay for the invasive Mediterranean fanworm (Sabella spallanzanii), combined with metabarcoding of metazoan communities (Cytochrome c oxidase subunit I). The number and magnitude of S. spallanzanii detections was higher in DNA compared to RNA, and in water samples. An assessment of detection sensitivity and specificity using a Receiver Operator Characteristics (ROC) analysis supported a relationship between the magnitude of DNA signal and the likelihood of RNA detection for both sampled matrices. A prediction threshold of 400 COI copies in DNA samples provides an indicator for the detection of eRNA, hence the putative presence of living S. spallanzanii population under the conditions tested in this study. Metabarcoding community analysis revealed the taxonomic composition of the water samples to be more diverse than the plate samples which were largely dominated by mollusks. There was a strong association between mollusks and presumed extracellular droplet digital PCR signals. Nevertheless, droplet digital PCR detection signals based on environmental DNA were negatively correlated with metabarcoding diversity indices on plates. This highlights complex interactions between environmental DNA and RNA detections and environmental matrices that can affect targeted approaches. These interactions need to be considered when designing surveillance programs.
The globalization of maritime trade has played a key role in the accelerated spread of marine non-indigenous species (NIS). Two of the most common vectors are ballast water and hull fouling, with marinas and ports commonly succumbing to initial infestations. Successful NIS often show high tolerance levels to extreme conditions, which partly explains their successful establishment in habitats where human-induced pressures are high (Ojaveer et al., 2018). Reliable surveillance programs are critical for early detection and efficient management of NIS (Hewitt et al., 2009). Current surveillance at ports generally involve visual surveys undertaken by divers. These can be dangerous, time and cost consuming, and taxonomic identification can be challenging especially for juvenile life stages or cryptic species.
Molecular methods aimed at characterizing and quantifying DNA from environmental samples (eDNA) can be used to complement existing techniques and lead to more sensitive and cost-efficient surveillance programs for marine NIS. In this study, we define environmental DNA as the genetic material extracted in bulk from an environmental sample such as soil, sediment, air or water (Taberlet et al., 2018). The eDNA in such samples originates from organisms’ body parts, or cells from feces, epidermal mucus, urine, saliva, gametes or other sources (Rees et al., 2014). Environmental DNA is relatively stable, especially when bound to other organic particles (Lindahl, 1993; Strickler et al., 2015). Dead biomaterial or extracellular DNA can be transported into a sampling region from a significant distance, therefore the detection of eDNA does not necessarily confirm the presence of living organisms, nor automatically indicate that live organisms occur in close proximity (Macher and Leese, 2017; Cristescu and Hebert, 2018). In contrast, environmental RNA (eRNA) is believed to deteriorate more rapidly due to the chemical composition (hydroxyl groups) which makes this molecule more prone to hydrolysis or degradation (Dowle et al., 2015; Guardiola et al., 2016; Laroche et al., 2016, 2017). Environmental RNA may therefore provide a better proxy for inferring the presence of living organisms (Thomsen et al., 2012a; Sassoubre et al., 2016; Pochon et al., 2017; Cristescu, 2019). However, working with eRNA requires specialized storage of samples, and expensive and time-consuming workflow protocols; potentially limiting its applicability to routine monitoring programs (Wood et al., 2019a).
A suite of different molecular techniques have been applied for analyzing eDNA/eRNA in marine samples which allow for either single species detection or community-wide taxonomic characterization (Wood et al., 2013). For the latter, metabarcoding has predominantly been used to characterize biodiversity and explore community/functional shifts in response to natural or anthropogenic perturbations (Langlet et al., 2013; Aylagas et al., 2014, 2018; Pawlowski et al., 2016; Keeley et al., 2018; Laroche et al., 2018; Stoeck et al., 2018). Metabarcoding utilizes universal primers that target taxonomically informative genes such as, the nuclear small subunit ribosomal RNA (18S rRNA) or the mitochondrial Cytochrome c Oxidase subunit I (COI) genes (Tanabe et al., 2016; Stat et al., 2017; Bista et al., 2018; Wangensteen et al., 2018). In the context of surveillance for marine NIS, this approach holds great potential but has limitations, including challenges in identifying NIS at species level due to the lack of sufficiently resolved phylogenetic markers, incomplete reference databases, primer biases and sequencing artifacts, which all may lead to false positive or negative results (Brown et al., 2016; Ammon et al., 2018; Cristescu and Hebert, 2018). Targeted methods, e.g., species-specific qPCR, may offer a more sensitive approach for effective detection of specific marine NIS (Wood et al., 2017). However, species-specific assays need to be designed based on a priori knowledge of target organisms. Droplet digital PCR (ddPCR) is a real time PCR technology that divides eDNA/eRNA template into thousands of nanoliter droplets, each containing a single target molecule. Within each droplet, a PCR is conducted, and the outcome visualized via the presence or absence of a fluorescence signal. The number of target copies can be calculated on the positive-negative droplet relation, allowing direct quantification without the need for standard curves (Baker et al., 2018). When using ddPCR, the parallel processing of thousands of reactions enables the detection of very low target concentrations while minimizing PCR inhibition and removing the need for technical replicates, thereby reducing analysis costs and time (Nathan et al., 2014; Doi et al., 2015). While these molecular tools are very promising and increasingly advocated for marine NIS surveillance, there is still limited knowledge on the factors affecting detection probabilities (Wood et al., 2019b). For example, there is a need for more research to determine if the complexity of sampling matrices affects the detection efficiency and whether eDNA binds to certain environmental matrices for longer periods of time. Furthermore, additional information on the relationship between eDNA and eRNA signals will assist in determining whether the use of eDNA in isolation can accurately predict if living organisms are present near the collection source, thus making these tools more cost-effective for routine biomonitoring programs.
The Mediterranean fanworm, Sabella spallanzanii, is a marine NIS that has established in New Zealand and Australia. It is thought to have been transported to Australia initially as biofouling on vessels from Europe, with consequences for native ecosystems (Read et al., 2011). High tolerance levels to anthropogenic stressors such as pollution and heavy metals, early maturity, high reproductive capacity and the ability to regrow from body parts contribute to its successful invasion (Lee et al., 2018). It can grow in dense aggregations, affecting oxygen and nutrient cycles, and therefore severely change ecosystem functions (Stabili et al., 2006). Sabella spallanzanii was first detected in Australia in 1965, where it rapidly spread across locations near Port Phillip Bay (Melbourne), affecting the natural environment through overgrowing subtidal habitats, and leading to changes in a demersal fish population (Parry et al., 1995; Currie et al., 2000). As a result, S. spallanzanii was designated an unwanted organism under the Biosecurity Act of New Zealand, and became the subject of targeted surveillance since 2002 (Hewitt et al., 2004; Inglis et al., 2005; Read et al., 2011). The species was detected in Lyttelton Harbor (Christchurch, South Island of New Zealand) in 2008, where eradication efforts were immediately initiated and the populations has been maintained at low densities (Inglis et al., 2008, 2009; Fletcher, 2014). This example highlights how marine monitoring programs that allow for the detection of NIS prior to their widespread establishment can enable effective management strategies (Bax et al., 2003; Tait et al., 2018). Despite its early detection, S. spallanzanii has spread to other locations in New Zealand, particularly in the Auckland region, likely due to multiple incursions and secondary spread via domestic pathways.
The aim of the present study was to investigate positive relationships between DNA and RNA signals that may justify the use of DNA only for more rapid and cost-effective detection of S. spallanzanii using eDNA and/or eRNA samples from water and biofilm samples, and explore the potential effect of biodiversity and community composition (determined using metabarcoding) on these. Water and biofilm samples were collected from the Viaduct Harbor (Auckland, New Zealand), where dense S. spallanzanii populations are established (Jute, 2015; Woods et al., 2018). The objectives of the study were to determine: (1) if S. spallanzanii COI gene copy numbers (determined using ddPCR) from eDNA are a good predictor of the magnitude of eRNA signal in co-extracted samples; (2) whether the relationship between these eDNA-eRNA signals vary between water and settlement plate samples; and (3) to what extent assemblage diversity influences the detection of S. spallanzanii using ddPCR across environmental matrices. Therefore, species diversity in eDNA and eRNA samples were determined using metabarcoding to investigate differences between water and plate biofilm samples.
Sampling took place in Auckland Viaduct Harbor, New Zealand (36.84° S, 174.76° E), between 19 July and 6 November 2018. Two vertically oriented PVC plates (15 × 15 cm) were attached to a rope 3 m above the seafloor at an average depth of 4 to 5 m at 6 sites spaced approximately 100 m apart. Dense populations of S. spallanzanii were visible on the harbor structures approximately 1 to 2 m away from the plates.
Plate sampling was undertaken every 4 weeks for 4 months (n = 48). Plates were retrieved from the water and the biofilm material removed using sterile stainless-steel surgical blades (Swann-Morton, Sheffield, United Kingdom), and isolated into sterile 1.5 ml tubes (Merck KGaA, Darmstadt, Germany) containing 1 ml LifeGuardTM Soil Preservation Solution (QIAGEN, Hilden, Germany). Samples were frozen (−80°C) immediately until further processing. After sampling, each plate was thoroughly wiped and rinsed with seawater from the respective site and redeployed.
Over the same 4 months period, water samples were collected fortnightly at the corresponding 6 locations (n = 48). Seawater (in total 60 l) from 3 depths (1 m below surface, 1 m above seafloor and the middle of the water column) was sampled using a 12V Seaflo 21 Series Water Pressure Pump 3.8LPM (MarineDeals, Auckland, New Zealand), following the method described in Woods et al. (2018). Briefly, water from the three depths was combined and pre-filtered through a 20 μm plankton mesh. To condense all biomaterial for eDNA/eRNA extraction, seawater (ca. 50 ml) from each site was used to re-suspend the material captured on the mesh and the re-suspended material was filtered onto nitrocellulose membrane filters (pore size 0.45 μm; Merck KGaA, Darmstadt, Germany). Filters were cut in half, each half stored in LifeGuardTM Soil Preservation Solution (QIAGEN, Hilden, Germany). Samples were frozen (−80°C) immediately until further processing.
Between each sampling location, all sampling equipment was soaked in 5% bleach (sodium hypochlorite) solution for at least 5 min and rinsed with water from the new sampling location to prevent cross-contamination.
Each step of the molecular analysis (i.e., DNA/RNA extractions, PCR, ddPCR, and metabarcoding library preparations) was conducted in a separate sterile laboratory dedicated to that step with sequential workflow to ensure no cross-contamination. Each room was equipped with ultra-violet sterilization which was switched on for a minimum of 15 min before and after each use. The PCR set-up and template addition was undertaken in laminar flow cabinets with HEPA filtration. Aerosol barrier tips (Axygen BioScience, CA, United States) were used throughout.
Biofilm from each of the 48 plate samples was centrifuged (10,000 × g, 2 min), and the supernatant discarded before extracting the nucleic acids from the resulting pellets. These were sub-sampled if the total mass exceeded 0.2 g. The 48 filters from water sampling were directly transferred into ZR BashingBead Lysis Tubes (2.0 mm; Zymo Research, CA, United States) containing Lysis Buffer (1 ml) from the ZR-DuetTM DNA/RNA MiniPrep Kit Plus (Zymo Research, CA, United States). All samples were homogenized via bead beating for 2 min (1600 MiniG Spex SamplePrep, NJ, United States), and centrifuged (10,000 × g, 5 min, 20°C; Eppendorf Centrifuge 5430R, Hamburg, Germany). Total DNA and RNA were then co-extracted from each sample using the ZR-DuetTM DNA/RNA MiniPrep Kit Plus (Zymo Research, CA, United States), following the manufacturers protocol and extraction blanks were included for each extraction series.
The quantity and quality of extracted DNA were measured using a NanoPhotometer (Implen, Munich, Germany). Trace DNA in isolated RNA was eliminated by two sequential DNase (TURBO DNA-freeTM Kit, Thermo Fisher Scientific, MA, United States) treatments following Langlet et al. (2013). Treated RNA was diluted to 10 ng/μl equimolar concentrations and reverse transcribed into cDNA using the SuperScriptTM III reverse transcriptase (Thermo Fisher Scientific, MA, United States). All extracted products were stored frozen (−20°C) for DNA and cDNA, and at −80°C for RNA backup samples until further analysis.
Sabella spallanzanii-specific COI copy numbers were quantified using ddPCR for all 48 plates and 48 water samples, including all negative extraction controls (DNA and RNA) on a QX200 Droplet Digital PCR SystemTM (Bio-Rad, CA, United States). Sabella spallanzanii specific COI primers (Sab3F: 5′-GCT CTT ATT AGG CTC TGT GTT TG-3′) and (Sab3R: 5′-CCT CTA TGT CCA ACT CCT CTT G-3′) and Taqman probe Sab3 (5′-FAM/AAA TAGT TCA TCC CGT CCC TGC CC/BkFQ-3′) were used as described in Wood et al. (2017). Each ddPCR reaction included 450 nM of each primer and probe, 1 × BioRad ddPCR Supermix for probes, 3 μl DNA or 1.5 μl cDNA, and sterile water for a total reaction volume of 22 μl. The BioRad QX200 droplet generator partitioned each reaction mixture into approximately 20,000 nanodroplets by combining 20 μl of the reaction mixture with 70 μl of BioRad droplet oil. After processing, this resulted in a total nanodroplet volume of 40 μl, which was transferred to a PCR plate for amplification using the following cycling protocol: hold at 95°C for 10 min, 40 cycles of 94°C for 30 s, 60°C for 1 min, and a final enzyme deactivation step at 98°C for 10 min. Each well of the plate was then individually analyzed on the QX200 instrument to establish the threshold value separating negative and positive droplets and perform absolute quantification of target DNA or cDNA (hereafter referred to as RNA). A positive control of extracted DNA from S. spallanzanii tissue and negative (MQ-water) control was included on each plate.
The results were converted to copies per sample using the formula: number of copies per μl × 22 [the initial volume of the PCR reaction (μl)] × 60 [the volume used to elute the DNA/RNA during extraction (μl)].
Based on the ddPCR results a subset of DNA and RNA water and plate samples (n = 36) was selected for metabarcoding. The samples were selected to allow a balance of DNA/RNA detection and non-detection samples (Supplementary Table S3). A fragment of the COI gene (∼ 300 bp) was amplified with the primers mlCOIintF (5′-GGW ACW GGW TGA ACW GTW TAY CCY CC-3′) and jgHCO2198 (5′-TAI ACY TCI GGR TGI CCR AAR AAY CA-3′ (Leray et al., 2013). Polymerase Chain Reaction was performed using fusion tag primers consisting of IlluminaTM adapter sequences, indexes and the COI-specific primers as in Supplementary Table S1. Amplifications were undertaken on an Eppendorf Mastercycler (Eppendorf, Hamburg, Germany) in a total volume of 50 μl using 25 μl of MyFiTM Mix (Bioline, MA, United States), 2 μl of each primer, 18 μl of DNA-free water, and 3 μl of template DNA. Thermocycling conditions were: 95°C for 2 min, followed by 45 cycles of 95°C for 20 s, 52°C for 20 s, 72°C for 20 s, and a final extension of 72°C for 10 min. Two samples containing 1 μl of ddH2O instead of DNA/cDNA were used as “no-template” negative controls.
Purification was performed following the AgencourtTM AMPureXP protocol (Beckman Coulter, Brea, United States), using magnetic beads, and products were quantified with the QubitTM 2.0 Fluorometer (Invitrogen, Carlsbad, United States). Purified amplicons were diluted to 3 ng μl–1 and pooled together. Sequencing was undertaken at the Trace and Environmental DNA (TrEnD) Laboratory at Curtin University (Perth, Australia); paired-end sequences (2 × 250) were generated using a 500 cycle MiSeqTM V2 Reagent Kit and standard flow cell on an IlluminaTM MiSeq and metabarcoding reads recovered by paired-end sequencing using the IlluminaTM MiSeq analysis software under the default settings.
Sequences have been deposited in the NCBI’s Sequence Read Archive under BioProject ID PRJNA 555091, sample accession SAMN 12291989-2081.
The raw sequence files were demultiplexed with the adapters, and primers removed using fastq-multx (Version 1.3.1). All further bioinformatics analysis was undertaken in QIIME2/2018.2 (Caporaso et al., 2010). Sequences were quality filtered, denoised, merged and dereplicated into Amplicon Sequence Variants/sub-Operational Taxonomic Units (ASVs) using the Deblur program with default settings (Amir et al., 2017). De novo and reference-based chimera detection and removal was performed using a customized database compiled from the MIDORI (Machida et al., 2017) and Barcode Of Life Database [BOLD; Ratnasingham and Hebert (2007)]. Taxonomy was assigned using Megablast (Morgulis et al., 2008), and the National Center of Biotechnology Information’s (NCBI) nucleotide collection (nr/nt) database (Coordinators, 2017), with a maximum of 10 best-matching sequences, e-value of 0.001 and minimum sequence coverage of 80%. Using hits with the lowest e-value, query sequences were assigned at species level if similarity of the hit was greater or equal to 97%. Otherwise, the last common ancestor among the ten best hits was used for assignment to higher taxonomic ranks. The number of reads for each ASV found in negative controls were subtracted across all other samples following the method described in Bell et al. (2018).
The ddPCR copy numbers per sampling time were visualized using boxplots [Primer-E Ltd., v.7; Plymouth, United Kingdom; Clarke and Gorley (2015)] and relationships between ddPCR copy numbers of DNA and RNA data for the two different sample types (water and plate samples) assessed using linear regressions. Regressions and corresponding F-statistic were derived from log(x+1) transformed data using the “lm” function implemented in R (v 3.4.1. R Core Team, 2017).
Receiver Operator Characteristics (ROC) analysis (Robin et al., 2011) was applied to verify predictive capacity of DNA signal strength for S. spallanzanii RNA detection (considered as a signal from living organisms). The principle of ROC analysis is to plot the relationship between the true positive rate (y-axis), against the false positive rate (x-axis). The true positive rate gives the sensitivity or probability of detection, while the false positive rate or the probability of a false positive detection is calculated as 1 – specificity (where “specificity” is calculated as the ratio of the true negatives divided by the true negatives plus false positives, which are derived from consistent values among DNA and RNA detections per sample). The area under the curve (AUC) is a measure of the response to predictor, with 100% value indicating perfect prediction. The most sensitive and specific response (the most upper left value in the curve) indicates the optimal predictor threshold value. To generate a graphical plot illustrating diagnostic ability of the DNA signal, the AUC and the threshold values optimized for best prediction were computed. Droplet digital PCR DNA copy number data were used as a predictor and presence-absence of ddPCR RNA amplicons as a signal (binary classifier). The ROC analyses were run for water and plates data separately and resulting curves were compared undertaking the default (DeLong) test implemented in “pROC” package in R (Robin et al., 2011).
For metabarcoding analyses, singletons were discarded and samples were grouped into the water or plate datasets, from which two datasets were created: 1) ASVs found in RNA-extracted samples (i.e., cDNA), hereafter referred to as “eRNA” and 2) ASVs found in DNA-extracted samples, hereafter referred to as “eDNA.” Venn diagrams were created using Venny (Oliveros, 2007-2015) to visualize the proportion of overlapping ASVs within each dataset. Bar plots were created based on the relative abundance of the above mentioned datasets summed at the phylum level using the R package “phyloseq” (McMurdie and Holmes, 2013). For alpha and beta-diversity analysis, metabarcoding datasets were rarefied to 5,000 reads per sample (Supplementary Figure S3) and Principal coordinate analysis (PCO) was performed on the “eRNA” and “eDNA” datasets to visualize differences between plate and water samples (Primer-E Ltd., v.7; Plymouth, United Kingdom; Clarke and Gorley (2015). Taxa summed at the phylum level and alpha diversity indices were overlaid as vectors on two-dimensional plots, if they showed a Pearson correlation r ≥ 0.5 with the datasets. The corresponding ddPCR copy numbers of S. spallanzanii were displayed as vectors regardless of their correlation value.
Alpha diversity indices (Margalef’s species richness, Shannon diversity and Pielou’s evenness) were calculated per sample and raw IlluminaTM reads of each metabarcoding dataset (eRNA and eDNA) were related to the ddPCR copy numbers of the corresponding “eRNA” and “eDNA” samples using linear regressions with the “lm” function and relations tested for significance, implemented in R (v 3.4.1. R Core Team, 2017).
Sabella spallanzanii was detected in 35% of RNA samples (14% plate and 55% water) and 68% of all DNA samples (55% plate, 77% water). Sabella spallanzanii was detected in 44% of DNA samples with no corresponding RNA detections (20 plate samples and 23 water samples). In contrast it was detected in 4% of the RNA samples with no detections in the corresponding DNA samples (1 plate sample and 3 water samples) (Supplementary Table S1).
RNA copy numbers varied between 0 and 1020 for plate samples, while in water samples the maximum value was 1,560,360 copies (26 September 2017) and higest average copy numbers (39,660 copies) on the 29 August 2017 (Figure 1). For DNA, copy numbers varied between 0 and 367,620 on plate samples and 0 and 1,807,800 in the water, with the highest values reached also on the 29 August 2017. This is within the time span that S. spallanzanii is expected to spawn in New Zealand (Jute, 2015). However, given the limited temporal coverage (4 months) and resolution (2–4 weeks between samples) of the study, temporal patterns were not explored in detail. Rather, we focused on the relationships between DNA/RNA signal and the influence of community composition on detection.
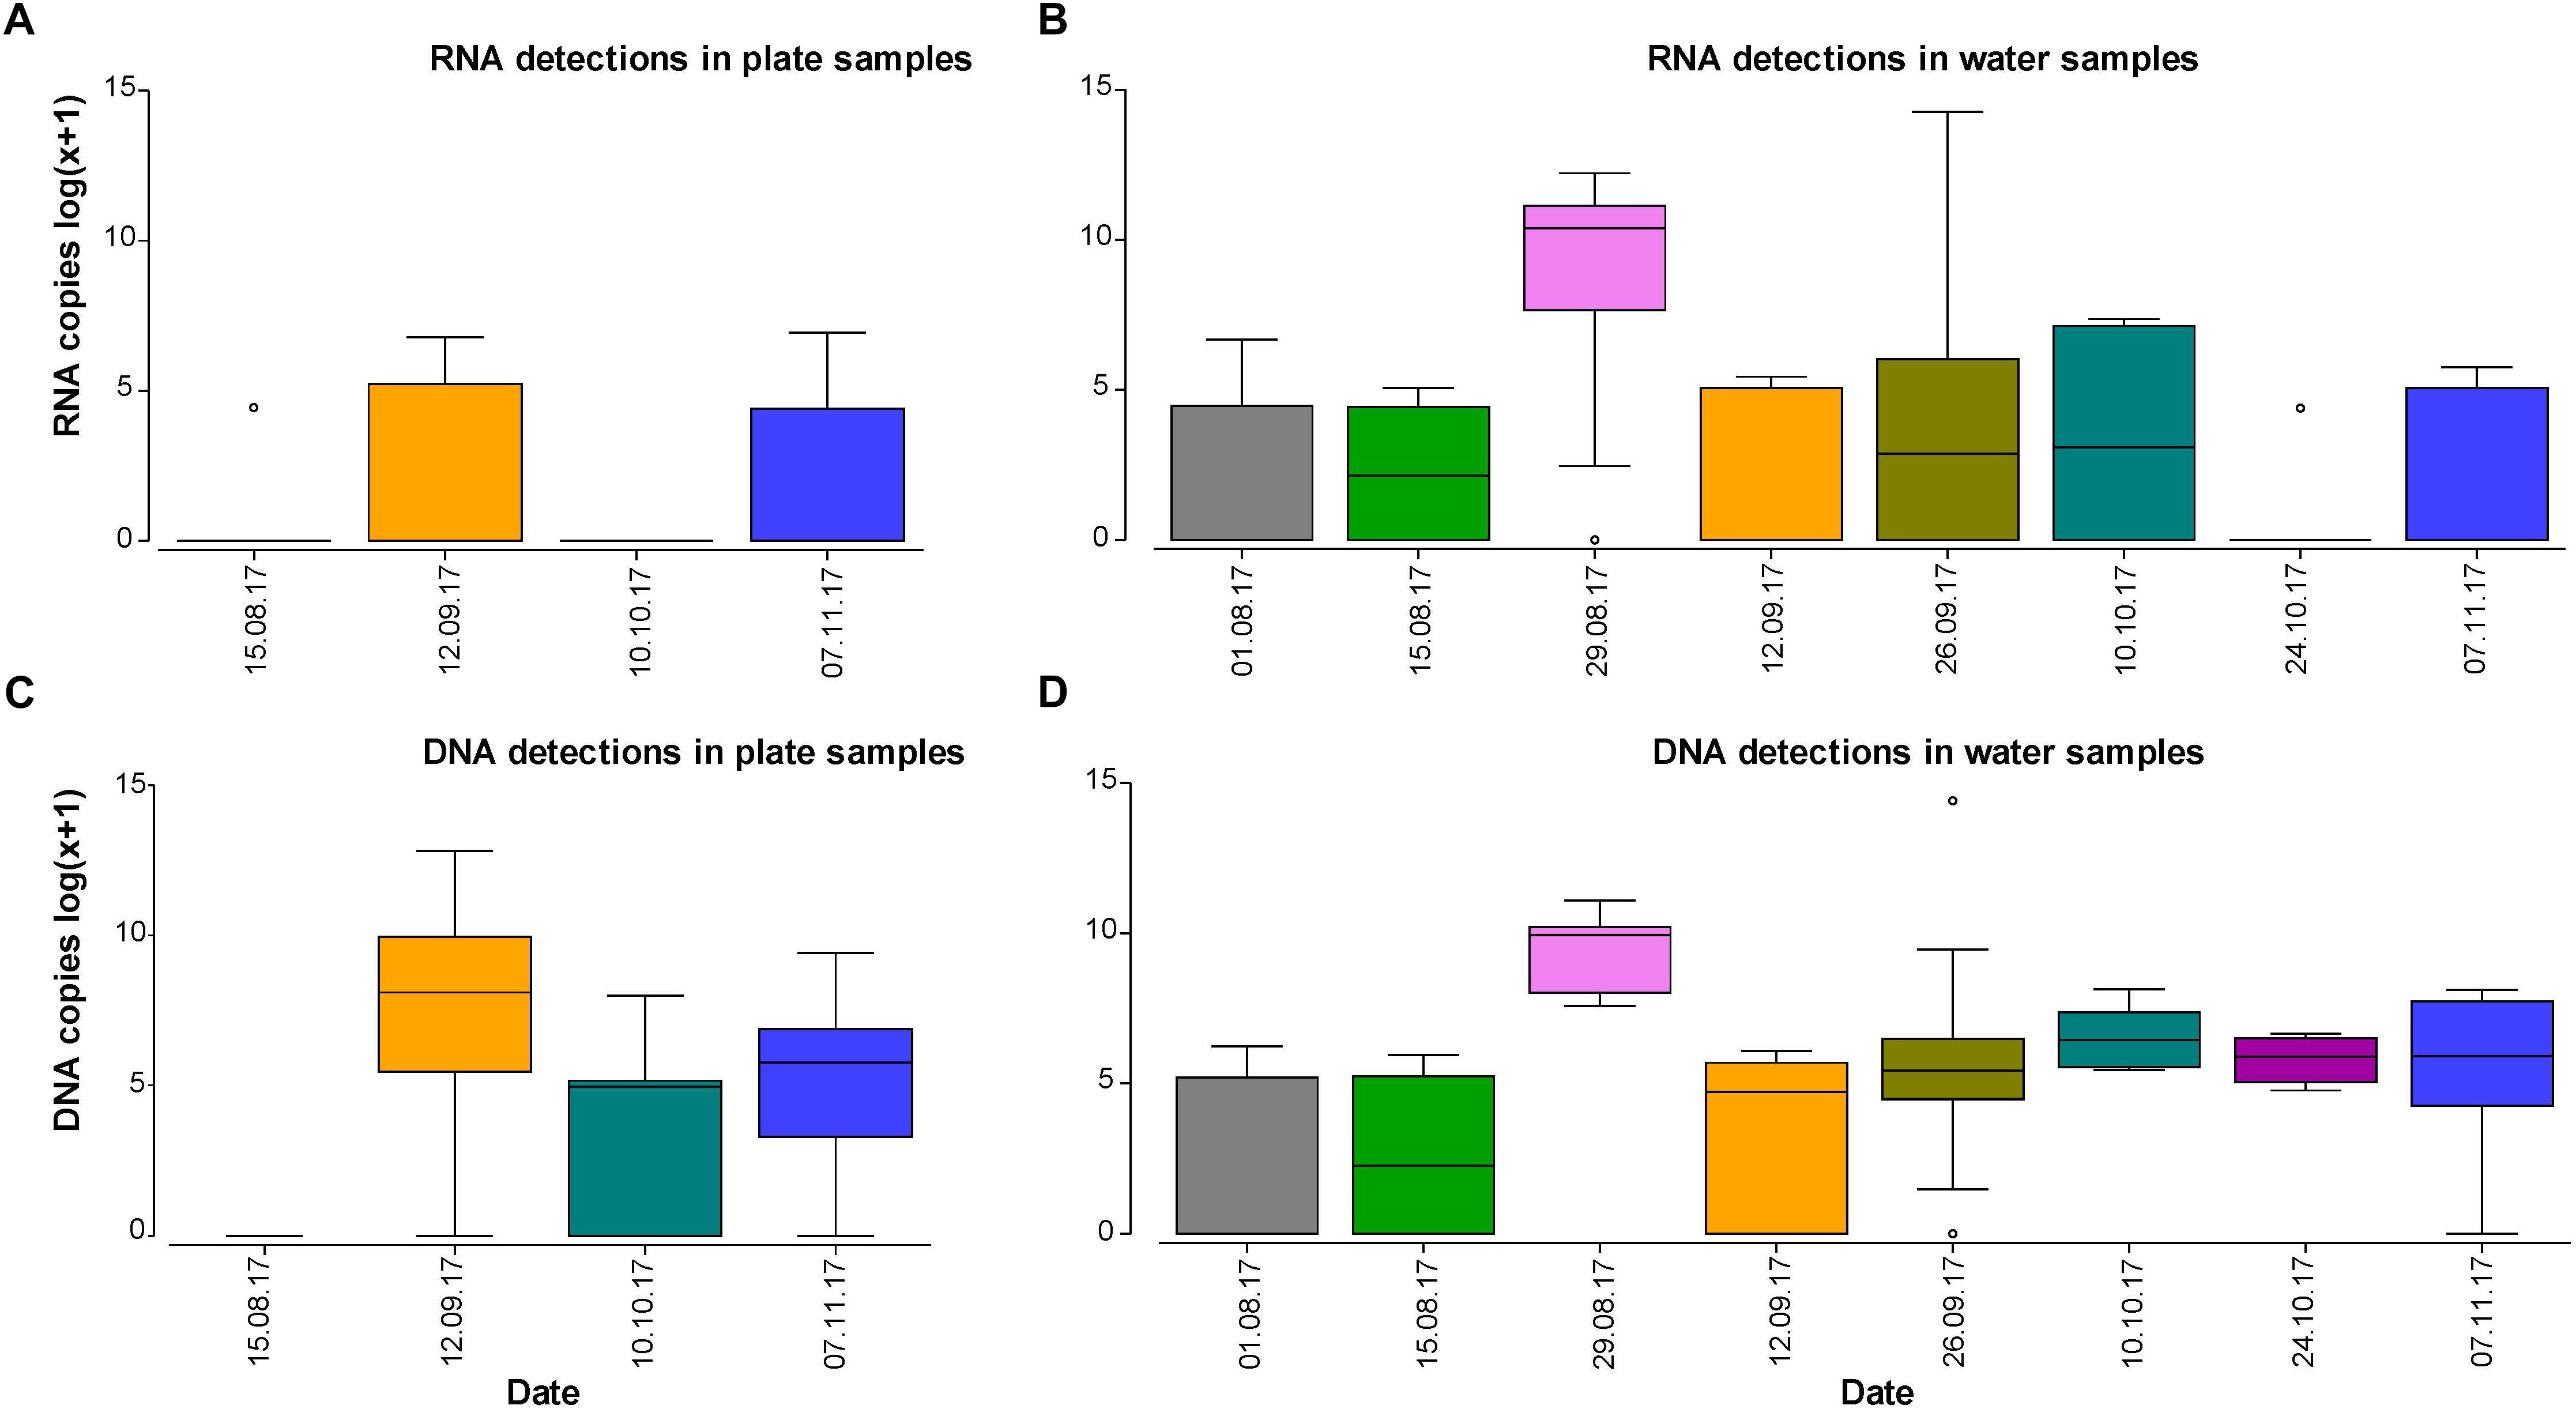
Figure 1. Boxplots displaying log(x+1) transformed DNA or RNA copy numbers per sample and determined by droplet digital PCR for plate and water samples over the study period. Colors align with sampling dates.
When all data on detections and non-detections were included, there was no clear relationship between the copy numbers of S. spallanzanii RNA and DNA ddPCR recorded from the plate samples (R2 = 0.19, p = 0.99; Supplementary Figure S2), and a weak but significant relationship in samples of water (R2 = 0.32, p < 0.001; Supplementary Figure S2). When zero values (i.e., whether the copy number of DNA or RNA was 0) were excluded from the analysis there was a strong correspondence between the copy numbers of RNA and DNA in both sample types (plate: R2 = 0.98, p = 0.008; and water: R2 = 0.95, p < 0.001; Supplementary Figure S2).
The ROC analysis for both plate and water datasets showed that the response of S. spallanzanii RNA signal to DNA copy numbers was strong, with a higher response detected for plate samples (AUC = 81%) compared to water samples (71.8%; Figure 2). However, there was no significant difference between the ROC values of plate and water samples (DeLong’s test, p = 0.428). The best sensitivity-specificity combination (optimal threshold) was reached at 404 copies for plate samples, compared with 422 copies for water samples (Figure 2).
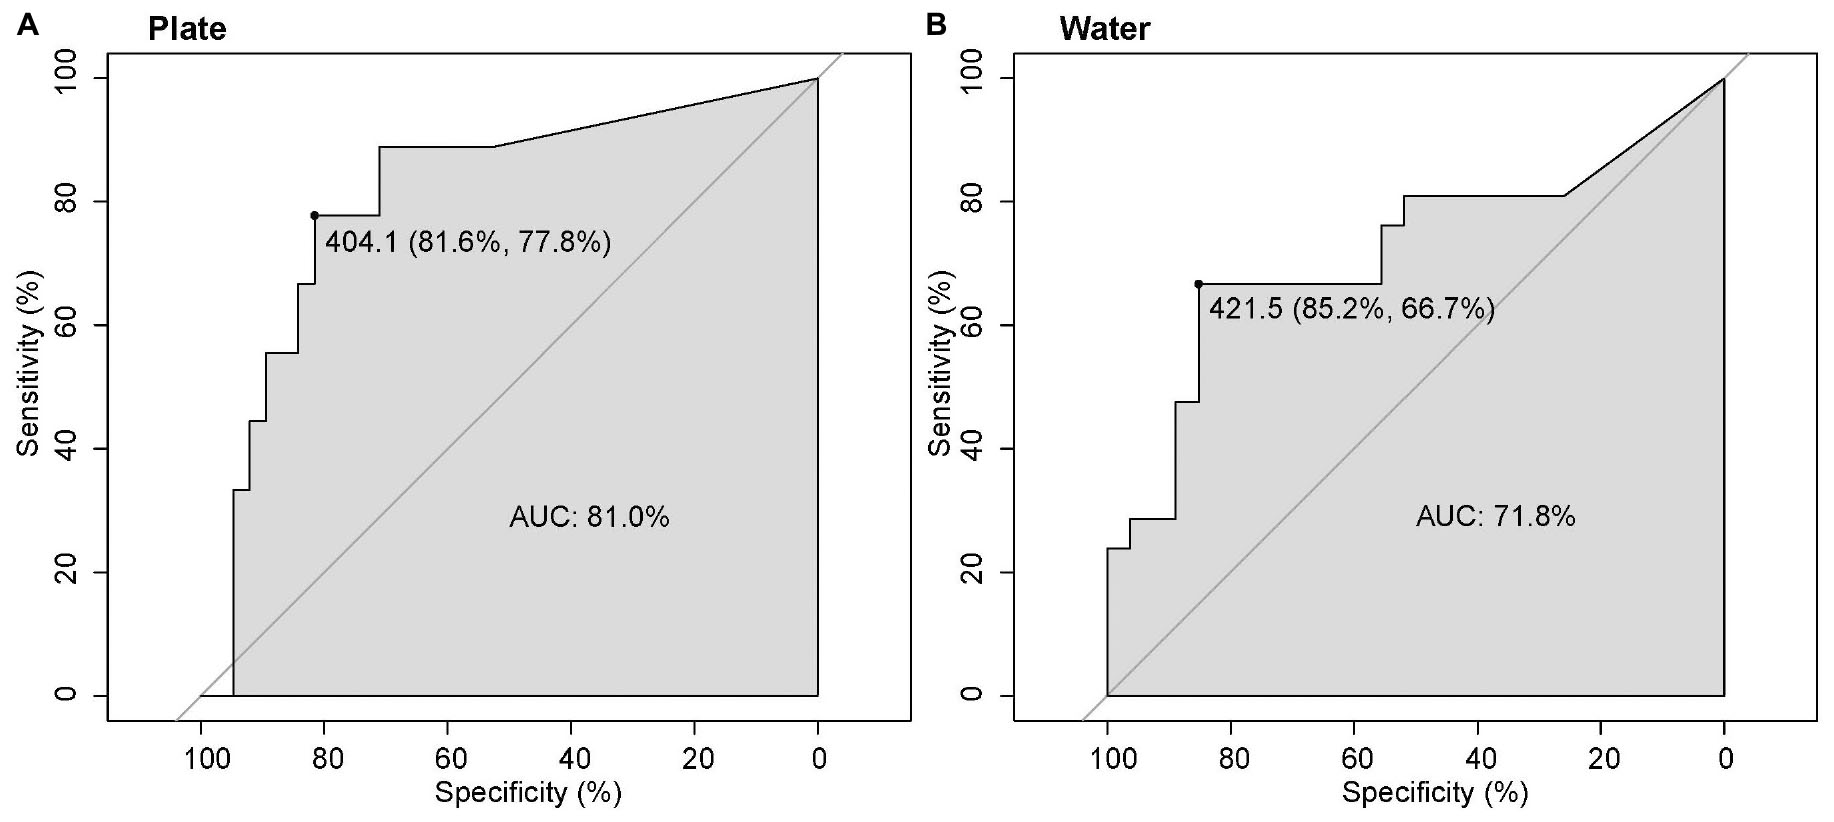
Figure 2. Receiver operator characteristics (ROC) with DNA copy numbers used as a predictor of S. spallanzanii RNA presence (binary classifier), for plate (A) and water (B) samples. The area under curves (AUC) represents a measure of the response to the predictor, where 100% represents a perfect predictor, and 50% a non-informative predictor. An estimate of an optimal threshold is indicated, showing the DNA copy number corresponding to the best specificity-sensitivity combination (specificity, sensitivity% in parentheses).
The total number of raw COI reads obtained for the 36 eDNA and 36 eRNA amplicons, were 3,027,021 and 2,688,149, respectively. These resulted in 730,210 and 593,468 paired-end, quality filtered and non-chimeric sequences comprising 3671 and 1872 ASVs excluding singletons.
The plate samples contained a higher proportion of eDNA ASVs (69.6%) compared to water samples (49.1%; Figure 3).
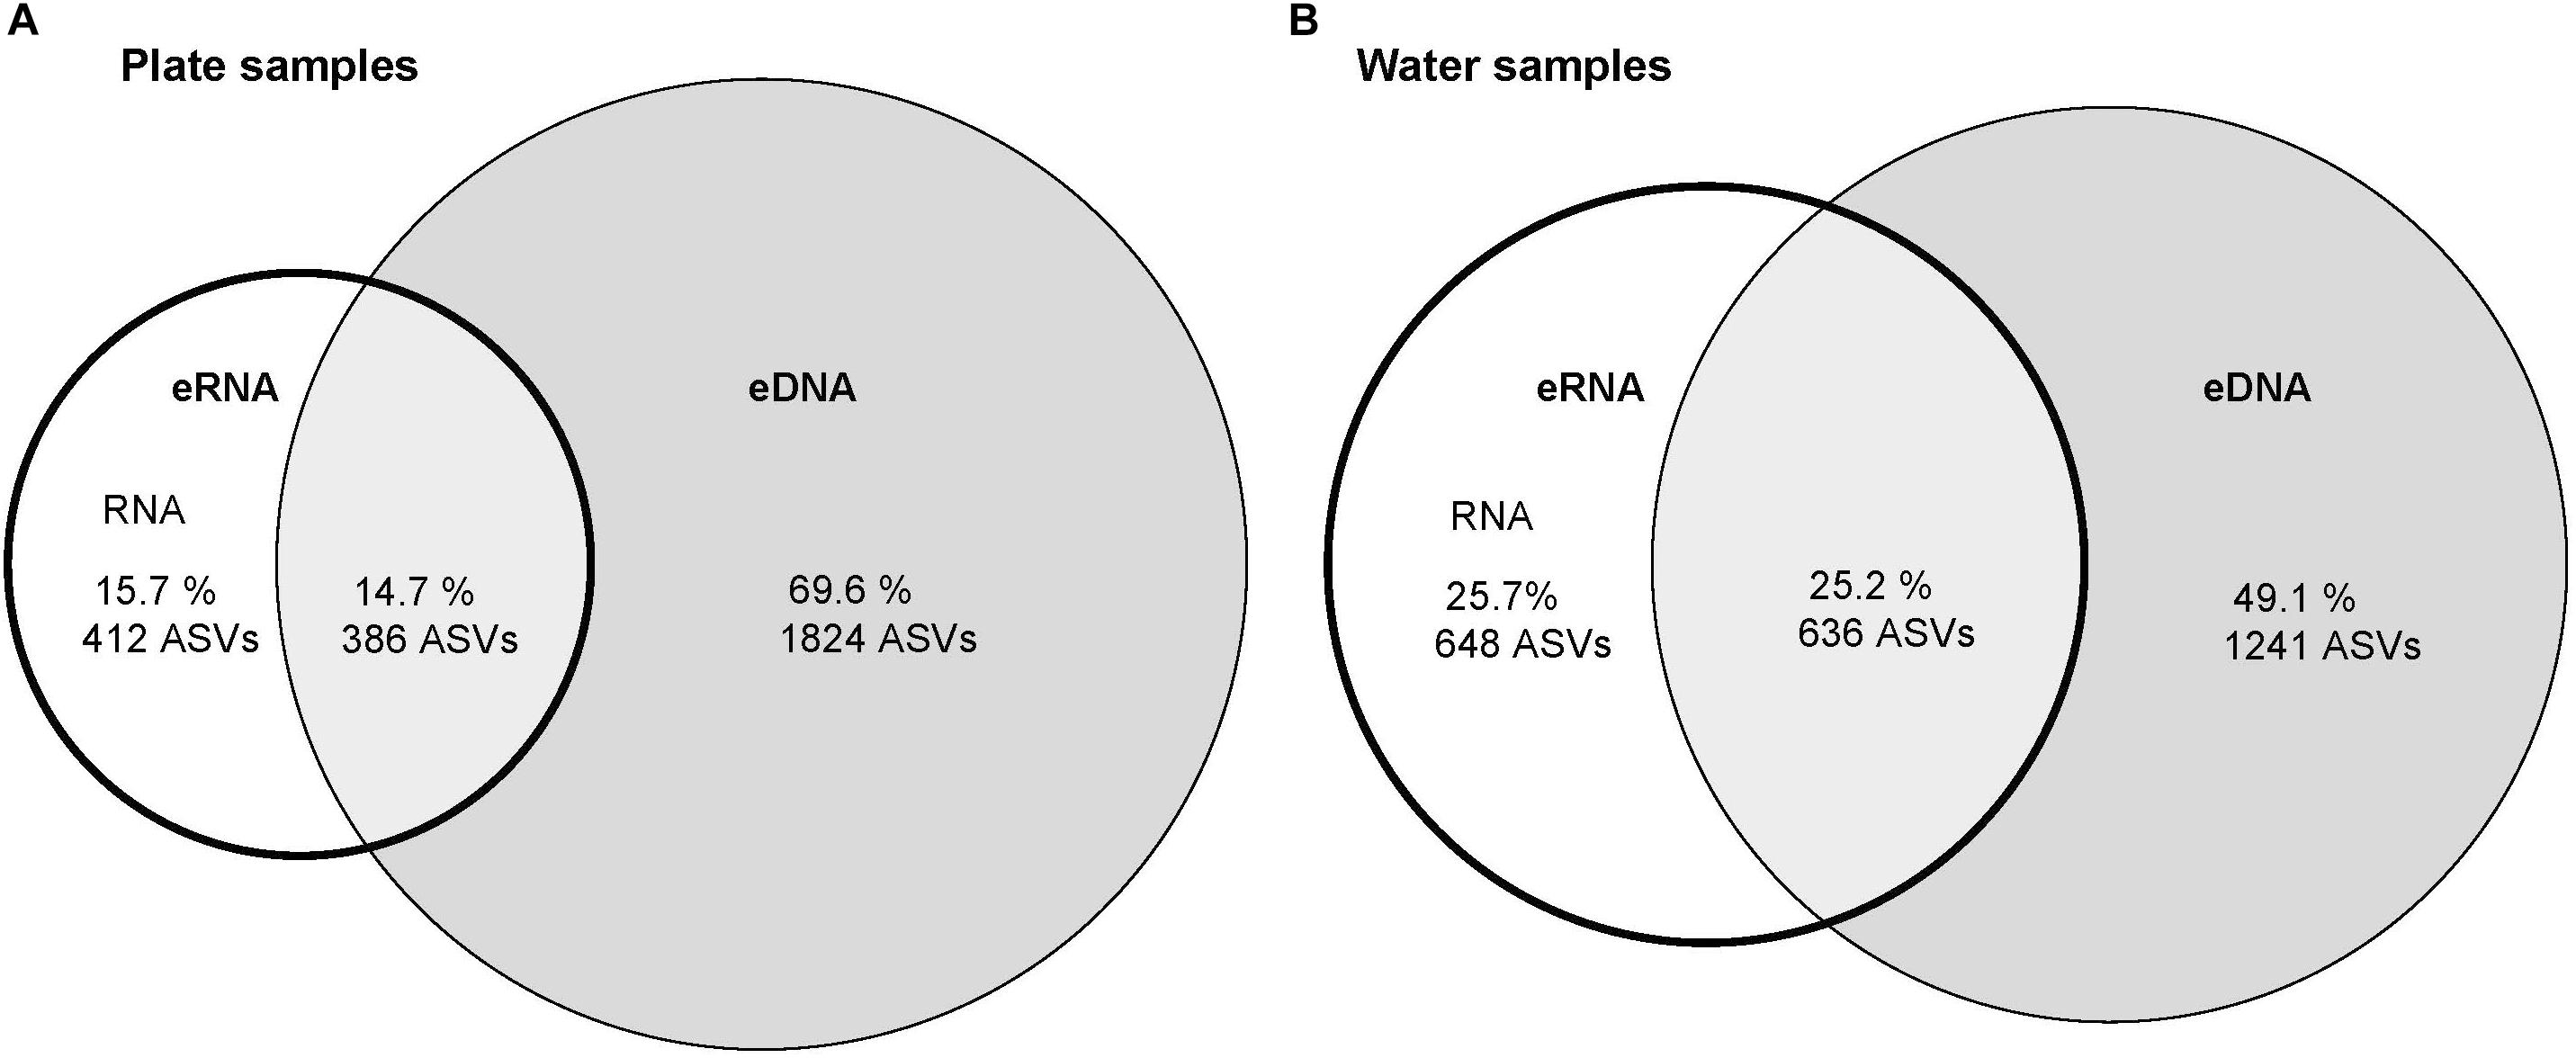
Figure 3. Venn diagrams displaying shared and unique Amplicon Sequence Variants (ASVs) between environmental RNA and unique ASVs among environmental DNA datasets for: (A) plate samples, and (B) water samples.
Among plate samples, the majority of phyla present in the eRNA component belonged to Mollusca (61%) and Arthropoda (23%). These two phyla were also dominant in the eDNA dataset but at slightly lower abundance (Figure 4).
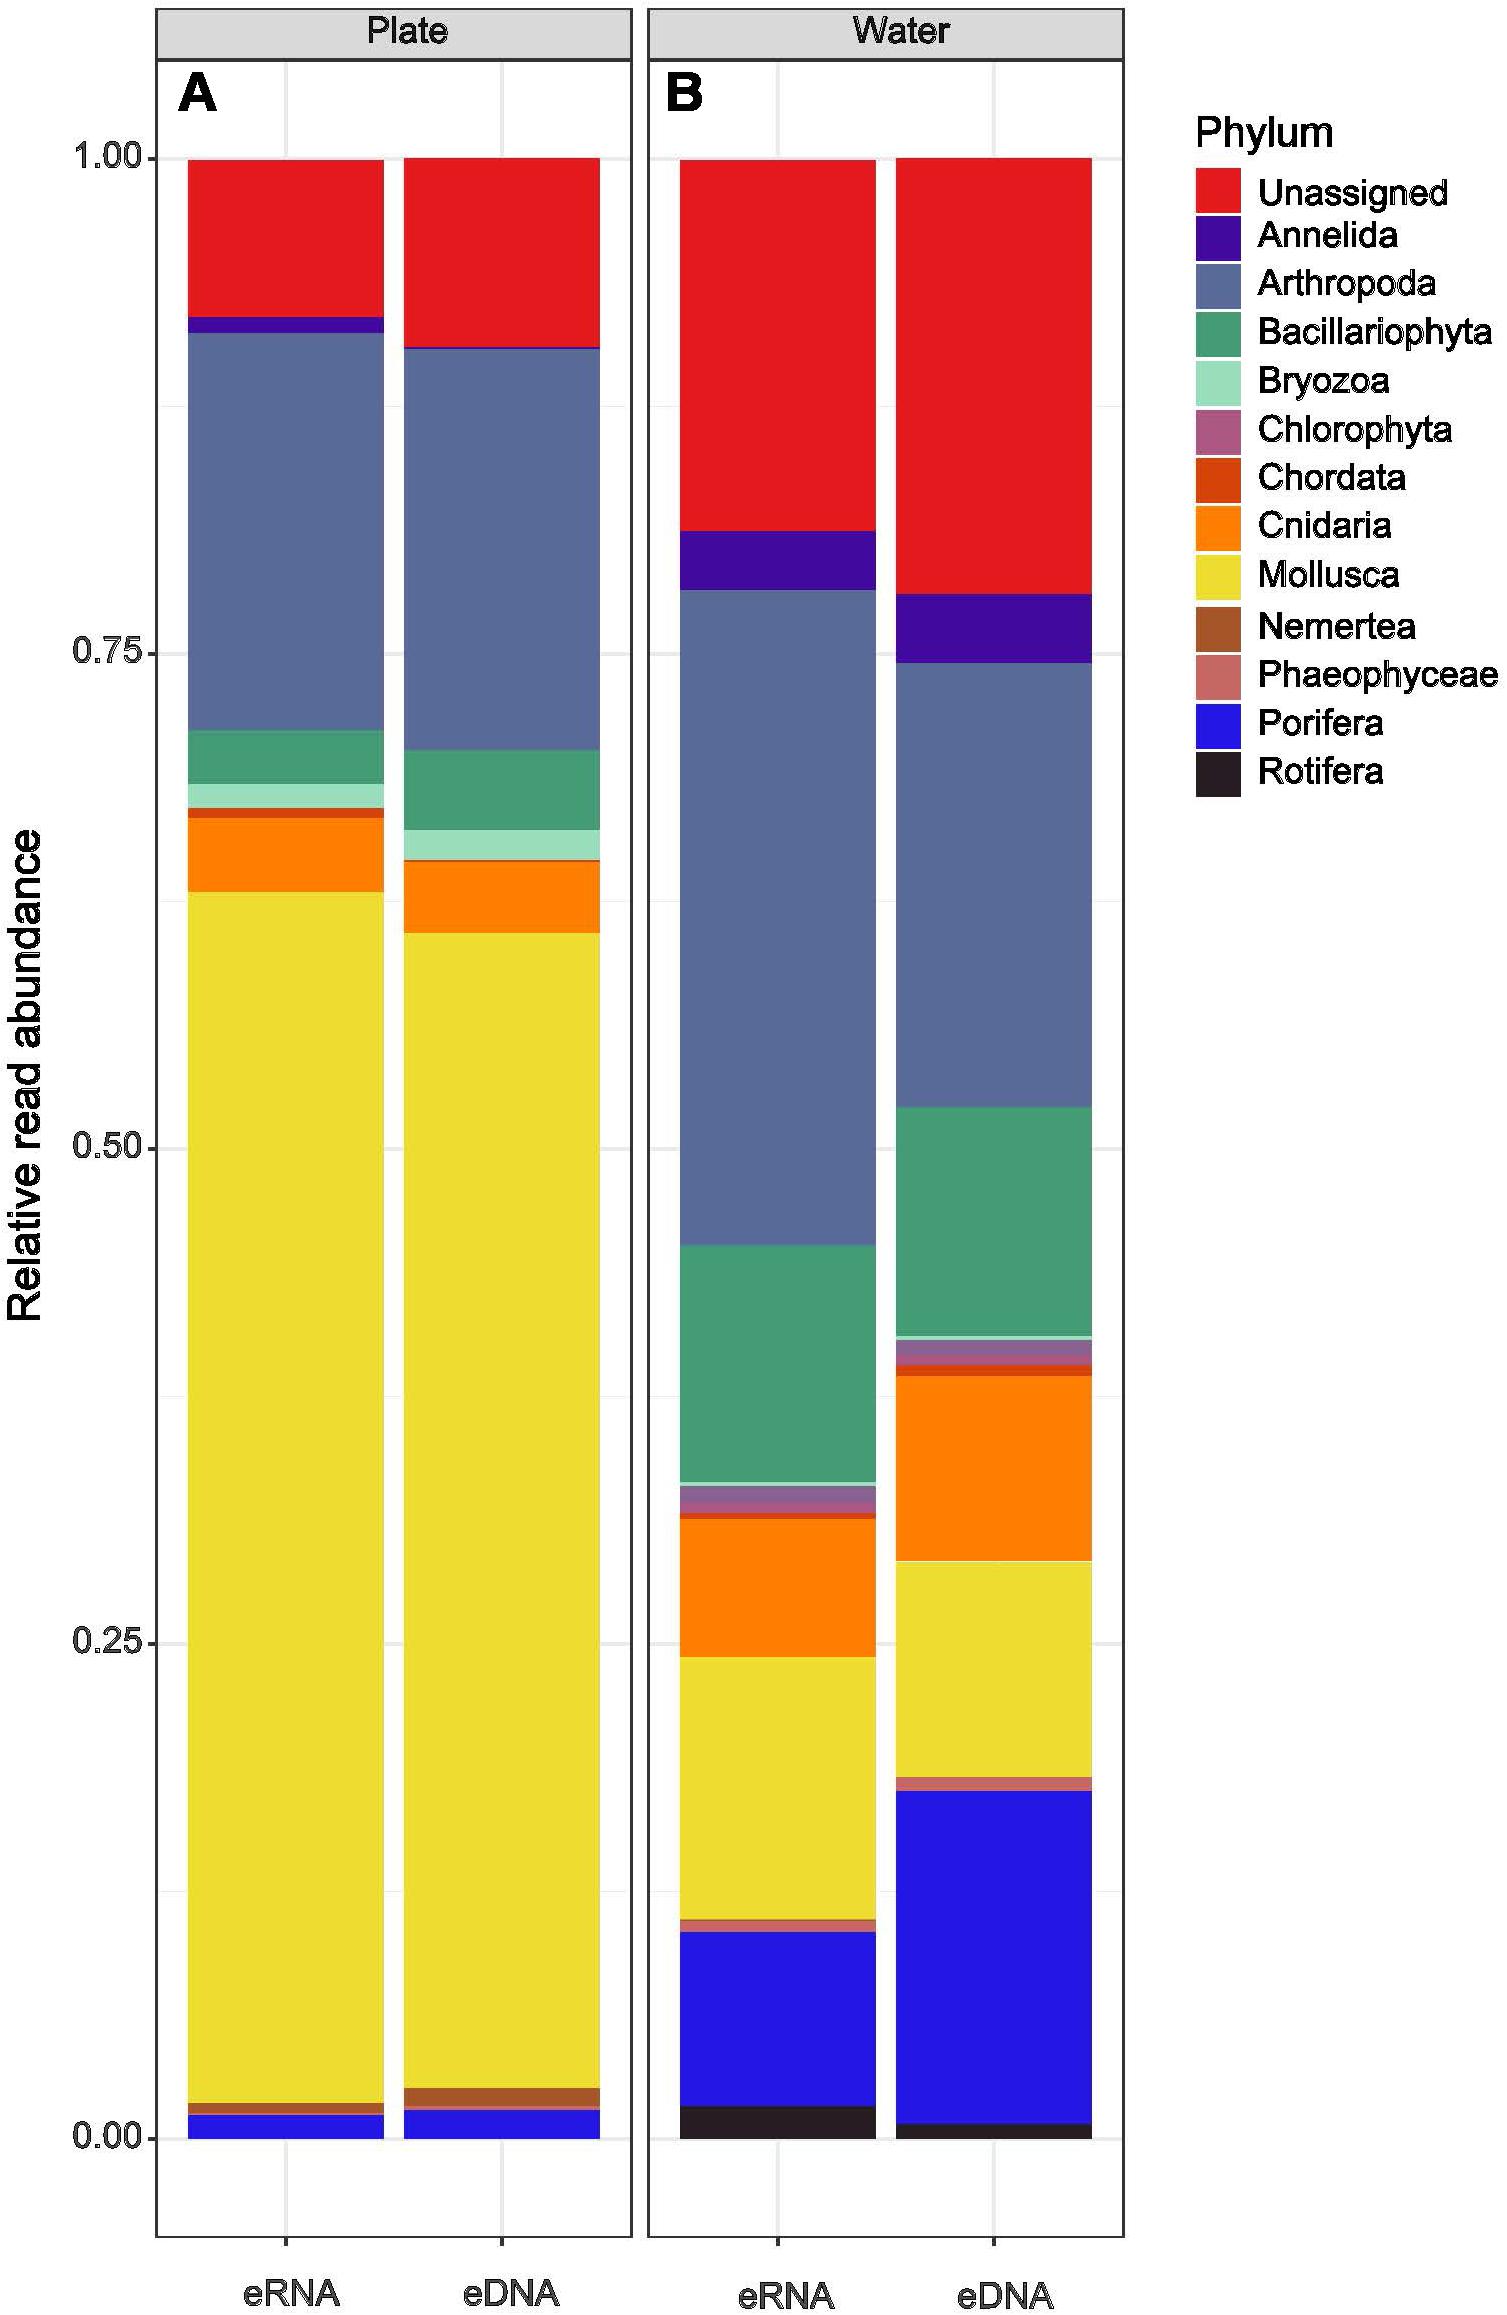
Figure 4. Percentage bar plots showing the relative abundance of sequence reads at the phylum level from environmental RNA and DNA metabarcoding data for plate and water samples.
At phylum level, the taxonomic composition of the water samples was more diverse than the plate samples (see also Supplementary Table S2). The majority of eRNA ASVs were Arthropoda (34%), Mollusca (12%), Bacillariophyta (11%) and Porifera (9%). The eDNA dataset was similar with lower abundance of Arthropoda (25%) and Mollusca (10%), but higher abundance of Porifera (19%), and was characterized by a slightly higher proportion (21%) of unassigned taxa (Figure 4). There were no ASVs assigned to S. spallanzanii when screening the metabarcoding taxonomy at species level instead 411 reads across 10 of 27 total water samples (390 reads) and 3 of 17 total plate samples (21 reads) were assigned to Sabella pavonina (e.g., GenBank accession number Sequence ID: KF369181.1) and Parasabella aberrans (e.g., GenBank accession number Sequence ID: LT717714.1). However, Wood et al. (2019b) constructed phylogenetic trees containing all Sabella sequences which indicated that the target gene could not distinguish these closely related Sabellidae species.
The eRNA dataset displayed the stronger separation of samples compared with the eDNA data (Figure 5A). Mollusca were strongly correlated with a subset of the plate samples while Chlorophyta, Arthropoda, Bacillariophyta and Rotifera displayed strong correlation with the cluster of water samples. All alpha diversity parameters (Margalef’s species richness, Shannon diversity and Pielou’s evenness index) were also strongly associated with the water samples. In contrast, the displayed S. spallanzanii ddPCR water copy numbers did not indicate a significant correlation with any sample group but was directed toward the water samples cluster. The vector for S. spallanzanii ddPCR plate copy numbers was most strongly correlated with plate samples.
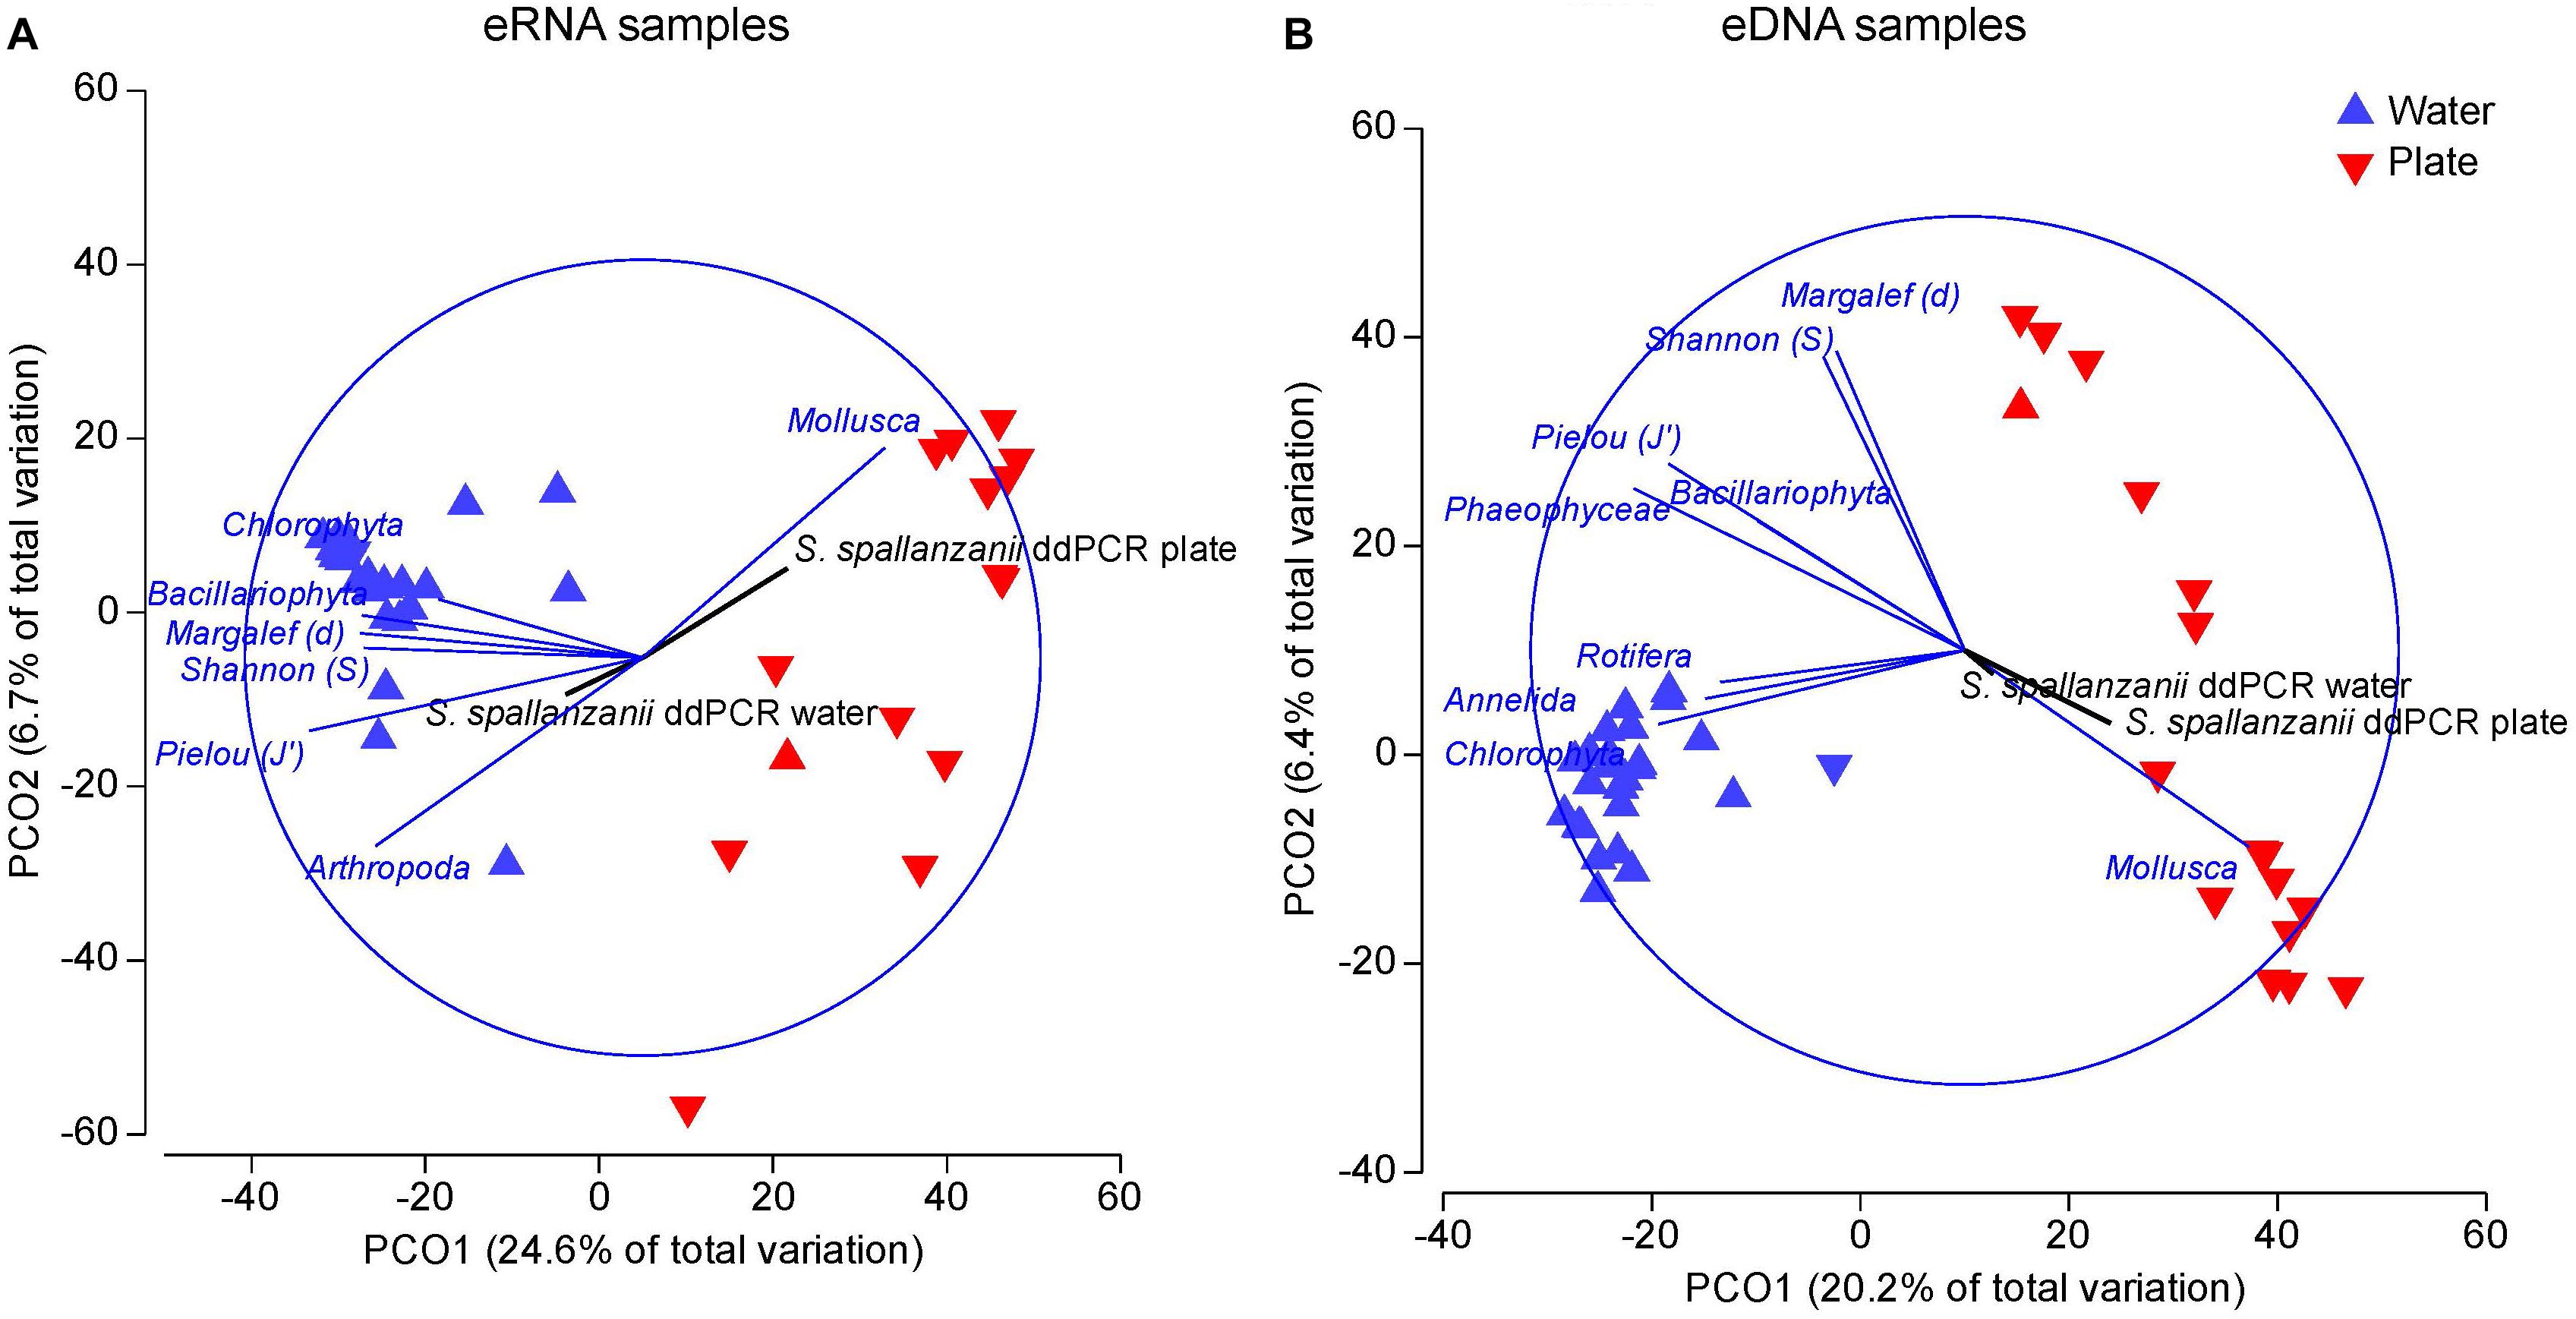
Figure 5. Principal coordinate (PCO) biplots generated from rarefied data of: (A) environmental RNA samples, and (B) environmental DNA samples. Overlaid vectors show phyla and alpha diversity parameters, those significantly correlating with either of the two primary axes are displayed (Pearson correlations > 0.5). Additionally, the corresponding S. spallanzanii droplet digital PCR copy numbers for water and plate samples were overlaid as vectors (black vectors).
The eDNA dataset (Figure 5B) formed two separate clusters for plate and water along the x-axis. Similar to the “eRNA” sample fraction, the plate data were dispersed along the y-axis, the lower samples correlating with Mollusca and S. spallanzanii ddPCR plate counts (Figure 5B). Chlorophyta, Annelida and Rotifera were strongly associated (Pearson r > 0.5) with the water samples. All alpha diversity vectors, Bacillariophyta and Phaeophyceae demonstrated opposite trend to the Mollusca and S. spallanzanii vectors, suggesting negative correlation with those variables.
The calculated alpha diversity parameters [Margalef’s species richness, Shannon diversity, and Pielou’s evenness index (Supplementary Table S2)] were compared to the corresponding ddPCR copy numbers for S. spallanzanii, to investigate the potential influence of sample background diversity on the target detectability. Relationships resulted in non-significant correlations for most comparisons between ddPCR copy numbers and Margalef’s species richness, Shannon diversity, as well as with Pielou’s evenness for both eDNA versus eRNA sample types (Table 1). However, eDNA ddPCR copy numbers for plate samples resulted in marginally negative correlations to Margalef’s species richness (p = 0.045) and Shannon diversity (p = 0.03) (Supplementary Figure S4).
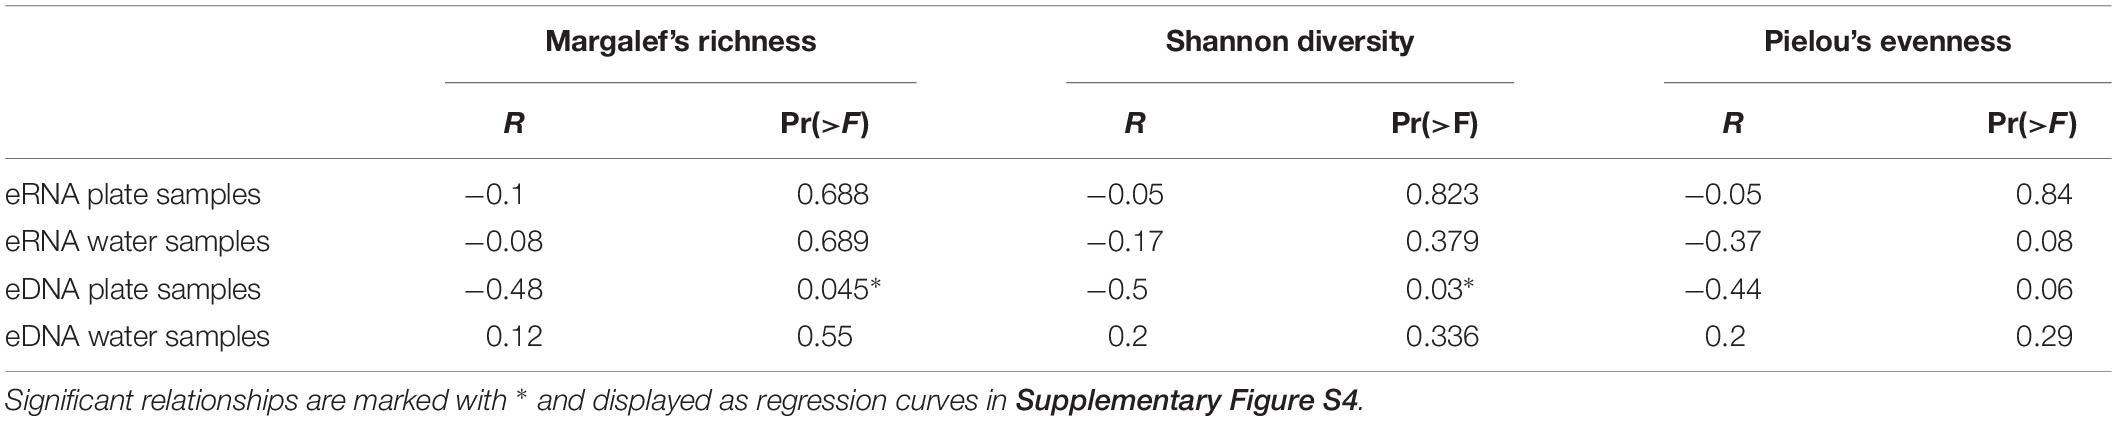
Table 1. Linear regressions between alpha diversity indices of the metabarcoding dataset and corresponding droplet digital PCR copy numbers for the RNA and DNA data and split between plate and water samples.
For the purposes of marine biosecurity surveillance discriminating between the detection of “legacy” signals and live organisms, for example when evaluating the success of an eradication program or compliance control, is preferable (Pochon et al., 2017; Zaiko et al., 2018). Since RNA is directly linked with active gene expression of metabolic pathways and deteriorates rapidly after cell death, it may be a better proxy for detecting “live” signals in environmental samples (Darling et al., 2017; Cristescu, 2019). However, cellular RNA production can vary enormously (over 3 orders of magnitude), largely due to varying transcription rates of ribosomal RNA (Fegatella et al., 1998). Additionally, working with RNA requires the conversion of RNA into cDNA which introduces additional costs and processing time. While ddPCR technology is particularly sensitive (Wood et al., 2019b), it is not immune to inhibition (Racki et al., 2014; Goldberg et al., 2016). The influence of community diversity and different sample matrices is still relatively unexplored (Zaiko et al., 2018).
The results from the present study yielded surprisingly low-level detections of S. spallanzanii, given that high density populations were present in close vicinity to the sampling sites. Usually high species density has been shown to correlate with increased DNA detections (Thomsen et al., 2012b; Pilliod et al., 2014; Jo et al., 2019).
A suite of factors may potentially explain the low eDNA and eRNA detections, such as insufficient sampling strategies or effort and PCR issues (Goldberg et al., 2016). For example, the 20 μm pre-filtering step used in the present study would likely prevent “free” extracellular eDNA/eRNA molecules from being appropriately collected apart from binding to other larger particles (Woods et al., 2018). On the other hand, this pre-filtering step allowed for a higher sample volume which has been shown to minimize false negative errors (Moyer et al., 2014). High intraspecific variations due to multiple sympatric invasions can lead to the failure of species-specific primers (Cowart et al., 2018). While new haplotypes might continuously arrive on transport vectors and contribute to intraspecific variation, genetic diversity among S. spallanzanii individuals has previously been found to be minimal (Ahyong et al., 2017). More likely is that the target species’ morphology, life cycle and peculiarities of the sampling matrix all potentially impact the availability and concentration of DNA or RNA molecules for detection (Sassoubre et al., 2016; Deiner et al., 2017). Cell shedding from S. spallanzanii’s fragile tentacle crown, and mucus or gametes released during several spawning events throughout the year, should both increase the amount of free-floating molecular material (Jute, 2015; Lacoursiere-Roussel et al., 2016). However, limited knowledge of species-specific eDNA/eRNA shedding rates and distribution patterns constrains our ability to infer the expected signal strength from environmental samples (Murakami et al., 2019).
This study showed that there is a relationship between the magnitude of eDNA signal and the likelihood of eRNA detection for both sampled matrices. The prediction threshold of approximately 400 eDNA copies may be used as a tentative indicator for inferring the presence of living S. spallanzanii population in the conditions tested in this study. Rapid and different degradation rates between RNA and DNA molecules may limit the detection success and prediction threshold (Thomsen et al., 2012a; Deutschmann et al., 2018). There is not much empirical information available on eRNA degradation in the marine environment, but it is assumed to degrade significantly faster than eDNA due to its more fragile chemical structure (Dowle et al., 2015; Guardiola et al., 2016; Laroche et al., 2016, 2017). A recent in situ study specifically on S. spallanzanii could trace DNA signals for up to 42 h, while RNA could not be recovered after 13 h of organism removal from the tank (Wood et al., in preparation). The decay rate is likely accelerated in natural settings depending on biotic and abiotic parameters (Dell’Anno and Corinaldesi, 2004). Unexpected observations showed a decline in specific eDNA degradation under increasing oxygen demand, chlorophyll and total eDNA, further highlighting the need to better understand these correlations (Barnes et al., 2014).
Another complexity is a lower RNA recovery rate for certain preservation and extraction procedures, which can yield as little as just 5% of the original concentration and should be tested individually for each study (Lebuhn et al., 2016). Better understanding of factors affecting detectability of molecular signals from different matrices is important for optimizing sampling strategies for targeted eDNA/eRNA-based surveillance and correctly interpreting the derived data in the biosecurity context. We recommend further controlled experiments to verify these thresholds under different environmental conditions (temperature, pH, UV exposure, etc.) and densities of the respective target organisms.
Most marine or freshwater studies that use eDNA for monitoring purposes currently focus on water as the preferred sample medium, as it provides a homogenously distributed sample matrix and can be concentrated relatively easily through filtration (Thomsen et al., 2012b; Rees et al., 2014; Smith, 2017) but contradicting opinions exist, e.g., Goldberg et al. (2016). Sampling other matrices such as sediments may reduce detection probability due to patchy distributions of target eDNA (Andersen et al., 2012) and overall lower spatial coverage due to restricted starting material afforded by current eDNA isolation methods. Sample type and volume have been shown to have a significant effect on recovered biodiversity but also on particular detections of certain organisms (Moyer et al., 2014; Nascimento et al., 2018). Sampling strategies need to be adapted toward the target species’ biological traits and life cycle (Rees et al., 2014; Furlan and Gleeson, 2017; Harper et al., 2018; Holman et al., 2019). Sabella spallanzanii has a very short free-swimming larval phase (2–3 weeks) but primarily lives attached to hard substrates, typical to invasive hull foulers (Lee et al., 2018). Tait et al. (2018) therefore used settlement plates to increase NIS detections by conventional morpho-taxonomical methods. A further possible value of plates for molecular surveillance is their potential to accumulate free floating debris and thus enrich eDNA concentrations over time. However, in the current study DNA- and RNA-based detections of S. spallanzanii were on average higher in the water samples than in those collected from the adjacent settlement plates. This may be due to the more rapid degradation of eDNA and eRNA on settlement plates due to high microbial activity in the biofilm communities (Jo et al., 2019). For example, Dell’Anno and Corinaldesi (2004) found accelerated DNA degradation rates in sediment compared to water. Alternatively, a high density of organisms and contaminants may lead to amplification biases and interfere with specific PCR signals from plate samples. Using a combination of sampling matrices to target living tissue and extracellular DNA is advisable especially given that varying habitats may reveal drastically distinct communities (Hayes et al., 2005; Hanfling et al., 2016; Port et al., 2016; Macher and Leese, 2017; Holman et al., 2019; Koziol et al., 2019). This is consistent with findings by Woods et al. (2018), who suggested that plate and water matrices might accumulate different amounts of “legacy” eDNA (i.e., non-viable biomaterial or extracellular DNA) and that the presence of specific organisms on plates (e.g., a high diversity of mollusks with calcified shells) may affect the sensitivity of the ddPCR assay through inhibition.
The high variation in ddPCR detections between sampling matrices, within replicates and among sampling times in the present study suggests that another variable such as the sampled community may be affecting the detection sensitivity of the assay. Metabarcoding was undertaken to further investigate the potential influence of these communities.
Metabarcoding is a promising tool for passive surveillance but often fails to detect rare taxa due to primer biases and variable (taxa- or sample-specific) amplification efficiency (Valentini et al., 2016). This might be the case in the present study, where S. spallanzanii was not detected at a species-level using the “universal” COI primers, although known to be obtained from complex environmental samples in other studies using the same primer set (Ammon et al., 2018). This underlines again the importance of a targeted molecular approach when a certain species needs to be detected for biosecurity surveillance purposes (Wood et al., 2019a).
Higher numbers of ASVs corresponding to potential a priori legacy eDNA were identified on settlement plates compared to water samples and consisted mainly of calcifying taxa such as mollusks. Contradictory to the inhibition assumption (Woods et al., 2018), S. spallanzanii ddPCR signals of plate samples were strongly associated with these mollusks. This could be the result of extracellular DNA accumulating on rough surfaces of the calcifying organisms, and possibly binding to other inorganic/organic particles. Nevertheless, we observed that overall higher ddPCR signals were achieved in water samples. A potential inhibition effect through the sampled communities especially the “living” target signal needs further investigation.
Significant negative correlations between eDNA ddPCR signals with diversity indices for plate samples suggested that the biofouling communities likely impede ddPCR based detections of S. spallanzanii. In simple terms, there were lower ddPCR detections when the plates’ diversity was high. The strength of the negative relationship appeared to be driven by the presence of a whole range of taxa in combination and, surprisingly, anti-correlated with the abundance of mollusks. Induced ddPCR inhibition due to, for example, the high calcium content of their shells can therefore not be confirmed in this study (Racki et al., 2014).
More empirical evidence is needed on the inhibitive effect of specific taxa throughout the workflow of the species-specific assay (preservation-extraction-amplification). A larger dataset with more replicated samples to account for (small scale) spatio-temporal variation is advisable (Macher and Leese, 2017) as ddPCR tended to return a considerable number of samples with zero copy which weakened the correlations. This is particularly important because false negative detections cannot be differentiated from an actual negative result. Including positive controls in the form of the targets’ specific DNA among the different steps of sampling and laboratory workflows can add valuable information on quantitative loss for further identifying the source of inhibition errors (Furlan and Gleeson, 2017).
Efforts to control the spread of invasive species requires a detailed understanding of their distribution and life cycle, and thus efficient detection methods are critical. The present study revealed relatively low overall ddPCR detection levels of the targeted organism S. spallanzanii despite the presence of abundant populations. The study revealed an overall higher ddPCR sensitivity for DNA detection signals as well as significant relationships between DNA and RNA detections. Water samples generally led to the detection of higher DNA and RNA copy numbers compared to settlement plate samples, and a signal of approximately 400 COI DNA copy numbers was considered as the minimum threshold for detecting putatively living S. spallanzanii individuals from both environmental matrices. Metabarcoding analyses indicated that the scale of species diversity did not influence the detection sensitivity of ddPCR in the different sample types, except for eDNA copy numbers on plate samples which significantly decreased with higher diversity estimates. However, the presence of mollusks was highly associated with S. splallanzanii detections. Collectively, these findings supported the use of environmental DNA as a reliable predictor for the detection of the living fraction of the marine invasive species S. spallanzanii. This study contributes to our understanding of environmental DNA and RNA release, distribution and detection in marine environments, and will benefit surveillance programs aiming to apply routine molecular detection of marine non-indigenous species.
Sequences have been deposited in the NCBI’s Sequence Read Archive under BioProject ID PRJNA 555091, sample accession SAMN 12291989-2081.
UA, SW, AZ, SL, GI, and XP conceived and designed the experiments. UA performed the experiments. UA and OL analyzed the data. UA, SW, OL, AZ, and XP contributed to the reagents, materials, and analysis tools. UA, SW, and XP wrote the manuscript. UA, SW, OL, AZ, SL, GI, and XP reviewed the manuscript drafts.
This work was funded by the New Zealand Ministry for Business, Innovation and Employment Strategic Science Investment Fund under NIWA Coasts and Oceans Research Programme 6, Marine Biosecurity (2017/18 SCI) and Ministry for Primary Industries’ Operational Research Project RFP16696 – Settlement Arrays and the University of Auckland’s Sustainability Research Award.
The authors declare that the research was conducted in the absence of any commercial or financial relationships that could be construed as a potential conflict of interest.
The authors thank Matt Smith, Keren Spong, Jaret Bilewitch, and Judy Sutherland (the National Institute of Water and Atmospheric Research, NIWA) for hosting UA during the experiment and analysis using the ddPCR, and Mike Bunce and Matthew Power (TrEnD Laboratory at Curtin University, Perth) for their help with sequencing, and Behzad Farokhi (The University of Auckland) for field assistance. The Viaduct Auckland Marina is acknowledged for allowing access to the field site.
The Supplementary Material for this article can be found online at: https://www.frontiersin.org/articles/10.3389/fmars.2019.00621/full#supplementary-material
Ahyong, S. T., Kupriyanova, E., Burghardt, I., Sun, Y., Hutchings, P. A., Capa, M., et al. (2017). Phylogeography of the invasive mediterranean fan worm, Sabella spallanzanii (Gmelin, 1791), in australia and new zealand. J. Mar. Biol. Assoc. U. K. 97, 985–991. doi: 10.1017/s0025315417000261
Amir, A., McDonald, D., Navas-Molina, J. A., Kopylova, E., Morton, J. T., Zech Xu, Z., et al. (2017). Deblur rapidly resolves single-nucleotide community sequence patterns. mSystems 2:e00191-16. doi: 10.1128/mSystems.00191-16
Ammon, U. V., Wood, S. A., Laroche, O., Zaiko, A., Tait, L., Lavery, S., et al. (2018). Combining morpho-taxonomy and metabarcoding enhances the detection of non-indigenous marine pests in biofouling communities. Sci. Rep. 8:16290. doi: 10.1038/s41598-018-34541-1
Andersen, K., Bird, K. L., Rasmussen, M., Haile, J., Breuning-Madsen, H., Kjaer, K. H., et al. (2012). Meta-barcoding of ‘dirt’. DNA from soil reflects vertebrate biodiversity. Mol. Ecol. 21, 1966–1979. doi: 10.1111/j.1365-294X.2011.05261.x
Aylagas, E., Borja, A., and Rodriguez-Ezpeleta, N. (2014). Environmental status assessment using DNA metabarcoding: towards a genetics based Marine Biotic Index (gAMBI). PLoS One 9:e90529. doi: 10.1371/journal.pone.0090529
Aylagas, E., Borja, Á, Muxika, I., and Rodríguez-Ezpeleta, N. (2018). Adapting metabarcoding-based benthic biomonitoring into routine marine ecological status assessment networks. Ecol. Ind. 95, 194–202. doi: 10.1016/j.ecolind.2018.07.044
Baker, C. S., Steel, D., Nieukirk, S., and Klinck, H. (2018). Environmental DNA (eDNA) from the wake of the whales: droplet digital PCR for detection and species identification. Front. Mar. Sci. 5:133. doi: 10.3389/fmars.2018.00133
Barnes, M. A., Turner, C. R., Jerde, C. L., Renshaw, M. A., Chadderton, W. L., and Lodge, D. M. (2014). Environmental conditions influence eDNA persistence in aquatic systems. Environ. Sci. Technol. 48, 1819–1827. doi: 10.1021/es404734p
Bax, N., Williamson, A., Aguero, M., Gonzalez, E., and Geeves, W. (2003). Marine invasive alien species: a threat to global biodiversity. Mar. Policy 27, 313–323. doi: 10.1016/s0308-597x(03)00041-1
Bell, K. L., Burgess, K. S., Botsch, J. C., Dobbs, E. K., Read, T. D., and Brosi, B. J. (2018). Quantitative and qualitative assessment of pollen DNA metabarcoding using constructed species mixtures. Mol. Ecol. 28, 431–455. doi: 10.1111/mec.14840
Bista, I., Carvalho, G. R., Tang, M., Walsh, K., Zhou, X., Hajibabaei, M., et al. (2018). Performance of amplicon and shotgun sequencing for accurate biomass estimation in invertebrate community samples. Mol. Ecol. Res. 18, 1020–1034. doi: 10.1111/1755-0998.12888
Brown, E. A., Chain, F. J. J., Zhan, A., MacIsaac, H. J., Cristescu, M. E., and Lowe, A. (2016). Early detection of aquatic invaders using metabarcoding reveals a high number of non-indigenous species in Canadian ports. Divers. Distribut. 22, 1045–1059. doi: 10.1111/ddi.12465
Caporaso, J. G., Kuczynski, J., Stombaugh, J., Bittinger, K., Bushman, F. D., Costello, E. K., et al. (2010). QIIME allows analysis of high-throughput community sequencing data. Nat. Methods 7, 335–336. doi: 10.1038/nmeth.f.303
Coordinators, N. R. (2017). Database resources of the national center for biotechnology information. Nucleic Acids Res. 45, D12–D17. doi: 10.1093/nar/gkw1071
Cowart, D. A., Renshaw, M. A., Gantz, C. A., Umek, J., Chandra, S., Egan, S. P., et al. (2018). Development and field validation of an environmental DNA (eDNA) assay for invasive clams of the genus Corbicula. Manag. Biol. Invas. 9, 27–37. doi: 10.3391/mbi.2018.9.1.03
Cristescu, M. E. (2019). Can environmental RNA revolutionize biodiversity science? Trends Ecol. Evol. 34, 694–697. doi: 10.1016/j.tree.2019.05.003
Cristescu, M. E., and Hebert, P. D. (2018). Uses and misuses of environmental DNA in biodiversity science and conservation. Ann. Rev. Ecol. Evol. Syst. 49, 209–230. doi: 10.1146/annurev-ecolsys-110617062306
Currie, D. R., McArthur, M. A., and Cohen, B. F. (2000). Reproduction and distribution of the invasive European fanworm Sabella spallanzanii (Polychaeta: Sabellidae) in port phillip bay. victoria, Australia. Mar. Biol. 136, 645–656. doi: 10.1007/s002270050724
Darling, J. A., Galil, B. S., Carvalho, G. R., Rius, M., Viard, F., and Piraino, S. (2017). Recommendations for developing and applying genetic tools to assess and manage biological invasions in marine ecosystems. Mar. Policy 85, 54–64. doi: 10.1016/j.marpol.2017.08.014
Deiner, K., Bik, H. M., Machler, E., Seymour, M., Lacoursiere-Roussel, A., Altermatt, F., et al. (2017). Environmental DNA metabarcoding: transforming how we survey animal and plant communities. Mol. Ecol. 26, 5872–5895. doi: 10.1111/mec.14350
Dell’Anno, A., and Corinaldesi, C. (2004). Degradation and turnover of extracellular DNA in marine sediments: ecological and methodological considerations. Appl. Environ. Microbiol. 70, 4384–4386. doi: 10.1128/AEM.70.7.4384-4386.2004
Deutschmann, B., Muller, A. K., Hollert, H., and Brinkmann, M. (2018). Assessing the fate of brown trout (Salmo trutta) environmental DNA in a natural stream using a sensitive and specific dual-labelled probe. Sci. Total Environ. 655, 321–327. doi: 10.1016/j.scitotenv.2018.11.247
Doi, H., Takahara, T., Minamoto, T., Matsuhashi, S., Uchii, K., and Yamanaka, H. (2015). Droplet digital polymerase chain reaction (PCR) outperforms real-time PCR in the detection of environmental DNA from an invasive fish species. Environ. Sci. Technol. 49, 5601–5608. doi: 10.1021/acs.est.5b00253
Dowle, E., Pochon, X., Keeley, N., and Wood, S. A. (2015). Assessing the effects of salmon farming seabed enrichment using bacterial community diversity and high-throughput sequencing. FEMS Microbiol. Ecol. 91:fiv089. doi: 10.1093/femsec/fiv089
Fegatella, F., Lim, J., Kjelleberg, S., and Cavicchioli, R. (1998). Implications of rRNA operon copy number and ribosome content in the marine oligotrophic ultramicrobacterium Sphingomonas sp. strain RB2256. Appl. Environ. Microbiol. 64, 4433–4438.
Fletcher, L. M. (2014). Background Information on the Mediterranean Fanworm Sabella Spallanzanii to Support Regional Response Decision. Cawthron Report no 2479A, Zelson, Cawthron Institute.
Furlan, E. M., and Gleeson, D. (2017). Improving reliability in environmental DNA detection surveys through enhanced quality control. Mar. Freshwater Res. 68:388. doi: 10.1071/mf15349
Goldberg, C. S., Turner, C. R., Deiner, K., Klymus, K. E., Thomsen, P. F., Murphy, M. A., et al. (2016). Critical considerations for the application of environmental DNA methods to detect aquatic species. Methods Ecol. Evol. 7, 1299–1307. doi: 10.1111/2041-210x.12595
Guardiola, M., Wangensteen, O. S., Taberlet, P., Coissac, E., Uriz, M. J., and Turon, X. (2016). Spatio-temporal monitoring of deep-sea communities using metabarcoding of sediment DNA and RNA. PeerJ 4:e2807. doi: 10.7717/peerj.2807
Hanfling, B., Lawson Handley, L., Read, D. S., Hahn, C., Li, J., Nichols, P., et al. (2016). Environmental DNA metabarcoding of lake fish communities reflects long-term data from established survey methods. Mol. Ecol. 25, 3101–3119. doi: 10.1111/mec.13660
Harper, L. R., Lawson Handley, L., Hahn, C., Boonham, N., Rees, H. C., Gough, K. C., et al. (2018). Needle in a haystack? A comparison of eDNA metabarcoding and targeted qPCR for detection of the great crested newt (Triturus cristatus). Ecol. Evol. 8, 6330–6341. doi: 10.1002/ece3.4013
Hayes, K. R., Cannon, R., Neil, K., and Inglis, G. (2005). Sensitivity and cost considerations for the detection and eradication of marine pests in ports. Mar. Poll. Bull. 50, 823–834. doi: 10.1016/j.marpolbul.2005.02.032
Hewitt, C. L., Everett, R. A., and Parker, N. (2009). “Examples of current international, regional and national regulatory frameworks for preventing and managing marine bioinvasions,” in Biological Invasions in Marine Ecosystems: Ecological, Management, and Geographic Perspectives, eds G. Rilov and J. A. Crooks (Berlin: Springer), 335–352. doi: 10.1007/978-3-540-79236-9_19
Hewitt, C. L., Willing, J., Bauckham, A., Cassidy, A. M., Cox, C. M. S., Jones, L., et al. (2004). New Zealand marine biosecurity: delivering outcomes in a fluid environment. New Zealand J. Mar. Freshwater Res. 38, 429–438. doi: 10.1080/00288330.2004.9517250
Holman, L. E., de Bruyn, M., Creer, S., Carvalho, G., Robidart, J., and Rius, M. (2019). Detection of introduced and resident marine species using environmental DNA metabarcoding of sediment and water. Sci. Rep. 9:11559. doi: 10.1038/s41598-019-47899-7
Inglis, G., Hurren, H., Gust, N., Oldman, J., Fitridge, I., Floerl, O., et al. (2005). Surveillance design for early detection of unwanted exotic marine organisms in new zealand. Paper Presented at the Biosecurity New Zealand, New Zealand.
Inglis, G. J., Floerl, O., Seaward, K., Woods, C., Read, G., and Peacock, L. (2009). Sabella Local Elimination Programme - Phase 1. Final Assess. Report Prepared for MAF Biosecurity NZ Research Project MAF 11199. Christchurch: NIWA.
Inglis, G. J., Woods, C., Willis, K., Read, G., and Seaward, K. (2008). Incursion Response to the Mediterranean Fanworm, Sabella spallanzanii (Gmelin, 1791), in the Port of Lyttelton - Interim Measures. NIWA Client Report no: CHC2008-141. New Zealand: MAF-Biosecurity New Zealand.
Jo, T., Murakami, H., Yamamoto, S., Masuda, R., and Minamoto, T. (2019). Effect of water temperature and fish biomass on environmental DNA shedding, degradation, and size distribution. Ecol. Evol. 9, 1135–1146. doi: 10.1002/ece3.4802
Jute, A. (2015). An Investigation of the Marine Invasive Species Sabella spallanzanii (Gemlin, 1791) the Mediterranean Fanworm at five Auckland Marinas. Master of Science thesis, Auckland: The University of Auckland.
Keeley, N., Wood, S. A., and Pochon, X. (2018). Development and preliminary validation of a multi-trophic metabarcoding biotic index for monitoring benthic organic enrichment. Ecol. Indic. 85, 1044–1057. doi: 10.1016/j.ecolind.2017.11.014
Koziol, A., Stat, M., Simpson, T., Jarman, S., DiBattista, J. D., Harvey, E. S., et al. (2019). Environmental DNA metabarcoding studies are critically affected by substrate selection. Mol. Ecol. Res. 19, 366–376. doi: 10.1111/1755-0998.12971
Lacoursiere-Roussel, A., Rosabal, M., and Bernatchez, L. (2016). Estimating fish abundance and biomass from eDNA concentrations: variability among capture methods and environmental conditions. Mol. Ecol. Res. 16, 1401–1414. doi: 10.1111/1755-0998.12522
Langlet, D., Geslin, E., Baal, C., Metzger, E., Lejzerowicz, F., Riedel, B., et al. (2013). Foraminiferal survival after long-term in situ experimentally induced anoxia. Biogeosciences 10, 7463–7480. doi: 10.5194/bg-10-7463-2013
Laroche, O., Pochon, X., Tremblay, L. A., Ellis, J. I., Lear, G., and Wood, S. A. (2018). Incorporating molecular-based functional and co-occurrence network properties into benthic marine impact assessments. FEMS Microbiol. Ecol. 94, doi: 10.1093/femsec/fiy167
Laroche, O., Wood, S. A., Tremblay, L. A., Ellis, J. I., Lejzerowicz, F., Pawlowski, J., et al. (2016). First evaluation of foraminiferal metabarcoding for monitoring environmental impact from an offshore oil drilling site. Mar. Environ. Res. 120, 225–235. doi: 10.1016/j.marenvres.2016.08.009
Laroche, O., Wood, S. A., Tremblay, L. A., Lear, G., Ellis, J. I., and Pochon, X. (2017). Metabarcoding monitoring analysis: the pros and cons of using co-extracted environmental DNA and RNA data to assess offshore oil production impacts on benthic communities. PeerJ 5:e3347. doi: 10.7717/peerj.3347
Lebuhn, M., Derenko, J., Rademacher, A., Helbig, S., Munk, B., Pechtl, A., et al. (2016). DNA and RNA extraction and quantitative real-time PCR-based assays for biogas biocenoses in an interlaboratory comparison. Bioengineering 3, E7. doi: 10.3390/bioengineering3010007
Lee, A. L., Dafforn, K. A., Hutchings, P. A., and Johnston, E. L. (2018). Reproductive strategy and gamete development of an invasive fanworm, Sabella spallanzanii (Polychaeta: Sabellidae), a field study in Gulf St Vincent, South Australia. PLoS One 13:e0200027. doi: 10.1371/journal.pone.0200027
Leray, M., Yang, J. Y., Meyer, C. P., Mills, S. C., Agudelo, N., Ranwez, V., et al. (2013). A new versatile primer set targeting a short fragment of the mitochondrial COI region for metabarcoding metazoan diversity: application for characterizing coral reef fish gut contents. Front. Zool. 10:34. doi: 10.1186/1742-9994-10-34
Lindahl, T. (1993). Instability and decay of the primary structure of DNA. Nature 362, 709–715. doi: 10.1038/362709a0
Macher, J.-N., and Leese, F. (2017). Environmental DNA metabarcoding of rivers: not all eDNA is everywhere, and not all the time. bioRxiv doi: 10.1101/164046
Machida, R. J., Leray, M., Ho, S. L., and Knowlton, N. (2017). Metazoan mitochondrial gene sequence reference datasets for taxonomic assignment of environmental samples. Sci. Data 4:170027. doi: 10.1038/sdata.2017.27
McMurdie, P. J., and Holmes, S. (2013). phyloseq: an R package for reproducible interactive analysis and graphics of microbiome census data. PLoS One 8:e61217. doi: 10.1371/journal.pone.0061217
Morgulis, A., Coulouris, G., Raytselis, Y., Madden, T. L., Agarwala, R., and Schaffer, A. A. (2008). Database indexing for production MegaBLAST searches. Bioinformatics 24, 1757–1764. doi: 10.1093/bioinformatics/btn322
Moyer, G. R., Diaz-Ferguson, E., Hill, J. E., and Shea, C. (2014). Assessing environmental DNA detection in controlled lentic systems. PLoS One 9:e103767. doi: 10.1371/journal.pone.0103767
Murakami, H., Yoon, S., Kasai, A., Minamoto, T., Yamamoto, S., Sakata, M. K., et al. (2019). Dispersion and degradation of environmental DNA from caged fish in a marine environment. Fisher. Sci. 85, 327–337. doi: 10.1007/s12562-018-1282-6
Nascimento, F. J. A., Lallias, D., Bik, H. M., and Creer, S. (2018). Sample size effects on the assessment of eukaryotic diversity and community structure in aquatic sediments using high-throughput sequencing. Sci. Rep. 8:11737. doi: 10.1038/s41598-018-30179-1
Nathan, L. M., Simmons, M., Wegleitner, B. J., Jerde, C. L., and Mahon, A. R. (2014). Quantifying environmental DNA signals for aquatic invasive species across multiple detection platforms. Environ. Sci. Technol. 48, 12800–12806. doi: 10.1021/es5034052
Ojaveer, H., Galil, B. S., Carlton, J. T., Alleway, H., Goulletquer, P., Lehtiniemi, M., et al. (2018). Historical baselines in marine bioinvasions: implications for policy and management. PLoS One 13:e0202383. doi: 10.1371/journal.pone.0202383
Oliveros, J.C (2007-2015)Venny An Interactive Tool for Comparing Lists with Venn’s Diagrams Available at: http://bioinfogp.cnb.csic.es/tools/venny/index.html (accessed Septermber 1, 2018).
Parry, G. D., Hobday, D. K., Currie, D. R., Officer, R. A., and Gason, A. S. (1995). The Distribution, Abundance and Diets of Demersal Fish in Port Phillip Bay. CSIRO Port Phillip Bay Environmental Study. Technical Report No 21. Canberra: CSIRO.
Pawlowski, J., Lejzerowicz, F., Apotheloz-Perret-Gentil, L., Visco, J., and Esling, P. (2016). Protist metabarcoding and environmental biomonitoring: time for change. Eur. J. Protistol. 55(Pt A), 12–25. doi: 10.1016/j.ejop.2016.02.003
Pilliod, D. S., Goldberg, C. S., Arkle, R. S., and Waits, L. P. (2014). Factors influencing detection of eDNA from a stream-dwelling amphibian. Mol. Ecol. Res. 14, 109–116. doi: 10.1111/1755-0998.12159
Pochon, X., Zaiko, A., Fletcher, L. M., Laroche, O., and Wood, S. A. (2017). Wanted dead or alive? using metabarcoding of environmental DNA and RNA to distinguish living assemblages for biosecurity applications. PLoS One 12:e0187636. doi: 10.1371/journal.pone.0187636
Port, J. A., O’Donnell, J. L., Romero-Maraccini, O. C., Leary, P. R., Litvin, S. Y., Nickols, K. J., et al. (2016). Assessing vertebrate biodiversity in a kelp forest ecosystem using environmental DNA. Mol. Ecol. 25, 527–541. doi: 10.1111/mec.13481
Racki, N., Dreo, T., Gutierrez-Aguirre, I., Blejec, A., and Ravnikar, M. (2014). Reverse transcriptase droplet digital PCR shows high resilience to PCR inhibitors from plant, soil and water samples. Plant Methods 10, 42. doi: 10.1186/s13007-014-0042-6
Ratnasingham, S., and Hebert, P. D. N. (2007). BOLD : the barcode of life data system (www.barcodinglife.org). Mol. Ecol. Notes 7, 355–364. doi: 10.1111/j.1471-8286.2006.01678.x
Read, G., Inglis, G., Stratford, P., and Ahyong, S. (2011). Arrival of the alien fanworm Sabella spallanzanii (Gmelin, 1791) (Polychaeta: Sabellidae) in two New Zealand harbours. Aquatic Invasions 6, 273–279. doi: 10.3391/ai.2011.6.3.04
Rees, H. C., Maddison, B. C., Middleditch, D. J., Patmore, J. R. M., Gough, K. C., and Crispo, E. (2014). Review: the detection of aquatic animal species using environmental DNA - a review of eDNA as a survey tool in ecology. J. Appl. Ecol. 51, 1450–1459. doi: 10.1111/1365-2664.12306
R Core Team (2017). R: A language and environment for statistical computing. Available at: https://www.R-project.org/
Robin, X., Turck, N., Hainard, A., Tiberti, N., Lisacek, F., Sanchez, J.-C., et al. (2011). pROC: an open-source package for R and S+ to analyze and compare ROC curves. BMC Bioinformatics 12:77. doi: 10.1186/1471-2105-12-77
Sassoubre, L. M., Yamahara, K. M., Gardner, L. D., Block, B. A., and Boehm, A. B. (2016). Quantification of environmental DNA (eDNA) shedding and decay rates for three marine fish. Environ. Sci. Technol. 50, 10456–10464. doi: 10.1021/acs.est.6b03114
Smith, L. (2017). Biodiversity Monitoring Using Environmental DNA: CAN it Detect All Fish Species in a Waterbody and is it Cost Effective for Routine Monitoring? Master thesis, Edith Cowan University, Perth, WA.
Stabili, L., Licciano, M., Giangrande, A., Fanelli, G., and Cavallo, R. A. (2006). Sabella spallanzanii filter-feeding on bacterial community: ecological implications and applications. Mar. Environ. Res. 61, 74–92. doi: 10.1016/j.marenvres.2005.06.001
Stat, M., Huggett, M. J., Bernasconi, R., DiBattista, J. D., Berry, T. E., Newman, S. J., et al. (2017). Ecosystem biomonitoring with eDNA: metabarcoding across the tree of life in a tropical marine environment. Sci. Rep. 7:12240. doi: 10.1038/s41598-017-12501-5
Stoeck, T., Frühe, L., Forster, D., Cordier, T., Martins, C. I. M., and Pawlowski, J. (2018). Environmental DNA metabarcoding of benthic bacterial communities indicates the benthic footprint of salmon aquaculture. Mar. Poll. Bull. 127, 139–149. doi: 10.1016/j.marpolbul.2017.11.065
Strickler, K. M., Fremier, A. K., and Goldberg, C. S. (2015). Quantifying effects of UV-B, temperature, and pH on eDNA degradation in aquatic microcosms. Biol. Conserv. 183, 85–92. doi: 10.1016/j.biocon.2014.11.038
Taberlet, P., Bonin, A., Zinger, L., and Coissac, E. (2018). Environmental DNA: For Biodiversity Research and Monitoring. Oxford: Oxford University Press.
Tait, L., Inglis, G., and Seaward, K. (2018). Enhancing passive sampling tools for detecting marine bioinvasions. Mar. Poll. Bull. 128, 41–50. doi: 10.1016/j.marpolbul.2018.01.015
Tanabe, A. S., Nagai, S., Hida, K., Yasuike, M., Fujiwara, A., Nakamura, Y., et al. (2016). Comparative study of the validity of three regions of the 18S-rRNA gene for massively parallel sequencing-based monitoring of the planktonic eukaryote community. Mol. Ecol. Res. 16, 402–414. doi: 10.1111/1755-0998.12459
Thomsen, P. F., Kielgast, J., Iversen, L. L., Moller, P. R., Rasmussen, M., and Willerslev, E. (2012a). Detection of a diverse marine fish fauna using environmental DNA from seawater samples. PLoS One 7:e41732. doi: 10.1371/journal.pone.0041732
Thomsen, P. F., Kielgast, J., Iversen, L. L., Wiuf, C., Rasmussen, M., Gilbert, M. T., et al. (2012b). Monitoring endangered freshwater biodiversity using environmental DNA. Mol. Ecol. 21, 2565–2573. doi: 10.1111/j.1365-294X.2011.05418.x
Valentini, A., Taberlet, P., Miaud, C., Civade, R., Herder, J., Thomsen, P. F., et al. (2016). Next-generation monitoring of aquatic biodiversity using environmental DNA metabarcoding. Mol. Ecol. 25, 929–942. doi: 10.1111/mec.13428
Wangensteen, O. S., Palacín, C., Guardiola, M., and Turon, X. (2018). DNA metabarcoding of littoral hard-bottom communities: high diversity and database gaps revealed by two molecular markers. PeerJ 6:e4705. doi: 10.7717/peerj.4705
Wood, S. A., Pochon, X., Ming, W., von Ammon, U., Woods, C., Carter, M., et al. (2019a). Considerations for incorporating real-time PCR assays into routine marine biosecurity surveillance programmes: a case study targeting the Mediterranean fanworm (Sabella spallanzanii) and club tunicate (Styela clava). Genome 62, 137–146. doi: 10.1139/gen-2018-0021
Wood, S. A., Pochon, X., Laroche, O., von Ammon, U., Adamson, J., and Zaiko, A. (2019b). A comparison of droplet digital polymerase chain reaction (PCR), quantitative PCR and metabarcoding for species-specific detection in environmental DNA. Mol. Ecol. Res. doi: 10.1111/1755-0998.13055 [Epub ahead of print].
Wood, S. A., Smith, K. F., Banks, J. C., Tremblay, L. A., Rhodes, L., Mountfort, D., et al. (2013). Molecular genetic tools for environmental monitoring of New Zealand’s aquatic habitats, past, present and the future. New Zealand J. Mar. Freshwater Res. 47, 90–119. doi: 10.1080/00288330.2012.745885
Wood, S. A., Zaiko, A., Richter, I., Inglis, G. J., and Pochon, X. (2017). Development of a real-time polymerase chain reaction assay for the detection of the invasive Mediterranean fanworm, Sabella spallanzanii, in environmental samples. Environ. Sci. Poll. Res. Int. 24, 17373–17382. doi: 10.1007/s11356-017-9357-y
Woods, C., Seaward, K., Pryor-Rodgers, L., and Inglis, G. (2018). Marine high risk site surveillance programme. annual synopsis report for all high risk sites 2017–18 (sow18048). MPI Technical Paper No 201. Wellington: Ministry for Primary Industries, 209.
Keywords: metabarcoding, droplet digital PCR, environmental DNA, environmental RNA, Sabella spallanzanii, non-indigenous species
Citation: von Ammon U, Wood SA, Laroche O, Zaiko A, Lavery SD, Inglis GJ and Pochon X (2019) Linking Environmental DNA and RNA for Improved Detection of the Marine Invasive Fanworm Sabella spallanzanii. Front. Mar. Sci. 6:621. doi: 10.3389/fmars.2019.00621
Received: 09 July 2019; Accepted: 20 September 2019;
Published: 15 October 2019.
Edited by:
Ciro Rico, The University of the South Pacific, FijiReviewed by:
Laurence J. Clarke, Antarctic Climate and Ecosystems Cooperative Research Centre, AustraliaCopyright © 2019 von Ammon, Wood, Laroche, Zaiko, Lavery, Inglis and Pochon. This is an open-access article distributed under the terms of the Creative Commons Attribution License (CC BY). The use, distribution or reproduction in other forums is permitted, provided the original author(s) and the copyright owner(s) are credited and that the original publication in this journal is cited, in accordance with accepted academic practice. No use, distribution or reproduction is permitted which does not comply with these terms.
*Correspondence: Ulla von Ammon, dWxsYS5hbW1vbkBjYXd0aHJvbi5vcmcubno=
Disclaimer: All claims expressed in this article are solely those of the authors and do not necessarily represent those of their affiliated organizations, or those of the publisher, the editors and the reviewers. Any product that may be evaluated in this article or claim that may be made by its manufacturer is not guaranteed or endorsed by the publisher.
Research integrity at Frontiers
Learn more about the work of our research integrity team to safeguard the quality of each article we publish.