
94% of researchers rate our articles as excellent or good
Learn more about the work of our research integrity team to safeguard the quality of each article we publish.
Find out more
ORIGINAL RESEARCH article
Front. Mar. Sci., 16 July 2019
Sec. Marine Molecular Biology and Ecology
Volume 6 - 2019 | https://doi.org/10.3389/fmars.2019.00373
 Kevan M. Yamahara1*
 Christina M. Preston1
 James Birch1
 Kristine Walz1
 Roman Marin III1
 Scott Jensen1Douglas Pargett1Brent Roman1
 William Ussler III1
 Yanwu Zhang1
 John Ryan1Brett Hobson1Brian Kieft1Ben Raanan1
 Kelly D. Goodwin2
 Francisco P. Chavez1
 Christopher Scholin1
Environmental DNA (eDNA) can be used to identify macroorganisms and describe biodiversity, and thus has promise to supplement biological monitoring in marine ecosystems. Despite this promise, scaling sample acquisition to the spatial and temporal scales needed for effective monitoring would require prohibitively large investments in time and human resources. To address this challenge, we evaluated the efficacy of an autonomous eDNA sampling system and compare results obtained to traditional eDNA sampling methods. The autonomous sampling instrument consisted of the Environmental Sample Processor (ESP) coupled to an autonomous underwater vehicle (AUV). We tested equivalency between the ESP and traditional eDNA sampling techniques by comparing the quantification of eDNA across a broad range of taxa, from microbes (SAR11), phytoplankton (Pseudo-nitzschia spp.), and invertebrates (krill: Euphausia pacifica) to vertebrates (anchovy: Engraulis mordax). No significant differences in eDNA densities were observed between the two sample collection and filtration methods. eDNA filters collected by the ESP were preserved and stable for 21 days, the typical deployment length of the instrumentation. Finally, we demonstrated the unique capabilities of an autonomous, mobile ESP during a deployment near Monterey Bay, CA, by remotely and repeatedly sampling a water mass over 12 h. The development of a mobile ESP demonstrates the promise of utilizing eDNA measurements to observe complex biological processes in the ocean absent a human presence.
Management and conservation efforts aimed at protecting marine organisms and ecosystem function require observing species assemblages over long periods of time and over large areas (Pereira et al., 2013; Miloslavich et al., 2018; Muller-Karger et al., 2018). Traditional monitoring approaches are often reliant on ships, human observers, and combinations of direct sampling (water, nets, fishing) and tagging of individual animals. These methods require trained individuals and can be destructive (Jones, 1992; Hopkins and Freckleton, 2002; Wheeler et al., 2004). An intriguing approach for reducing the costs and impacts of traditional biomonitoring surveillance is through the collection and analysis of environmental DNA (eDNA; Ficetola et al., 2008; Thomsen et al., 2012; Bohmann et al., 2014; Goldberg et al., 2015; Thomsen and Willerslev, 2015; Hoffmann et al., 2016; Evans et al., 2017). Here, we explored the use of an autonomous sampling system fitted to an autonomous underwater vehicle (AUV) to determine if eDNA collections can be enhanced beyond what is currently possible using traditional marine eDNA sample collection and processing methods alone.
Environmental DNA comprises all sources of DNA (eukaryal, bacterial, archaeal, and viral) that can be recovered from a native sample (e.g., seawater, freshwater, sediments, soils, and air; Thomsen and Willerslev, 2015; Deiner et al., 2017; Taberlet et al., 2018). Biological monitoring utilizing eDNA in aquatic environments have applied both active (targeted) and passive surveillance techniques (Simmons et al., 2015). In marine systems, active surveillance has been utilized for monitoring invasive species or rare organisms of conservation concern with quantitative or digital PCR, such as white sharks (Lafferty et al., 2018), killer whales (Baker et al., 2018), and seastars (Uthicke et al., 2018). Compared to freshwater environments, passive metabarcoding investigations in marine systems are limited (Jerde et al., 2019). Marine eDNA metabarcoding studies have been shown to yield similar species composition assessments compared to conventional (i.e., non-DNA based) surveys, and often provide a higher resolution of biodiversity (Thomsen et al., 2012; Port et al., 2016; Valentini et al., 2016; Kelly et al., 2017; Yamamoto et al., 2017; Taberlet et al., 2018). While eDNA studies are becoming more common in marine systems, most efforts have focused on either the analytical methods (filtration and assay development) to generate an eDNA signal, or the interpretation of that signal (bioinformatics and eDNA fate and transport). A critical, often overlooked step in this process is the means by which samples are acquired and options for scaling up such collections both temporally and spatially. For example, most eDNA analytical procedures require a human presence to collect and process samples, which inherently limits where and how frequently collections can be made – especially when sampling sites cannot be accessed easily.
Engineering advancements have led to the development of robotic water samplers that overcome the temporal and spatial limitations of traditional manual sampling. Bowers et al. (2018); Govindarajan et al. (2015), Herfort et al. (2016); Robidart et al. (2014), Ryan et al. (2011), and Taylor et al. (2015) have utilized automated systems for the study of marine microbes, phytoplankton, zooplankton and invertebrate larvae. This study concentrates on use of the Environmental Sample Processor (ESP), a robotic device that can be programmed to automate water sample filtration and preservation of the captured material, or homogenize it for immediate analyses in situ (Scholin et al., 2017). Various iterations of the instrument have been realized over the past 25 years. The second-generation (2G) ESP enables the in situ detection/quantification of marine organisms using sandwich hybridization (SHA; Preston et al., 2009; Bowers et al., 2018), competitive ELISA (cELISA; Doucette et al., 2009), and qPCR assay formats (Preston et al., 2011; Ussler et al., 2013; Yamahara et al., 2015). The diverse processing capabilities of the 2G-ESP are counterbalanced by inherent challenges posed by a rather large and cumbersome instrument that primarily has been used aboard dedicated moorings and drifters, as well as installations on ships and shore-based stations (Scholin et al., 2017). Recently, a third-generation (3G) ESP was specifically designed to fit on a Tethys-class long-range AUV (LRAUV; Hobson et al., 2012; Pargett et al., 2015; Scholin et al., 2017). The LRAUV-3G ESP combination makes it possible to collect and process up to 60 samples in a similar fashion as the 2G instrument while roaming freely in the ocean from the surface to 300 m depth over many days during a single deployment.
While the LRAUV-3G ESP (hereafter LRAUV-ESP) development offers the promise of new eDNA collection capabilities, the equivalency of acquiring/preserving samples robotically versus manually using current “gold standard” methods must first be established. In this study we addressed this need by (1) comparing gene abundances of target organisms collected robotically and traditionally from both experimental and native samples, and (2) evaluating the stability of preserved eDNA samples collected by the 3G ESP since there is a lag between in situ sample collections and their return to a laboratory. qPCR was utilized in this study to provide a quantitative measurement for making comparison between methods. Finally, we demonstrated the unique autonomous capabilities of the LRAUV-ESP during a deployment near Monterey Bay, CA, by remotely and repeatedly sampling a moving water mass over 12 h. The high-resolution sampling scheme afforded by the LRAUV-ESP offered the opportunity to observe dynamic eDNA signatures that might otherwise be difficult if not practically impossible to observe using manual collections alone.
The 3G ESP was used to fully automate sample filtration and preservation, and compared against traditional laboratory methods that rely on peristaltic pump filtration followed by flash freezing (i.e., “traditional” or “manual” methods). The 3G ESP can run standalone on a benchtop in the laboratory (hereafter referred to as benchtop-ESP), or mounted on an LRAUV for field deployment (hereafter referred to as LRAUV-ESP).
In the first phase of comparisons, a series of samples were processed in parallel using the benchtop-ESP and manual methods; these are referred to as direct comparisons since each trial draws from a common water source (Figure 1). Direct comparisons were also used to determine the stability of recoverable eDNA acquired using the ESP in a time series experiment reflective of the typical duration of an LRAUV deployment.
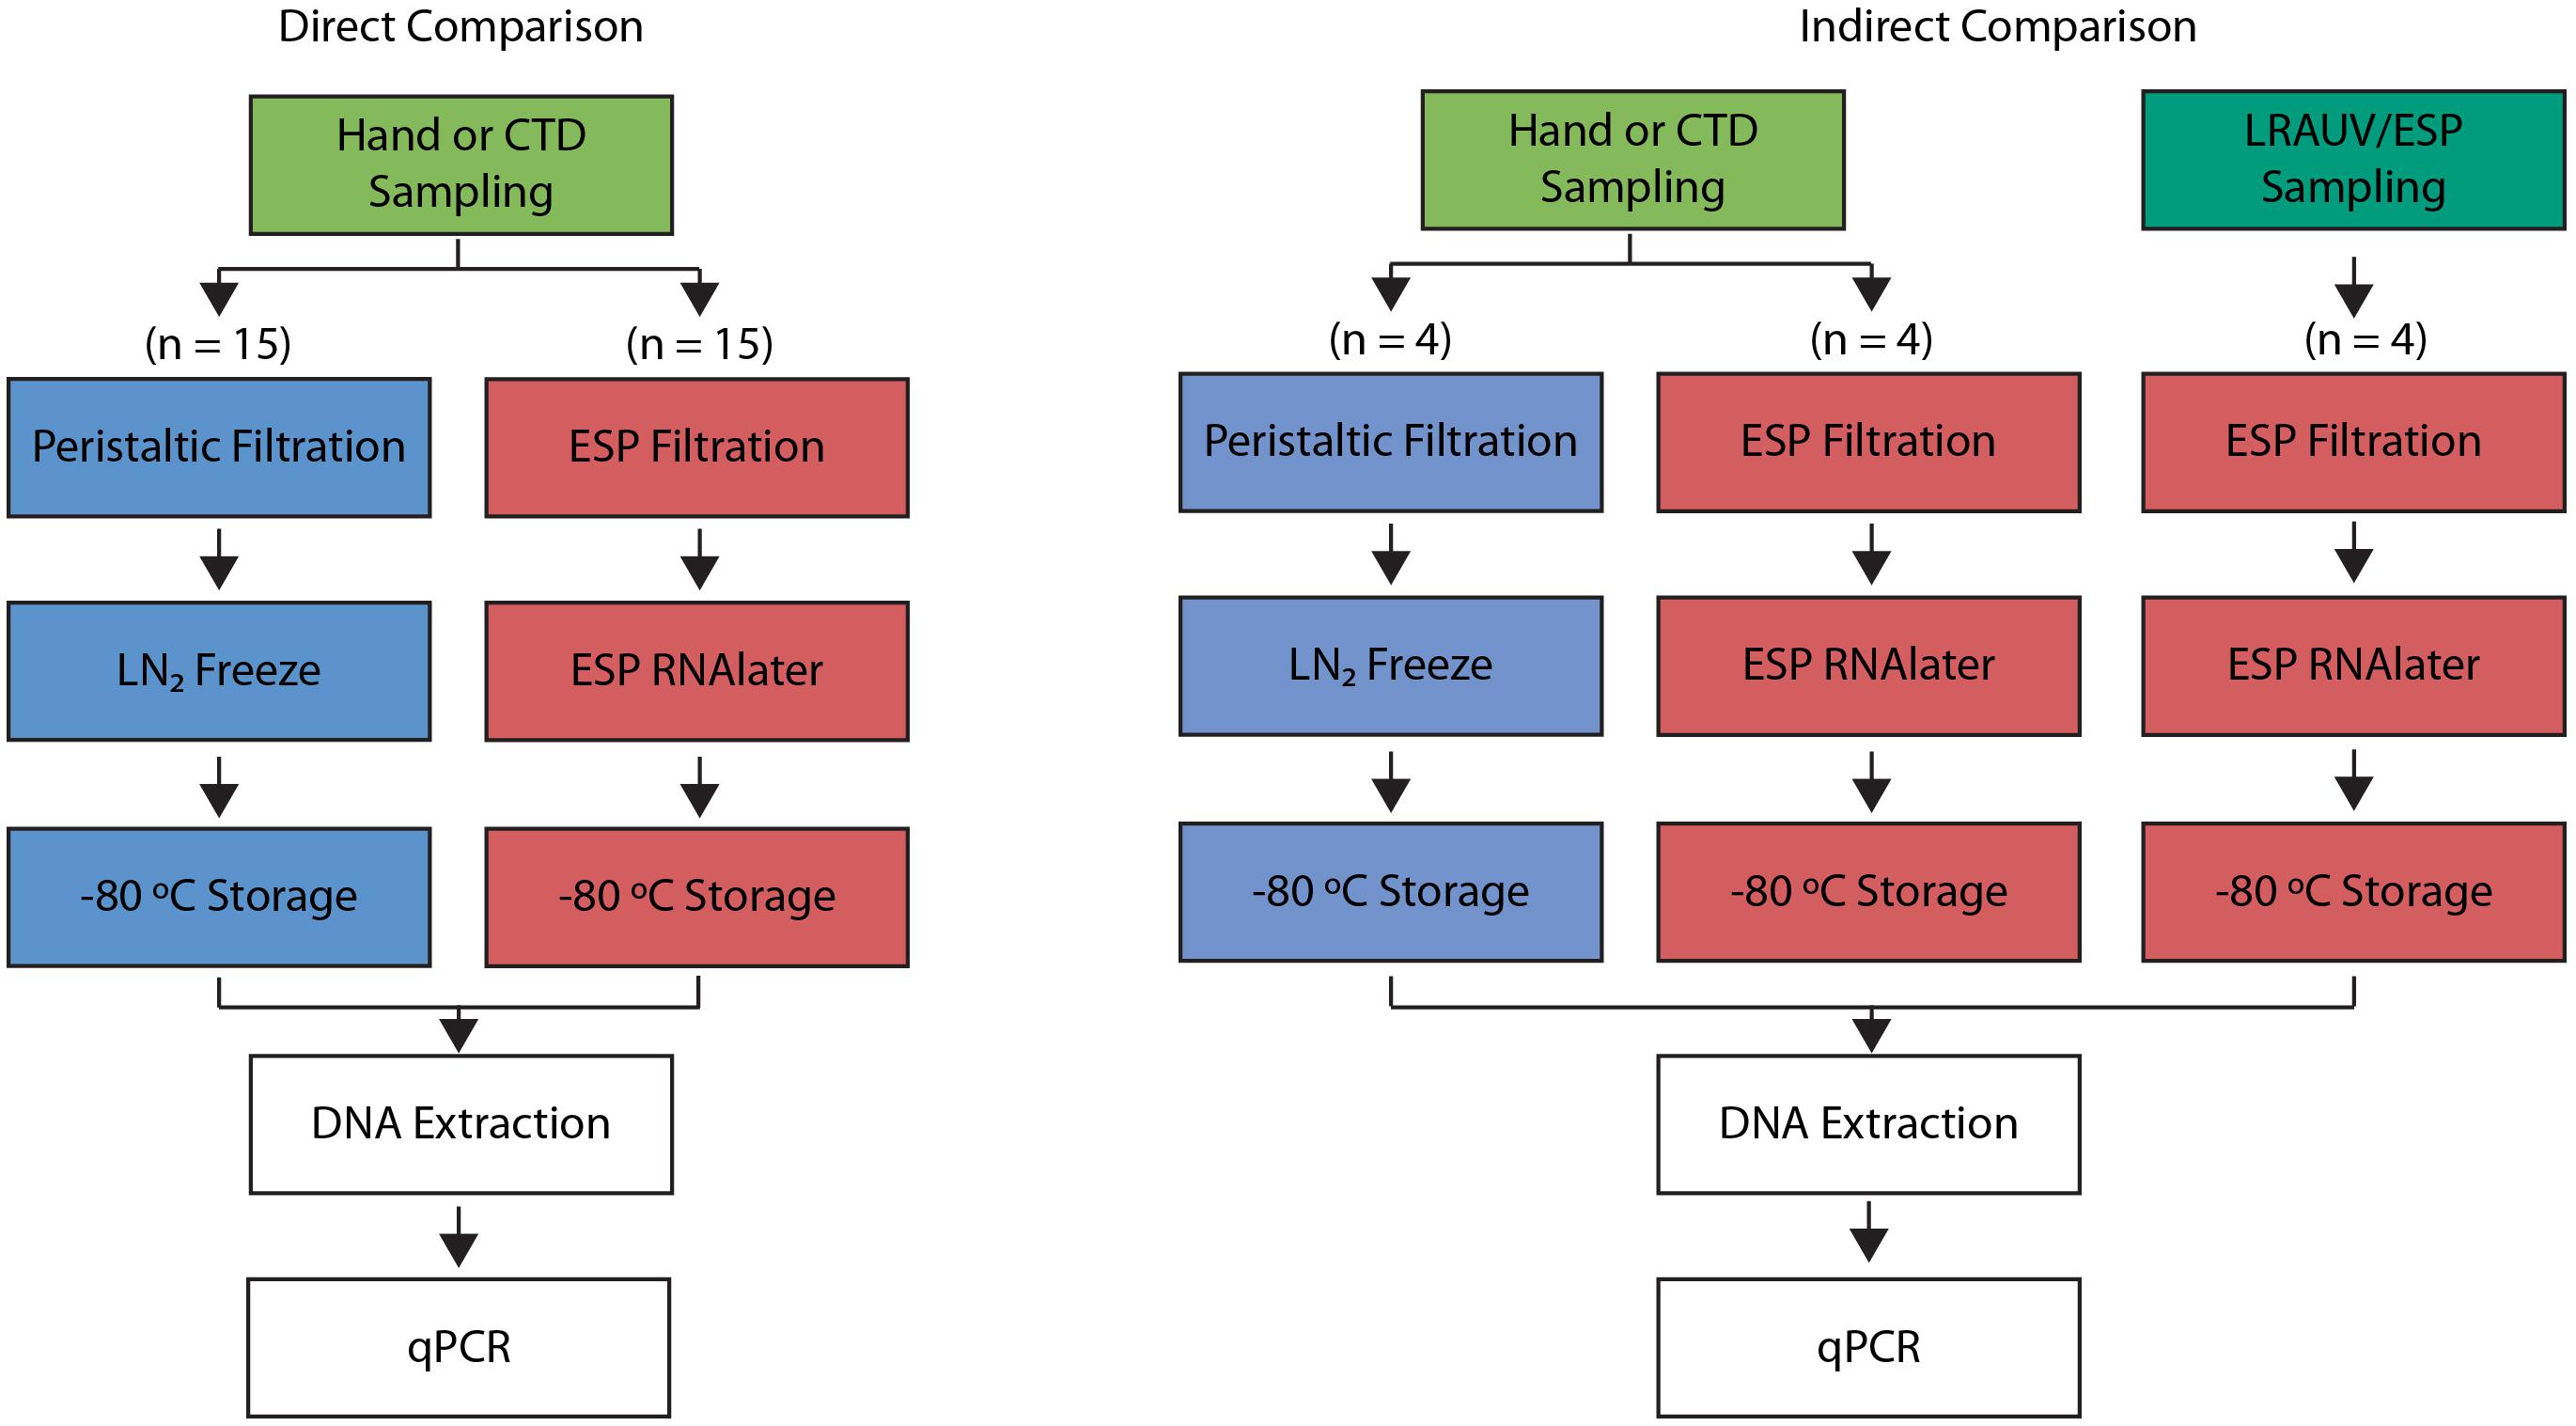
Figure 1. Process diagrams of the direct (left) and indirect (right) comparison experiments. Direct comparison drew samples from the same source (green). Indirect comparisons utilized two different water sources: hand collections (green) and LRAUV-ESP collections (dark green). Traditional sample processing of peristaltic filtration followed by liquid nitrogen (LN2) freezing is shown in blue. 3G-ESP sample processing with RNAlater® is shown in red. DNA extractions and qPCR assays performed were the same across all methods.
Secondarily, the LRAUV-ESP was deployed at sea. While the ESP was acquiring its sample in situ, Niskin bottles were lowered from a ship to collect water in proximity to the vehicle. The latter are referred to as indirect comparisons since the ESP and manual collections do not draw precisely from the same source, and since the ESP required approximately 1 h to filter 1 L whereas the Niskin bottles capture a large volume instantly when tripped and were later processed manually (Figure 1).
Finally, the LRAUV-ESP was deployed and autonomously collected samples in Monterey Bay over a 12-h period. This test demonstrated the emerging autonomous, mobile, and targeted sample collection capabilities that the LRAUV-ESP affords.
Water samples were collected from Monterey Bay Aquarium exhibits and Monterey Bay (environmental) sites six times as follows: (1) 20 L was acquired from the Monterey Bay Aquarium Kelp Forest tank (MBAKF) in January 2017, (2) eight 10 L Niskin samples were taken from Monterey Bay aboard the R/V Western Flyer in May 2017, (3) four LRAUV-ESP samples were collected in proximity with the R/V Western Flyer Niskin samples in May 2017, (4) 20 L was gathered from Monterey Bay (36.797N, -121.847W) aboard the R/V Rachel Carson in January 2018 using Niskin bottles, (5) eleven 1 L samples collected using the LRAUV/ESP demonstration experiment, and (6) a 20 L hand sample from the MBAKF in February 2018. A summary table of all samples is shown in Supplementary Table S1.
We performed direct comparisons between the benchtop-ESP and manual laboratory methods (n = 15) on samples collected at the MBAKF exhibit (n = 2) and Niskin samples (n = 13) collected using a CTD-Niskin (10 L) rosette sampler (CTDn) aboard the R/V Rachel Carson and R/V Western Flyer. All MBAKF and CTDn samples were collected in acid washed (10% hydrochloric acid) and autoclaved polypropylene carboys. All carboys were triple rinsed with a small volume of sample water prior to sample collection. For MBAKF samples, 20 L hand-grab samples were collected from the surface (<1 m depth) of the exhibit and immediately transported to the lab on ice. The samples were continuously mixed with an acid washed magnetic stir bar, and samples were processed in triplicate using the appropriate method. CTDn samples were composited from 2 L of water from Niskins sampled at surface, 10, 20, 30, 40 m depths, for a total volume of 10 L. The composite 10 L sample was vigorously shaken by hand, split into 2 × 5 L subsamples and immediately processed in triplicate.
We performed indirect sample comparisons by comparing CTDn samples to in situ collected and processed samples on LRAUV-ESP (n = 4). The ESP continuously filtered water while the LRAUV spiraled between 10 and 40 m depths (at 1 m/s speed and spiral radius of 10 m). CTDn samples were collected aboard the R/V Western Flyer, within close proximity (∼100 m) of the LRAUV-ESP. To match the LRAUV-ESP spiral diving samples, CTDn samples were composited from 2 L of Niskin water samples at depths of surface, 10, 20, 30, 40 m; for a total volume of 10 L. The composite 10 L sample was vigorously shaken by hand, split into 2 × 5 L subsamples and immediately processed in triplicate on the vessel. The 5 L subsamples were processed using both the traditional and bench-top ESP methods for a direct comparison.
Details of the ESP sample collection and processing are described below.
We determined the stability of ESP RNAlater® preserved samples by comparing gene abundance from DNA extracted from the ESP and manually filtered/flash frozen samples that were held over time. A single 20-L sample was collected from the MBAKF exhibit in February 2018. The sample was processed and preserved using the ESP with RNAlater® and traditional filtration and flash freezing at the initial sampling time point (T0). At T0, a single water sample was filtered using the ESP (n = 9) and traditional method (n = 6). At T0, three of the ESP samples and six of the traditional filter samples were recovered and stored at -80°C until DNA extraction. To simulate conditions during an ESP deployment, the remaining six ESP samples were stored in a sealed chamber purged with ultra-pure zero-grade nitrogen gas (Praxair, Danbury, CT) at room temperature; three were recovered at 7 days (T7) and three at 21 days (T21). Upon recovery, all ESP filters were stored at -80°C until DNA extraction. Details of the traditional and ESP methods are described below.
In January 2018, the LRAUV-ESP was deployed for 6 days outside Monterey Bay with 60 cartridges for sample collection and preservation (see methods below). In total, 45 of the 60 cartridges were utilized to collect and preserve environmental water samples and 15 cartridges were utilized for processing controls (positive and negative controls). Of the 45 cartridges, 11 cartridges were dedicated to sampling at the chlorophyll maximum layer by programming the LRAUV to autonomously find a local high-chlorophyll patch, and then trigger the ESP to collect samples repeatedly within that feature (i.e., back-to-back) for 12 h. In the peak-chlorophyll layer, the LRAUV ran in tight circles (10 m radius) at 1 m/s speed while sampling. After every three samples (about 3 h), the LRAUV profiled the water column and reacquired the chlorophyll peak for the next series of sample collections. Details of the LRAUV chlorophyll peak detection and sampling algorithms have been presented previously (Zhang et al., 2015).
The traditional (= manual) laboratory sample handling method utilized a peristaltic pump (after Walsh et al., 2009; Aylward et al., 2015). Briefly, 1 L water samples were pushed through in-line Swinnex® (MilliporeSigma, Darmstadt, Germany) housings containing 25 mm diameter, 0.22 μm Durapore filters (MilliporeSigma, Darmstadt, Germany). Filters were immediately removed from the Swinnex® filtration housings using aseptic techniques, rolled into 2.0 mL cryovials containing 250 uL of 0.5 and 0.1 mm Zirconium beads (Biospec Products, Inc., Bartlesville, OK), and then stored at -80°C until DNA extraction.
The mechanical design and function of the 3G ESP has been previously described (Pargett et al., 2015) and will only be summarized here (Figure 2). The 3G-ESP utilizes reusable cartridges, with each cartridge carrying all filters and reagents necessary for a single sampling event. The instrument holds 60 cartridges mounted on a custom-designed toroid valve that can individually select the cartridge designated for filtration. In the LRAUV-ESP configuration, all components (sampling pump, cartridges, actuators, and all electronics) are arranged in a 30 cm × 60 cm cylinder to allow for mounting at the front of the LRAUV. ESP cartridge parts that come in contact with sample water are cleaned with 10% bleach, 10% hydrochloric acid and/or UV irradiation (depending on component and disinfectant compatibility) for nucleic acid and nuclease decontamination prior to assembly. For eDNA sampling, assembled cartridges contained a 25 mm diameter, 0.22 μm Duropore filter for particulate sample collection and 1.6 ml of 0.1 um filtered RNAlater® (Life Technologies, Grand Island, NY) for sample preservation (Figure 2). The cartridge side and sampling sides of the toroid valve were cleaned with 10% bleach for 1 h followed by rinsing with 500 ml of MillQ water (Figure 2). Cartridges were loaded onto the instrument and the sampling chambers holding the filters were placed under vacuum (20–29 in Hg).
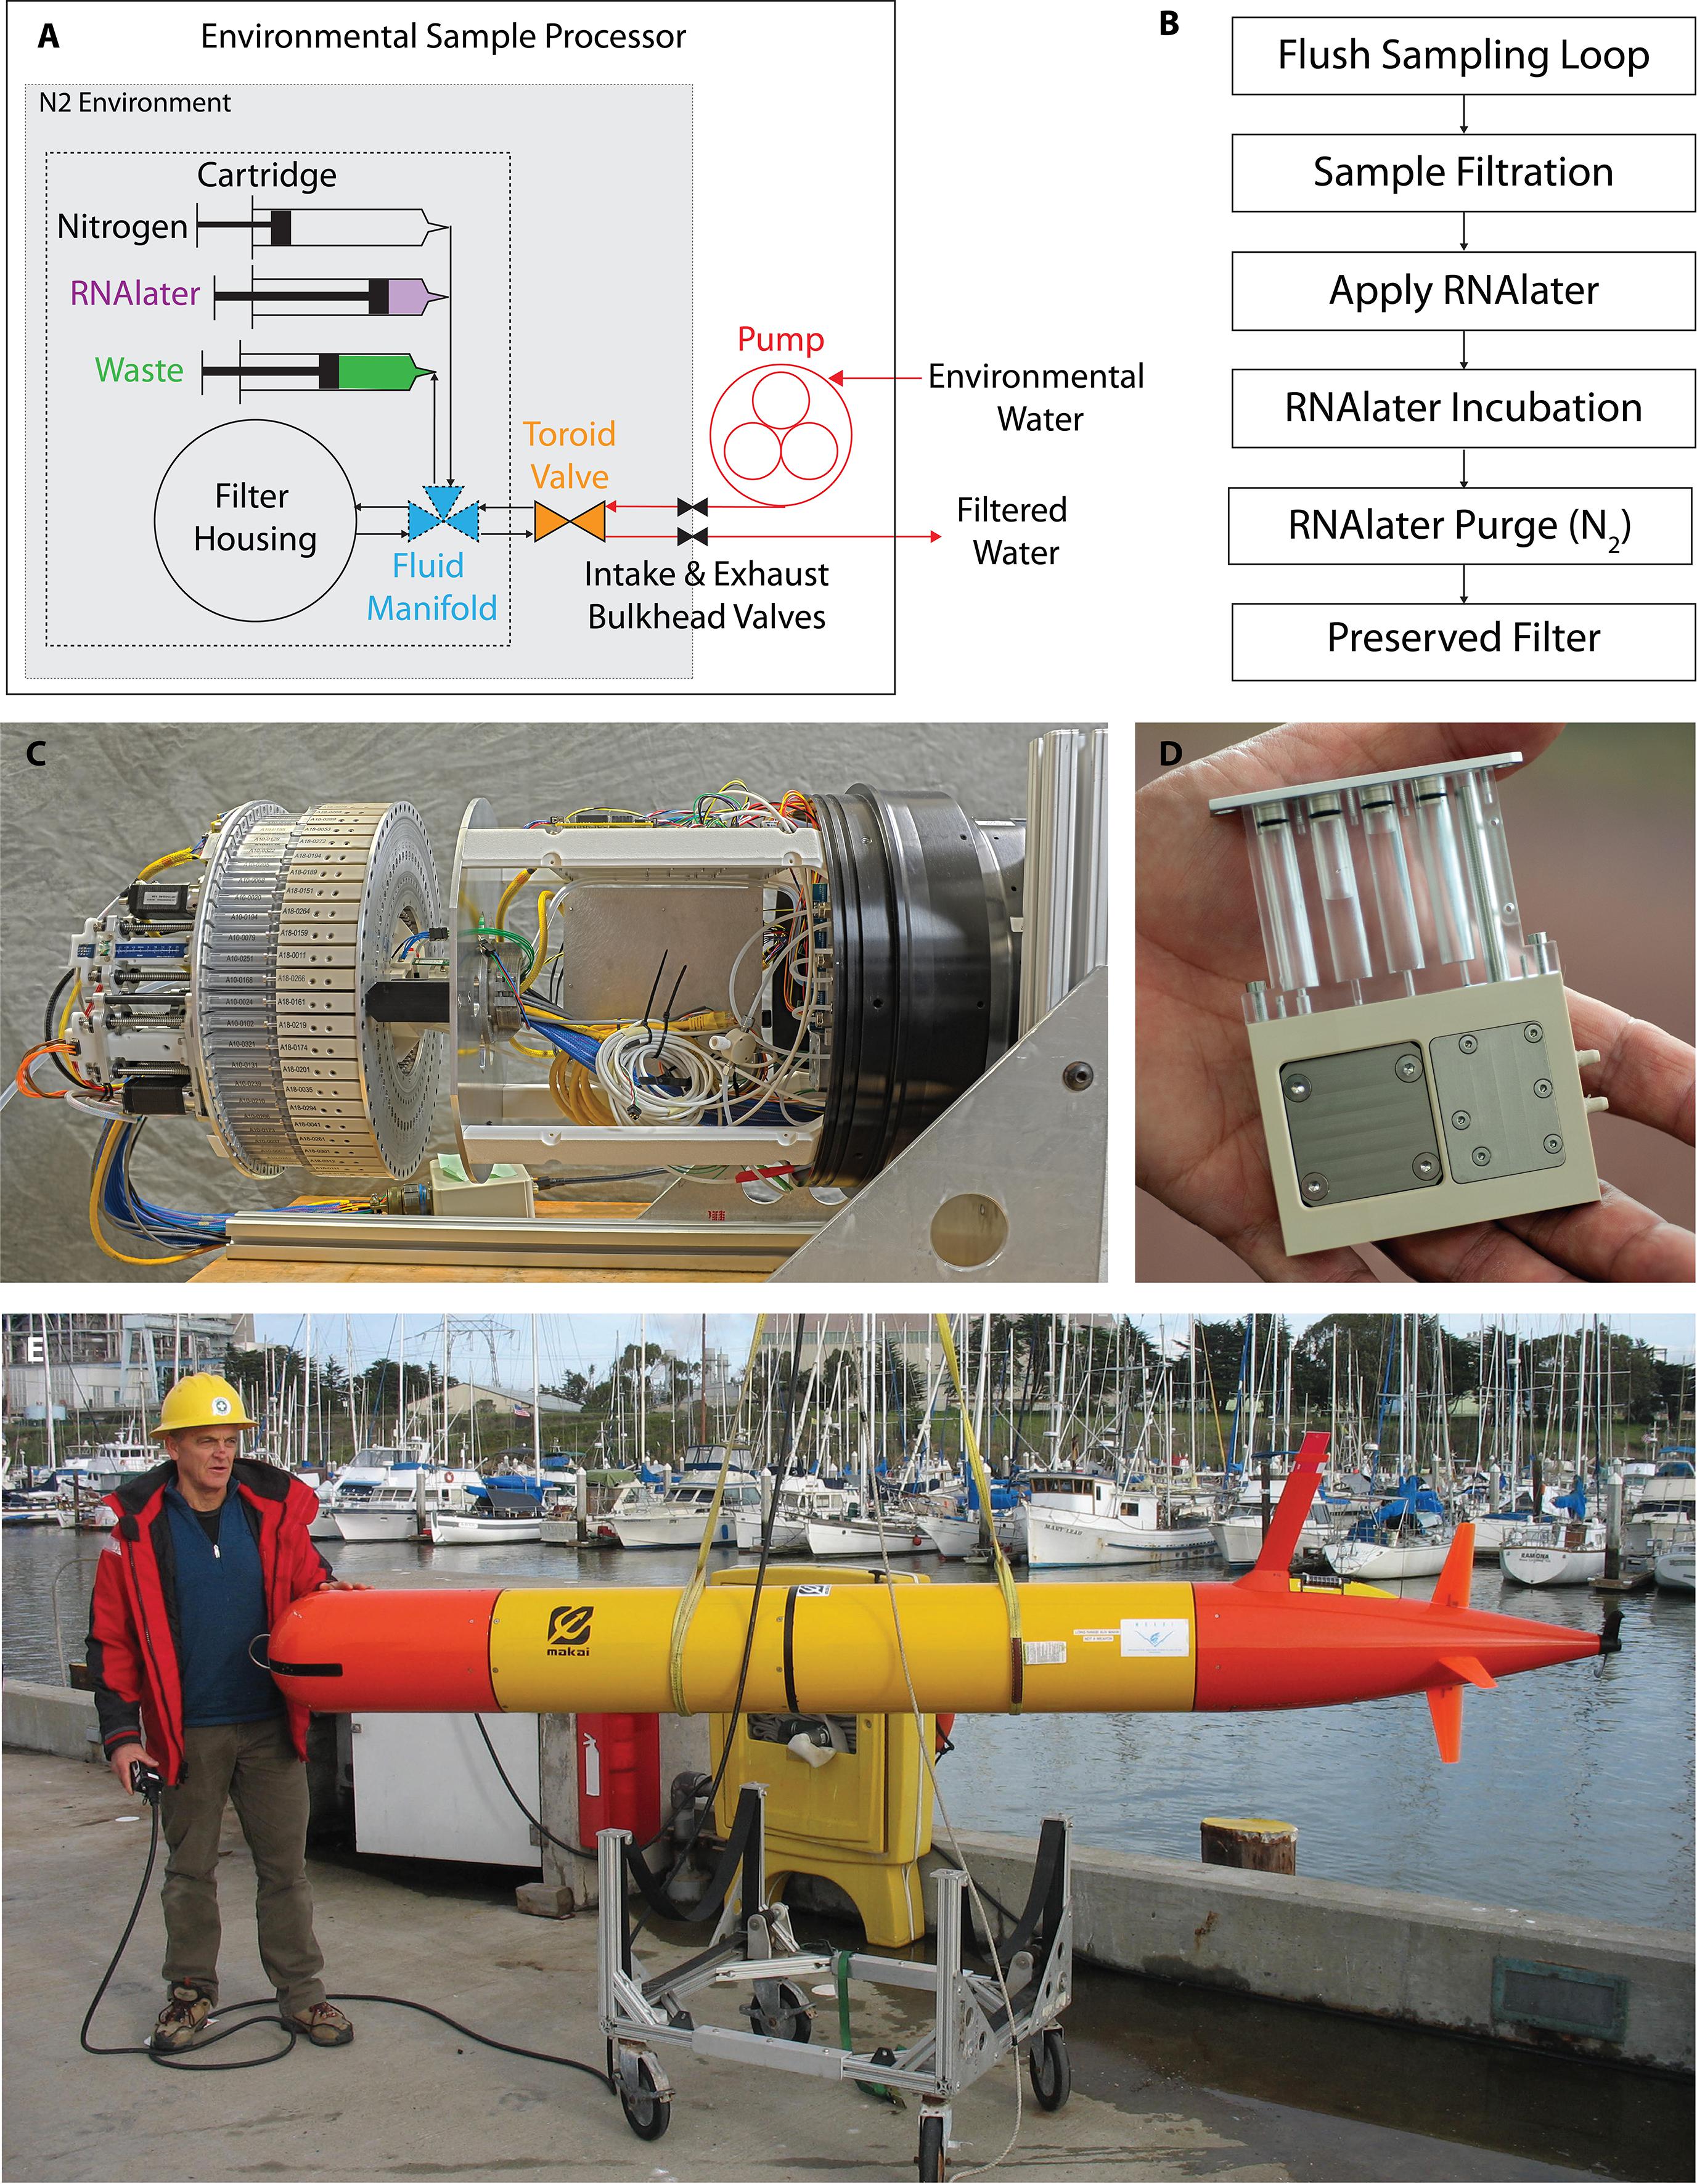
Figure 2. Process flow diagram, schematic representation and photographs of the 3G-ESP. Schematic representation of the 3G-ESP (A), main components of the 3G-ESP are shown: sampling loop with pump (red) and bulkhead valves (black), toroid valve (orange), and sampling cartridge. The sampling cartridge (within dashed lines) contains the filter housing, fluidic manifold (blue) for RNAlater® delivery (purple), nitrogen purging (gray), and waste recovery (green). All components within the 3G-ESP bulkhead valves (within the dotted lines) are stored under a nitrogen environment (gray). Sample processing flow diagram describes a simplified version of the sample processing on the 3G-ESP (B). The 3G-ESP houses 60 cartridges arranged around a toroid valve, resulting in an instrument approx. 30 cm × 60 cm (C). 3G-ESP sample collection and processing cartridge (D). The design of 3G-ESP allows mounting as a payload on a long-range autonomous underwater vehicle (E). All individuals shown in these photographs were informed prior to submission and have given written permission for the photographs to be used in this publication.
A schematic and process diagram of the ESP sampling is shown in Figure 2. Prior to deployment, the LRAUV-ESP housing is flushed with ultra-pure zero-grade nitrogen gas (Praxair, Danbury, CT) to create a non-reactive environment. The sampling system is sterilized by pumping 100 mL of 10% bleach followed by 200 mL of MilliQ water through the intake/exhaust system. The bleach and MilliQ volumes are equivalent to 6 and 12 volumes of the intake-exhaust loop (Figure 2). When a sampling event is initiated, the ESP sample pump pushes 110 mL of water through the intake-exhaust loop to flush residual water out of the system. After flushing, a cartridge is selected from the toroid valve and water is diverted through a cartridge for filtration. Target (desired) sample volumes were predetermined by the user (in this case, 1 L), and the ESP continuously monitors pressure across the filter to monitor for leaks and particulate loading of the filters. Filtration parameters for this experiment allow for a sample pressure head between 18 and 26 PSI, a minimum flow rate of 0.2 ml/s, and a maximum allowable filtration time of 1 h 15 min. Sample collection is terminated either after the target volume is reached, the filter shows signs of particle loading (flow rates < 0.2 ml/s), or the maximum allowable filtration time is reached. When any of those conditions is met, cartridge syringe actuators deliver 1.6 ml RNAlater® into the 0.9 ml filter chamber, displacing the residual seawater and excess preservative to the cartridge’s waste chamber. The preservative left in contact with the sample filter (>90% of the concentration of full strength RNAlater®) remains for 10 min to saturate/incubate the particulates captured on the filter (this time can be varied per user preference). After soaking, the RNAlater is expelled from the filter chamber to waste chambers with nitrogen gas (LRAUV-ESP) or ambient air (benchtop-ESP); the processed filter remains moist but is not flooded. For a deployed LRAUV-ESP, cartridges remained in a nitrogen environment until the instrument was returned to the lab. Once returned to the lab, the filters were aseptically removed from the cartridges and rolled into 2.0 mL cryovials containing 250 μL of 0.5 and 0.1 mm Zirconium beads (Biospec Products, Inc., Bartlesville, OK), and immediately stored at -80°C until DNA extraction.
In order to prevent sample contamination, we adhered to stringent quality control and quality assurance practices. For example, sample collection and DNA extraction were performed in separate purpose-designated laboratories following recommendations in Goldberg et al. (2016). Total DNA was extracted from filters using a modified DNeasy (Qiagen, Valencia, CA) protocol (Thomsen et al., 2012; Djurhuus et al., 2017). DNA was eluted in two 50 μL fractions, for a total of 100 μL with PCR grade water. The DNA extracts were aliquoted into five 20 μL volumes and stored at -80°C until used in qPCR analyses.
PCR preparation was performed in a designated DNA-free PCR hood (UVP, Upland, CA), and subsequent amplification reactions were performed in a separate room. eDNA from Northern Anchovy (Engraulis mordax), Pseudo-nitzschia spp., and Pelagibacterales (SAR11) were quantified using previously described qPCR assays (Table 1). An assay for the quantification of eDNA from North Pacific Krill (Euphausia pacifica) was developed for this study (see Supplementary Materials). Reactions consisted of 1X TaqmanTM Environmental Mastermix 2.0 (Life Technologies, Grand Island, NY), forward and reverse primers and probe (Table 1), and 2 μL of template DNA in a 20 μL final volume. Triplicate reactions were run on a StepOnePlus real-time PCR system (Applied Biosystems, Foster City, CA) under the following thermal cycling conditions: 2 min at 50°C and 10 min at 95°C, followed by 40 cycles of 15 s at 95°C and 1 min at the corresponding annealing temperatures shown in Table 1. Fluorescence thresholds for each assay were manually adjusted to compare standard curves across runs. Slopes, y intercepts, reaction efficiencies and manual cycle thresholds (CTs) are presented in Table 1.
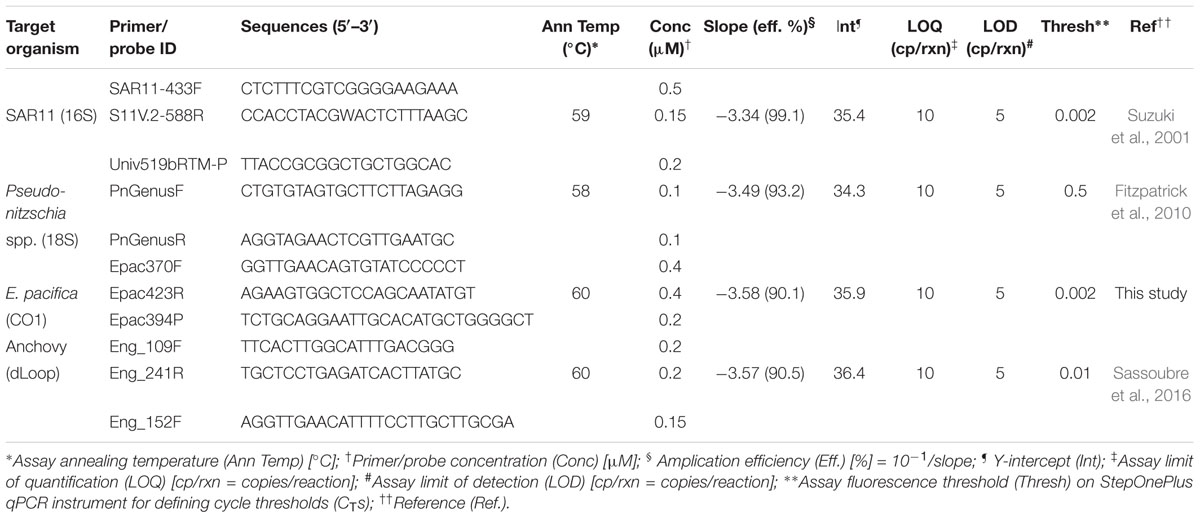
Table 1. qPCR chemistries, condition and standard curve parameters.
Integrated DNA Technologies gBlocks® Gene Fragments were utilized as DNA standards in the generation of qPCR standards curves (see Supplementary Materials). The synthesized DNA standards were diluted to 10 ng/μL stock solutions in Tris-EDTA (TE buffer) pH 8.0 (Sigma-Aldrich, St. Louis, MO) and verified using a NanoDrop ND-1000 spectrophotometer (NanoDrop Technologies, Wilmington, DE). The stock solutions were diluted to 1 × 10⁸ copies/μL in ultrapure PCR water (Sigma-Aldrich, St. Louis, MO) based on sequence composition. qPCR standards were generated by serial dilutions from 100 to 106 copies/μL. Triplicate qPCR standard curves were run on each qPCR plate and each standard curve was compiled into a master standard curve for sample quantification.
Sample DNA extracts were diluted at fivefold (1:5) and 10-fold (1:10), to assess qPCR inhibition. Samples were considered inhibited if the sample dilution CTs deviated from expected values, which were 2.32 cycles for fivefold (1:5) and 3.32 cycles for 10-fold (1:10) dilutions.
Filtration blanks utilizing 500 mL of PCR grade water (Sigma-Aldrich, St. Louis, MO) were performed alongside each peristaltic water filtration event (n = 14). Prior to and after deployment or sample collection with the 3G-ESP, negative filtration blanks of 500 mL PCR grade water (Sigma-Aldrich) were collected on the instrumentation to assess background contamination (n = 8). DNA extraction blanks were performed alongside every 18 extractions (n = 6). No-template amplification controls were also run in triplicate on each qPCR plate.
Non-parametric statistical methods were used to compare direct and indirect sample collection comparisons. Specifically, Kruskal–Wallis (KW) and Wilcoxon Signed Rank Test (W) were used to compare overall means and paired sample means between the ESP and traditional methods, within and across the assayed taxa. Spearman’s Rank Correlation (S) was used to infer relationships between the ESP methods and traditional methods. All statistical analyses were performed in R (R Core Team, 2017).
All pre-deployment ESP filtration and traditional filtration samples, as well as extraction blanks were negative for the intended qPCR targets. Post-deployment ESP filtration blanks showed amplification of SAR11 at a concentration of 3421 copies/mL; all other targets were negative in ESP-post deployment controls. No amplification was observed in any of the qPCR no template controls. Essential qPCR information is presented in Table 1. The qPCR assay developed for krill is specific and sensitive based on in silico and cross-reaction testing (see Supplementary Materials).
Automated sample filtration and preservation of eDNA using the ESP provided similar eDNA concentrations to traditional peristaltic filtration followed by flash freezing preservation (Figure 3, top panel). For direct comparisons, where the ESP and the traditional sample handling methods drew from the same source water (n = 15), eDNA concentrations were equivalent between the two methods for paired anchovy (W = 28, pw = 0.69), krill (W = 16, pw = 0.47), and SAR11 (W = 37 pw = 0.91) samples. Only Pseudo-nitzschia concentrations were different between methods (W = 66, pw = 0.03). Across all taxa analyzed (n = 4), eDNA concentrations were similar between methods (HKW = 0.001, pKW = 0.98). Using all taxa, eDNA concentrations recovered using ESP methods showed a positive correlation to the traditional method (Figure 4, S = 1690, ρS = 0.95, pS < 0.001). For individual taxa, ESP methods were correlated to the traditional method (ρS ≥ 0.71, pS < 0.008), except for krill (ρS = 0.57, pS = 0.08).
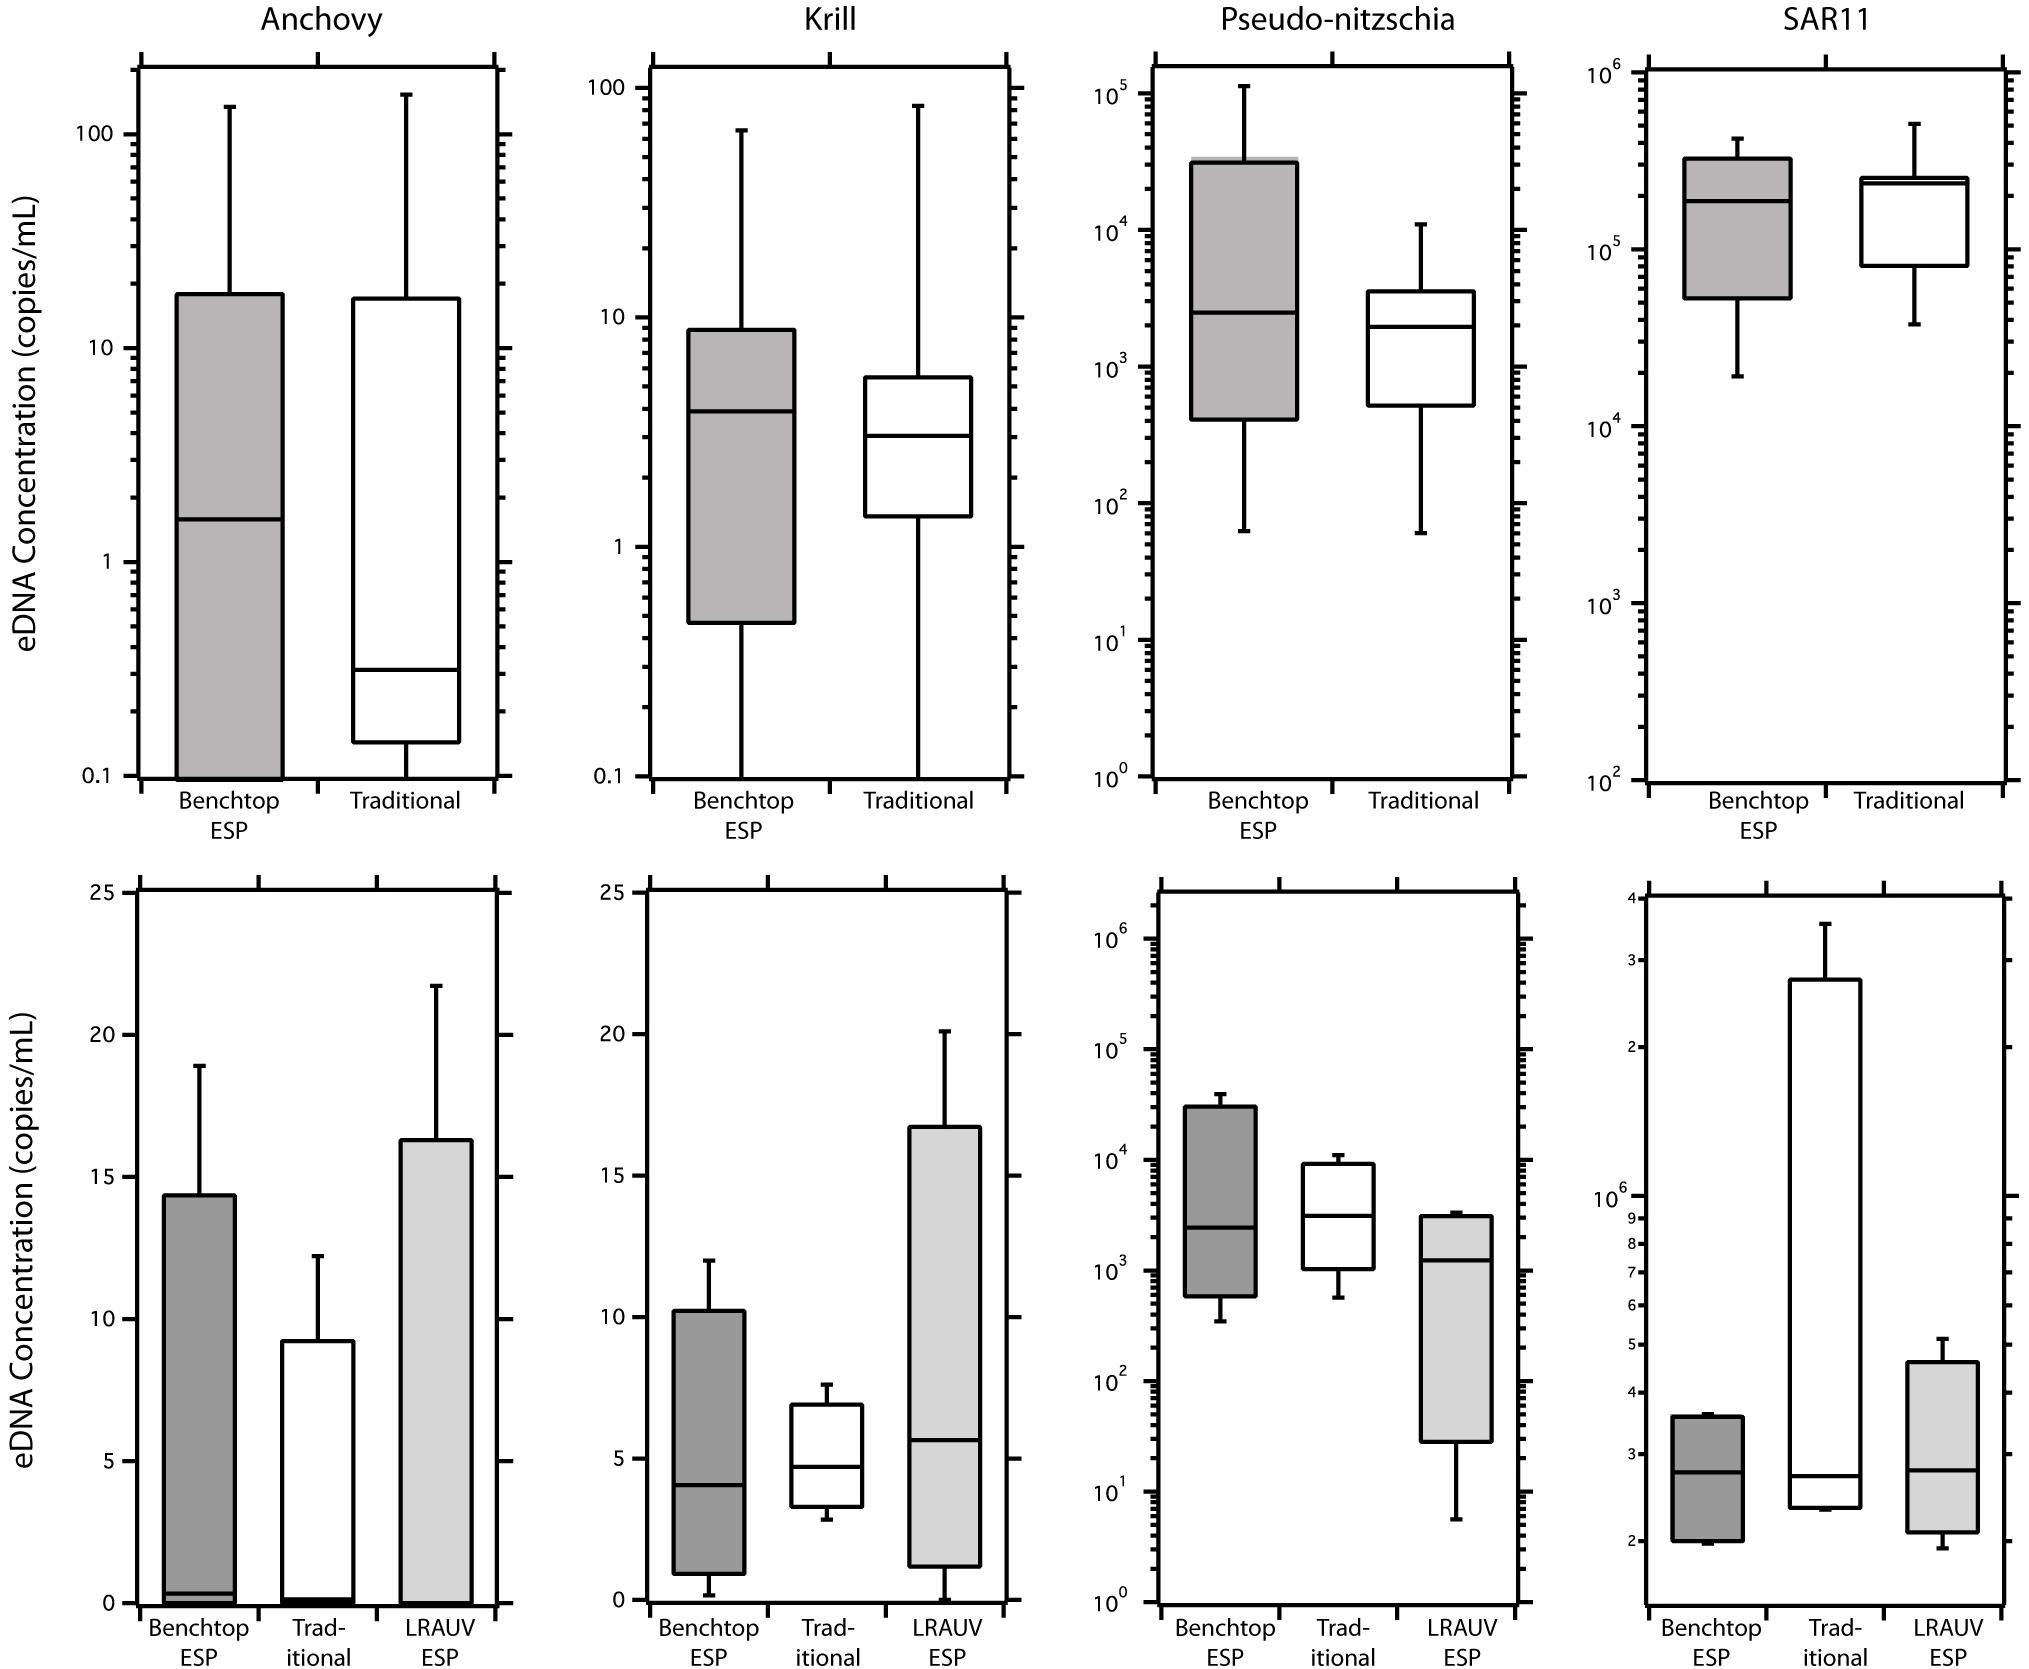
Figure 3. eDNA recovery comparisons between ESP (dark gray bars) and traditional peristaltic (white bar) methods. Direct comparisons (top panel) between benchtop-ESP and traditional peristaltic methods where samples were collected from the same sample bottle. Collection method comparisons (bottom panel) between in situ collected and preserved LRAUV-ESP (ESP onboard LRAUV) samples (light gray) collected in close proximity to ship-based method utilizing a CTD Rosette with Niskin bottles. Niskin bottle samples were processed using both a benchtop-ESP (dark gray) and the traditional peristaltic method (white). Error bars represent 95% confidence intervals.
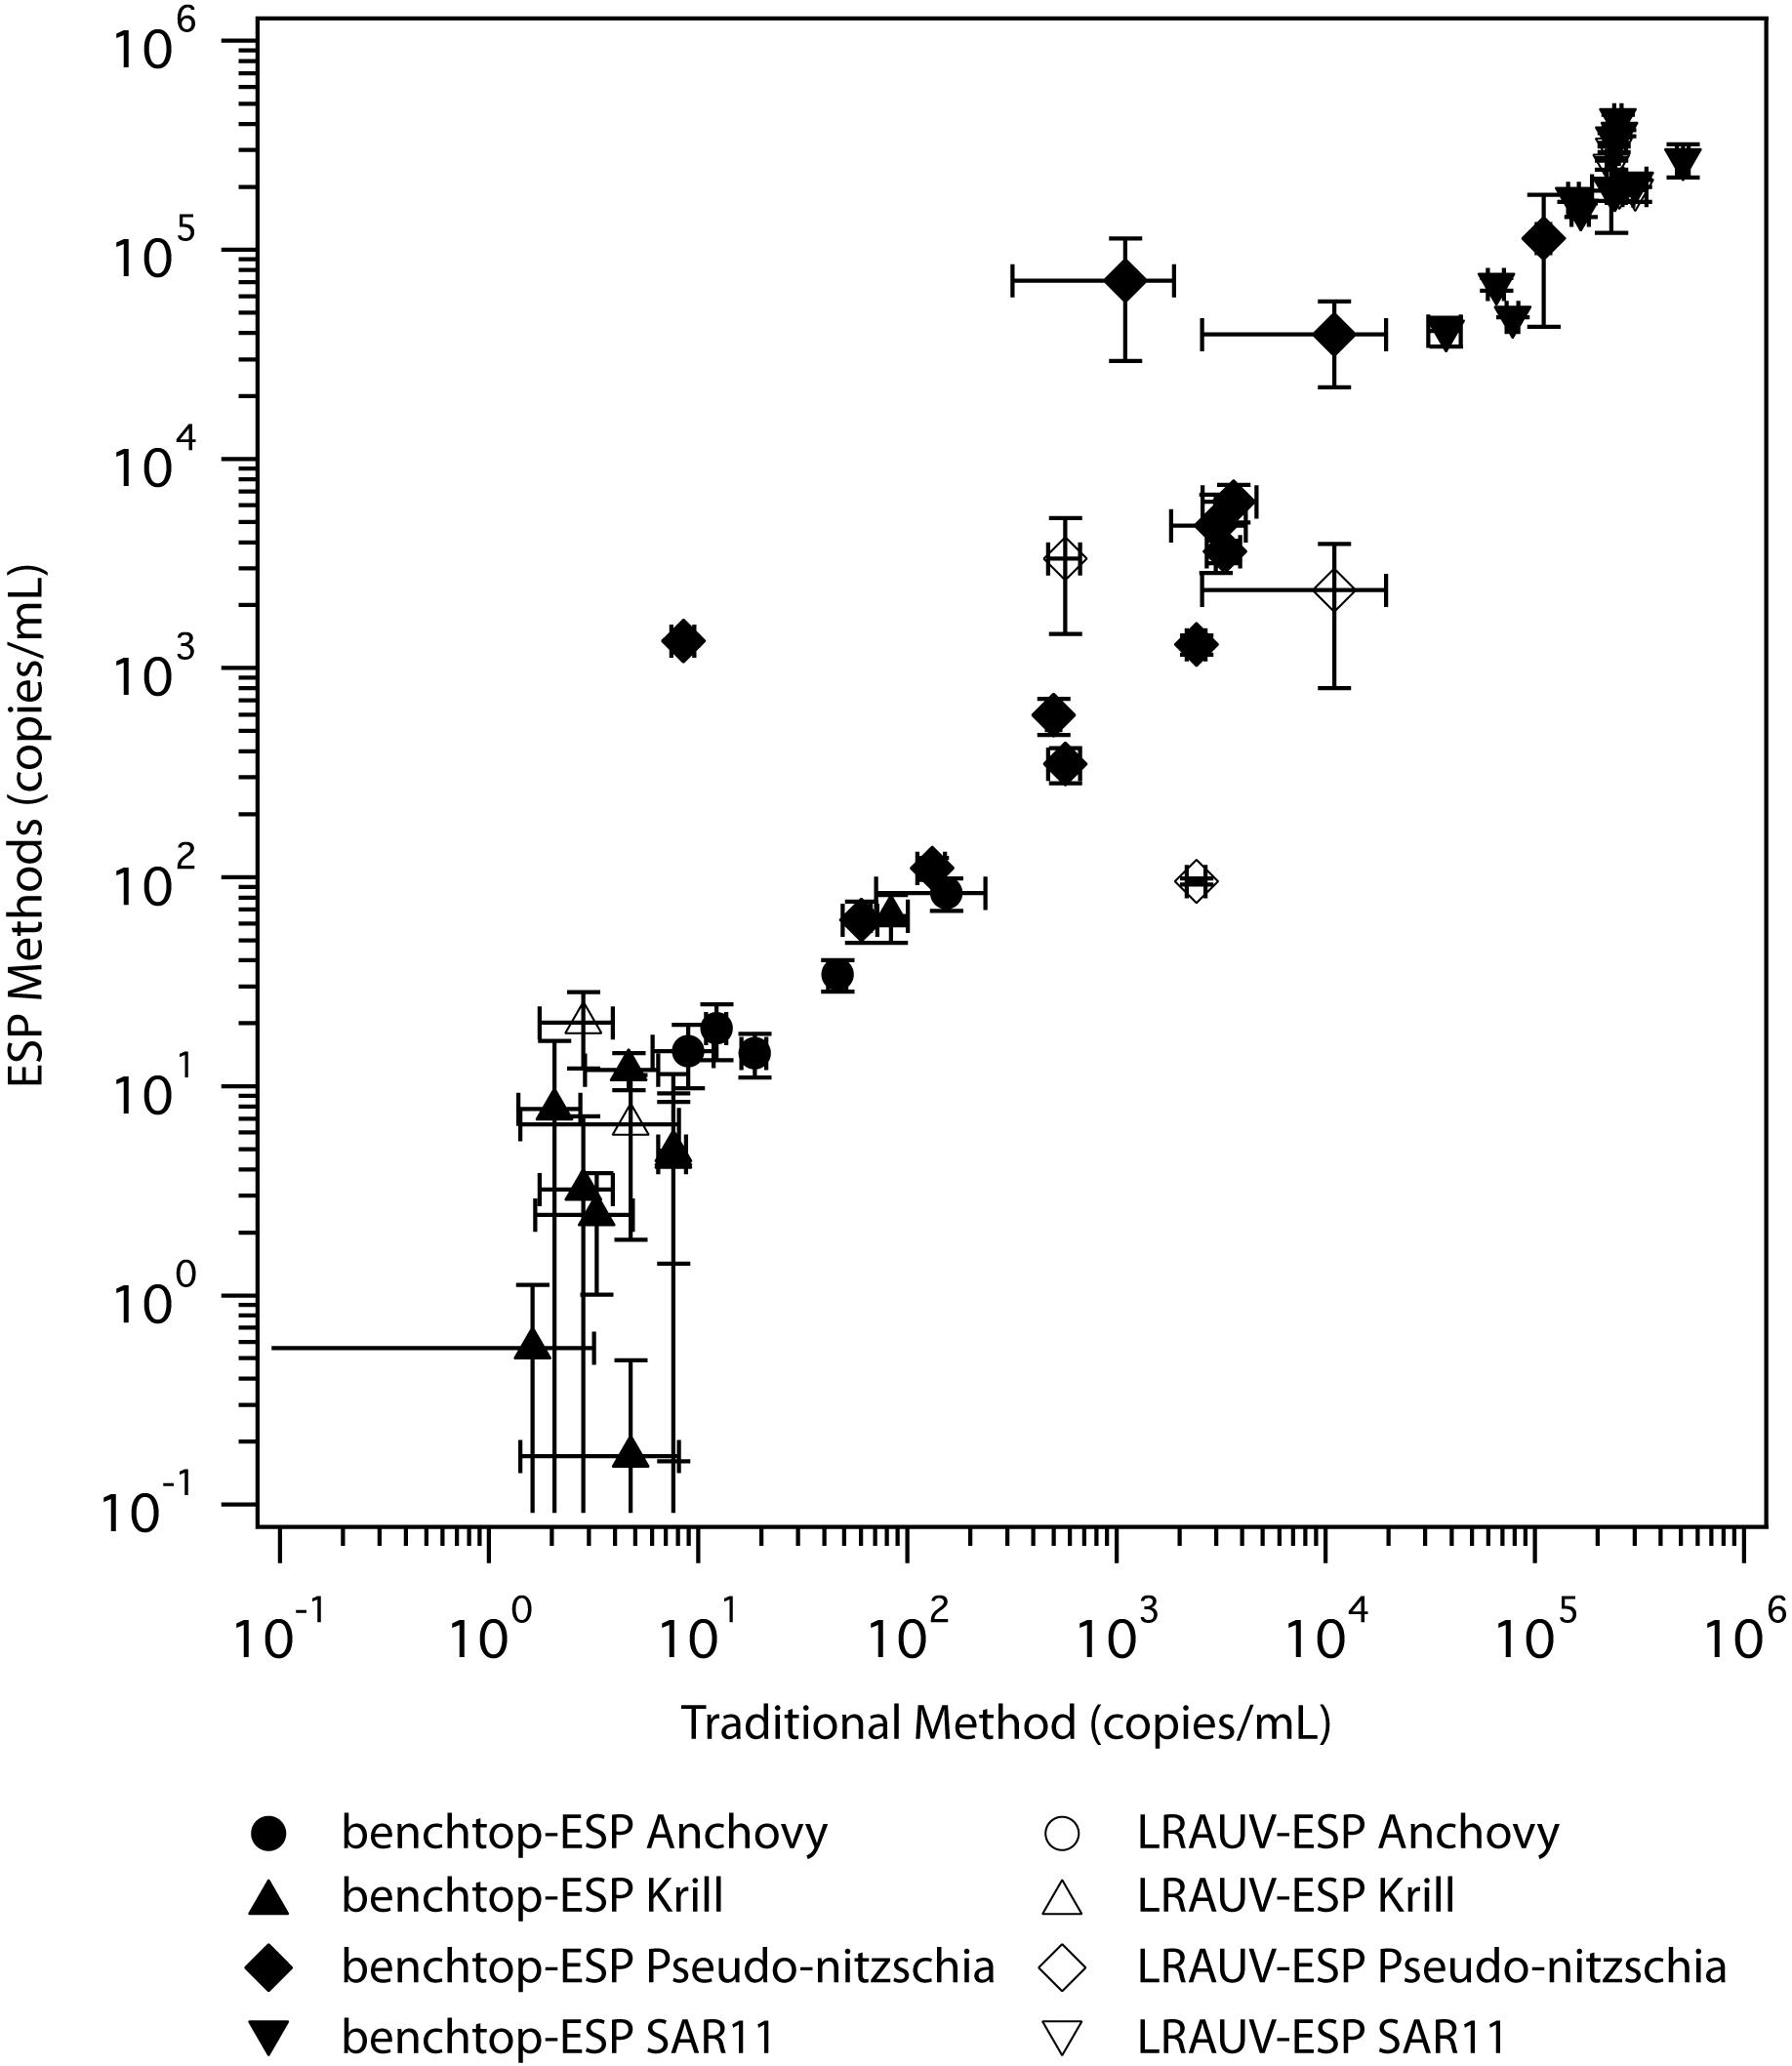
Figure 4. Log-log correlation of eDNA recovery collected via the traditional laboratory method (x-axis) and using the benchtop-ESP and the LRAUV-ESP methods (y-axis). Filled symbols are the direct comparisons (same water, benchtop-ESP vs. traditional method) and open symbols are the indirect collection method comparisons (LRAUV-ESP vs. ship-based collection with the traditional peristaltic method). Error bars represent 95% confidence intervals.
Due to a limited number of samples (n = 4), sufficient statistical power was not available to infer significant differences between traditional and LRAUV-ESP comparisons. Nonetheless, we report the results of the indirect comparisons for completeness. eDNA concentrations of the taxa recovered using the LRAUV-ESP during field operations compared to those recovered using ship-based CTD Niskin sample collections that employed a benchtop-ESP and traditional methods are shown in Figure 3 (bottom panel). eDNA concentrations recovered for anchovy (HKW = 0.19, pKW = 0.91), Pseudo-nitzschia (HKW = 1.85, pKW = 0.39), krill (HKW = 0.12, pKW = 0.95), and SAR11 (HKW = 1.07, pKW = 0.58) were similar using the three different sample collection and processing methods (n = 4). When samples and taxa were aggregated, eDNA concentration were similar between methods (HKW = 0.62, pKW = 0.43). Quantifications of in situ LRAUV-ESP eDNA concentrations were lower than their corresponding CTDn counterparts that used the traditional peristaltic filtration method. When comparing in situ LRAUV-ESP with the traditional sampling method, eDNA abundances of individual taxa were negatively correlated (-0.80 < ρS < -0.26), but the relationship was not significant (0.08 < pS < 0.75). Anchovy showed the strongest negative association between LRAUV-ESP and the traditional sampling method (S = 15.44, ρS = -0.54, pS = 0.08). Across all taxa, there was a positive correlation between the LRAUV-ESP collected and processed samples and the ship-based CTD Niskin samples (S = 413, ρS = 0.69, pS < 0.001) (Figure 4).
Replicate eDNA samples were collected and preserved using the ESP and then stored up to 21 days (Figure 5). At T0, the eDNA concentrations for each taxa were comparable when comparing the traditional and ESP methods (Anchovy: W = 47, pw = 0.085; krill: W = 77, pw = 0.85; pseudo-nitzchia: W = 101, pw = 0.32; and SAR11: W = 60, pw = 0.30). No differences were observed in eDNA concentrations for ESP samples recovered at day 7 and day 21, relative to samples recovered at T0 (Kruskal–Wallis: anchovy: H = 3.68, pKW = 0.30; krill: H = 0.52, pKW = 0.92; pseudo-nitzchia: H = 3.96, pKW = 0.27; and SAR11: H = 4.52, pKW = 0.21).
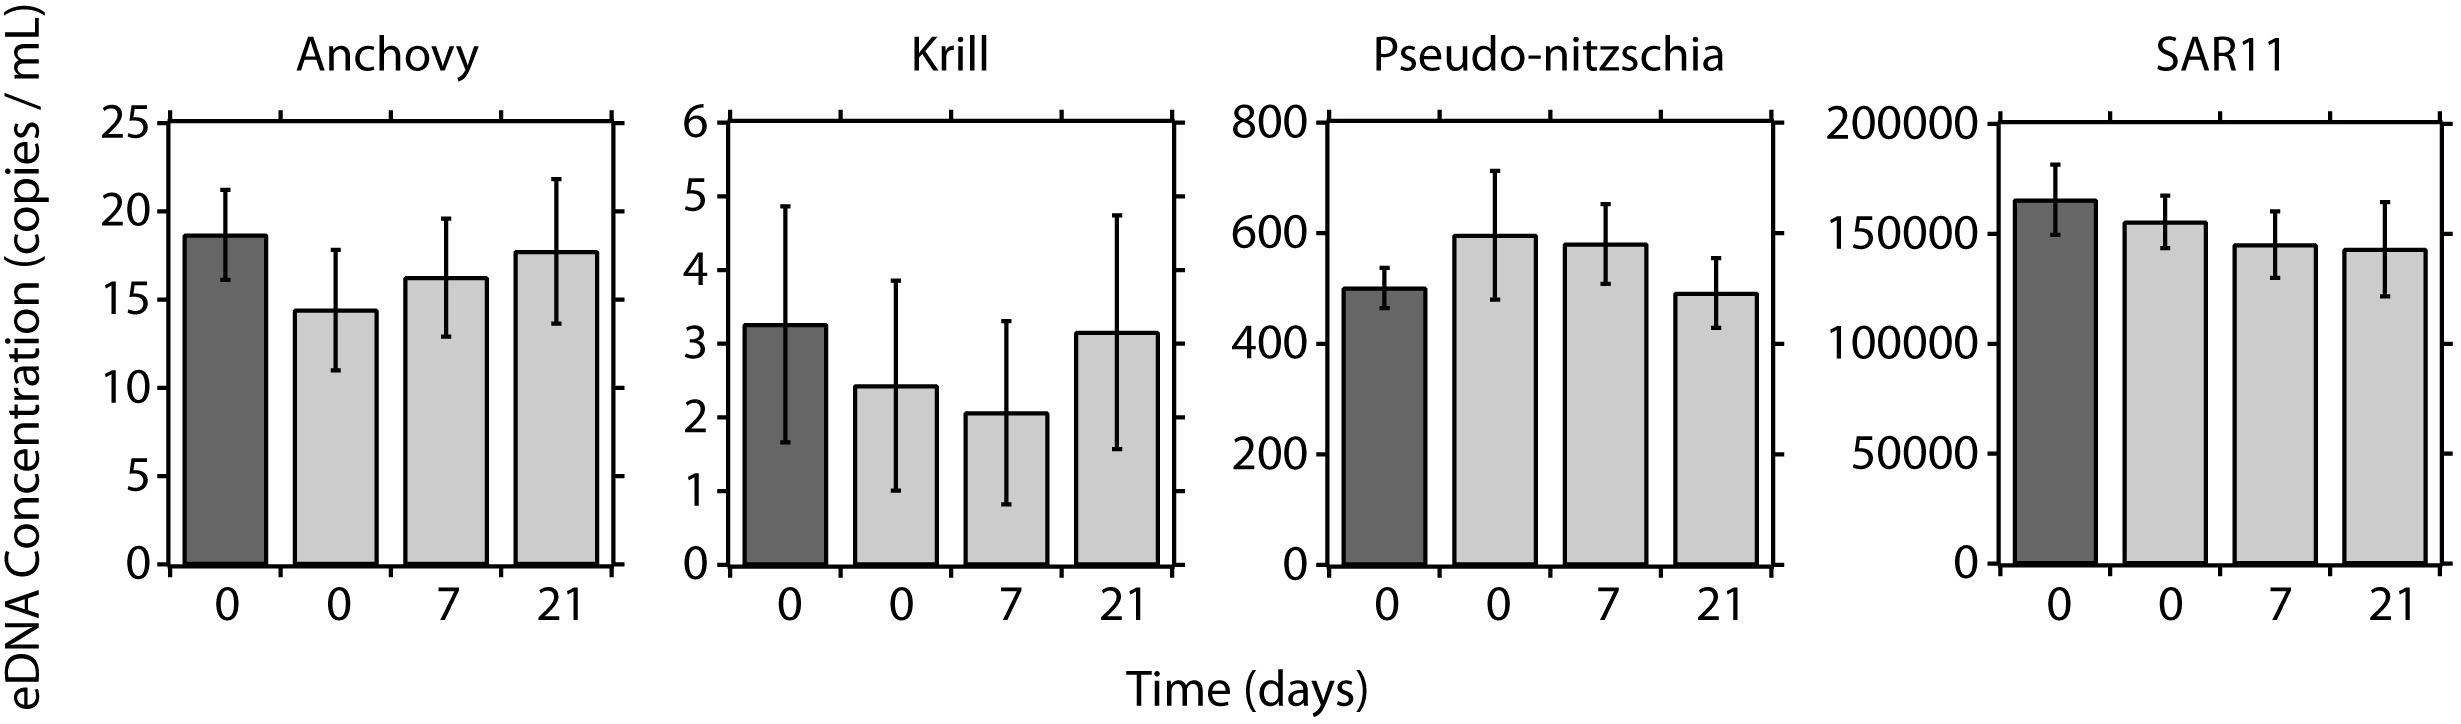
Figure 5. eDNA preservation time series using the LRAUV-ESP. Concentrations of eDNA using peristaltic filtration (dark gray bars) and the ESP (light gray bars) at day 0, day 7, and day 21 of preservation on the ESP. Error bars represent 95% confidence intervals.
The LRAUV-ESP was deployed outside Monterey Bay to autonomously locate and sample a chlorophyll maximum layer. The vehicle ran tight circles within the chlorophyll maximum layer and collected 11 samples over 12 h of continuous submergence while drifting a total of 4.5 km (Figure 6). The LRAUV-ESP acquired eDNA samples within this feature and provided physical/chemical sensor contextual data. To remain in the peak chlorophyll layer, the LRAUV re-acquired the chlorophyll maximum on three occasions using a vertical profiling perturbation behavior (Figure 6A; Zhang et al., 2015). The water column was vertically mixed, a typical winter condition, presenting weak vertical stratification and largely horizontal gradients. The ESP sample collection volumes ranged from 629 to 954 mL (mean = 725 mL ± 49 mL). The corresponding sampling times ranged from 40 to 58 min (mean = 45 min ± 2 min). Concentrations of eDNA were variable over time, but were not significantly associated with time or other contextual measurements. Anchovy and krill were present in low concentrations, from below the limit of quantification (BLOQ) to 4.5 and 8.9 copies/mL, respectively. Pseudo-nitzchia was present in 4 of the 11 samples with variable concentrations over time, ranging from BLOQ to 3 × 10⁴ copies/mL. SAR11 concentrations were stable over the deployment, ranging from 4 × 10⁵ to 2 × 10⁶ copies/mL. SAR11 DNA carry over (3421 copies/mL) was present in the post-deployment LRAUV-ESP negative controls. No other target eDNA was detected in the pre- or post-deployment negative controls.
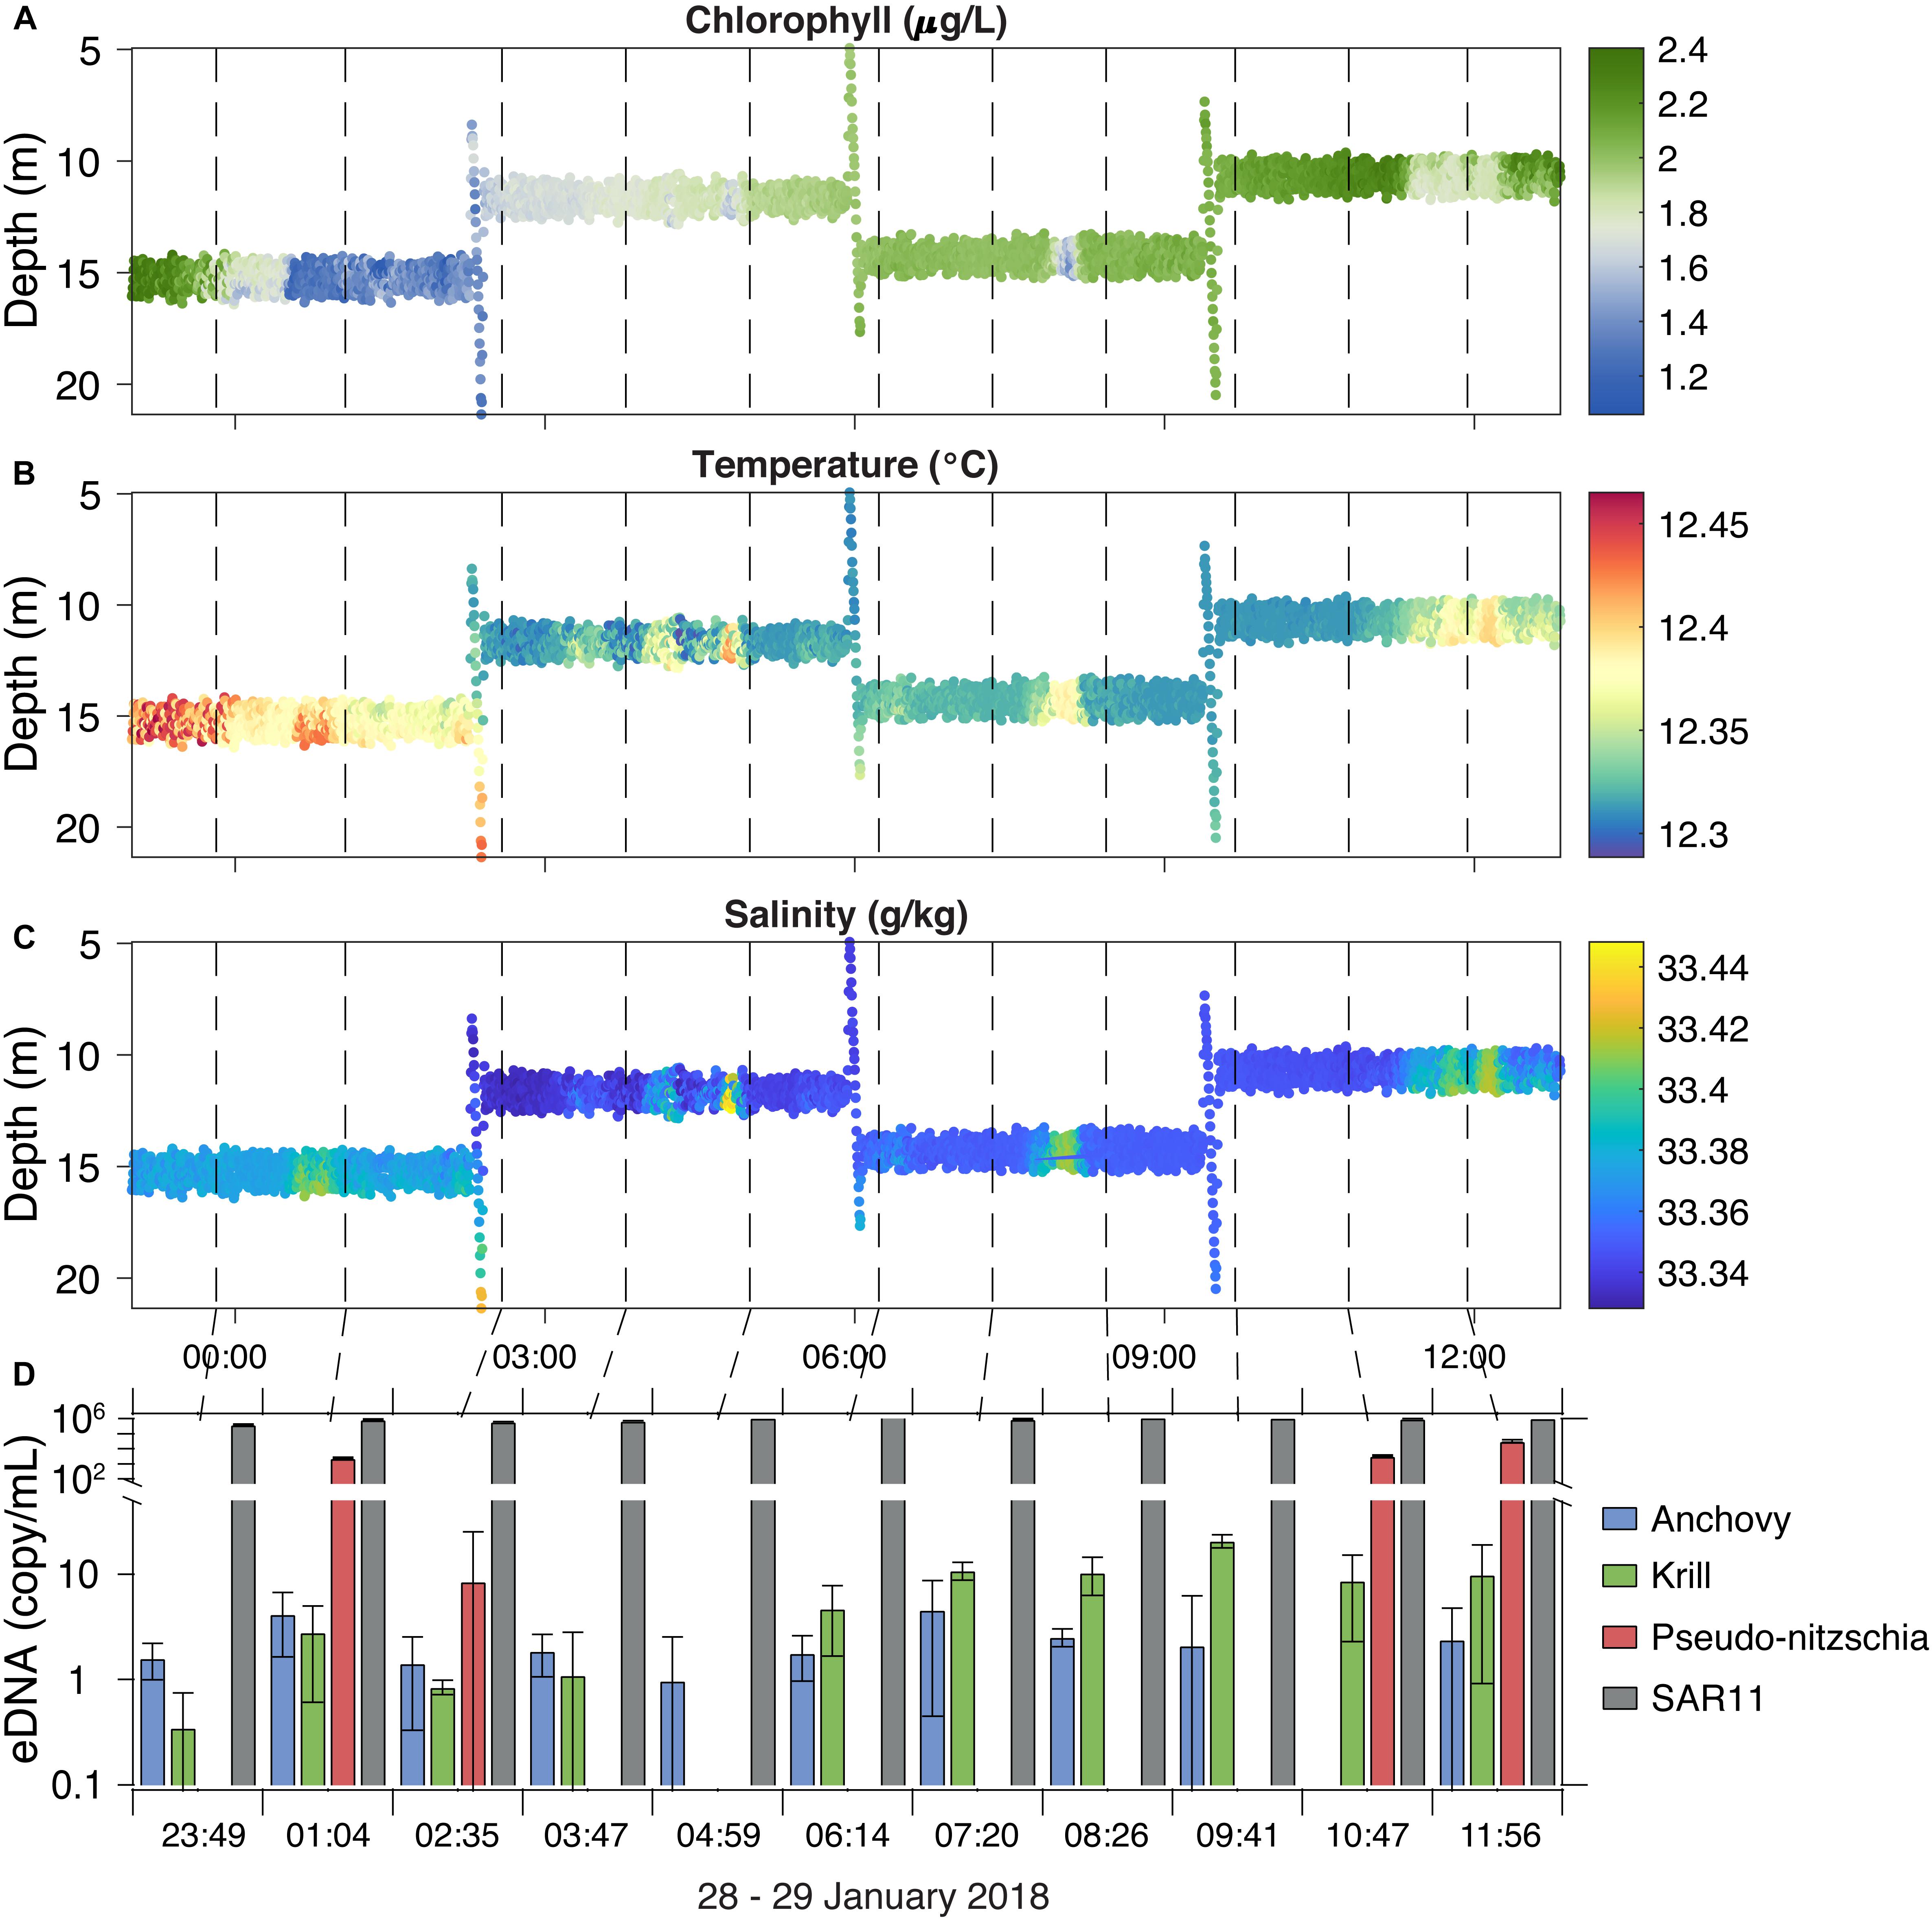
Figure 6. The LRAUV-ESP collected and preserved 11 samples in situ over a 12-h time period in January 2018 (dashed lines) while deployed outside Monterey Bay, CA. LRAUV contextual sensor data includes chlorophyll (A), temperature (B), and salinity (C) along with corresponding taxa eDNA concentrations (D). Error bars represent 95% confidence intervals.
The ESP can successfully filter and preserve water samples for downstream eDNA analyses, extending the archival/preservation capabilities of the ESP, which has previously been used for RNA and DNA investigations of aquatic microbes (Ottesen et al., 2011, 2014; Herfort et al., 2016). Despite previous failures of eDNA preservation with RNAlater® (Renshaw et al., 2015; Spens et al., 2017), this study provides evidence that RNAlater® can be successfully used to preserve eDNA sample filters for up to 21 days. Combined, these results provide validation of the ESP for eDNA collection and its potential application in the management of rare or low density species for conservation (Baker et al., 2018; Lafferty et al., 2018) and biodiversity observatory purposes (Goodwin et al., 2017; Muller-Karger et al., 2018). Overall, the ESP offers advantages and limitations that must be considered given the specific eDNA study and the resource management issue in question.
The similarity of eDNA concentrations between direct comparison samples demonstrates that the ESP-derived observations are comparable to what is achieved with well-established manual methods. Similar to previous eDNA filtration and preservation comparison studies, statistical inferences were drawn from a limited number of samples (Eichmiller et al., 2016; Djurhuus et al., 2017; Hinlo et al., 2017). Given the low sample number and inherent variability associated with eDNA in environmental samples (Barnes et al., 2014; Sassoubre et al., 2016; Andruszkiewicz et al., 2017), it would be preferable to include additional samples for increased statistical robustness in order to establish equivalency between the methods (Borman et al., 2009). However, we utilized four different assays targeting a range of taxa and eDNA concentrations, and all demonstrated concurrence between the ESP and traditional manual methods.
For the indirect comparisons, the limited number of samples (n = 4) do not allow for making significant statistical inferences from the data. The results reported here suggest that LRAUV-ESP collected samples provide eDNA concentrations comparable to traditional ship-based CTD sample collections. In contrast, small scale patchiness of eDNA have been previously observed in vertebrate metabarcoding studies within Monterey Bay (Andruszkiewicz et al., 2017). In the future, as ESP technology is applied to eDNA studies; larger sample sizes, additional analyses (e.g., metabarcoding) and additional field deployments will establish a more robust equivalency of the ESP to traditional samples methods.
We examined eDNA concentrations by qPCR in order to quantitatively assess the performance of each sampling and processing method. A more exhaustive approach would have utilized both metabarcoding and qPCR analyses for our methods comparison (Lacoursière-Roussel et al., 2016; Harper et al., 2018). The metabarcoding sequencing approach could provide a passive monitoring approach for biodiversity assessments with the ability to detect rare marine organisms (Lacoursière-Roussel et al., 2016; Blackman et al., 2017), but was beyond the scope of this study. The qPCR results provide quantification of target organisms across multiple trophic levels and over a range of eDNA concentrations. Importantly, we show that the ESP captures DNA from abundant microbes (SAR11), harmful algae (Pseudo-nitzchia), key prey species (krill), and forage fish (anchovies).
RNAlater® is an effective preservative for use with the ESP, resulting in recoverable eDNA from a range of taxa, as well as potential sample storage times indicative of a typical LRAUV deployment (up to 21 days). These results are similar to previous studies that utilized 2G ESP-based approaches for metatranscriptomic (Ottesen et al., 2011) and proteomic studies (Saito et al., 2011) for marine microorganisms. While RNAlater® was developed for the stabilization of cellular RNA, other studies have shown its effectiveness as a preservative for DNA (Gorokhova, 2005). In contrast, Renshaw et al. (2015) and Spens et al. (2017), reported inhibition of downstream PCR amplification from RNAlater®-preserved eDNA samples. This may be explained by different combinations of preservation and extraction methodologies, as Simister et al., has shown that DNA yield is impacted by the choice of preservation and extraction method (Simister et al., 2011). For example, the ESP preservation protocol purges RNAlater® from filters after the incubation, rendering a moist filter with very little RNAlater® carryover. This protocol may positively impact subsequent DNA extractions and PCR amplifications. Additional research should confirm these findings and compare these results to traditional eDNA preservatives combined with different extraction methods. Moreover, researchers need to account for the chemical compatibility of preservatives and nucleic acid extraction methods when utilizing them for environmental samples, such as eDNA filters. These results suggest that the use of RNAlater® may be a more versatile preservative than traditional eDNA preservative methods, such as ethanol or Longmire’s solution (Renshaw et al., 2015; Minamoto et al., 2016; Williams et al., 2016). A preservative allowing for DNA, RNA and proteins to be co-extracted from a single sample may pave the way for future research coupling eDNA and eRNA in gene expression studies and community level processes (Laroche et al., 2017; Pochon et al., 2017).
A primary concern with automated sampling systems is carry-over contamination between independent samples. In this study, instrument pre-deployment (prior to environmental sampling) and post-deployment (after recovering the instrument) negative controls were utilized to assess instrument sterility. SAR11 DNA was observed in the post-deployment negative controls on the 3G ESP and is likely a result of carry over contamination from inadequate cleaning of the sampling fluidic paths (Figure 2, intake through toroid valve and out of the exhaust). SAR11 is the most abundant bacterioplankton in the world’s oceans (Giovannoni, 2017) and relative to the concentrations observed during the LRAUV-ESP deployment (mean 9.7 × 10⁵ copies/mL), only a small percentage (0.34%) of SAR11 DNA was found in the post-deployment negative controls. Regardless, this result suggests the need to improve decontamination protocols between samples within the ESP instrumentation to prevent sample carry-over and biofouling, particularly for extended deployments and metabarcoding applications. This is of particular concern to reduce the risk of potential false positives in eDNA studies. Future studies incorporating robotic sampling devices for eDNA should also consider the appropriate controls for assessing contamination during instrument operations.
Coupling the use of eDNA analyses to advances in marine robotics will usher in a new era for studying ecosystem processes and perhaps provide new ways of collecting biological data that is akin to the physical and chemical sensor data already being collected in the ocean. For example, utilization of drones for eDNA sample collection has been previously reported using an unmanned aerial vehicle (UAV) in a freshwater reservoir (Doi et al., 2017). Hoffmann et al. (2016) provides a concept of utilizing a hydroplane drone for improved sample collection with less effort. In this study we take the next step in enhancing eDNA sample collections and biological observations by utilizing the ESP to collect and preserve multiple samples remotely on a mobile platform (LRAUV). These sample collections are coupled with oceanographic feature finding algorithms that allow the vehicle to search for and target specific water masses for complete autonomous sampling. During the 12-h sample collection series, we demonstrated fine-scale temporal (∼1 h) resolution and the ability to couple physio-chemical measurements to eDNA densities. The integration of these types of data offer an opportunity to conduct novel observations that are either difficult or impractical to accomplish using traditional ship-based sampling.
Ship- and shore-based manual sampling methods constrain most field sampling to weekly visitations at best (Bista et al., 2017; Sigsgaard et al., 2017; Stoeckle et al., 2017, 2018). To our knowledge, only a few studies have reported hourly or high-frequency sampling over short durations to investigate the effects tides (Kelly et al., 2018) or spawning events (Tillotson et al., 2018) have on eDNA signals. High-frequency sampling, as provided by the ESP, will be needed to investigate fine scale temporal variations associated with such phenomena as diel cycles, vertical migrations of marine organisms, or the persistence of eDNA signatures with respect to both space and time. Moreover, mobile autonomous sampling provides the ability to make biological observations around a bounded region (e.g., marine preserves) and establish links between organisms and local ecosystem processes. Autonomous sampling instrumentation may also provide value to freshwater studies of eDNA, where sample collection and preservation is often conducted at remote field sites (Goldberg et al., 2015). This study demonstrates that the 3G ESP could be useful to meet that need.
To our knowledge, this is the first report of successfully collecting and preserving eDNA using an in situ autonomous mobile instrument, the LRAUV-ESP. Furthermore, the emergent adaptive sampling capabilities of the LRAUV can be used to guide autonomous eDNA sample collection remotely absent a human presence. Advances in the shore-side eDNA analytical methods should also be met by investments in sample processing and collection methods with the goal of meeting the needs of the resource and conservation management community. To that end, we are working to improve upon existing instrumentation by incorporating new decontamination protocols between sample collection events, integrating in situ detection technologies (Preston et al., 2011; Ussler et al., 2013; Yamahara et al., 2015), and exploring terrestrial-based deployment scenarios (Yamahara et al., 2015; Herfort et al., 2016). In the future, we foresee fleets of remotely operated, mobile autonomous samplers and ecogenomic sensors, like the 3G ESP, that will allow investigators to observe complex biological processes at fine-scale temporal and spatial resolutions that are not possible to accomplish today.
The datasets generated for this study are available on request to the corresponding author.
KY, CP, JB, CS, FC, and KG conceived the study. KY, CP, and KW collected the samples and performed the laboratory analyses. KY, CP, RM, SJ, DP, BR, and WU developed, prepared, and operated the ESP during this study. YZ, JR, BH, BK, and BR prepared and deployed the LRAUV. KY, CP, and JB drafted the manuscript. JR and YZ prepared the LRAUV figures. All authors revised and edited the final version of the manuscript.
This work was supported by funds from the David and Lucile Packard Foundation, the NOAA Omics Program, and the NASA grant NNX14AP62A “National Marine Sanctuaries as Sentinel Sites for a Demonstration Marine Biodiversity Observation Network (MBON)” funded under the National Ocean Partnership Program (NOPP RFP NOAA-NOS-IOOS-2014-2003803 in partnership between the NOAA, the BOEM, and the NASA), and the U.S. Integrated Ocean Observing System (IOOS) Program Office.
The authors declare that the research was conducted in the absence of any commercial or financial relationships that could be construed as a potential conflict of interest.
We would like to thank the engineers, technicians, and machinists at the MBARI for their expertise and dedication during the development of the ESP instrumentation. We would also like to thank the crew of the R/V Rachel Carson, Western Flyer, and Paragon for their help in sample collection and deployment of the ESP. We thank Kyle Van Houtan, Sue Lisin, and John Hoech at the Monterey Bay Aquarium for providing access to the exhibits, and George Matsumoto at the MBARI for facilitating sampling.
The Supplementary Material for this article can be found online at: https://www.frontiersin.org/articles/10.3389/fmars.2019.00373/full#supplementary-material
Andruszkiewicz, E. A., Starks, H. A., Chavez, F. P., Sassoubre, L. M., Block, B. A., and Boehm, A. B. (2017). Biomonitoring of marine vertebrates in Monterey Bay using eDNA metabarcoding. PLoS One 12:e0176343. doi: 10.1371/journal.pone.0176343
Aylward, F. O., Eppley, J. M., Smith, J. M., Chavez, F. P., Scholin, C. A., and DeLong, E. F. (2015). Microbial community transcriptional networks are conserved in three domains at ocean basin scales. Proc. Natl. Acad. Sci. 112, 5443–5448. doi: 10.1073/pnas.1502883112
Baker, C. S., Steel, D., Nieukirk, S., and Klinck, H. (2018). Environmental DNA (eDNA) from the wake of the whales: droplet digital PCR for detection and species identification. Front. Mar. Sci. 5:133. doi: 10.3389/fmars.2018.00133
Barnes, M. A., Turner, C. R., Jerde, C. L., Renshaw, M. A., Chadderton, W. L., and Lodge, D. M. (2014). Environmental conditions influence eDNA persistence in aquatic systems. Environ. Sci. Technol. 48, 1819–1827. doi: 10.1021/es404734p
Bista, I., Carvalho, G. R., Walsh, K., Seymour, M., Hajibabaei, M., Lallias, D., et al. (2017). Annual time-series analysis of aqueous eDNA reveals ecologically relevant dynamics of lake ecosystem biodiversity. Nat. Commun. 8, 1–11. doi: 10.1038/ncomms14087
Blackman, R. C., Constable, D., Hahn, C., Sheard, A. M., Durkota, J., Hänfling, B., et al. (2017). Detection of a new non-native freshwater species by DNA metabarcoding of environmental samples – first record of gammarus fossarum in the UK. Aquat. Invasions 12, 177–189. doi: 10.3391/ai.2017.12.2.06
Bohmann, K., Evans, A., Gilbert, M. T. P., Carvalho, G. R., Creer, S., Knapp, M., et al. (2014). Environmental DNA for wildlife biology and biodiversity monitoring. Trends Ecol. Evol. 29, 358–367. doi: 10.1016/j.tree.2014.04.003
Borman, P. J., Chatfield, M. J., Damjanov, I., and Jackson, P. (2009). Design and analysis of method equivalence studies. Anal. Chem. 81, 9849–9857. doi: 10.1021/ac901945f
Bowers, H. A., Ryan, J. P., Hayashi, K., Woods, A. L., Marin, R., Smith, G. J., et al. (2018). Diversity and toxicity of Pseudo-nitzschia species in Monterey Bay: perspectives from targeted and adaptive sampling. Harmful Algae. 78, 129–141. doi: 10.1016/j.hal.2018.08.006
Deiner, K., Bik, H. M., Mächler, E., Seymour, M., Lacoursière-Roussel, A., Altermatt, F., et al. (2017). Environmental DNA metabarcoding: transforming how we survey animal and plant communities. Mol. Ecol. 26, 5872–5895. doi: 10.1111/mec.14350
Djurhuus, A., Port, J., Closek, C. J., Yamahara, K. M., Romero-Maraccini, O., Walz, K. R., et al. (2017). Evaluation of filtration and DNA extraction methods for environmental DNA biodiversity assessments across multiple trophic levels. Front. Mar. Sci. 4:314. doi: 10.3389/fmars.2017.00314
Doi, H., Akamatsu, Y., Watanabe, Y., Goto, M., Inui, R., Katano, I., et al. (2017). Water sampling for environmental DNA surveys by using an unmanned aerial vehicle. Limnol. Oceanogr. Methods 15, 939–944. doi: 10.1002/lom3.10214
Doucette, G. J., Mikulski, C. M., Jones, K. L., King, K. L., Greenfield, D. I., Marin, R., et al. (2009). Remote, subsurface detection of the algal toxin domoic acid onboard the environmental sample processor: assay development and field trials. Harmful Algae 8, 880–888. doi: 10.1016/j.hal.2009.04.006
Eichmiller, J. J., Miller, L. M., and Sorensen, P. W. (2016). Optimizing techniques to capture and extract environmental DNA for detection and quantification of fish. Mol. Ecol. Resour. 16, 56–68. doi: 10.1111/1755-0998.12421
Evans, N. T., Shirey, P. D., Wieringa, J. G., Mahon, A. R., and Lamberti, G. A. (2017). Comparative cost and effort of fish distribution detection via environmental DNA analysis and electrofishing. Fisheries 42, 90–99. doi: 10.1080/03632415.2017.1276329
Ficetola, G. F., Miaud, C., Pompanon, F., and Taberlet, P. (2008). Species detection using environmental DNA from water samples. Biol. Lett. 4, 423–425. doi: 10.1098/rsbl.2008.0118
Fitzpatrick, E., Caron, D. A., and Schnetzer, A. (2010). Development and environmental application of a genus-specific quantitative PCR approach for Pseudo-nitzschia species. Mar. Biol. 157, 1161–1169. doi: 10.1007/s00227-009-1383-y
Giovannoni, S. J. (2017). SAR11 Bacteria: the most abundant plankton in the oceans. Ann. Rev. Mar. Sci. 9, 231–255. doi: 10.1146/annurev-marine-010814-015934
Goldberg, C. S., Strickler, K. M., and Pilliod, D. S. (2015). Moving environmental DNA methods from concept to practice for monitoring aquatic macroorganisms. Biol. Conserv. 183, 1–3. doi: 10.1016/j.biocon.2014.11.040
Goldberg, C. S., Turner, C. R., Deiner, K., Klymus, K. E., Thomsen, P. F., Murphy, M. A., et al. (2016). Critical considerations for the application of environmental DNA methods to detect aquatic species. Methods Ecol. Evol. 7, 1299–1307. doi: 10.1111/2041-210X.12595
Goodwin, K. D., Thompson, L. R., Duarte, B., Kahlke, T., Thompson, A. R., Marques, J. C., et al. (2017). DNA Sequencing as a Tool to Monitor Marine Ecological Status. Front. Mar. Sci. 4:107. doi: 10.3389/fmars.2017.00107
Gorokhova, E. (2005). Effects of preservation and storage of microcrustaceans in RNAlater on RNA and DNA degradation. Limnol. Oceanogr. Methods 3, 143–148. doi: 10.4319/lom.2005.3.143
Govindarajan, A. F., Pineda, J., Purcell, M., and Breier, J. A. (2015). Species- and stage-specific barnacle larval distributions obtained from AUV sampling and genetic analysis in Buzzards Bay, Massachusetts, USA. J. Exp. Mar. Bio. Ecol. 472, 158–165. doi: 10.1016/j.jembe.2015.07.012
Harper, L. R., Lawson Handley, L., Hahn, C., Boonham, N., Rees, H. C., Gough, K. C., et al. (2018). Needle in a haystack? A comparison of eDNA metabarcoding and targeted qPCR for detection of the great crested newt (Triturus cristatus). Ecol. Evol. 8, 6330–6341. doi: 10.1002/ece3.4013
Herfort, L., Seaton, C., Wilkin, M., Roman, B., Preston, C. M., Marin, R., et al. (2016). Use of continuous, real-time observations and model simulations to achieve autonomous, adaptive sampling of microbial processes with a robotic sampler. Limnol. Oceanogr. Methods 14, 50–67. doi: 10.1002/lom3.10069
Hinlo, R., Gleeson, D., Lintermans, M., and Furlan, E. (2017). Methods to maximise recovery of environmental DNA from water samples. PLoS One 12:e0179251. doi: 10.1371/journal.pone.0179251
Hobson, B. W., Bellingham, J. G., Kieft, B., McEwen, R., Godin, M., and Zhang, Y. (2012). “Tethys-class long range AUVs-extending the endurance of propeller-driven cruising AUVs from days to weeks,” in Proceedings of the 2012 IEEE/OES Autonomous Underwater Vehicles Conference, (Southampton: IEEE).
Hoffmann, C., Schubert, G., and Calvignac-Spencer, S. (2016). Aquatic biodiversity assessment for the lazy. Mol. Ecol. 25, 846–848. doi: 10.1111/mec.13535
Hopkins, G. W., and Freckleton, R. P. (2002). Declines in the numbers of amateur and professional taxonomists: implications for conservation. Anim. Conserv. 5, 245–249. doi: 10.1017/S1367943002002299
Jerde, C. L., Wilson, E. A., and Dressler, T. L. (2019). Measuring global fish species richness with eDNA metabarcoding. Mol. Ecol. Resour. 19, 19–22. doi: 10.1111/1755-0998.12929
Jones, J. B. (1992). Environmental impact of trawling on the seabed: a review. New Zeal. J. Mar. Freshw. Res. 26, 59–67. doi: 10.1080/00288330.1992.9516500
Kelly, R. P., Closek, C. J., O’Donnell, J. L., Kralj, J. E., Shelton, A. O., and Samhouri, J. F. (2017). Genetic and manual survey methods yield different and complementary views of an ecosystem. Front. Mar. Sci. 3:283. doi: 10.3389/fmars.2016.00283
Kelly, R. P., Gallego, R., and Jacobs-Palmer, E. (2018). The effect of tides on nearshore environmental DNA. PeerJ 6:e4521. doi: 10.7717/peerj.4521
Lacoursière-Roussel, A., Rosabal, M., and Bernatchez, L. (2016). Estimating fish abundance and biomass from eDNA concentrations: variability among capture methods and environmental conditions. Mol. Ecol. Resour. 16, 1401–1414. doi: 10.1111/1755-0998.12522
Lafferty, K. D., Benesh, K. C., Mahon, A. R., Jerde, C. L., and Lowe, C. G. (2018). Detecting Southern California’s White Sharks With Environmental DNA. Front. Mar. Sci. 5:355. doi: 10.3389/fmars.2018.00355
Laroche, O., Wood, S. A., Tremblay, L. A., Lear, G., Ellis, J. I., and Pochon, X. (2017). Metabarcoding monitoring analysis: the pros and cons of using co-extracted environmental DNA and RNA data to assess offshore oil production impacts on benthic communities. PeerJ 5:e3347. doi: 10.7717/peerj.3347
Miloslavich, P., Bax, N. J., Simmons, S. E., Klein, E., Appeltans, W., Aburto-Oropeza, O., et al. (2018). Essential ocean variables for global sustained observations of biodiversity and ecosystem changes. Glob. Chang. Biol. 24, 2416–2433. doi: 10.1111/gcb.14108
Minamoto, T., Naka, T., Moji, K., and Maruyama, A. (2016). Techniques for the practical collection of environmental DNA: filter selection, preservation, and extraction. Limnology 17, 23–32. doi: 10.1007/s10201-015-0457-454
Muller-Karger, F. E., Miloslavich, P., Bax, N. J., Simmons, S., Costello, M. J., Sousa Pinto, I., et al. (2018). Advancing Marine Biological Observations and Data Requirements of the Complementary Essential Ocean Variables (EOVs) and Essential Biodiversity Variables (EBVs) Frameworks. Front. Mar. Sci. 5:211. doi: 10.3389/fmars.2018.00211
Ottesen, E. A., Marin, R., Preston, C. M., Young, C. R., Ryan, J. P., Scholin, C. A., et al. (2011). Metatranscriptomic analysis of autonomously collected and preserved marine bacterioplankton. ISME J 5, 1881–1895. doi: 10.1038/ismej.2011.70
Ottesen, E. A., Young, C. R., Gifford, S. M., Eppley, J. M., Marin, R., Schuster, S. C., et al. (2014). Multispecies diel transcriptional oscillations in open ocean heterotrophic bacterial assemblages. Science 345, 207–212. doi: 10.1126/science.1252476
Pargett, D. M., Birch, J. M., Preston, C. M., Ryan, J. P., Zhang, Y., and Scholin, C. A. (2015). “Development of a mobile ecogenomic sensor,” in Proceedings of the OCEANS 2015 conference, (Washington, WA: MTS/IEEE), 1–6.
Pereira, H. M., Ferrier, S., Walters, M., and Al, E. (2013). Essential biodiversity variables. Science 339, 277–279. doi: 10.1126/science.1229931
Pochon, X., Zaiko, A., Fletcher, L. M., Laroche, O., and Wood, S. A. (2017). Wanted dead or alive? Using metabarcoding of environmental DNA and RNA to distinguish living assemblages for biosecurity applications. PLoS One 12:e0187636. doi: 10.1371/journal.pone.0187636
Port, J. A., O’Donnell, J. L., Romero-Maraccini, O. C., Leary, P. R., Litvin, S. Y., Nickols, K. J., et al. (2016). Assessing vertebrate biodiversity in a kelp forest ecosystem using environmental DNA. Mol. Ecol. 25, 527–541. doi: 10.1111/mec.13481
Preston, C. M., Harris, A., Ryan, J. P., Roman, B., Marin, R., Jensen, S., et al. (2011). Underwater application of quantitative PCR on an Ccean Mooring. PLoS One 6:e22522. doi: 10.1371/journal.pone.0022522
Preston, C. M., Marin, R., Jensen, S. D., Feldman, J., Birch, J. M., Massion, E. I., et al. (2009). Near real-time, autonomous detection of marine bacterioplankton on a coastal mooring in Monterey Bay, California, using rRNA-targeted DNA probes. Environ. Microbiol. 11, 1168–1180. doi: 10.1111/j.1462-2920.2009.01848.x
R Core Team (2017). R: A Language and Environment for Statistical Computing. Vienna: R Foundation for Statistical Computing. Available at: https://www.r-project.org/
Renshaw, M. A., Olds, B. P., Jerde, C. L., Mcveigh, M. M., and Lodge, D. M. (2015). The room temperature preservation of filtered environmental DNA samples and assimilation into a phenol-chloroform-isoamyl alcohol DNA extraction. Mol. Ecol. Resour. 15, 168–176. doi: 10.1111/1755-0998.12281
Robidart, J. C., Church, M. J., Ryan, J. P., Ascani, F., Wilson, S. T., Bombar, D., et al. (2014). Ecogenomic sensor reveals controls on N2-fixing microorganisms in the North Pacific Ocean. ISME J. 8, 1175–1185. doi: 10.1038/ismej.2013.244
Ryan, J., Greenfield, D., Marin, I., Preston, C., Roman, B., Jensen, S., et al. (2011). Harmful phytoplankton ecology studies using an autonomous molecular analytical and ocean observing network. Limnol. Oceanogr. 56, 1255–1272. doi: 10.4319/lo.2011.56.4.1255
Saito, M. A., Bulygin, V. V., Moran, D. M., Taylor, C., and Scholin, C. (2011). Examination of microbial proteome preservation techniques applicable to autonomous environmental sample collection. Front. Microbiol. 2:215. doi: 10.3389/fmicb.2011.00215
Sassoubre, L. M., Yamahara, K. M., Gardner, L. D., Block, B. A., and Boehm, A. B. (2016). Quantification of Environmental DNA (eDNA) Shedding and Decay Rates for Three Marine Fish. Environ. Sci. Technol. 50, 10456–10464. doi: 10.1021/acs.est.6b03114
Scholin, C. A., Birch, J., Jensen, S., Landing, R. M. I., Massion, E., Pargett, D., et al. (2017). The Quest to Develop Ecogenomic Sensors: a 25-year history of the environmental sample processor (ESP) as a case study. Oceanography 30, 100–113. doi: 10.5670/oceanog.2017.427
Sigsgaard, E. E., Nielsen, I. B., Carl, H., Krag, M. A., Knudsen, S. W., Xing, Y., et al. (2017). Seawater environmental DNA reflects seasonality of a coastal fish community. Mar. Biol. 164, 1–15. doi: 10.1007/s00227-017-3147-3144
Simister, R. L., Schmitt, S., and Taylor, M. W. (2011). Evaluating methods for the preservation and extraction of DNA and RNA for analysis of microbial communities in marine sponges. J. Exp. Mar. Bio. Ecol. 397, 38–43. doi: 10.1016/j.jembe.2010.11.004
Simmons, M., Tucker, A., Chadderton, W. L., Jerde, C. L., and Mahon, A. R. (2015). Active and passive environmental DNA surveillance of aquatic invasive species. Can. J. Fish. Aquat. Sci. 73, 76–83. doi: 10.1139/cjfas-2015-2262
Spens, J., Evans, A. R., Halfmaerten, D., Knudsen, S. W., Sengupta, M. E., Mak, S. S. T., et al. (2017). Comparison of capture and storage methods for aqueous macrobial eDNA using an optimized extraction protocol: advantage of enclosed filter. Methods Ecol. Evol. 8, 635–645. doi: 10.1111/2041-210X.12683
Stoeckle, M. Y., Mishu, M. D., and Charlop-Powers, Z. (2018). GoFish: a streamlined environmental dna presence/absence assay for marine vertebrates. bioRxiv
Stoeckle, M. Y., Soboleva, L., and Charlop-Powers, Z. (2017). Aquatic environmental DNA detects seasonal fish abundance and habitat preference in an urban estuary. PLoS One 12:e0175186. doi: 10.1371/journal.pone.0175186
Suzuki, M. T., Preston, C. M., Chavez, F. P., and DeLong, E. F. (2001). Quantitative mapping of bacterioplankton populations in seawater: field tests across an upwelling plume in Monterey Bay. Aquat. Microb. Ecol. 24, 117–127. doi: 10.3354/ame024117
Taberlet, P., Bonin, A., Zinger, L., and Coissac, E. (2018). Environmental DNA: For Biodiversity Research and Monitoring. Oxford: Oxford University Press, doi: 10.1093/oso/9780198767220.001.0001
Taylor, C. D., Edgcomb, V. P., Doherty, K. W., Engstrom, I., Shanahan, T., Pachiadaki, M. G., et al. (2015). Fixation filter, device for the rapid in situ preservation of particulate samples. Deep Sea Res. Part I Oceanogr. Res. Pap. 96, 69–79. doi: 10.1016/j.dsr.2014.09.006
Thomsen, P. F., Kielgast, J., Iversen, L. L., Møller, P. R., Rasmussen, M., and Willerslev, E. (2012). Detection of a diverse marine fish fauna using environmental dna from seawater samples. PLoS One 7:e41732. doi: 10.1371/journal.pone.0041732
Thomsen, P. F., and Willerslev, E. (2015). Environmental DNA - An emerging tool in conservation for monitoring past and present biodiversity. Biol. Conserv. 183, 4–18. doi: 10.1016/j.biocon.2014.11.019
Tillotson, M. D., Kelly, R. P., Duda, J. J., Hoy, M., Kralj, J., and Quinn, T. P. (2018). Concentrations of environmental DNA (eDNA) reflect spawning salmon abundance at fine spatial and temporal scales. Biol. Conserv. 220, 1–11. doi: 10.1016/j.biocon.2018.01.030
Ussler, W., Preston, C., Tavormina, P., Pargett, D., Jensen, S., Roman, B., et al. (2013). Autonomous application of quantitative PCR in the deep sea: in situ surveys of aerobic methanotrophs using the deep-sea environmental sample processor. Environ. Sci. Technol. 47, 9339–9346. doi: 10.1021/es4023199
Uthicke, S., Lamare, M., and Doyle, J. R. (2018). eDNA detection of corallivorous seastar (Acanthaster cf. solaris) outbreaks on the Great Barrier Reef using digital droplet PCR. Coral Reefs 37, 1229–1239. doi: 10.1007/s00338-018-1734-6
Valentini, A., Taberlet, P., Miaud, C., Civade, R., Herder, J., Thomsen, P. F., et al. (2016). Next-generation monitoring of aquatic biodiversity using environmental DNA metabarcoding. Mol. Ecol. 25, 929–942. doi: 10.1111/mec.13428
Walsh, D. A., Zaikova, E., and Hallam, S. J. (2009). Small volume (1-3L) filtration of coastal seawater samples. J. Vis. Exp. 28, 1163. doi: 10.3791/1163
Wheeler, Q. D., Raven, P. H., and Wilson, E. O. (2004). Taxonomy: impediment or expedient? Science 303:285. doi: 10.1126/science.303.5656.285
Williams, K. E., Huyvaert, K. P., and Piaggio, A. J. (2016). No filters, no fridges: a method for preservation of water samples for eDNA analysis. BMC Res. Notes 9:298. doi: 10.1186/s13104-016-2104-2105
Yamahara, K. M., Demir-Hilton, E., Preston, C. M., Marin, R., Pargett, D., Roman, B., et al. (2015). Simultaneous monitoring of faecal indicators and harmful algae using an in-situ autonomous sensor. Lett. Appl. Microbiol. 61, 130–138. doi: 10.1111/lam.12432
Yamamoto, S., Masuda, R., Sato, Y., Sado, T., Araki, H., Kondoh, M., et al. (2017). Environmental DNA metabarcoding reveals local fish communities in a species-rich coastal sea. Sci. Rep. 7:40368. doi: 10.1038/srep40368
Keywords: environmental DNA, eDNA, ecogenomic sensor, biosensors, AUV
Citation: Yamahara KM, Preston CM, Birch J, Walz K, Marin R III, Jensen S, Pargett D, Roman B, Ussler W III, Zhang Y, Ryan J, Hobson B, Kieft B, Raanan B, Goodwin KD, Chavez FP and Scholin C (2019) In situ Autonomous Acquisition and Preservation of Marine Environmental DNA Using an Autonomous Underwater Vehicle. Front. Mar. Sci. 6:373. doi: 10.3389/fmars.2019.00373
Received: 03 April 2019; Accepted: 17 June 2019;
Published: 16 July 2019.
Edited by:
Haiwei Luo, The Chinese University of Hong Kong, ChinaReviewed by:
Christopher L. Jerde, University of California, Santa Barbara, United StatesCopyright © 2019 Yamahara, Preston, Birch, Walz, Marin, Jensen, Pargett, Roman, Ussler, Zhang, Ryan, Hobson, Kieft, Raanan, Goodwin, Chavez and Scholin. This is an open-access article distributed under the terms of the Creative Commons Attribution License (CC BY). The use, distribution or reproduction in other forums is permitted, provided the original author(s) and the copyright owner(s) are credited and that the original publication in this journal is cited, in accordance with accepted academic practice. No use, distribution or reproduction is permitted which does not comply with these terms.
*Correspondence: Kevan M. Yamahara, a3lhbWFoYXJhQG1iYXJpLm9yZw==
Disclaimer: All claims expressed in this article are solely those of the authors and do not necessarily represent those of their affiliated organizations, or those of the publisher, the editors and the reviewers. Any product that may be evaluated in this article or claim that may be made by its manufacturer is not guaranteed or endorsed by the publisher.
Research integrity at Frontiers
Learn more about the work of our research integrity team to safeguard the quality of each article we publish.