 Claire W. Armstrong
 Naomi S. Foley
 Dag Slagstad
 Melissa Chierici
 Ingrid Ellingsen
 Marit Reigstad
- 1Norwegian College of Fishery Science, University of Tromsø the Arctic University of Norway, Tromsø, Norway
- 2SINTEF Ocean, Trondheim, Norway
- 3Fram Centre, Institute of Marine Research, Tromsø, Norway
- 4Department of Arctic and Marine Biology, University of Tromsø the Arctic University of Norway, Tromsø, Norway
The ocean capacity to store carbon is crucial, and currently absorbs about 25% CO2 supply to the atmosphere. The ability to store carbon has an economic value, but such estimates are not common for ocean environments, and not yet estimated for the Arctic Ocean. With the severe climatic changes in the Arctic Ocean, impacting sea ice and potentially the vertical carbon transport mechanisms, a projection of future changes in Arctic Ocean carbon storage is also of interest. In order to value present and evolving carbon storage in the changing Arctic marine environment we combine an ocean model with an economic analysis. Placing a value on these changes helps articulate the importance of the carbon storage service to society. The standing stock and fluxes of organic and inorganic carbon from the atmosphere, rivers, shelves and through the gateways linking to lower latitudes, and to the deep of the Arctic Ocean are investigated using the physically chemically biologically coupled SINMOD model. To obtain indications of the effect of climate change, trajectories of two IPCC climate scenarios RCP 4.5, and RCP 8.5 from the Max Planck Institute were used for the period 2006–2099. The results show an increase in the net carbon storage in the Arctic Ocean in this time period to be 1.0 and 2.3% in the RCP 4.5 and RCP 8.5 scenarios, respectively. Most of this increase is caused by an increased atmospheric CO2 uptake until 2070. The continued increase in inorganic carbon storage between 2070 and 2099 results from increased horizontal influx from lower latitude marine regions. First estimates of carbon storage values in the Arctic Ocean are calculated using the social cost of carbon (SCC) and carbon market values as two outer bounds from 2019 to 2099, based on the simulated scenarios. We find the Arctic Ocean will over the time period studied increase its storage of carbon to a value of between €27.6 billion and €1 trillion. This paper clearly neglects a multitude of different negative consequences of climate change in the Arctic, but points to the fact that there are also some positive counterbalancing effects.
Introduction
Due to climate change, the Arctic is undergoing rapid transformation (IPCC, 2014; Comiso et al., 2017). The loss of Arctic sea ice is recognized as one of the main indicators of global warming and also affects the ice cover and extent, which shows a decadal decrease of about 13% based on the September minimum extent (Serreze and Stroeve, 2015). Moreover, also the perennial ice cover shows a similar decadal loss of 11% (Comiso et al., 2017). The loss of summer sea ice has amplified the effect of warming, and currently the Arctic warming is taking place 2–3 times faster than global rates (Comiso and Hall, 2014; Meier et al., 2014; Serreze and Stroeve, 2015). Important ecosystem services exist in the Arctic, including fish and seafood, primary production, nutrient cycling and carbon storage1. The reduction in ice cover changes and transforms the services provided in the region, resulting in both benefits and costs, as some services are traded off when new ones emerge (Armstrong and Foley, 2018). Where sea ice once served as an impediment, new opportunities are opening for provisioning services of shipping, fishing and natural resource extraction (Meier et al., 2014), as well as the regulating service of carbon storage. The temporary storage of CO2 in the various components of marine systems provides an important service in regulating atmospheric CO2 concentration since it prevents the absorbed CO2 from immediately contributing to the greenhouse effect thus slowing climate change (Melaku Canu et al., 2015).
The oceans serve as the world’s largest carbon pool, removing about 25% of atmospheric carbon dioxide emitted by human activities from 2000 to 2007 (Bakker et al., 2016). Of all the biological carbon captured, over half is found in marine living organisms (Nellemann et al., 2009). Marine primary production in the Arctic Ocean is reported to have increased over the last decade mainly due to a decrease in the ice cover, and is expected to continue to increase in the future (Babin et al., 2015). With increased primary production, carbon storage is also expected to increase, though there are large possible regional variations mainly due to stratification which inhibits supply of nutrients from deep waters (Barber et al., 2015; Slagstad et al., 2015). The ability to store carbon has an economic value, but such estimates are not common for ocean environments (blue carbon), and not yet estimated for the Arctic Ocean. Applying a monetary value to the forecasted carbon storage informs policy in the future role of Arctic Ocean blue carbon in climate change mitigation while also highlighting the importance of the service to society. The objective of this paper is to project future changes in Arctic Ocean carbon storage and place a monetary value on present and evolving carbon storage. This is achieved using the physically chemically biologically coupled SINMOD model and later combining the model with an economic analysis of societal and market costs of carbon.
The linkages between nature and the economy are often described using the concept of ecosystem services, or flows of value to human societies as a result of the state and quantity of natural capital (TEEB, 2010). Ocean ecosystems provide a number of services including nurseries and fishing grounds, coastal defenses, climate regulation, and recreation. In recent years a number of studies of ecosystem services and values in marine environments have been carried out, though largely focusing on coastal areas (de Groot et al., 2012; Liquete et al., 2013; Beaumont et al., 2014). Valuing ecosystem services captures the dependence of human well-being on natural capital and the flow of services provided, giving input into how to manage human interaction with these environments and to take into account potential trade-offs between services (Armstrong and Foley, 2018). In the Arctic Ocean important services currently exist and new ones are emerging with retreating ice. Though provisioning services of fish are usually the main ecosystem service valued in the oceans (Liquete et al., 2013; Zarate-Barrera and Maldonado, 2015), the focus of this paper are the regulating services that provide benefits via processes taking place in nature. In the Arctic Ocean these services include water circulation and exchange, and gas and climate regulation. Carbon cycling, the carbon exchange that allows Earth to sustain life, is often categorized as a supporting service, i.e., a service that feeds into most direct services from ecosystems, be they provisioning, regulating, or cultural. However, carbon storage, the natural storage of anthropogenic carbon emissions, is also clearly a regulating service that reduces the costs of climate change via absorption of CO2 from the atmosphere. With the changing Arctic an increase in uptake of carbon may be expected due to a rise in primary production and reduced ice cover (Slagstad et al., 2015).
While scientific studies of carbon storage have largely concentrated on terrestrial forests, there is now a “blue carbon” initiative pushing for further recognition of the oceans as a climate mitigating environment providing vital regulating services for the wellbeing of humankind. Economic valuation of “blue carbon” sequestration has focused on coastal areas (Pendleton et al., 2012; Luisetti et al., 2013), and studies of ocean ecosystems in this context are limited (Beaumont et al., 2008; Melaku Canu et al., 2015; Barange et al., 2017; Peled et al., 2018), with none to date valuing the expected increase in primary production in the Arctic Ocean. Peled et al. (2018) value carbon sequestration in the Israeli Mediterranean EEZ. Based on different carbon prices using the social cost of carbon (SCC) they estimate the value ranges between 265.1 and 1270.9 €/km2 per year. Barange et al. (2017) estimate the potential reduction in carbon sequestration for the North Atlantic. Melaku Canu et al. (2015) estimate the value of carbon sequestration ecosystem services in the Mediterranean Sea. The authors develop a model that combines a biogeochemical model describing plankton productivity and carbon biogeochemical cycle with economic valuation using values of the social cost of carbon. They estimate that the carbon sequestration values of the entire Mediterranean basin range between 127 and 1722 million €/year. Alternatively, values per unit area range from 135 to 1000 €/km2. Beaumont et al. (2008) estimate that the value of CO2 sequestration in United Kingdom territorial waters is between £420 million and £8.47 billion. The estimation is based on the standing stock of phytoplankton locking up 0.07Gt carbon per year valued at £6 to £121 per ton carbon. Using a “back of the envelop” approach, Armstrong et al. (2010) estimate the value of the annual flow of carbon into the deep-sea pool and marine sediments world-wide. Using a figure for a net flow of approximately 1600 Tg C per year and valued using the EU emission trading scheme 2009 value of €15 per tCO2e, a value of €88 billion per year is estimated. The study presented here focuses on future storage in the Arctic and its value, based on a coupled hydrodynamic-chemical-biological model, SINMOD, taking atmospheric forcing from a climate global, and IPCC’s prescription of the future CO2 content in the atmosphere.
The primary and secondary production for the Arctic Ocean is investigated with the SINMOD model (Slagstad et al., 2015). To obtain indications of the effect of climate change, trajectories of the IPCC RCP 4.5 and RCP 8.5 (representative concentration pathways) climate scenarios were used, where the latter has greater perturbation magnitudes than the former, and the former stabilizes by the end of this century (Moore et al., 2013). The SINMOD model is coupled with an economic analysis using values assigned to carbon through regulatory markets, the European union emissions trading system (EU ETS), as well as estimates for the social cost of carbon, and SCC establishing a value range to allow for uncertainties when considering such a long timeframe.
We find an increase in the carbon storage of the Arctic Ocean, though this increase is declining toward the end of the century. The change in value depends on the assumed discount rates and price growth rates. The value is also highly uncertain, depending on the underlying climate scenarios, the carbon price used and its change over time, and the discount rate applied. Furthermore, it should be noted that this is a partial study of carbon effects in the Arctic, as clearly there are many other potential benefits and costs of climate change within the Arctic Ocean area, and in relation to its effects upon other parts of the planet (Lindstad et al., 2016; O’Garra, 2017; Yumashev et al., 2017). Another side of the ocean CO2 uptake has resulted in a shift in the ocean’s chemistry, so called, ocean acidification (OA), with potentially detrimental effects on marine ecosystems (Orr et al., 2005; Raven et al., 2005; AMAP, 2018). Model results have shown that the Arctic Ocean is the first to be affected by OA (AMAP, 2013, 2018). This is due to its already low pH and carbonate saturation state, and also the cold waters and sea ice processes favoring CO2 uptake (Chierici and Fransson, 2009; Fransson et al., 2017). However, it is only quite recently that observations support the model results and currently low pH waters spread with increased volume in the Arctic Ocean (Qi et al., 2017).
The remainder of the paper proceeds as follows; the next section presents the Arctic Ocean areas studied, the biophysical SINMOD model and the economic analysis, as well as the data applied in each approach. Results from both analyses are then presented, followed by a discussion and conclusion.
Materials and Methods
In the following we present the case study area, the Arctic Ocean, followed by the biophysical SINMOD model, and the underlying economic analysis.
Case Study Area
In this paper we define the Arctic Ocean as the area limited by the Bering Strait, Canadian Archipelago, Fram Strait and the shelf break at the northern Barents Sea, and Kara Sea and Siberia (green polygon in Figure 1). This covers a surface area of 7.57 × 10⁶ km2 (wet area) and the average depth is 1630 m. From the south, warm Atlantic water enters through the Fram Strait, and the Kara Sea. Pacific water enters through the Bering Strait. Outflow from the Arctic Ocean is mainly through the Canadian Archipelago and Fram Strait. The model domain is shown in Figure 1. For more details see Slagstad et al. (2015).
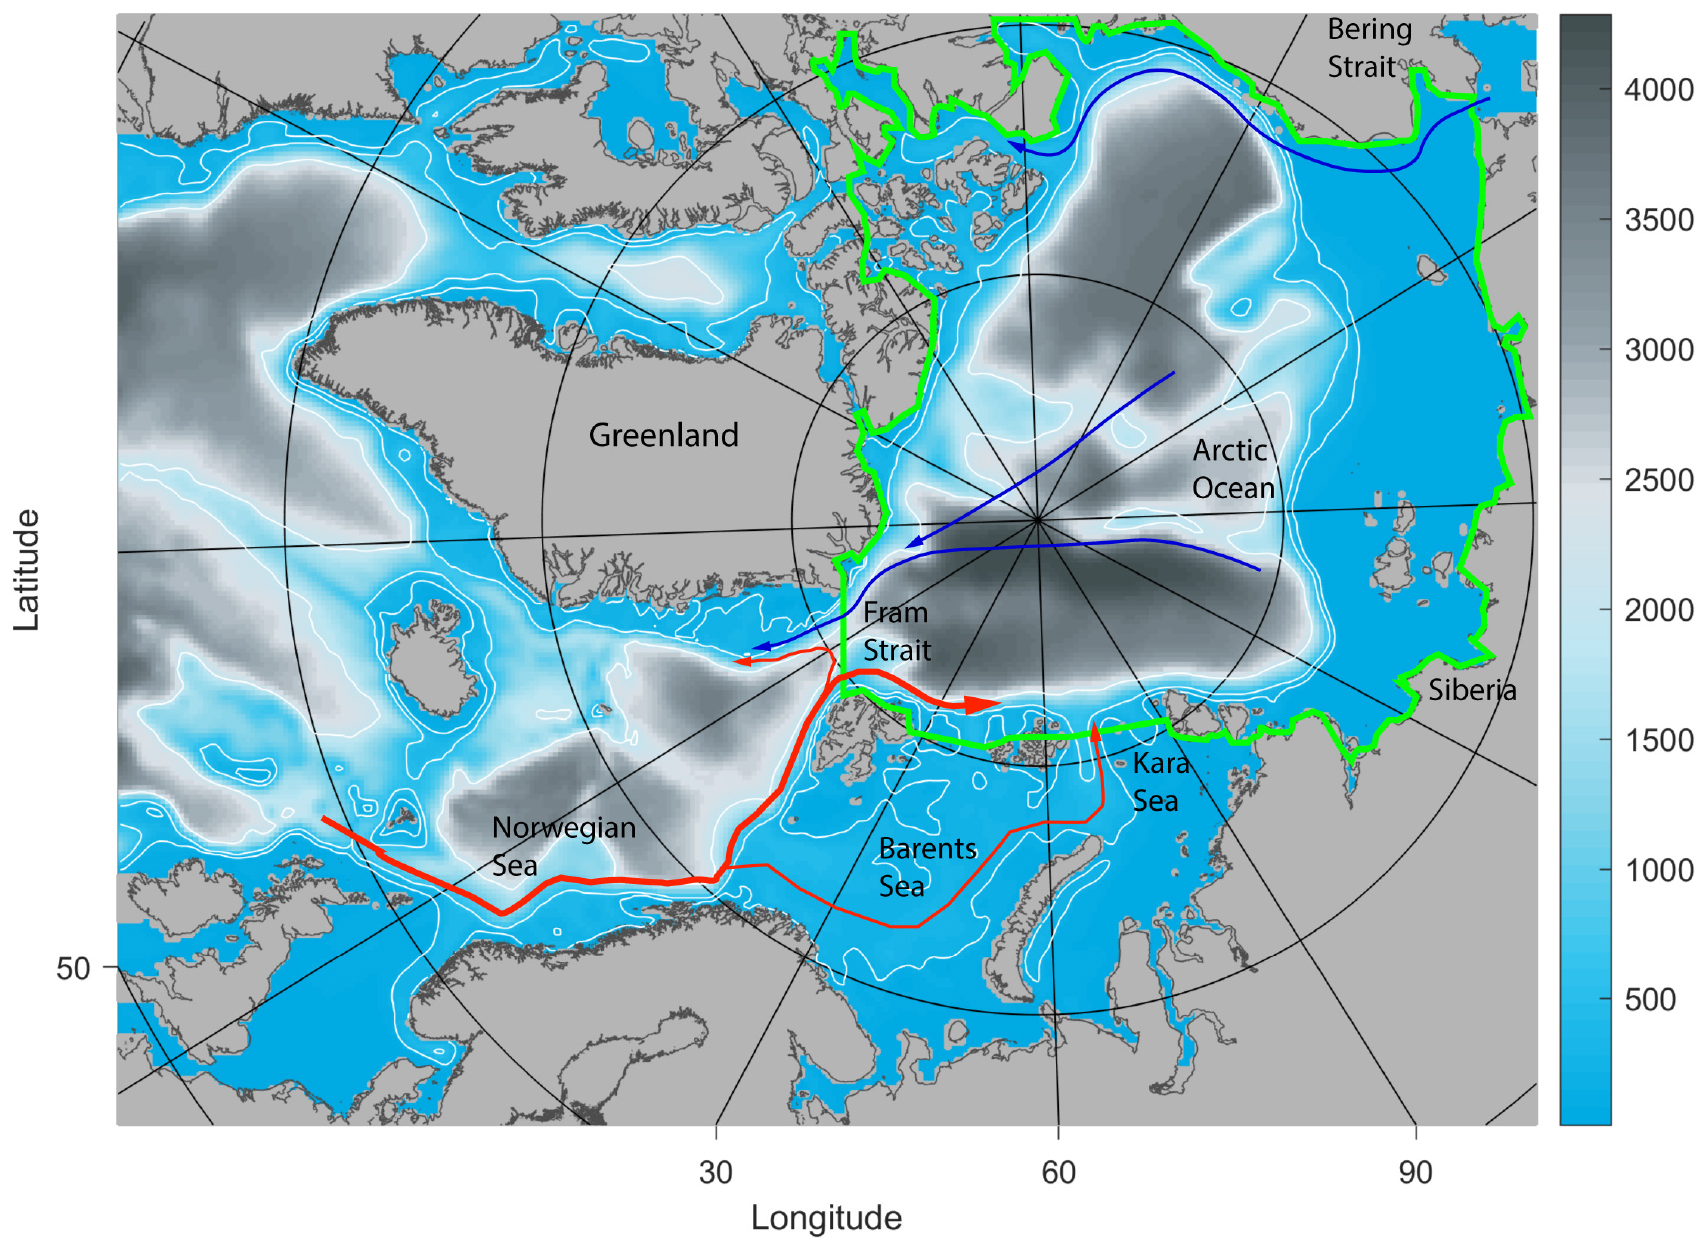
Figure 1. Model domain with depths (m). The relatively warm Atlantic inflow (red) enters the Arctic Ocean through the Fram Strait and the Barents and Kara Seas. Pacific water enters through the Bering Strait. Surface Arctic water (blue) leaves the Arctic through the Canadian Archipelago and Fram Strait. The green polygon shows the area that is analyzed in this paper.
So far, estimates of sea-air CO2 fluxes during the Arctic summer have shown that the Arctic Ocean (including the Barents and Kara Seas) acts as a net annual atmospheric CO2 sink, estimated to be about 180 ± 130 TgC.
SINMOD Model Description
The modeling tool (SINMOD) used in this work is a coupled hydrodynamic and ecological model system including a carbon chemistry module. A short description is given here, but more information can be found in references given below. The hydrodynamic model is based on the primitive Navier-Stokes equations and is established on a z-grid (Slagstad and McClimans, 2005; Slagstad et al., 2015).
A comprehensive description of the ecosystem or food web model is found in Wassmann et al. (2006) and a short description, including recent deviations, is given here. The model structure is designed for the Barents Sea ecosystem and state variables and parameter values are set for modeling the carbon flux in this region. The state variables are: nitrate, ammonium, silicate, diatoms, autotrophic flagellates, bacteria, heterotrophic nanoflagellates, microzooplankton, and two mesozooplankters: the Atlantic Calanus finmarchicus and the arctic C. glacialis. The model contains further compartments for fast and slow sinking detritus, dissolved organic carbon, and the sediment surface. The model uses constant stoichiometry [C:N ratio equal 7.6 is used, as based upon average data from the Barents Sea (Reigstad et al., 2002)].
The model set-up encompasses the Nordic Seas, the central Atlantic Ocean and the Eurasian shelf [see Slagstad et al. (2015)] and uses a horizontal grid point distance of 20 km. The model has 25 vertical levels. The vertical level thickness increases from 5–10 m near the surface to 500 m below 1000 m.
The SINMOD model has open ocean boundaries to the Atlantic Ocean and the Bering Sea. These boundaries have to be specified. We have used the CARINA data base (Tanhua et al., 2010) to calculate the seasonal average temperature (T), salinity (S), nitrate (NO3), silicate (Si), total inorganic carbon (CT), and alkalinity (AT). For the climatic scenarios monthly, mean values from bergen climate model (BCM) using IPCC’s SRES A2 run have been used at the boundaries. Since these data had a significant offset compared with the CARINA data the BCM data has been corrected in the following way: The difference between the average values of T, S, NO3, Si, CT, and AT in the 1990s near the boundaries for the CARINA and BCM A2 run were calculated. This resulted in an offset of each variable along the boundaries that is added to the BCM A2 data. Since most of the CARINA data originates from the spring-summer season, the depth of winter mixing (Steinhoff et al., 2010) was assumed in order to find winter values. The atmospheric CO2 concentration was taken from IPCC’s projections of annual mean pCO2 concentration for RCP4.5 and RCP8.5 [see Meinshausen et al. (2011) for description]. Seasonal pattern was adjusted with data from Ocean Weather Station Mike (66°N, 2°E). The CARINA data was also used for initial values of NO3, Si, CT and AT. The nutrient concentration (nitrogen and silicate) in the river run-off is taken from Dittmar and Kattner (2003) and Amon and Meon (2004). The CO2 system follows the DOE (1994) using Mehrbach et al. (1973) and Lueker et al. (2000) calculations of carbonate system dissociation-constants.
We use the following equation for air-sea exchange of CO2 (F)
Where fCO2w, pCO2a are the partial pressures of CO2 in the water and atmosphere, respectively. A is the fraction of a grid cell covered by ice and K is the gas transfer velocity using the Wanninkhof (1992) relationship between K and wind speed.
Economic Analysis and Data
The ecosystem service of ocean carbon storage provides benefits to society in the form of mitigation of climate change, but has no direct market value (Melaku Canu et al., 2015). Placing monetary value estimates can help underline the importance of the oceans carbon storage service, helping to inform policy and aid decision making. While there is no market for carbon storage in the oceans, values connected to carbon storage can be taken from carbon markets, national carbon taxes or from estimates inferring the value of stored carbon (or the costs of carbon to society) such as the SCC, or the shadow price of carbon (Pearce, 2003; Tol, 2008; Valatin, 2010; Nordhaus, 2011). Carbon values are much debated with many estimates for long-run damage costs of climate change and abatement costs (Armstrong et al., 2010). For this analysis this valuation of the benefits of carbon storage in the Arctic Ocean is applied using both EU ETS and SCC values of carbon. To allow for the uncertainty regarding future values, growth rates and climate scenarios we apply a high and low bound of values to span the possibilities of the value of carbon uptake in the Arctic.
Emission trading is a market-based tool to limit greenhouse gases. The EU ETS is the largest such trading scheme globally. The EU ETS is a “cap and trade” mechanism where a limit, the “cap,” on all greenhouse gas emissions is set, and reduced over time. Within the total emission limit, companies can receive and/or trade emissions allowances. These allowances therefore receive a market value. There has been an increasing trend in price since 2013 with the market entering the so-called third phase (first phase operated from 2005 to 2007; second phase 2008 to 2012; and third phase 2013 to 2020). There are significant changes in the third phase from the previous two including a single EU wide cap on allowances, auctioning the allocation of allowances, and more sectors and gases are included. The ETS is designed to steadily reduce the level of carbon emissions over time and therefore the value of an allowance is expected to increase over time. The last five-year mean value of phase 3 is €8 per ton. The minimum price over this stage was €3.54 and increased to a maximum €21.16 in September 2018 (see Figure 2). The current price (as of November 2018) has dipped slightly to €19.46.
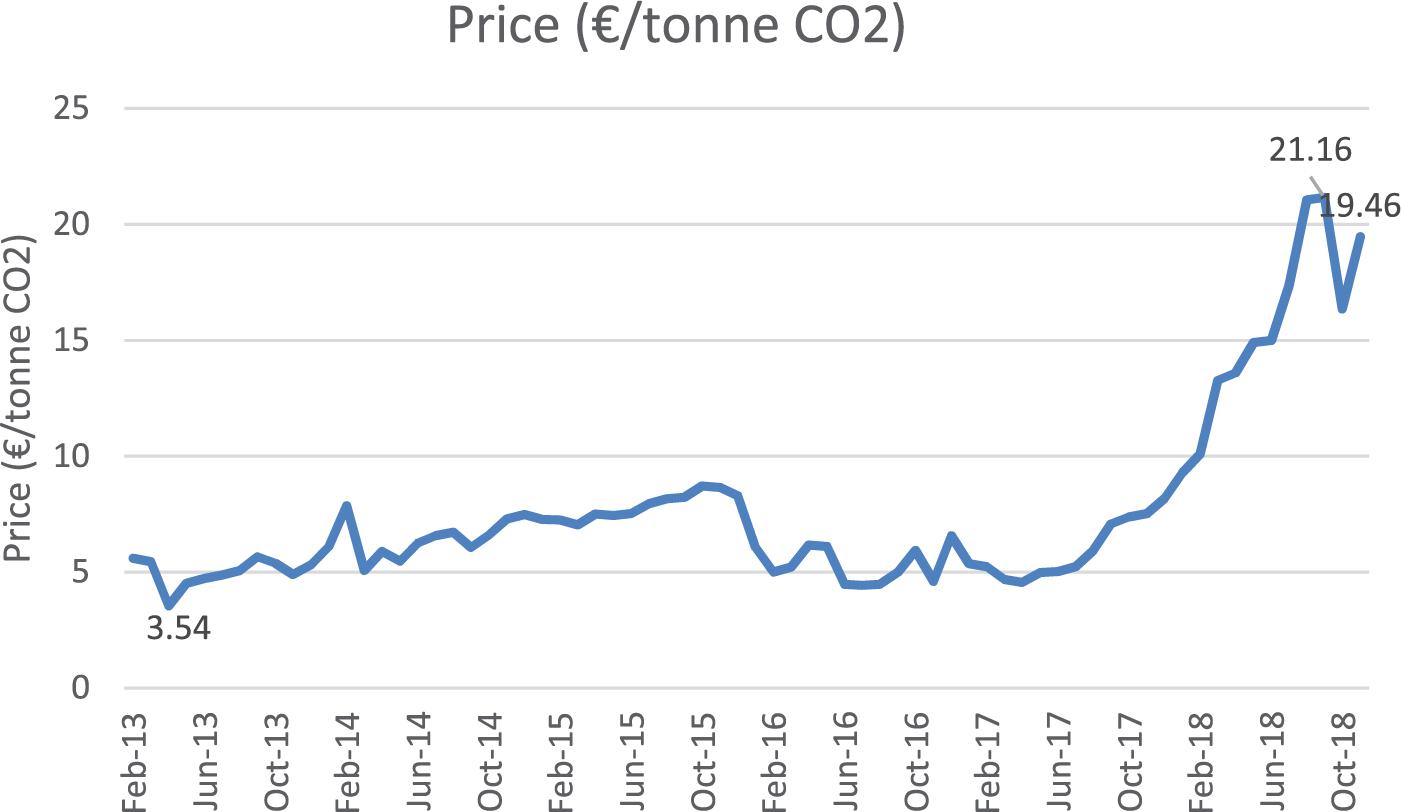
Figure 2. CO2 emission prices in the European emissions trading system (EU ETS), Phase 3 January 2013 – November 2018. Source: http://www.investing.com/commodities/carbon-emissions-historical-data.
The question whether a limited market will sufficiently take into account the full cost of carbon emissions has led to substantial work to estimate the SCC (see Tol (2008) for an overview of these studies), the Stern review (Stern, 2006) being the perhaps most well-known. Scientists predict that climate change will lead to negative consequences such as the spread of disease, decreased food production, coastal destruction, and more. The SCC is the estimate of monetary value of the damage done from the emission of one more ton of carbon at some point in time (Pearce, 2003). The SCC signals what society should be willing to pay to avoid the future damage caused by incremental carbon emissions. Models developed to estimate the SCC are known as integrated assessment models (IAMs). They aim to capture the linkages between greenhouse gas emissions, greenhouse gas atmospheric concentrations, temperature change, and monetary costs of climate change damage to society (Melaku Canu et al., 2015). Estimates for the SCC vary, depending on the model used.
In a meta-analysis Tol (2008) reports 211 estimates of the SCC, and explains that estimates of SCC are very dependent on the social rate of discount applied, as well as equity weights chosen. A large amount of climate change damage is expected to occur in the future, thus the present value of those damages depends on the discount rate chosen (ANON, 2016)2. The value of the SCC is not constant over time and is expected to vary between different climate change scenarios (Stern, 2006; Melaku Canu et al., 2015).
To estimate the future value of carbon sequestration in the Arctic Ocean, the values per unit of carbon are multiplied by the carbon estimates from the SINMOD model. The present value Vj, over 80 years from 2019 to 2099, of the change in carbon storage in accordance with the SINMOD model runs, can be calculated as:
where C denotes the increase or decrease in carbon storage estimated by SINMOD at a specific time t. P is the price of carbon measured either as the SCC (j = SCC) or taken from the EU ETS carbon market (j = ETS), at time t.
The future value is discounted with discount rate d. Prices in general usually increase over time, and EU ETS carbon prices are expected to increase substantially due to planned changes in the structure of the market, here included with a rate of increase equal to r.
Results
Biophysical Model Results
The SINMOD model was initialized with data from the CARINA data sets (Tanhua et al., 2010). Using ECMWF (European Centre for Medium-Range Weather Forecasts) atmospheric forcing the model had a spin-up period from 1979 to 2005. We have run 2 climatic scenarios using atmospheric input from the Max-Planck Earth System Models (MPIESM)3 using IPCC scenarios RCP 4.5 and RCP 8.5. The first scenario assumes a continued increase in emissions of greenhouse gases until around 2040 and from then on a decline. The RCP8.5 scenario assumes a continuous increase until the end of the century.
Storage
Total inorganic carbon (CT = CO2 + CaCO3 + CaCO2H) content in the Arctic Ocean at simulation start (2006) for the climatic scenarios is about 3.313∗105 Tg C (1 Tg = 1012 g). Increase in the carbon storage depends mainly on the atmospheric concentration of CO2.
The net storage of Carbon from 2006 to 2099 (the area under the graphs in Figure 3) is 3458 Tg for RCP 4.5 and 7745 Tg for RCP 8.5 scenario, i.e., a 1.04 and 2.33% increase, respectively.
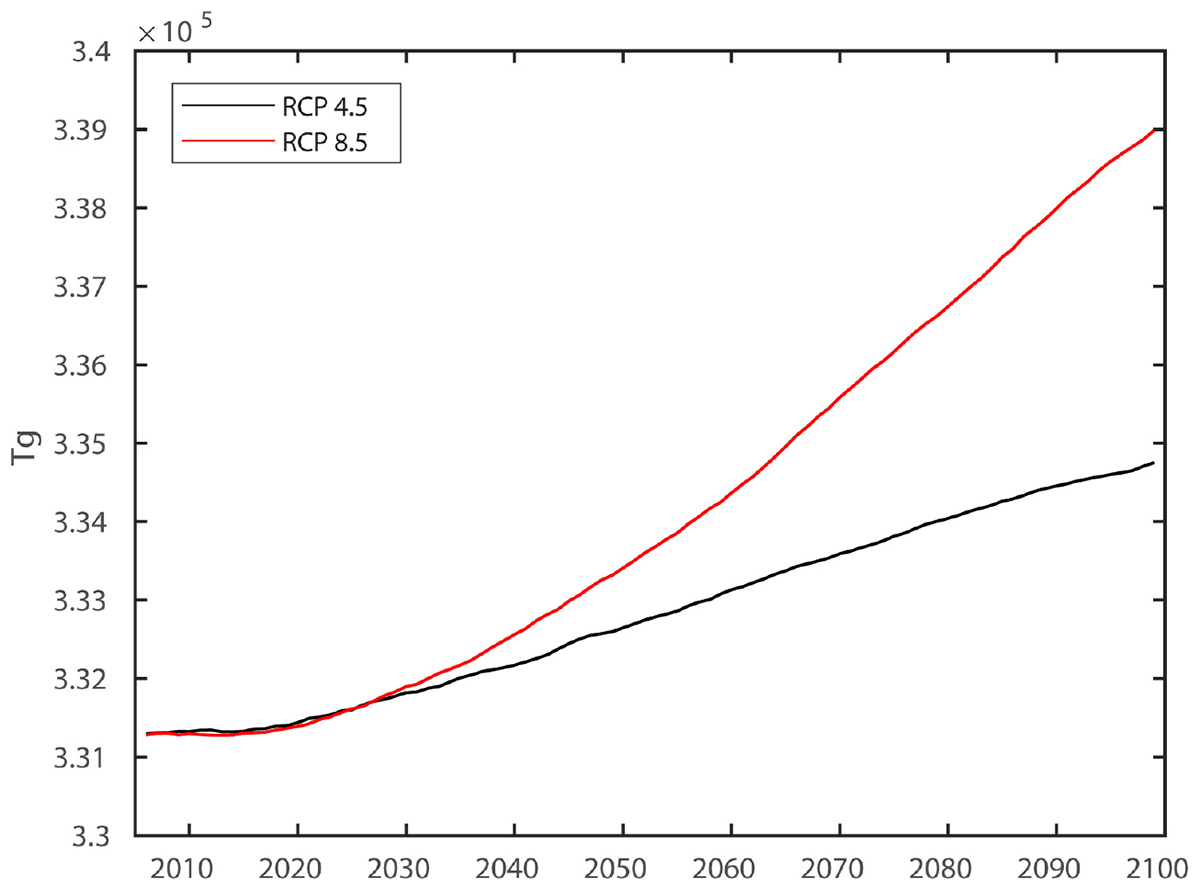
Figure 3. Development of total inorganic carbon in the Arctic Ocean the 21st century for two climatic scenarios.
The storage of organic carbon depends strongly on the season. In Figure 4 we have plotted the time series of organic carbon.

Figure 4. Scenario RCP 8.5. Total amount of simulated organic carbon in the Arctic Ocean.
The initial value of biological components (biomass) comes from simulation of the present state (mainly controlled by the ice cover) and the Arctic biological system. The RCP 8.5 Scenario produces more ice than the ERA INTERIM atmospheric forcing in the first 10 year of the simulation. The biomass in the Arctic experiences a dip before the ice cover is reduced for the remainder of the century. The summer biomass doubles toward the end of the century, but is still only 0.024% of the total inorganic carbon content of the Arctic Ocean.
Fluxes
The fluxes in and out of the Arctic Ocean have several transport roads. Horizontal fluxes are dominating. Here we only divide between Fram Strait and all other shelves (Barents and Kara Seas, Bering Strait, and Canadian Archipelago). Ice flux of carbon is mainly through the Fram Strait, but we handle carbon transported within the ice as the sum of all openings to the Arctic Ocean.
Since we are using climatological river run-off and constant inorganic content the river input of carbon is the same for all the scenarios and for each year (around 15 Tg).
Air-sea fluxes are calculated using standard methods depending on the difference between the partial pressure of CO2 in the atmosphere and the sea surface. In the Arctic the ice cover will reduce the annual average of air sea exchange.
The biological fluxes are calculated from all the transport of all the carbon-containing state variables in the biological model (diatoms, flagellates, detritus, bacteria, HNan, DON, DOC, Ciliates, Cfin, and Cgla). Table 1 gives an overview of all fluxes in and out of the Arctic Ocean.
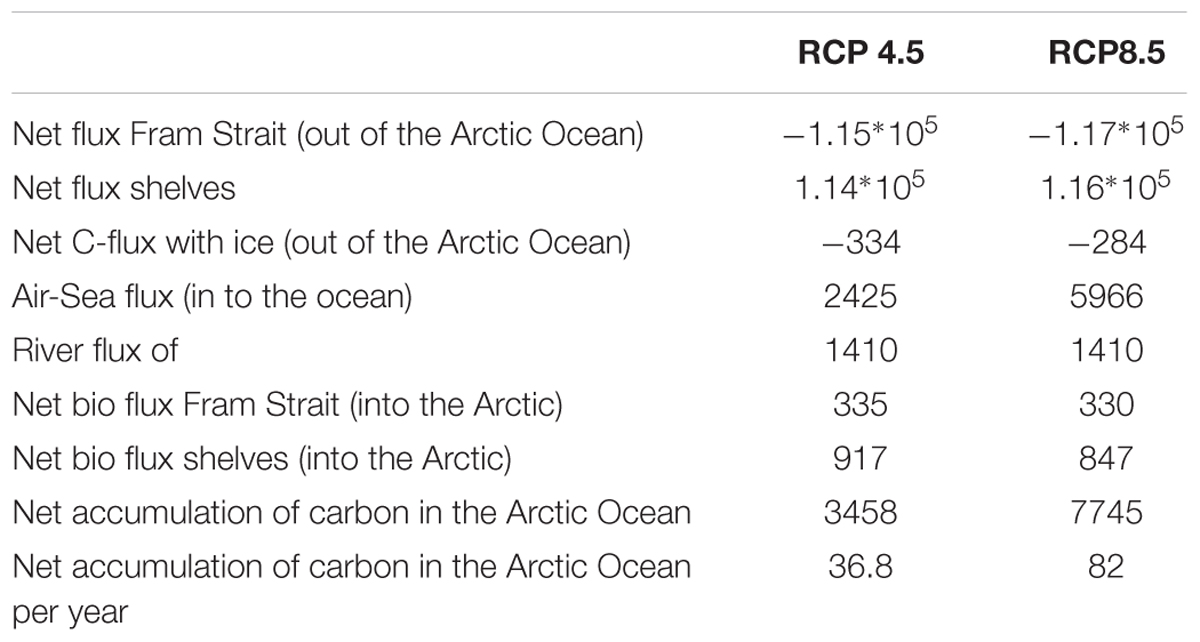
Table 1. Integrated fluxes (2006–2099) in Teragram carbon (TgC).
The accumulation of carbon in the Arctic Ocean seems to be controlled by the horizontal fluxes. The water entering the Arctic Ocean absorbs CO2 from the atmosphere on its journey from the North Atlantic, Norwegian Sea, and Barents Sea. Cooling of these water masses allows more CO2 to be absorbed. Time series of annual flux through Fram Strait and through the shelves are shown in Figure 5. As we could expect, the trajectories mirror each other.
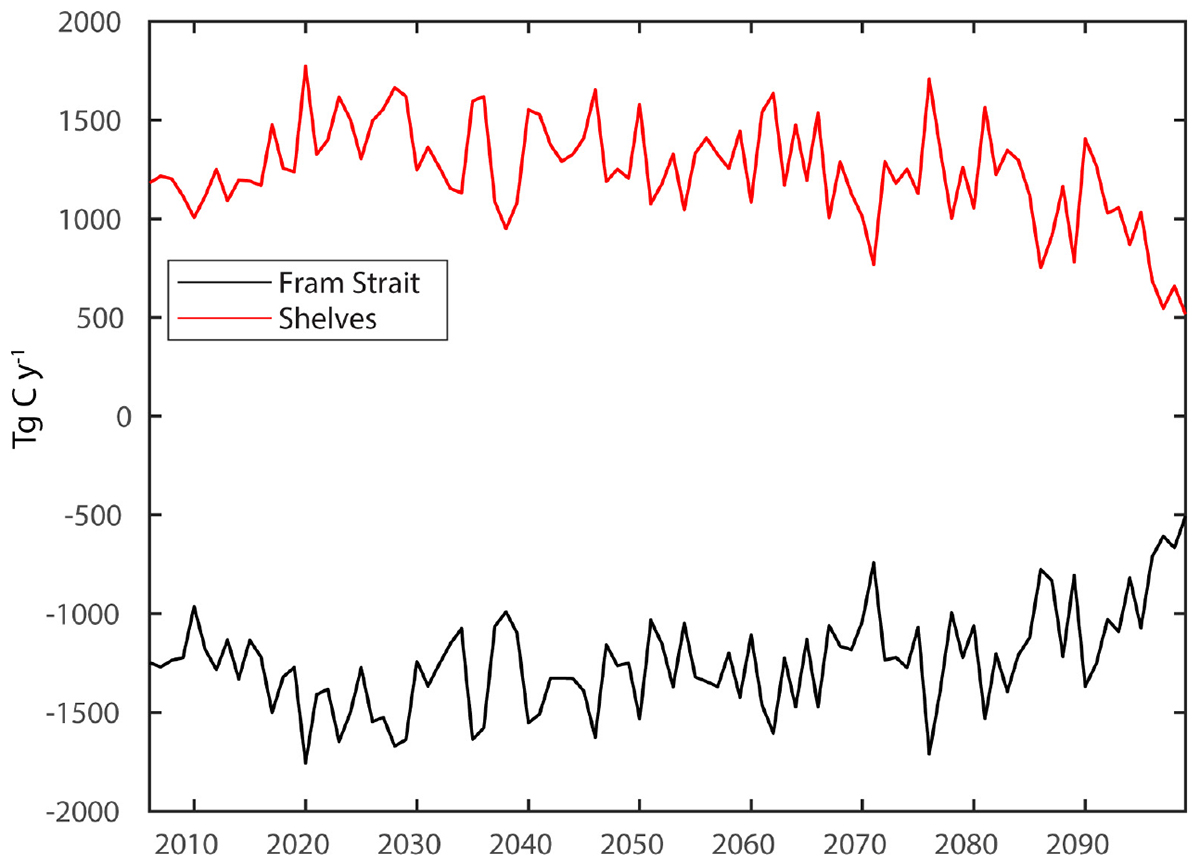
Figure 5. Net annual inorganic C-flux through Fram Strait and the shelves areas for the RCP8.5 scenario.
Air-sea flux is shown in Figure 6. As the ice cover gradually diminishes and the atmospheric concentration of CO2 increases, the air to sea flux of carbon increases.
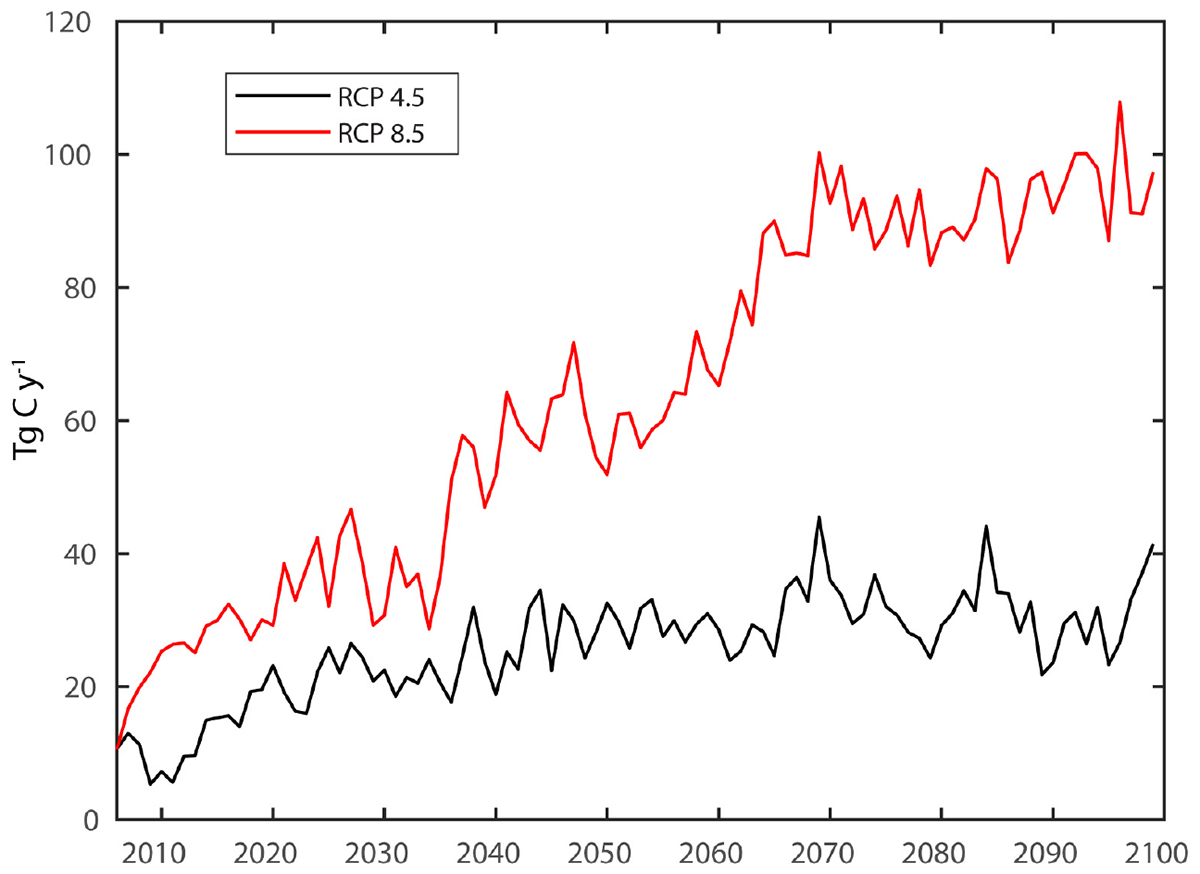
Figure 6. Annual air-sea flux of CO2 (RCP 8.5 and RCP 4.5).
As we see in Figure 6 the net accumulation appears to stabilize after 2065 (for RCP 4.5 much earlier), even when the atmospheric CO2 continues to increase. Based on measurements, Yasunaka et al. (2018) found that the present annual air-sea flux is about 180 ± 130 Tg C when including the Barents and Kara Seas in addition to the area studied in this paper (Figure 1). Applying a similar area as used in Yasunaka et al. (2018) to the SINMOD simulations, we find that the air-sea flux increases from 60 Tg C in the 80 s (not shown), when the ice cover was extensive, to 115 Tg C in the period of 2010–2017. This is well within the range of air-sea flux found in Yasunaka et al. (2018). The climatic simulations have more ice in the start of this century than simulations using ERA INTERIM forcing, but when the summer ice is gone the uptake of CO2 from the atmosphere levels out at around 150 Tg C for RCP 8.5.
For the economic analysis, accumulated total and annual carbon storage is used to assess the total value and value over time. Figure 7 shows the net annual accumulation of carbon for the two IPCC scenarios, and worth noting is the increasing trends up to 2070, followed by a decreasing trend.
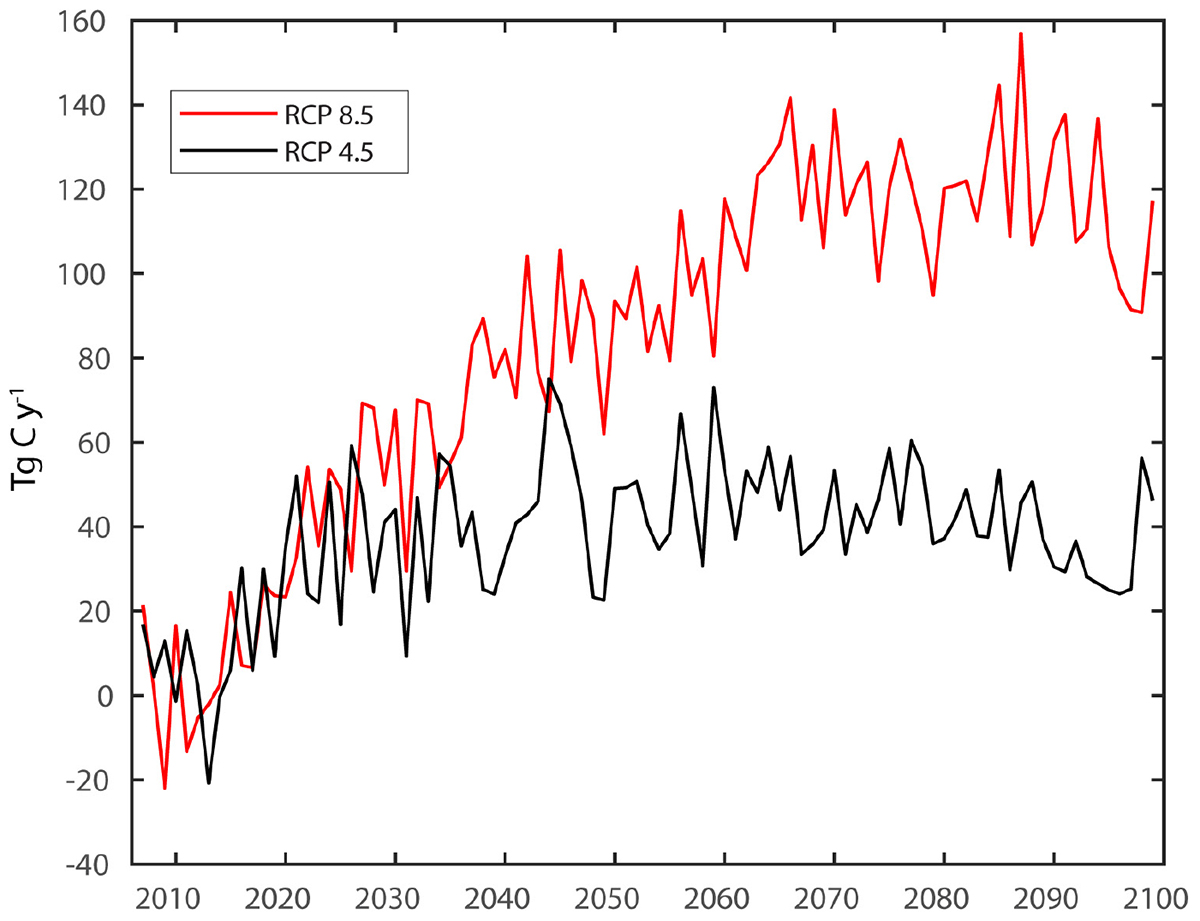
Figure 7. Net annual accumulation rate of carbon in the Arctic Ocean for RCP 8.5 and RCP 4.5.
Values
Applying the current EU ETS carbon price €19.46 (November 2018) to the net accumulation of carbon in the Arctic for RCP8.5 and RCP4.5, and assuming growth is equal to the discount rate (we ease this assumption later), we obtain the picture in Figure 8, for the years 2019–2099. We observe that the annual value for the two scenarios follow relatively similar paths the first ten years, whereupon the RCP8.5 storage value has an increasing trend for another 60 years while the RCP4.5 value shows no such increasing trend. Both show a decreasing trend the last 10 years studied.
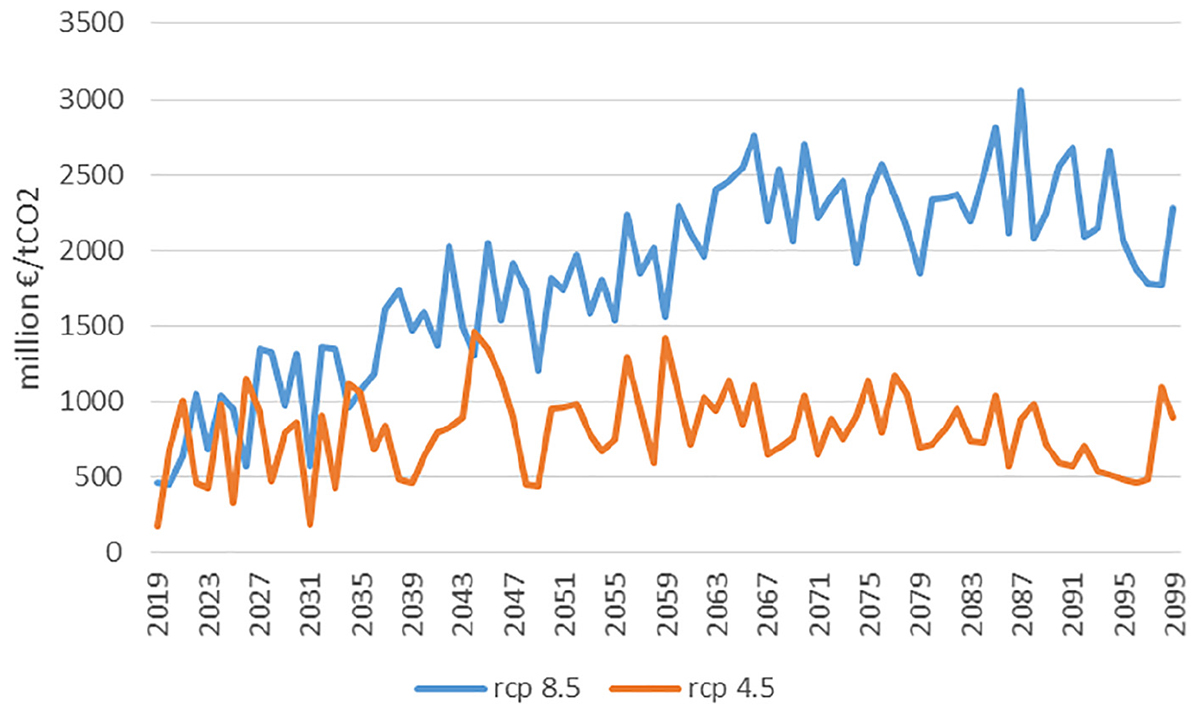
Figure 8. Value of annual carbon storage 2019 – 2099 using current market price (€19.42 per tonne) and assuming growth in price is equal to the discount rate.
We see from Table 2 that the Arctic Ocean is expected to store carbon worth €6.1 and €10.5 billion for RCP4.5 and RCP8.5, respectively, from 2019 to 2099, using the current EU ETS market value as the starting price (€19.46 per ton CO2). Here the discount rate and the price growth rate is set equal to 0.
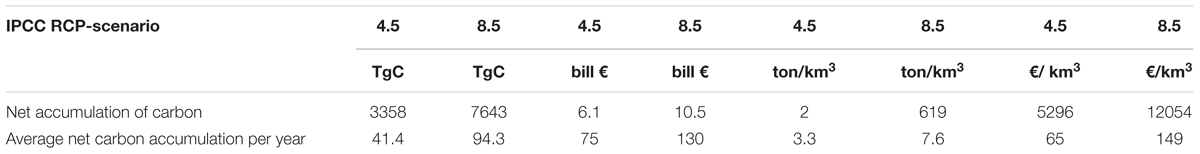
Table 2. Total and average increased carbon storage and value in the Arctic Ocean, 2019–2099, with current EU ETS market price (€19.46 per tonne), with zero price growth and discount rates.
However, that the growth in carbon prices should equal the discount rate is not to be expected, and that they should be set equal to 0 is usually not seen as acceptable. In the following, we present an upper and a lower bound for the change in carbon storage values in the Arctic, as shown in Figure 9. This range is to allow for the uncertainty in future carbon values. We have chosen a high and low discount rate of 5 and 3% [following Nordhaus (2007) and Riahi et al. (2017)]. United Kingdom department of energy and climate chance (DECC) models estimate that carbon values increase on average 5.5% per year over the 2030 – 2050 period (DECC, 2011). In our analysis we use a high price growth rate of 5% and a low price growth of 2.5%. The low price growth rate can be understood to include a minimal inflation rate and an incremental damage from increasing temperatures, where the former is 0,5%, and the latter is 2% [the latter as in Barange et al. (2017)]. For the lower bound we apply the current EU ETS price (€19,46 per ton4), while for the upper bound we apply a high SCC price (€50 per ton) (ANON, 2016; Barange et al., 2017). Forecasts of carbon prices have been carried out by a number of countries to 2050 (for example United Kingdom, Ireland, and France) (DECC, 2011; Kevany and Cleary, 2018). The UK DECC extends their forecast to 2100. The prices in this paper are in line with those estimated by others to 2050. Our upper bound is within the range estimated by the DECC while the lower bound prices used here is more conservative. After 2050, the UK DECC prices are impacted by their assumptions regarding technological change, which we do not include in our analysis. Our price data are therefore higher than the DECC values after 2050.
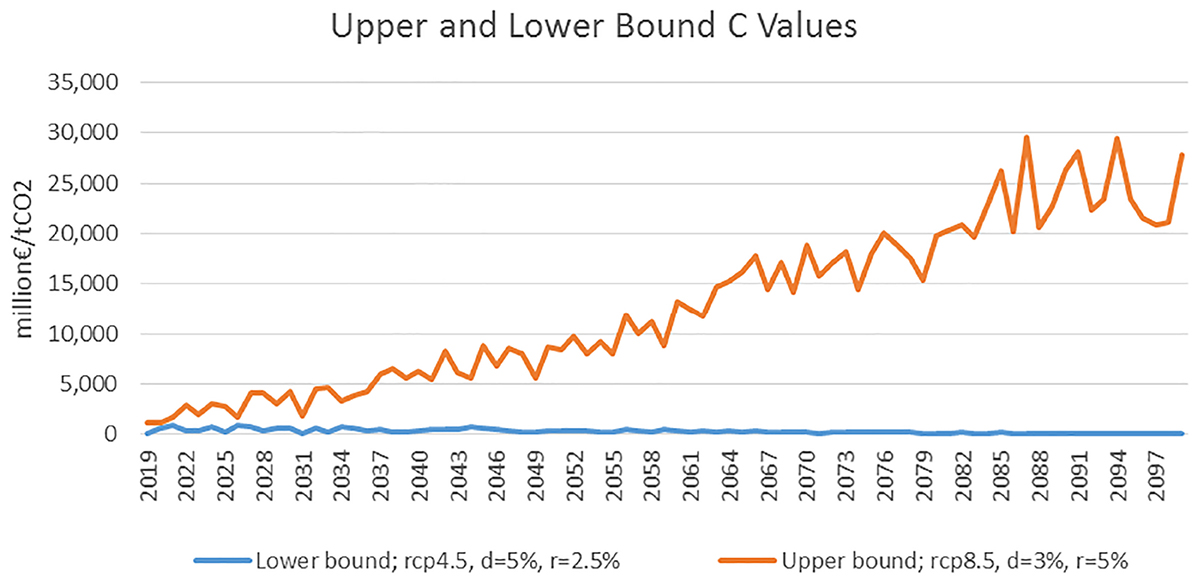
Figure 9. Upper and lower bound of value of carbon in the Arctic Ocean, as present value in each year, discounted back to 2019, in million euros. The upper bound consists of RCP 8.5, a discount rate of 3% and a starting SCC price of €50 with a growth of 5%. The lower bound includes the RCP 4.5 scenario, a discount rate of 5% and starting ETS of €19.46 (November 2018), and growth rate in the price of 2.5%.
By combining the RCP 8.5 and the low discount rate (3%) with the high SCC price and high price rise (5%) we obtain an overall upper bound. Likewise, the RCP4.5 and the high discount rate (5%) with the relatively low EU ETS price and low price rise give an overall lower bound.
We see from Figure 9 that the lower bound value is declining over time, as the discount rate is greater than the rate of price increase, and when summing up the values leads to an accumulated value over the time period studied equal to €27.6 billion. The upper bound is increasing, but at a decreasing rate toward the end of the century, and when aggregated is valued at more than €1 trillion in total. While the lower bound variability declines over time, the upper bound variability increases. This picture clearly shows a large variation between the upper and lower bound, and indicates the uncertainties involved, both biophysically and economically, and especially when the two are combined.
Discussion and Conclusion
An important result from this study is the minor effect reduced ice cover has on the total carbon accumulation and storage. The importance of horizontal advection resulting in carbon accumulation in the Arctic Ocean, illustrates the connectivity of the Arctic Ocean to lower latitudes. Not only is the ocean buffering the increased atmospheric carbon globally, but ocean currents cause an additional accumulation in the Arctic Ocean resulting from the global ocean current transport. In a carbon storage perspective, this is regarded as positive, and represents major economic values. At the same time, the increased inorganic carbon will have a direct negative consequence in the form of ocean acidification. Accumulation of contaminants in the high Arctic resulting from long-range transport by atmospheric circulation or ocean currents is well known (AMAP, 2016), and the present study demonstrates similar patterns for carbon.
The biological contribution to increased carbon storage is negligible compared to the inorganic carbon pool. Only 0.024% of the carbon pool at the end of the century comes from summer biomass, despite a doubling over this time-period. However, the Arctic basin is deep, up to around 5000 m, storing huge volumes of water. Furthermore, the circulation is relatively slow, and the carbon that is stored will be isolated from the atmosphere in a millennial perspective.
Another output from the simulations is the lower influx of biomass to the Arctic Ocean both over the shelves and through the Fram Strait in the RCP8.5 compared to the RCP 4.5 scenario (Table 1). At present, the advection of biomass from lower latitudes represents a considerable energy supply to the Arctic Ocean inflow regions, providing a basis for increased production also on higher trophic levels in the slope areas north of Svalbard (Basedow et al., 2018; Vernet et al. unpublished). A projected reduced inflow of organic carbon and biology in terms of phytoplankton and zooplankton reflecting reduced production or changing communities at lower latitudes in the future, may have stronger regional impact than local increases in primary production. The potentially negative economic impacts of this are also an unknown.
Barange et al. (2017) estimated the value of the loss in carbon storage service in the North Atlantic (not including the Arctic) as a result of climate change, to lie between € 150–2640 billion in abatement costs and €20–353 billion in social costs, over the period 2010 – 2099 (conversion: 1 USD = 0.88 EUR, 25/11/19). We observe that the value of carbon storage increase in the Arctic, estimated to lie somewhere between 27.6 billion and €1 trillion, though calculated using a somewhat different approach, has potential to reduce the costs described by Barange et al. (2017) related to carbon storage loss in the North Atlantic, and can be seen in connection with the borealisation of the Arctic (Fossheim et al., 2015). However, large uncertainties regarding the extent of these carbon storage values remain, and these results must therefore be taken with caution.
To sum up the uncertainties, we note (1) Simulations were based on two chosen climate change scenarios, with their inherent uncertainties, (2) The value of carbon storage is based on EU ETS and SCC estimates which are subject to discussion and change, and (3)The discount rate, where there are extensive debates amongst economists. A number of countries recommend using declining discount rates over time [see for the United Kingdom and for Norway (ANON, 2012, 2018)]. This will raise further the upper bound as portrayed in Figure 9, and given similar percentage point declines in the upper and lower bound discount rates, only increase the difference between the two. Regardless, the results show the potential for increases of carbon storage in the Arctic Ocean, and its value.
It is worth noting that the estimates of increased Arctic blue carbon storage and its value, is only one ecosystem service change related to carbon. Clearly, increased carbon in the oceans has potential cost not identified here, not the least represented by OA (Mathis et al., 2015). Furthermore, a multitude of other climate effects, not necessarily related directly to carbon storage, are not assessed here. However, putting together the many pieces of the climate change puzzle requires assessments not only of costs, but also of the potential benefits.
Author Contributions
All authors took part in planning, developing, and writing the manuscript. DS did the natural science modeling analysis. CA and NF did the economic analysis.
Funding
This study was supported by the Norwegian Research Council projects CARBON BRIDGE, a Polar Programme (Project No. 226415) funded by the Norwegian Research Council. CA acknowledges funding from the European Union’s Horizon 2020 Research and Innovation Program under grant agreement number 678760 (ATLAS). This output reflects the authors’ views only and the European Union cannot be held responsible for any use that may be made of the information contained therein.
Conflict of Interest Statement
The authors declare that the research was conducted in the absence of any commercial or financial relationships that could be construed as a potential conflict of interest.
The handling Editor is currently organizing a Research Topic with one of the authors MR, and confirms the absence of any other collaboration.
Acknowledgments
We thank the reviewers for their helpful observations, comments, and feedback.
Footnotes
- ^There are several ways that carbon can be stored/sequestered in the oceans. It can be stored through biological (living organisms), sub-seabed, or human induced (man-made) processes. Differences in temporary vs. permanent storage is clearly an issue. For the purpose of this paper carbon sequestration is defined as the biological capture and storage of carbon.
- ^Present value is how much a future sum of money is worth today. An important part of the present value calculation is the interest rate used for discounting.
- ^https://portal.enes.org/models/earthsystem-models/mpi-m/mpi-esm
- ^November 2018.
References
AMAP (2016). Influence of Climate Change on Transport, Levels, and Effects of Contaminants in Northern Areas – Part 2. Oslo: AMAP.
Amon, R. M. W., and Meon, B. (2004). The biogeochemistry of dissolved organic matter and nutrients in two large Arctic estuaries and potential implications for our understanding of the Arctic Ocean system. Mar. Chem. 92, 311–330. doi: 10.1016/j.marchem.2004.06.034
ANON (2012). Economic Analyses (In Norwegian: Samfunnsøkonomiske Analyser). Oslo: NOU Norges Offentlige Utredninger.
ANON (2016). Technical Support Document: - Technical Update of the Social Cost of Carbon Regulatory Impact Analysis - Under Executive Order 12866. Washington, D.C.: Interacgency Working Group on Social Cost of Greenhouse Gases, United States Government.
ANON (2018). The Green Book. Central Government Guidance on Appraisal and Evaluation. London: H. Treasury.
Armstrong, C., and Foley, N. (2018). Ecosystem Services and Values in the Arctic Ocean. At the edge. P. Wassmann. Stamsund: Orkana, 299–306.
Armstrong, C. W., Foley, N. S., Tinch, R., and van den Hove, S. (2010). Ecosystem Goods and Services of the Deep Sea. EU FP7 HERMIONE Synthesis Report: 68. London: CNR.
Babin, M., Bélanger, S., Ellingsen, I., Forest, A., Le Fouest, V., Lacour, T., et al. (2015). Estimation of primary production in the Arctic Ocean using ocean colour remote sensing and coupled physical–biological models: strengths, limitations and how they compare. Progr. Oceanogr. 139, 197–220. doi: 10.1016/j.pocean.2015.08.008
Bakker, D. C. E., Pfeil, B., Landa, C. S., Metzl, N., O’Brien, K. M., Olsen, A., et al. (2016). A multi-decade record of high-wuality fCO2 data in version 3 of the Surface Ocean CO2 Atlas (SOCAT). Earth Syst. Sci. Data 8, 383–413.
Barange, M., Butenschön, M., Yool, A., Beaumont, N., Fernandes, J. A., Martin, A. P., et al. (2017). The cost of reducing the north atlantic ocean biological carbon pump. Front. Mar. Sci. 3:290. doi: 10.3389/fmars.2016.00290
Barber, D. G., Hop, H., Mundy, C. J., Else, B., Dmitrenko, I. A., Tremblay, J.-E., et al. (2015). Selected physical, biological and biogeochemical implications of a rapidly changing arctic marginal ice zone. Progr. Oceanogr. 139, 122–150. doi: 10.1016/j.pocean.2015.09.003
Basedow, S. L., Sundfjord, A., von Appen, W.-J., Halvorsen, E., Kwasniewski, S., and Reigstad, M. (2018). Seasonal variation in transport of zooplankton into the arctic basin through the atlantic gateway, fram strait. Front. Mar. Sci. 5:194. doi: 10.3389/fmars.2018.00194
Beaumont, N. J., Austen, M. C., Mangi, S. C., and Townsend, M. (2008). Economic valuation for the conservation of marine biodiversity. Mar. Pollut. Bull. 56, 386–396. doi: 10.1016/j.marpolbul.2007.11.013
Beaumont, N. J., Jones, L., Garbutt, A., Hansom, J. D., and Toberman, M. (2014). The value of carbon sequestration and storage in coastal habitats. Estuar. Coast. Shelf Sci. 137, 32–40. doi: 10.1016/j.ecss.2013.11.022
Chierici, M., and Fransson, A. (2009). Calcium carbonate saturation in the surface water of the Arctic Ocean: undersaturation in freshwater influenced shelves. Biogeosciences 6, 2421–2431. doi: 10.5194/bg-6-2421-2009
Comiso, J. C., and Hall, D. K. (2014). Climate trends in the Arctic as observed from space. Wiley Interdiscip. Rev. Clim. Change 5, 389–409. doi: 10.1002/wcc.277
Comiso, J. C., Meier, W. N., and Gersten, R. (2017). Variability and trends in the arctic sea ice cover: results from different techniques. J. Geophys. Res. Oceans 122, 6883–6900. doi: 10.1002/2017jc012768
de Groot, R., Brander, L., van der Ploeg, S., Costanza, R., Bernard, F., Braat, L., et al. (2012). Global estimates of the value of ecosystems and their services in monetary units. Ecosyst. Serv. 1, 50–61. doi: 10.1016/j.ecoser.2012.07.005
DECC (2011). Guidance on Estimating Carbon Values Beyond 2050: An Interim Approach. D. o. E. a. C. Change. Available at: https://www.gov.uk/government/publications/guidance-on-estimating-carbon-values-beyond-2050-an-interim-approach (accessed March 18, 2019).
Dittmar, T., and Kattner, G. (2003). The biogeochemistry of the river and shelf ecosystem of the Arctic Ocean: a review. Mar. Chem. 83, 103–120. doi: 10.1016/s0304-4203(03)00105-1
DOE (1994). Handbook of Methods for Analysis of the Various Parameters of the Carbon Dioxide System in Sea Water Version ORNL/CDIAC-74. Washington, D.C.: DOE.
Fossheim, M., Primicerio, R., Johannesen, E., Ingvaldsen, R. B., Aschan, M. M., and Dolgov, A. V. (2015). Recent warming leads to a rapid borealization of fish communities in the Arctic. Nat. Clim. Chang. 5, 673–677. doi: 10.1038/nclimate2647
Fransson, A., Chierici, M., Skjelvan, I., Olsen, A., Assmy, P., Peterson, A. K., et al. (2017). Effects of sea-ice and biogeochemical processes and storms on under-ice water fCO2 during the winter-spring transition in the high Arctic Ocean: implications for sea-air CO2 fluxes. J. Geophys. Res. Oceans 122, 5566–5587. doi: 10.1002/2016jc012478
IPCC (2014). Climate Change 2014: Syntesis Report Contribution of Working Groups I, II and III to the Fifth Assessment report of the Intergovernmental. Panel on Climate Change. Geneva: IPCC.
Kevany, L., and Cleary, K. (2018). Valuing Greenhouse Gas Emissions in the Public Spending Code. Available at: https://igees.gov.ie/wp-content/uploads/2018/11/Valuing-Greenhouse-Gas-Emissions.pdf (accessed March 18, 2019).
Lindstad, H., Bright, R. M., and Strømman, A. H. (2016). Economic savings linked to future Arctic shipping trade are at odds with climate change mitigation. Transp. Policy 45, 24–30. doi: 10.1016/j.tranpol.2015.09.002
Liquete, C., Piroddi, C., Drakou, E. G., Gurney, L., Katsanevakis, S., Charef, A., et al. (2013). Current status and future prospects for the assessment of marine and coastal ecosystem services: a systematic review. PLoS One 8:e67737. doi: 10.1371/journal.pone.0067737
Lueker, T. J., Dickson, A. G., and Keeling, C. D. (2000). Ocean pCO2 calculated from dissolved inorganic carbon, alkalinity, and equations for K1 and K2: validation based on laboratory measurements of CO2 in gas and seawater at equilibrium. Mar. Chem. 70, 105–119. doi: 10.1016/s0304-4203(00)00022-0
Luisetti, T., Jackson, E. L., and Turner, R. K. (2013). Valuing the European ‘coastal blue carbon’ storage benefit. Mar. Pollut. Bull. 71, 101–106. doi: 10.1016/j.marpolbul.2013.03.029
Mathis, J. T., Cooley, S. R., Lucey, N., Colt, S., Ekstrom, J., Hurst, T., et al. (2015). Ocean acidification risk assessment for Alaska’s fishery sector. Progr. Oceanogr. 136, 71–91. doi: 10.1016/j.pocean.2014.07.001
Mehrbach, C., Culberson, C. H., Hawley, J. E., and Pytkowicx, R. M. (1973). Measurement of the apparent dissociation constants of carbonic acid in seawater at atmospheric pressure. Limnol. Oceanogr. 18, 897–907. doi: 10.4319/lo.1973.18.6.0897
Meier, W. N., Hovelsrud, G. K., van Oort, B. E. H., Key, J. R., Kovacs, K. M., Michel, C., et al. (2014). Arctic sea ice in transformation: a review of recent observed changes and impacts on biology and human activity. Rev. Geophys. 52, 185–217. doi: 10.1002/2013rg000431
Meinshausen, M., Smith, S. J., Calvin, K., Daniel, J. S., Kainuma, M. L. T., Lamarque, J.-F., et al. (2011). The RCP greenhouse gas concentrations and their extensions from 1765 to 2300. Clim. Change 109:213. doi: 10.1007/s10584-011-0156-z
Melaku Canu, D., Ghermandi, A., Nunes, P. A. L. D., Lazzari, P., Cossarini, G., and Solidoro, C. (2015). Estimating the value of carbon sequestration ecosystem services in the mediterranean sea: an ecological economics approach. Glob. Environ. Change 32, 87–95. doi: 10.1016/j.gloenvcha.2015.02.008
Moore, J., Lindsay, K., Doney, S. C., Long, M. C., and Misumi, K. (2013). Marine ecosystem dynamics and biogeochemical cycling in the community earth system model [CESM1(BGC)]: comparison of the 1990s with the 2090s under the RCP4.5 and RCP8.5 scenarios. J. Clim. 26, 9291–9312. doi: 10.1175/jcli-d-12-00566.1
Nellemann, C., Corcoran, E., Duarte, C. M., Valdes, L., De Young, C., Fonseca, L., et al. (2009). Blue Carbon. A Rapid Response Assessment. Arendal: GRID Arendal.
Nordhaus, W. D. (2007). A Review of the stern review on the economics of climate change. J. Econ. Lit. 45, 686–702.
Nordhaus, W. D. (2011). Estimates of the social cost of carbon: background and results from the RICE-2011 model. Paper presented at the NBER Working paper series Working Paper 17540, (Cambridge, MA: National Bureau Of Economic Research).
O’Garra, T. (2017). Economic value of ecosystem services, minerals and oil in a melting arctic: a preliminary assessment. Ecosyst. Serv. 24, 180–186. doi: 10.1016/j.ecoser.2017.02.024
Orr, J. C., Fabry, V. J., Aumont, O., Bopp, L., Doney, S. C., Feely, R. A., et al. (2005). Anthropogenic ocean acidification over the twenty-first century and its impact on calcifying organisms. Nature 437:681. doi: 10.1038/nature04095
Pearce, D. (2003). The Social Cost of Carbon and its Policy Implications. Oxford Rev. Econ. Policy 19, 362–384. doi: 10.1093/oxrep/19.3.362
Peled, Y., Zemah Shamir, S., Shechter, M., Rahav, E., and Israel, A. (2018). A new perspective on valuating marine climate regulation: the israeli mediterranean as a case study. Ecosyst. Serv. 29, 83–90. doi: 10.1016/j.ecoser.2017.12.001
Pendleton, L., Donato, D. C., Murray, B. C., Crooks, S., Jenkins, W. A., Sifleet, S., et al. (2012). Estimating global “blue carbon” emissions from conversion and degradation of vegetated coastal ecosystems. PLoS One 7:e43542. doi: 10.1371/journal.pone.0043542
Qi, D., Chen, L., Chen, B., Gao, Z., Zhong, W., Richard Feely, A., et al. (2017). Increase in acidifying water in the western Arctic Ocean. Nat. Clim. Change 7:195. doi: 10.1038/nclimate3228
Raven, J., Caldeira, K., Elderfield, H., Hoegh-Guldberg, O., Liss, P., Riebesell, U., et al. (2005). Ocean Acidification Due to Increasing Atmospheric Carbon Dioxide. Policy Document. London: T. R. Society.
Reigstad, M., Wassmann, P., Wexels Riser, C., Øygarden, S., and Rey, F. (2002). Variations in hydrography, nutrients and chlorophyll a in the marginal ice-zone and the central Barents Sea. J. Mar. Syst. 38, 9–29. doi: 10.1016/s0924-7963(02)00167-7
Riahi, K., van Vuuren, D. P., Kriegler, E., Edmonds, J., O’Neill, B. C., Fujimori, S., et al. (2017). The shared socioeconomic pathways and their energy, land use, and greenhouse gas emissions implications: an overview. Glob. Environ. Change 42, 153–168.
Serreze, M. C., and Stroeve, J. (2015). Arctic sea ice trends, variability and implications for seasonal ice forecasting. Philos. Transact. Ser. A Math. Phys. Eng. Sci. 373:20140159. doi: 10.1098/rsta.2014.0159
Slagstad, D., and McClimans, T. A. (2005). Modeling the ecosystem dynamics of the Barents sea including the marginal ice zone: I. physical and chemical oceanography. J. Mar. Syst. 58, 1–18. doi: 10.1016/j.jmarsys.2005.05.005
Slagstad, D., Wassmann, P. F. J., and Ellingsen, I. (2015). Physical constrains and productivity in the future Arctic Ocean. Front. Mar. Sci. 2:85. doi: 10.3389/fmars.2015.00085
Steinhoff, T., Friedrich, T., Hartman, S. E., Oschlies, A., Wallace, D. W. R., and Koertzinger, A. (2010). Estimating mixed layer nitrate in the North Atlantic Ocean. Biogeosciences 7, 795–807. doi: 10.5194/bg-7-795-2010
Tanhua, T., van heuven, S., Key, R. M., Velo, A., Olsen, A., and Schirnick, C. (2010). Quality control procedures and methods of the CARINA database. Earth Syst. Sci. Data 2, 35–49. doi: 10.5194/essd-2-35-2010
TEEB (2010). The Economics of Ecosystems and Biodiversity: Mainstreaming the Economics of Nature: A Synthesis of the Approach, Conclusions and Recommendations of TEEB. New Taipei: TEEB.
Valatin, G. (2010). Forests and Carbon: Valuation, Discounting and Risk Management. Forestry Commission Research Report. Edinburgh: Forestry Commission.
Wanninkhof, R. (1992). Relationship between wind speed and gas exchange over the ocean. J. Geophys. Res. Oceans 97, 7373–7382.
Wassmann, P., Slagstad, D., Riser, C. W., and Reigstad, M. (2006). Modelling the ecosystem dynamics of the barents sea including the marginal ice zone: II. Carbon flux and interannual variability. J. Mar. Syst. 59, 1–24. doi: 10.1016/j.jmarsys.2005.05.006
Yasunaka, S., Siswanto, E., Olsen, A., Hoppema, M., Watanabe, E., Fransson, A., et al. (2018). Arctic Ocean CO2 uptake: an improved multiyear estimate of the air–sea CO2 flux incorporating chlorophyll a concentrations. Biogeosciences 15, 1643–1661. doi: 10.5194/bg-15-1643-2018
Yumashev, D., van Hussen, K., Gille, J., and Whiteman, G. (2017). Towards a balanced view of Arctic shipping: estimating economic impacts of emissions from increased traffic on the Northern Sea Route. Clim. Change 143, 143–155. doi: 10.1007/s10584-017-1980-6
Keywords: blue carbon, Arctic Ocean, carbon flux, economic value, climate change
Citation: Armstrong CW, Foley NS, Slagstad D, Chierici M, Ellingsen I and Reigstad M (2019) Valuing Blue Carbon Changes in the Arctic Ocean. Front. Mar. Sci. 6:331. doi: 10.3389/fmars.2019.00331
Received: 31 December 2018; Accepted: 29 May 2019;
Published: 25 June 2019.
Edited by:
Jacob Carstensen, Aarhus University, DenmarkReviewed by:
Kari Hyytiäinen, University of Helsinki, FinlandYong Jiang, Ocean University of China, China
Copyright © 2019 Armstrong, Foley, Slagstad, Chierici, Ellingsen and Reigstad. This is an open-access article distributed under the terms of the Creative Commons Attribution License (CC BY). The use, distribution or reproduction in other forums is permitted, provided the original author(s) and the copyright owner(s) are credited and that the original publication in this journal is cited, in accordance with accepted academic practice. No use, distribution or reproduction is permitted which does not comply with these terms.
*Correspondence: Claire W. Armstrong, Y2xhaXJlLmFybXN0cm9uZ0B1aXQubm8=