 Lingyun Yu
 Xinping Zhu1*
 Jianhui Liang
95% of researchers rate our articles as excellent or good
Learn more about the work of our research integrity team to safeguard the quality of each article we publish.
Find out more
ORIGINAL RESEARCH article
Front. Mar. Sci. , 18 June 2019
Sec. Marine Evolutionary Biology, Biogeography and Species Diversity
Volume 6 - 2019 | https://doi.org/10.3389/fmars.2019.00323
This article is part of the Research Topic Exploring the Genetic Diversity of Marine Organisms Based on the Analysis of Chromosome and Genomic DNA Markers View all 10 articles
The giant freshwater prawn (GFP) is one of the most critical crustacean species cultured in Southeast Asia. Investigation of the genetic structure of current commercial stocks allows GFP breeding programs to better manage crosses and germplasm banks as well as to promote the rational use of GFP. The objective of the study was to characterize genetic diversity in diverse prawn populations with emphasis on those cultured in China. Seventeen microsatellite loci, including 12 novel loci derived from GFP transcriptome data, were screened to assess genetic diversity in one wild (Myanmar) and six cultured populations (i.e., four Chinese (Zhejiang, Guangxi, and Guangdong A and B), one Malaysian, and one Thai population). The results showed that the number of alleles per locus ranged from 3 to 18. The mean observed heterozygosity (0.363 ± 0.048) was less than the expected heterozygosity (0.637 ± 0.048). The mean values of polymorphism information content among the seven populations were >0.5 (ranging from 0.110 to 0.915). These cultured populations exhibited reduced genetic diversity when compared with that of the wild population. Pair-wise genetic differentiation ranged from 0.006 to 0.131 within the seven populations. The dendrogram of the genetic distance shows that the six cultured populations were distributed on the same major branch, suggesting that they have are genetically close, whereas the wild population was distributed on an independent branch. The results provide a basic assessment of genetic diversity in some available stocks and lay a foundation for future research efforts toward genetic monitoring and selective breeding.
The decapod crustacean, giant freshwater prawn (GFP) Macrobrachium rosenbergii, also known as the Malaysian prawn or giant river prawn, is a commercially important species. It is also an important wild capture fishery species, particularly in Southeast Asia, with global production exceeding 216,856 tons in 2014 (Schneider et al., 2012; Food and Agriculture Organization of the United Nations [FAO], 2018). The natural distribution of GFP extends from Southern Vietnam in the east to Pakistan in the west, across Southeast Asia, Southern to Northern Australia, and New Guinea and some Pacific and Indian Ocean Islands (Chand et al., 2005). With the development of modern culture techniques for GFP in 1959 at the Malaysian Fisheries Research Institute (Ling, 1969), the culture of GFP has rapidly expanded to areas outside the native range of this species. For instance, in 1965 and 1966, some individuals were imported to Hawaii of the United States from Penang, Malaysia (Fujimura and Okamoto, 1972). In 1976, a few GFPs were introduced into mainland China (Yang et al., 2008, 2012; Thanh et al., 2015). The introduction and development of this species form a significant part of aquaculture industry worldwide, especially in mainland China where the production of GFP is currently the highest globally. However, several critical issues, such as slow growth rate, size variation at harvest, disease, and deterioration of pond environment, affect the development of GFP farming industry (Chareontawee et al., 2007). Additionally, genetic deterioration in most hatchery stocks due to inbreeding might also affect the culture period, economic returns, and natural ecosystems (Thanh et al., 2015). These factors, particularly those involved in genetic degradation, hinder the sustainable development of this species. Thus, a breeding program and a strategy for proper conservation of this species are required.
Understanding genetic diversity in the species is critical for developing conservation strategies. Recognition of particular genetic diversity will also enable informed choice in breeding plans regarding the selection of genetically diverse brood-stock and the maintenance of genetic diversity in various stocks. Nowadays, the application of genetic markers has allowed rapid progress in the investigation of parentage assignments, genetic variability assessments, inbreeding determination, and species identification of commercially important candidate aquaculture species (Liu and Cordes, 2004). A few genetic studies have focused on GFP diversity, using allozymes (Hedgecock et al., 1979), mtDNA (De Bruyn et al., 2005), microsatellite (Charoentawee et al., 2006; Chareontawee et al., 2007; Divu et al., 2008; Schneider et al., 2012; Mohanty et al., 2013; Sun et al., 2015; Thanh et al., 2015), and single nucleotide polymorphisms (SNP) (Jung et al., 2014; Agarwal et al., 2016; Alam et al., 2017). Of these DNA markers used to examine genetic variation in populations, the microsatellite marker is the most suitable and preferred marker for genetic structure and conservation studies (Weber and May, 1989; Jarne and Lagoda, 1996; Vieira et al., 2016; Manechini et al., 2017). However, to date, the microsatellite resources of GFP remain deficient. Only approximately 54 pairs of microsatellite markers have been utilized to analyze genetic diversity of the species (Chand et al., 2005; Charoentawee et al., 2006; Divu et al., 2008; Mohanty et al., 2013; Thanh et al., 2015). This has become a major obstacle to understanding the genetic background and diversity of wild and cultured GFP populations. In the present study, we aimed to develop and characterize novel microsatellite markers in the GFP population and to investigate genetic diversity in one wild and six cultured populations for a clear understanding of genetic levels of several lines and to support future genetic management and brood-stock selection activities.
A total of seven populations were investigated in this study. The cultured populations were sampled from six farms located in Zhejiang, Guangxi, and Guangdong Provinces of China; Ayutthaya, Thailand; and Kuala Lumpur, Malaysia, which represent the major hatcheries from that region. The wild population was collected from the Yangon River of Myanmar (Figure 1 and Table 1). Thirty adult prawns of each population were collected for genetic diversity analysis. All individuals were preserved directly in 95% ethanol and taken to the laboratory. Whole genomic DNA was then extracted using the E.Z.N.A.TM MicroElute Genomic DNA Kit (Omega Bio-Tek, Guangzhou, China) following the rapid phenol–chloroform protocol adapted from the standard procedure. The quality of extracted DNA was examined by running the sample on 0.8% agarose gel. The present study, in addition to its protocol, was approved by the Ethics Committee of Animal Experiments of Pearl River Fishery Research Institute before it began. All efforts were made to minimize the suffering of the GFPs.
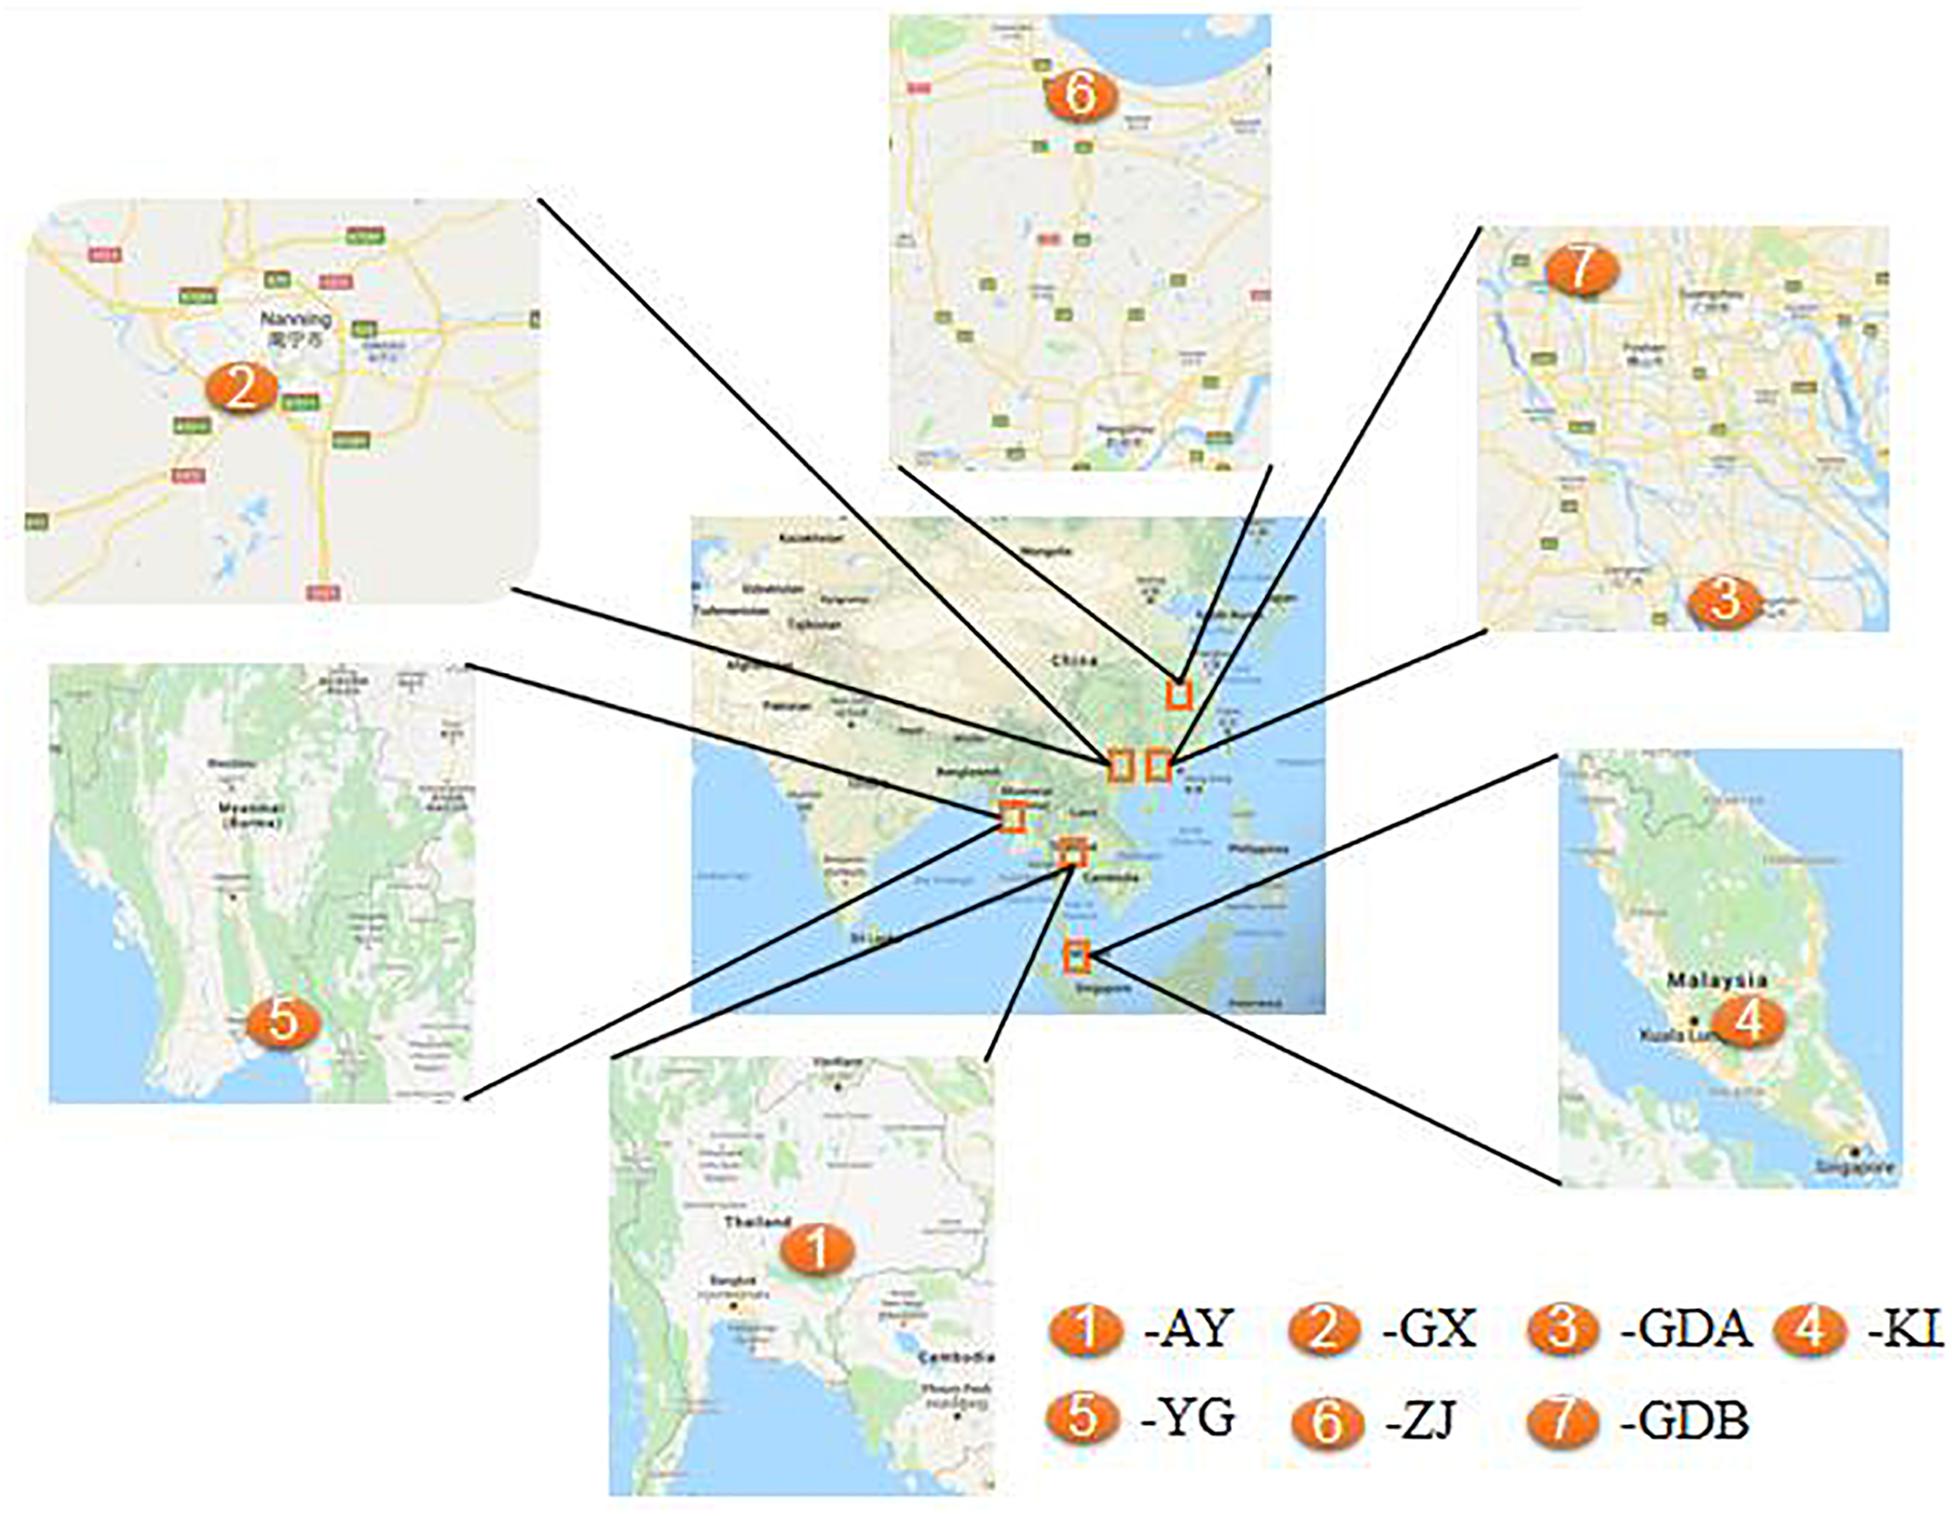
Figure 1. Map of sampling sites of the seven Macrobrachium rosenbergii populations.
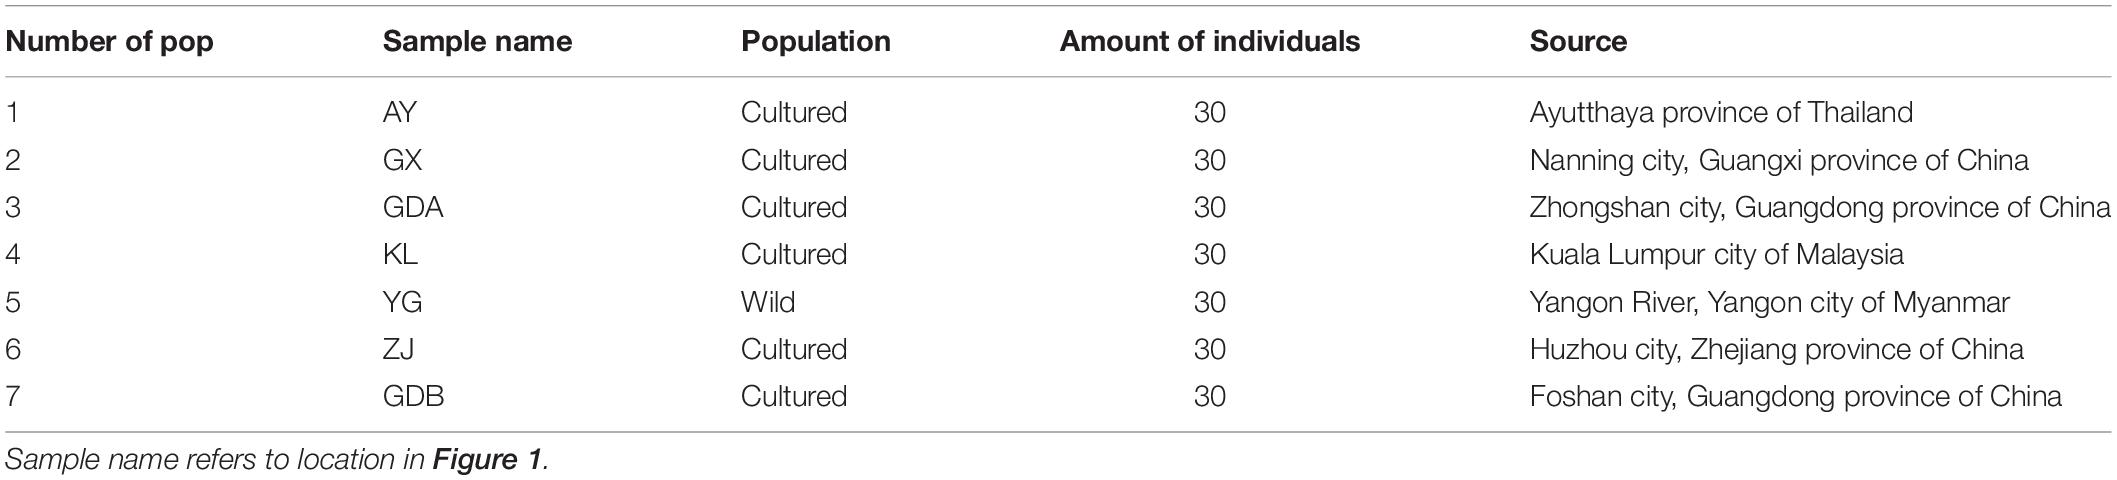
Table 1. Location of populations and number of samples in each populations of M. rosenbergii.
Twelve novel microsatellite sequences and primers of M. rosenbergii were obtained from GFP transcriptome data sources according to the method used for other species (Yu et al., 2015; Supplementary S1 and Table 2). Five previously known microsatellite loci were also used in this study (Table 2; Mohanty et al., 2013; Sun et al., 2015; Thanh et al., 2015). The 5′ end of each forward primer was labeled with fluorescent dye (6-fluorescein amidite, HEX, or TAMRA). Multiplex polymerase chain reaction (PCR) was carried out using a 30-μL reaction mixture containing 1 U Tap DNA polymerase, 1 × PCR buffer, 0.3 mM dNTP, 0.3 μM each of forward and reverse primers, and 100 ng DNA template. The steps of PCR and genotype detection were the same as those described in the preceding subsection except the annealing temperature, which in multiplex 1 was 58°C, multiplex 2 was 52°C, and multiplex 3 was 60°C.
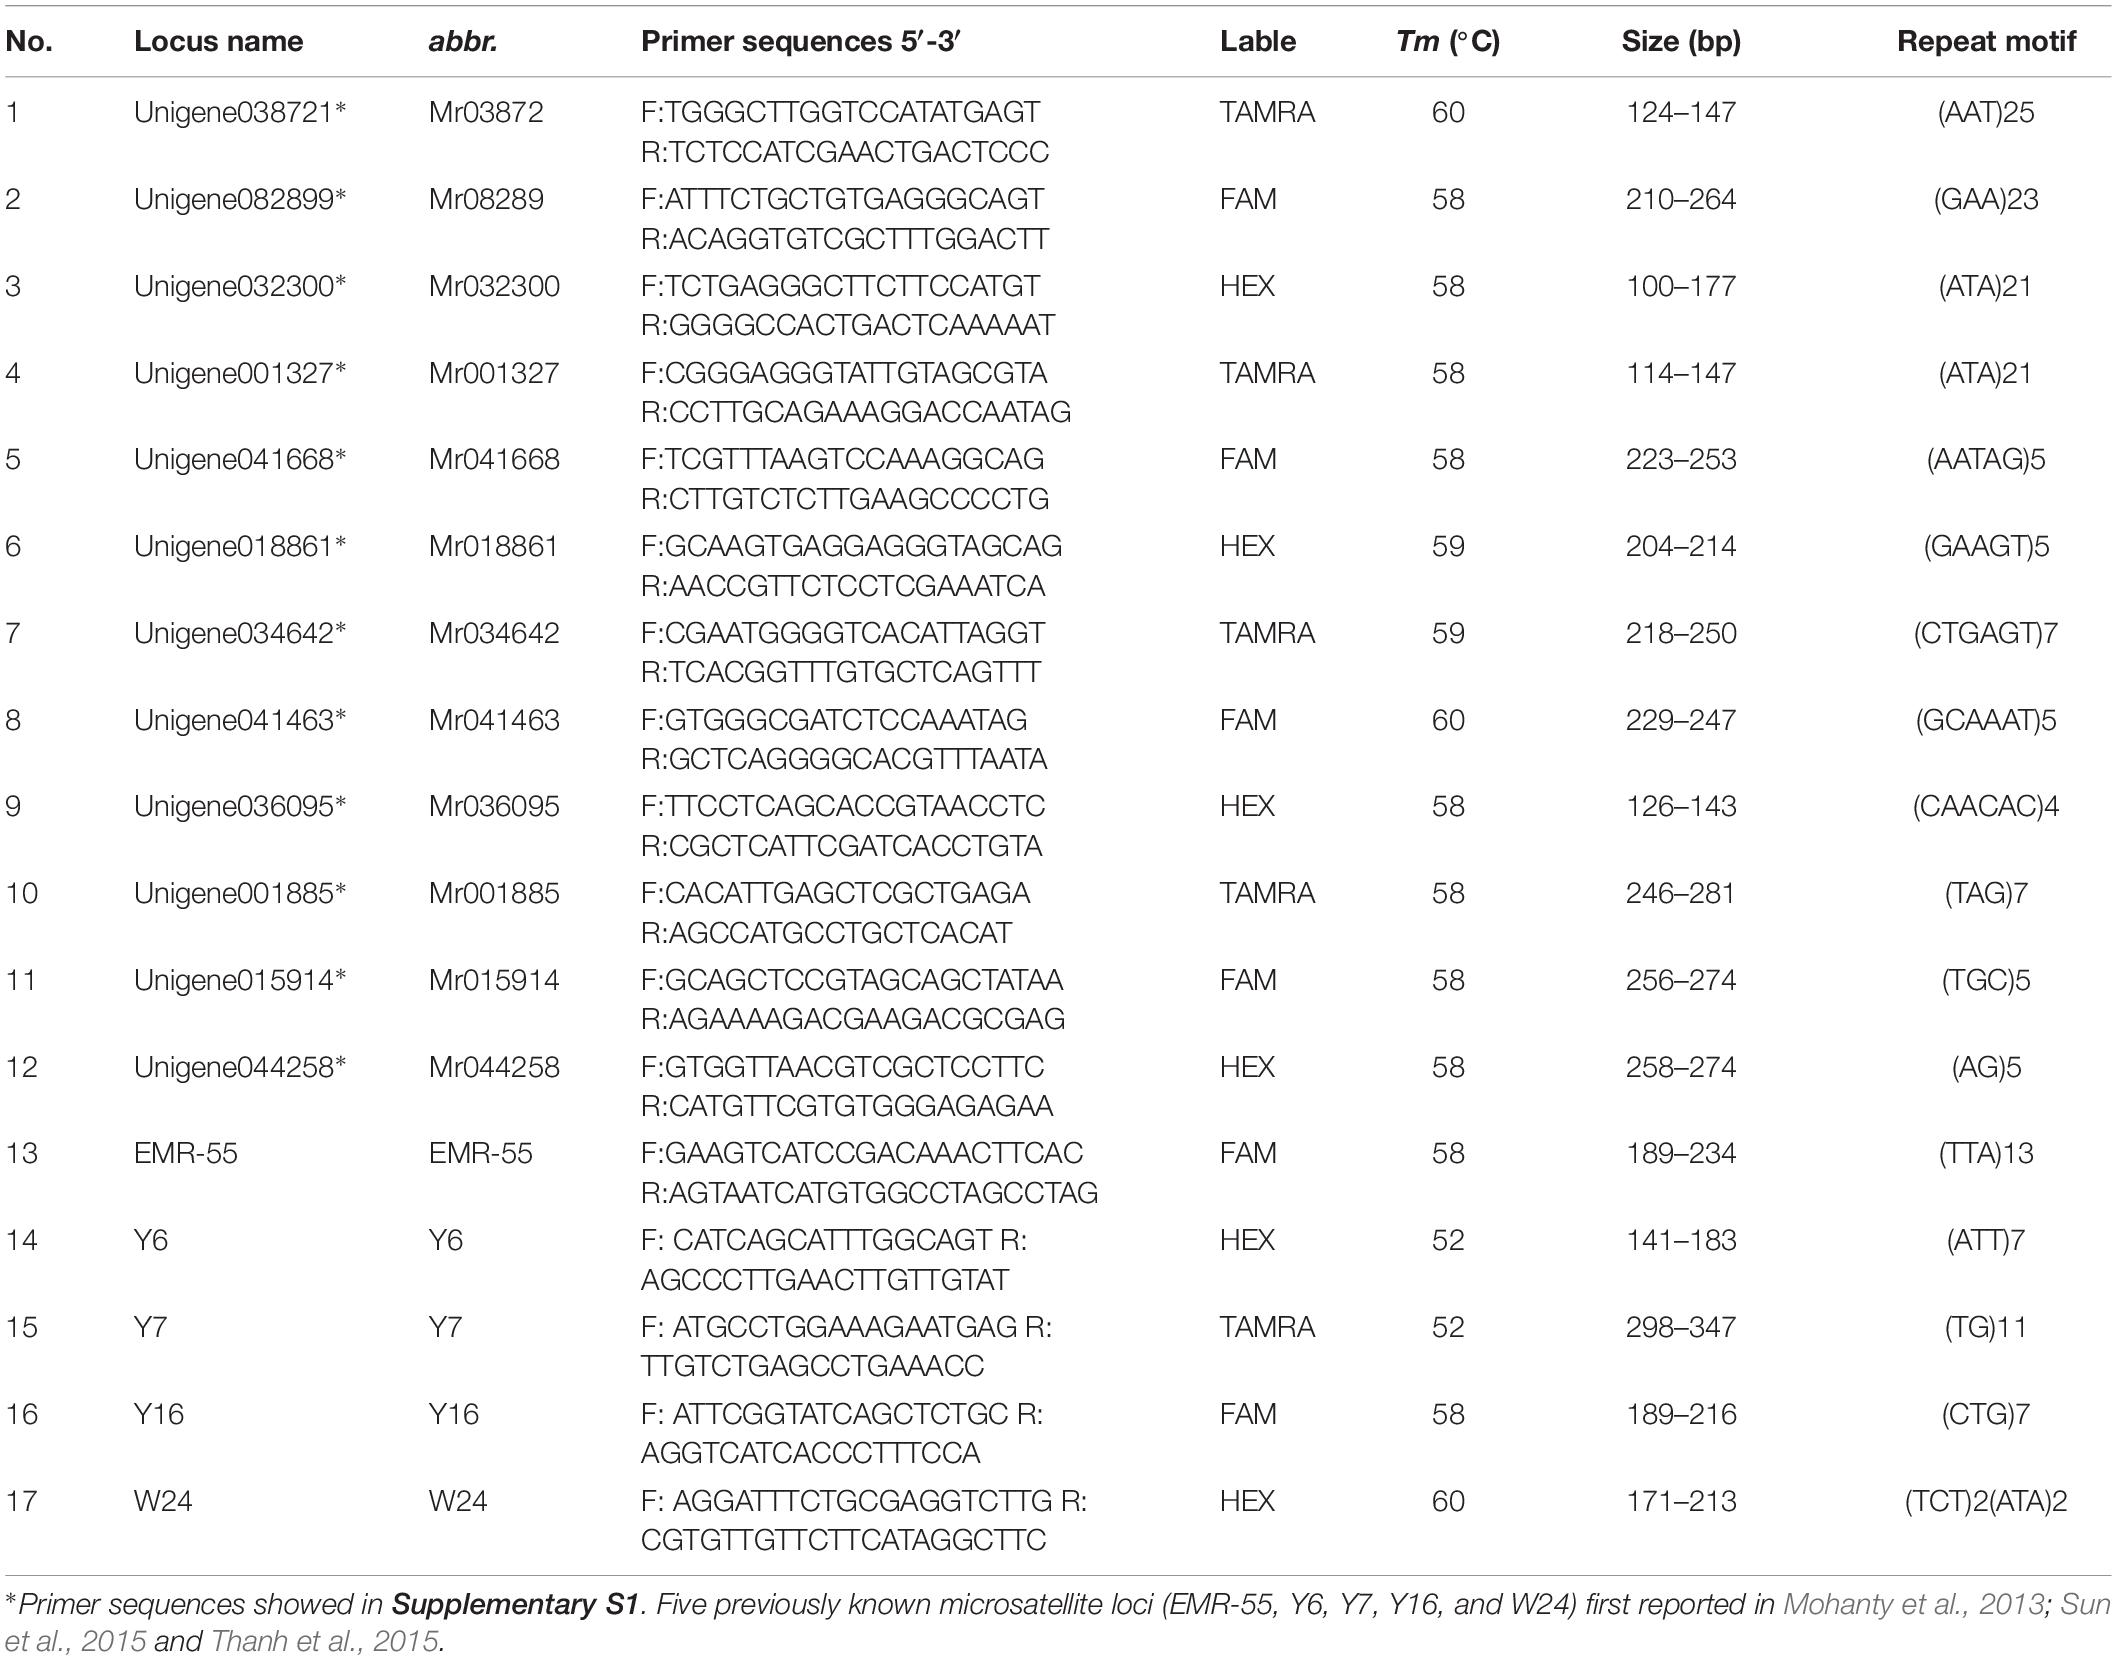
Table 2. Primer sequence and annealing temperature for microsatellite marker amplification.
Amplified products were resolved via capillary electrophoresis using an ABI 3730xl DNA analyzer (Applied Biosystems). The size of fragments was determined using GeneMapper® software version 3.5 (Applied Biosystems) by comparison against the GenScanTM 500 ROXTM (Applied Biosystems) internal size standard.
Commonly derived statistics from the microsatellite genotypic data including the allele frequency, observed number of alleles (No), observed heterozygosity (HO), expected heterozygosity (HE), and polymorphic information content (PIC) were calculated using the Microsatellite Toolkit for each locus and population (Park, 2001). The Hardy–Weinberg equilibrium test was carried out using the GENEPOP computer program (Raymond and Rousset, 1995), which was also used to estimate F statistics (FIT, FIS, and FST) (Weir and Cockerham, 1984) for each locus and the pairwise FST between populations. Nei’s genetic distance (DA) (Saitou and Nei, 1987) between populations was measured using the Microsatellite Analyzer (Dieringer and Schlotterer, 2003). The neighbor-joining (NJ) tree was generated using MEGA 5.0 software based on DA (Nei, 1987) to reveal the genetic relationships among the populations collected in the present study.
The model-based approach for the population structure test of the seven prawn populations was carried out with the software STRUCTURE 2.3.1 (Pritchard et al., 2000), which assessed genomic clustering (K) of the sample. To obtain a representative value of K for data modeling, seven independent runs were performed for each value from one to seven. The run length was set to 100,000 burn-ins followed by 100,000 iterations. The ΔK estimated the most likely number of K that represented the population structure (Evanno et al., 2005). Principal component analysis (PCA) was performed using GENALEX v.6.501 software (Peakall and Smouse, 2006, 2012) in order to spatially plot clusters and individuals based on the distance matrix with data standardization.
A polymorphism test of 12 novel loci was performed using the GFP populations. These markers comprised three hexanucleotide (Mr034642, Mr041463, and Mr036095), two tetranucleotide (Mr041668 and Mr018861), and one dinucleotide units (Mr044258), whereas the other contained trinucleotide units. Among five previously known makers, there were one complex repeat (W24), one dinucleotide repeat (Y7), and two trinucleotide units (EMR-55, Y6, and Y16). Seventeen loci were selected to investigate the genetic structure of cultured and wild GFP (Table 2).
Polymorphism was apparent at all the microsatellite loci in the seven GFP populations. The allele frequency at each locus in all the populations is shown in Figure 2. The genetic characteristics of the 17 microsatellite loci are listed in Table 3. The average Na was 8.94. The actual number of alleles ranged from 3 (Mr018861) to 18 (Y6). The average Ne ranged from 1.128 (Mr04146) to 12.570 (Y6), with an average across loci of 3.959. The PIC value ranged from 0.110 (Mr041463) to 0.9149 (Y6), with an overall average of 0.591. All the selected microsatellite loci were sufficiently polymorphic, indicating that these loci were suitable for the genetic analysis of GFP populations. The He among the seven microsatellite loci ranged from 0.077 (Mr041463) to 0.886 (Y6). The Ho among all the microsatellite loci ranged from 0.114 (Mr041463) to 0.923 (Y6), with an average of 0.637 (Table 3).

Figure 2. Histograms presented frequency of alleles across loci in the seven populations of M. rosenbergii.
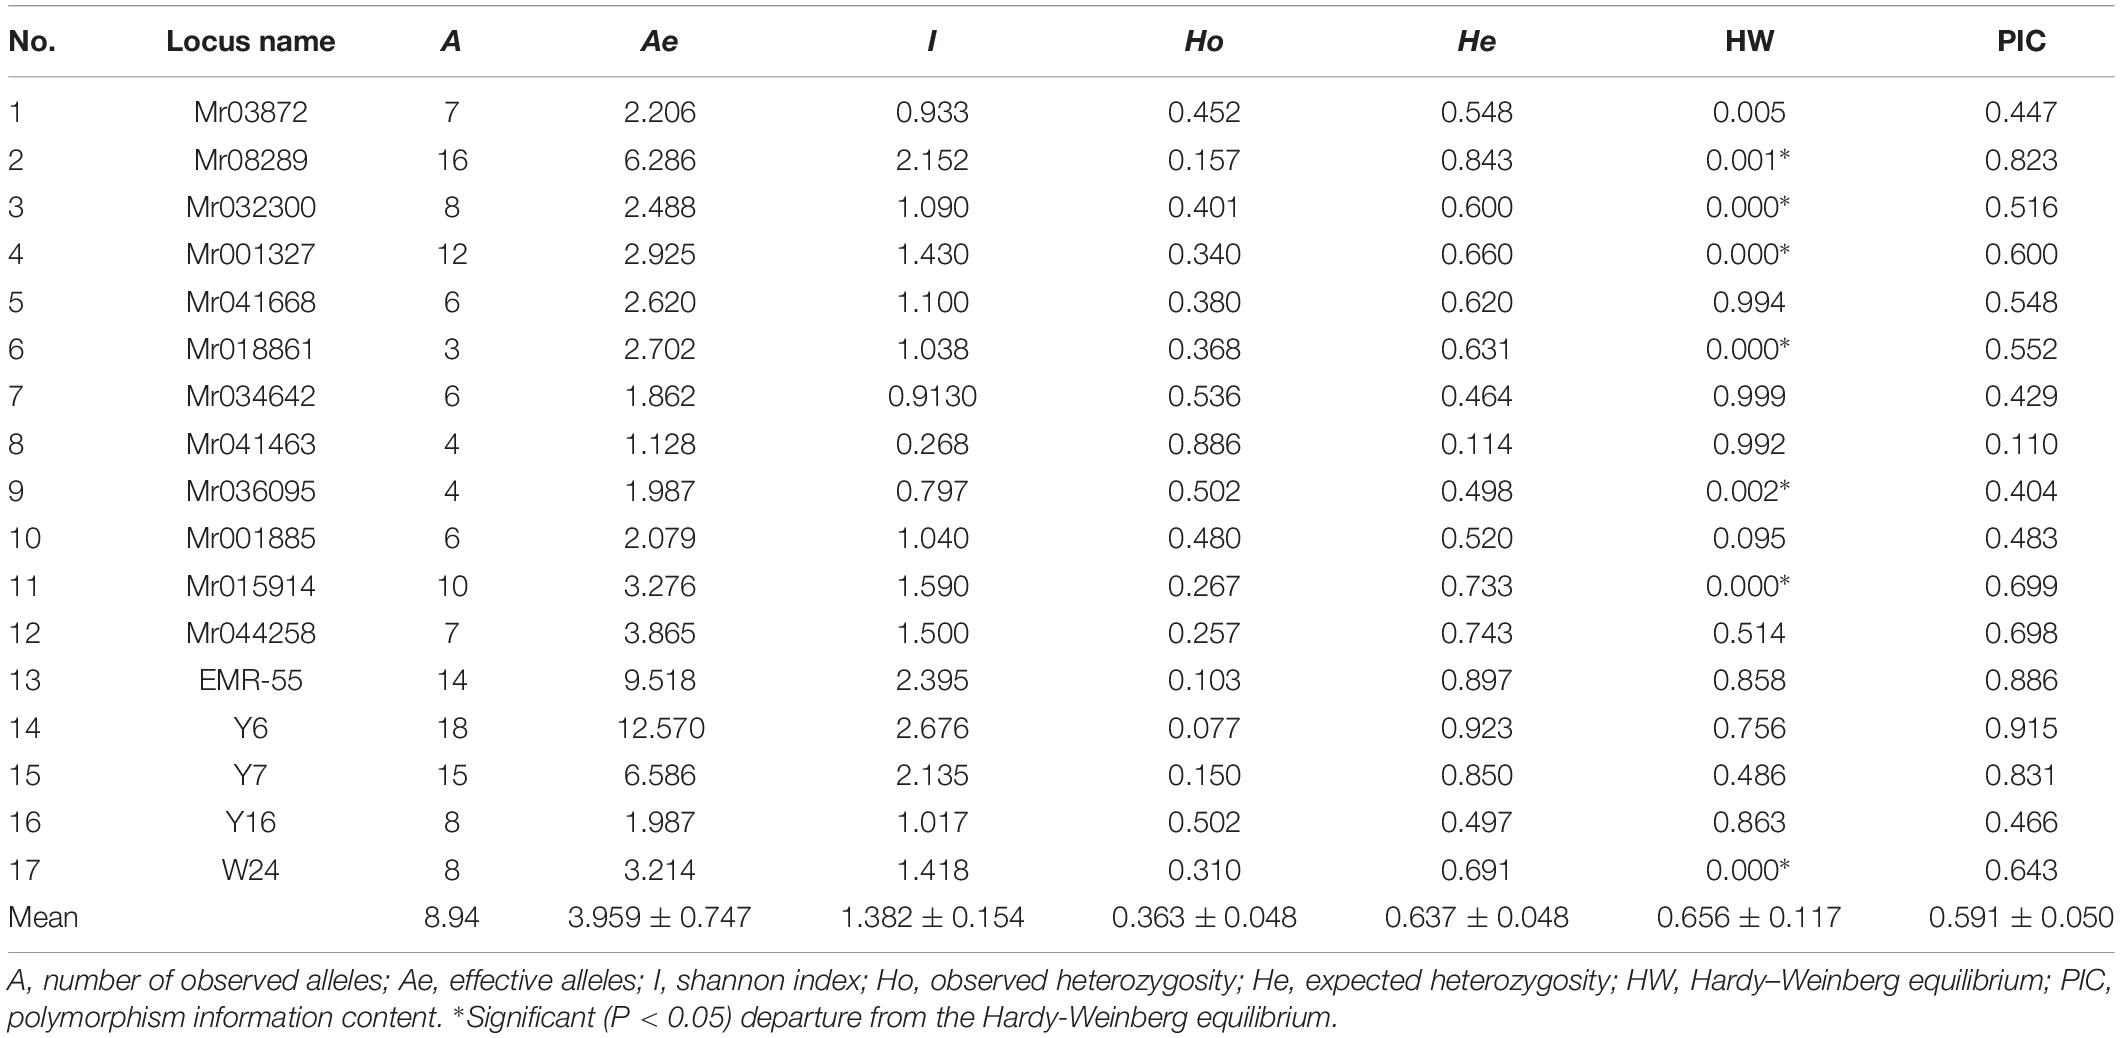
Table 3. Genetic variability at eighteen microsatellite loci in seven populations of M. rosenbergii.
The genetic polymorphism, including the Ho, He, PIC, and mean Na and Ne, were counted to assay the allelic diversity at each locus and each population. The results of 17 loci for the seven GFP populations are listed in Table 4 and Supplementary Table S1. The Ho varied from 0.313 in GX to 0.377 in AY and GDB, whereas the He varied from 0.569 in GX to 0.630 in YG. The PIC ranged from 0.503 in GX to 0.581 in YG. The mean Ho of all the populations at the 17 loci was lower than the He, and the PIC values were all >0.5. The YG population displayed the highest values of Na, Ne, I, He, and PIC. The GX population had the smallest value among all the genetic parameters.
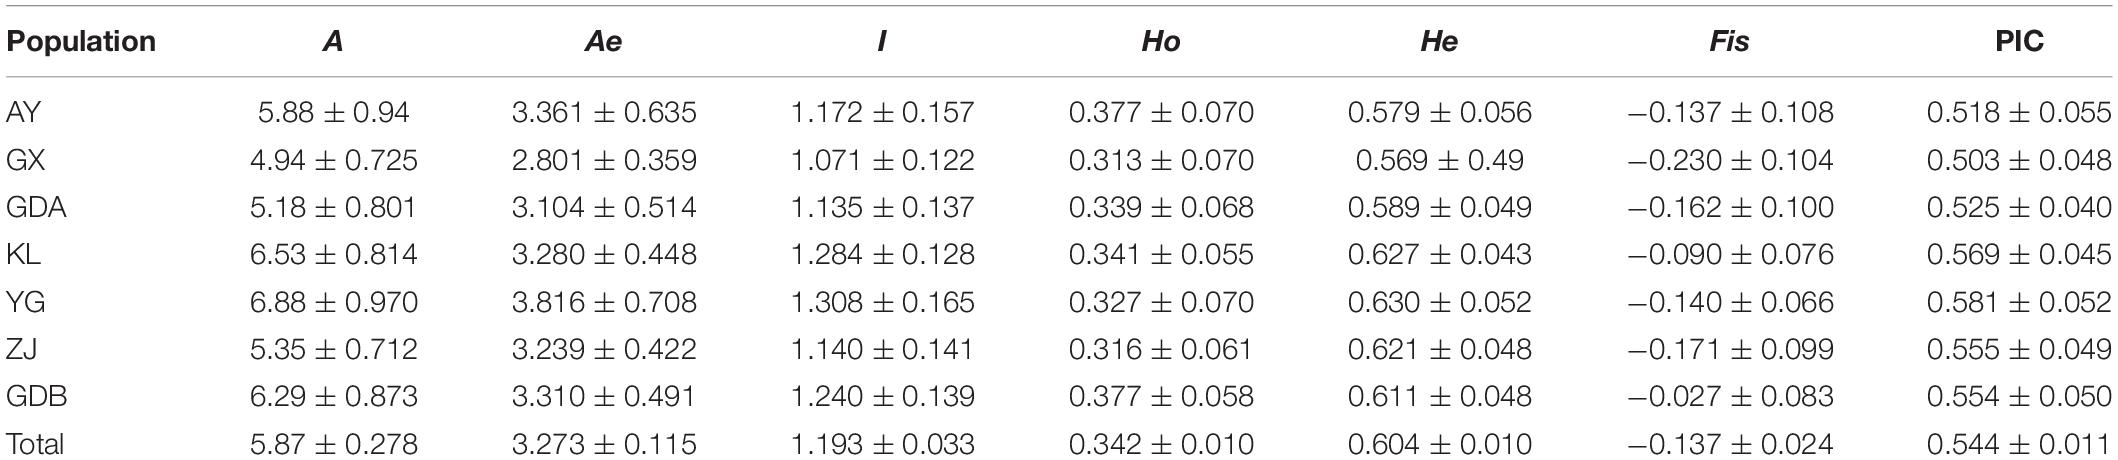
Table 4. Genetic variability at seventeen microsatellite loci in seven populations of M. rosenbergii.
The evaluation of genetic differentiation among the seven populations, using the genetic differentiation (FST) and DA between populations for comparison, are provided in Table 5. The FST of each population pair was highly statistically significant (P < 0.05). The GDB population presented the highest FST as to the other population, whereas the FST value was the smallest for pair-wise comparisons between the KL and GDA populations. The FST values of the remaining population pair ranged from 0.018 (for the GDA and AY population pair) to 0.071 (for the YG and KL population pair). The genetic distance between GDA and YG was the highest (0.274), and the minimum distance was observed between YG and GDA (0.031). The Analysis of Molecular Variance (AMOVA) indicated that 7.772% of the total variance was between the groups (i.e., wild and cultured populations), whereas 3.869% of the total variation and 8.218% of the variation belonged to differences among populations and within populations, respectively (Table 6).
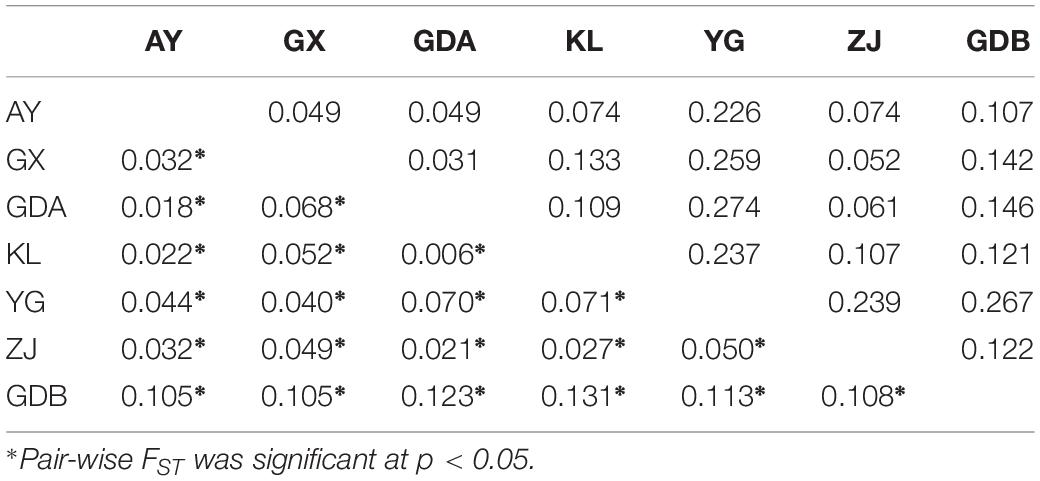
Table 5. Matrix of pair-wise FST values (below diagonal) and genetic distances (DA: above diagonal) between seven populations of M. rosenbergii.
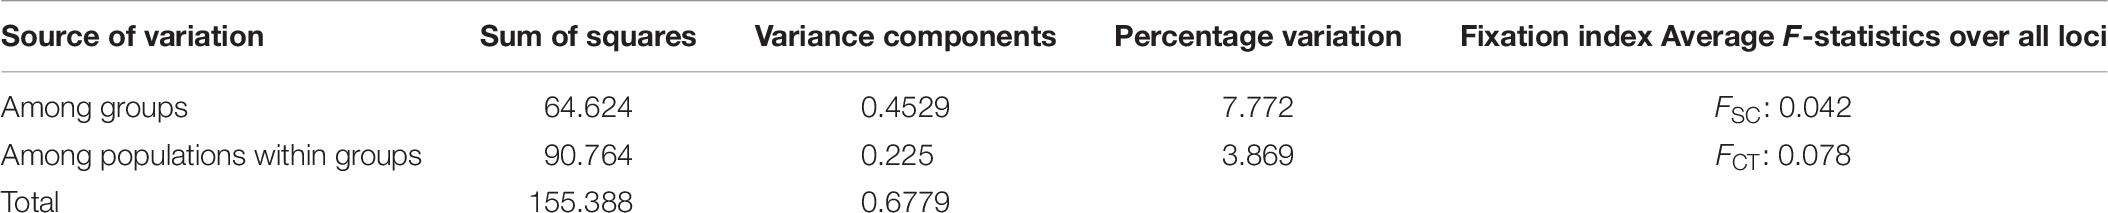
Table 6. Analysis of molecular variance (AMOVA) results for seven populations of M. rosenbergii.
The DA of these seven GFP populations was calculated, and the DA distance matrix was utilized to construct the NJ tree. Chinese cultured populations (GX, GDA, ZJ, and GDB) and the other cultured populations (AY and KL) were gathered together in a single major category. Among them, the GDA and AY populations were close to each other. YG of the wild population was clearly depicted as an independent taxon from the cultured populations (Figure 3). The PCA of pair-wise genetic distances in the seven populations was employed to represent the relative position of the individuals and populations. The first PC1, second PC2, and third PC3 accounted, respectively for 4.35, 3.47, and 2.9% of the total variation (Figure 4). The PCA result was similar to those of the phylogenetic tree drawn using the NJ method. The cultured populations were grouped in a cluster, whereas the wild population formed a distinct group.
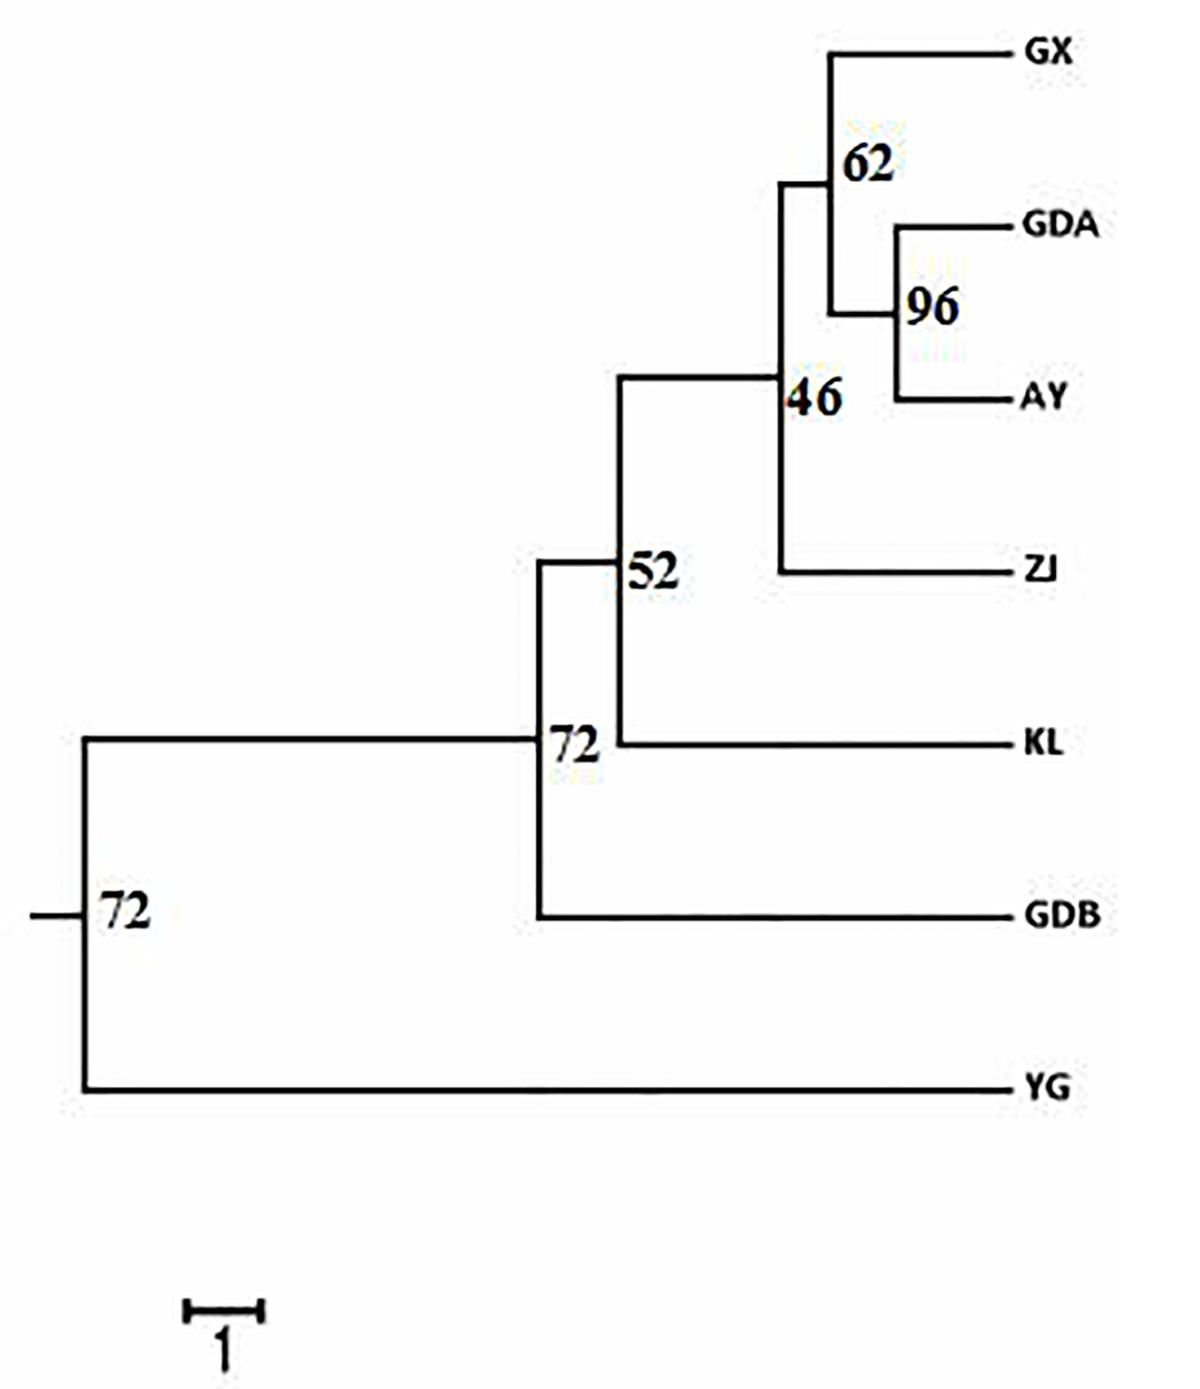
Figure 3. Representation of neighbor-joining Nei’s (1972) standard genetic distance among the seven populations of M. rosenbergii based on 1,000 replicates (numbers in nodes are percentage bootstrap values). See Table 1 for population abbreviations.
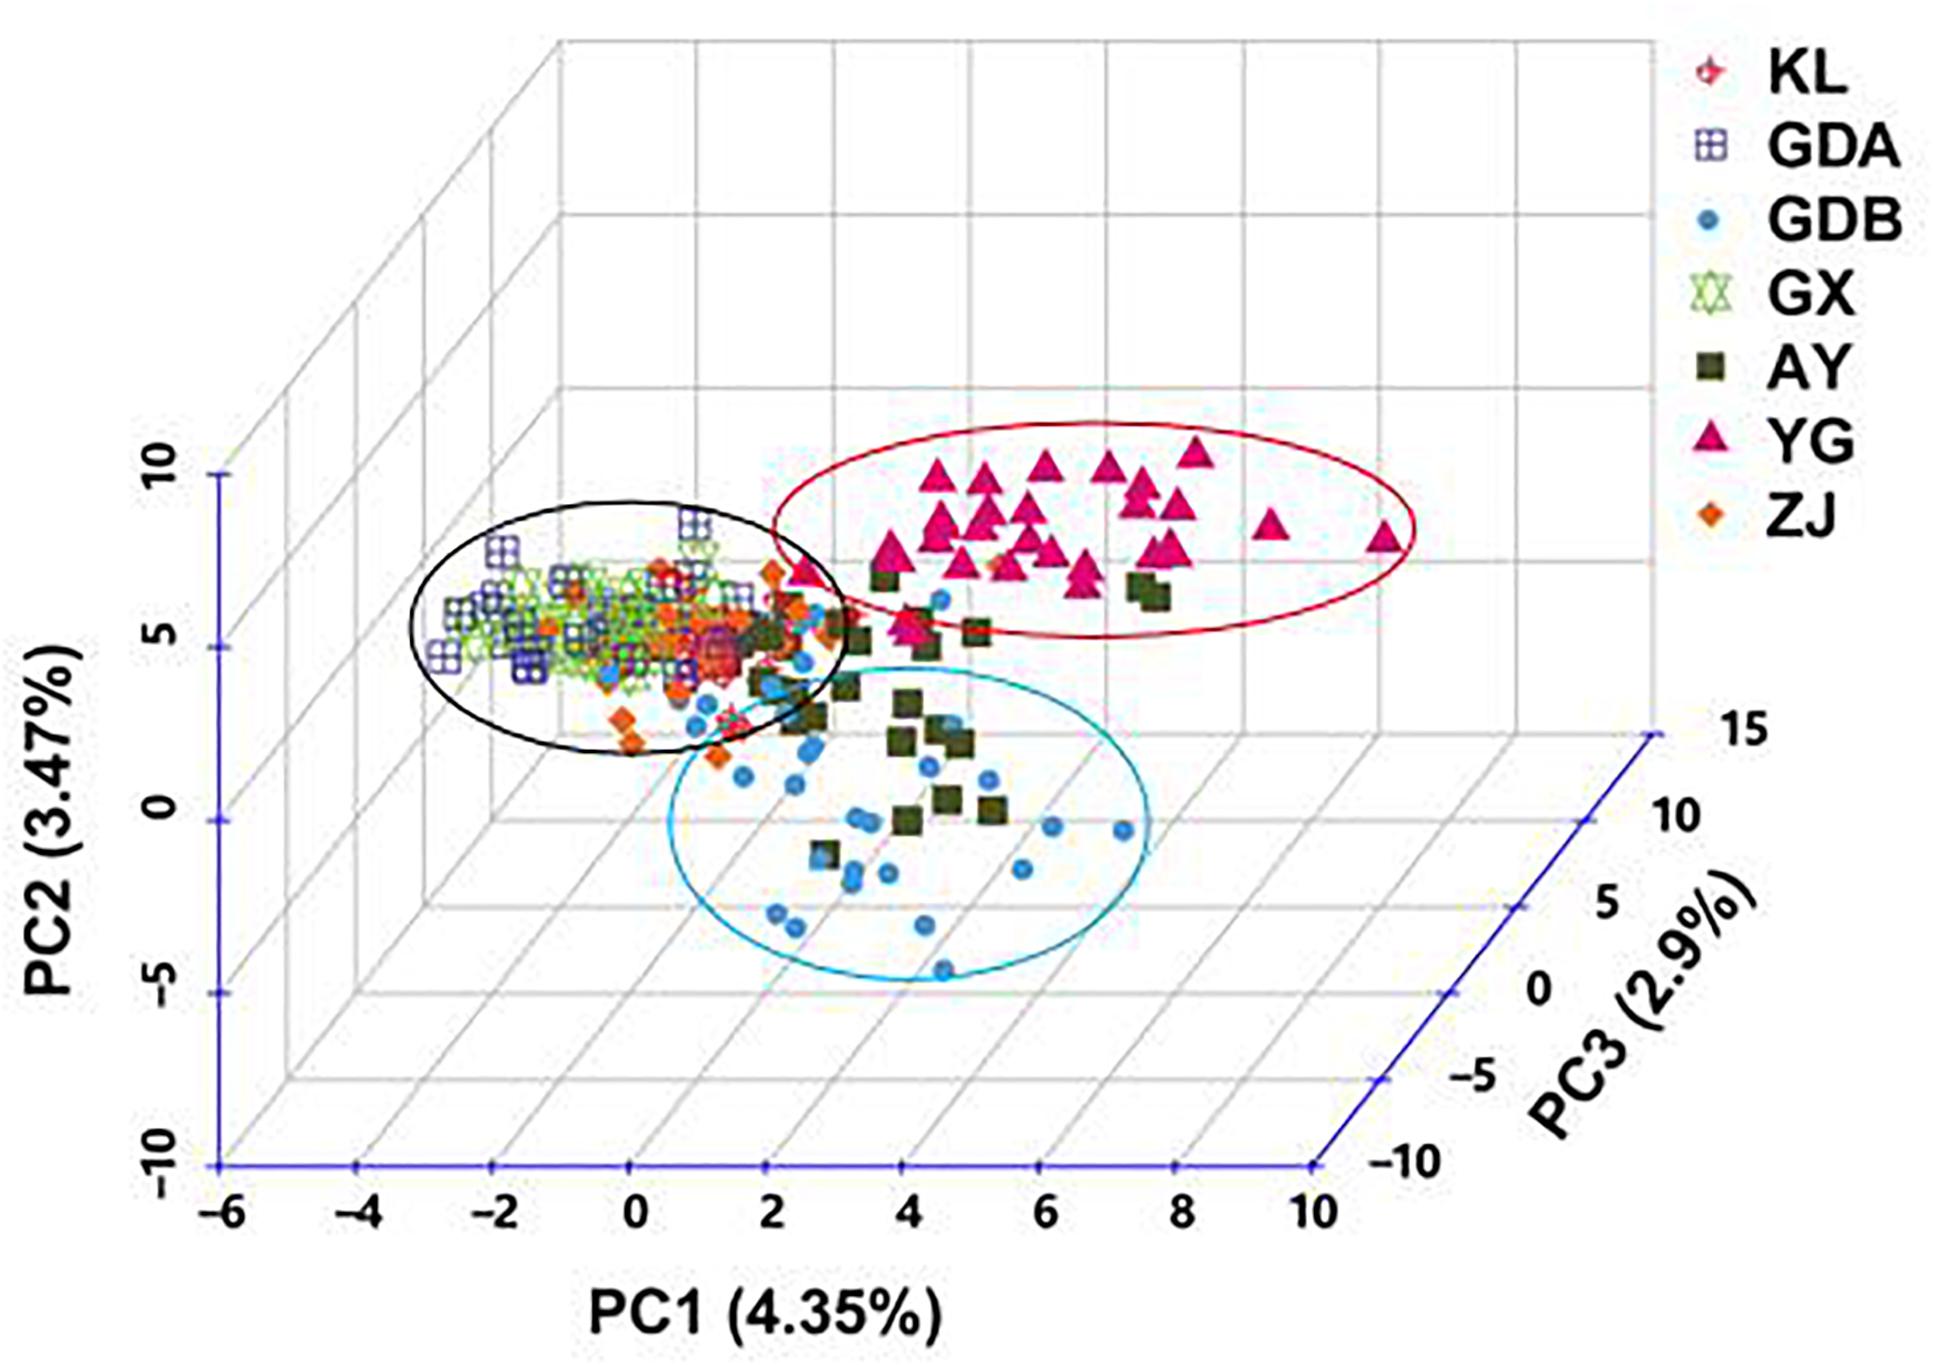
Figure 4. Principal coordinate analysis of all the individuals of M. rosenbergii based on dissimilarity matrix (1-Jaccard) between pairs of genotypes. Capital letter indicates the name of sample. PC, Principal coordinate.
The STRUCTURE software program using Bayesian model-based clustering algorithms of multi-locus genotypes was employed to assign individuals into populations by estimated individual admixture proportions and to infer the number of populations (K) for a given sample. When all the seven populations were separated into two parts (K = 2), one included four populations (i.e., AY, GX, GDA, and ZJ) and the other included three populations (KL, YG, and GDB). When K = 3, all the populations were divided into three parts, the first one included three populations (AY, KL, and GDB), another also included three populations (GX, GDA, and ZJ), whereas the wild population (YG) was in an independent group (Figure 5). At K = 4, the GDB population was separated into a new branch, whereas the AY population was disordered with no clear structure. However, no new bunch appeared, and the figures were not much different for values of K > 5 (Supplementary Figure S1). Based on the above results of STRUCTURE and the phylogenetic tree, the best K-value was 3.
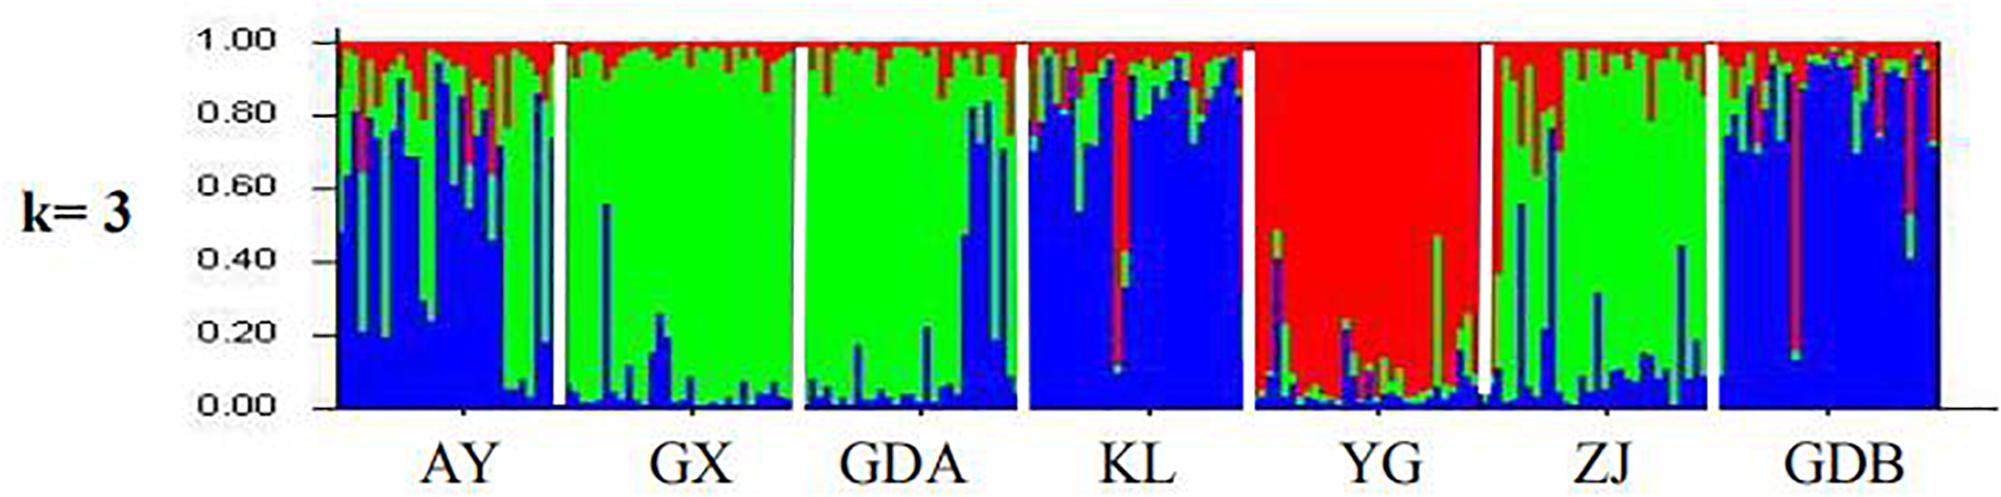
Figure 5. Clustering analysis of cultured and wild populations of M. rosenbergii.
There were 12 novel SSR loci that were obtained in the study. Among these markers, several hypervariable loci in the GFP population, including Mr08289 and Mr001327, were found (Table 2), which had been previously obtained in this species (Chand et al., 2005; Charoentawee et al., 2006; Divu et al., 2008; Mohanty et al., 2013; Thanh et al., 2015). These complex loci might be beneficial for the analysis of populations due to their excellent diversity. Besides these novel loci, five known markers with hypervariable loci were also utilized in this study to examine the alleles of the GFP populations to better estimate genetic diversity. The mean values of Na, Ho, He, and PIC across all the markers were 8.94, 0.363, 0.637, and 0.591, respectively. Previous studies have suggested that microsatellite markers used in studies of genetic variation and distance should have Ho values between 0.3 and 0.8 in the population, and the Na value should be at least five alleles in order to reduce the standard error of the distance estimates (Excoffier and Lischer, 2010; Lai et al., 2018). Our results suggested that the complexity of all the SSR markers utilized in the current study made them suitable for assessing the genetic structure of the GFP.
Information on genetic structure and connectivity of populations is critical for sustainable harvest of populations and the administration of diversity. A major finding of the study was the recognition that diversity in the cultured populations was low when compared with that in the wild population. The results showed that all the cultured populations had relatively low levels of genetic diversity, which was less than that reported previously (Chareontawee et al., 2007; Schneider et al., 2012), especially in genetic parameter comparison (Supplementary Table S1) using these published microsatellite loci (i.e., EMR-55, Y7, Y16, and W24) except Y6 (Sun et al., 2015; Thanh et al., 2015). The situation regarding the genetic background of GFP is a concern for the future. This might have several potential reasons, such as null alleles (Van Oosterhout et al., 2004), random genetic drift, founder effects, and artificial and natural selection in the cultured environments (Lacy, 1987; Thanh et al., 2015). Furthermore, it was probably caused by a rapid decline in wild stocks due to over harvesting, habitat loss, and increased population (Ng, 1997; New, 2000). In the present study, the wild population (YG) was collected in the Yangon River (Myanmar), which is a rich source of genetic diversity based on genetic allelic richness and He (Table 4). The phenomenon suggested that the wild population may be utilized to improve genetic diversity for their breeding program. In contrast, the GX and AY populations of cultured populations from China and Thailand possessed relatively fewer genetic resources. In the GFP aquaculture history of China, approximately 90% of the GFP seeds used in production are the offspring of the stock introduced about 25 years ago (Miao and Ge, 2002), and numerous private hatcheries have been utilizing broodstock identified as local strains to produce larvae in Thailand (Chareontawee et al., 2007). These cultured populations are probably a result of being both closed and small for a long period. Additional investigation on the genetic resources of these cultured populations should therefore be performed to verify the specific causes.
Another major outcome of the study was gaining a better understanding of the level and pattern of genetic diversity present in some available GFP strains in China and some populations in Southeast Asia, which would be suitable for a stock improvement program or intraspecific hybridization. Based on the AMOVA results, the proportion of genetic variation attributed to differences among groups in this study was approximately 7.772%, whereas the proportion attributed to ‘among populations within groups’ was 3.869% in the total genetic variation (Table 6), indicating that wild population and cultured populations should not be derived from the same source. This phenomenon was also confirmed with the NJ tree, which showed two clusters of wild populations and all the cultured populations (Figure 3). However, the wild population (YG) was an independent group, and all the cultured populations were divided into two parts (part 1 including the AY, KL, and GDB populations, and part 2 including the GX, GDA, and ZJ populations) when K = 3 based on the STRUCTURE analysis (Figure 5). Furthermore, similar results were obtained using the PCA (Figure 4). It is thus speculated that all the cultured populations were derived from other resources rather than the resources of Myanmar.
In the cultured populations, the analysis of GFP genetic identity confirmed that the cultured populations in China have relatively high similarity with those in Thailand and Malaysia (Table 5), indicating these commercial hatchery stocks in China are still derived mainly from the Southeast Asian resource. On the contrary, the AY, KL, and GDB populations were of the same origin, whereas the GX, GDA, and ZJ populations were from another similar resource based on the STRUCTURE analysis (Figure 5). The results further suggested that these cultured populations of Southeast Asia were not derived from a single resource. Although we could not confirm the origin of cultured GFP populations based on the current research results, Thanh et al. (2015) thought that some cultured populations in China might have originated from a wild source of the Mekong or the Dong Nai River in Vietnam. Thus, further studies on the origin of GFP cultured resources are needed using representative wild populations coming from different regions of Southeast Asia.
In conclusion, this study documented that the 17 SSR loci, including the 12 novel SSR loci obtained in this study, are useful in analyzing the relationships and genetic diversity in the cultured and wild GFP populations in Southeast Asia. Furthermore, the study provides a baseline for genetic investigation of GFP resources and practical guidelines for the hatchery industry. A proper management program of local hatchery stocks is required to preserve the genetic diversity for continued and sustainable development of GFP aquaculture.
The raw data supporting the conclusions of this manuscript will be made available by the authors, without undue reservation, to any qualified researcher.
LY and XZ designed the research. JL supplied the samples. JF and CC performed the analysis. LY wrote the manuscript.
This study was funded by the Central Public Interest Scientific Institution Basal Research Fund, CAFS (Nos. 2018SJ-YZ01 and 2019ZX0304), the China-ASEAN Maritime Cooperation Fund (CAMC-2018F), and the Scientific Innovation Fund, PRFRI (No. CZ-2019-04).
JL author was employed by Foshan Sanshui Baijin Aquatic Seedling Co., Ltd.
The remaining authors declare that the research was conducted in the absence of any commercial or financial relationships that could be construed as a potential conflict of interest.
We would like to thank Mr. Yongqing Ye from the Guangdong Daynew Aquatic Sci-Tech Co., Ltd., for his help and Editage (www.editage.cn) for English language editing.
The Supplementary Material for this article can be found online at: https://www.frontiersin.org/articles/10.3389/fmars.2019.00323/full#supplementary-material
FIGURE S1 | Clustering analysis of cultured and wild populations of M. rosenbergii.
TABLE S1 | Genetic variability at seventeen microsatellite loci in seven populations of M. rosenbergii.
SUPPLEMENTARY S1 | Sequences information of microsatellite markers in GFP transcriptome data.
Agarwal, D., Aich, N., Pavan-Kumar, A., Kumar, S., Sabnis, S., Joshi, C. G., et al. (2016). SNP mining in transcripts and concomitant estimation of genetic variation in Macrobrachium rosenbergii stocks. Conserv. Genet. Resour. 8, 1–10.
Alam, M. M. M., Westfall, K. M., and Palsson, S. (2017). Historical demography and genetic differentiation of the giant freshwater prawn Macrobrachium rosenbergii in Bangladesh based on mitochondrial and ddRAD sequence variation. Ecol. Evol. 7, 4326–4335. doi: 10.1002/ece3.3023
Chand, V., de Bruyn, M., and Mather, P. B. (2005). Microsatellite loci in the eastern form of the giant freshwater prawn (Macrobrachium rosenbergii). Mol. Ecol. Notes 5, 308–310. doi: 10.1111/j.1471-8286.2005.00910.x
Chareontawee, K., Poompuang, S., Na-Nakorn, U., and Kamonrat, W. (2007). Genetic diversity of hatchery stocks of giant freshwater prawn (Macrobrachium rosenbergii) in Thailand. Aquaculture 271, 121–129. doi: 10.1016/j.aquaculture.2007.07.001
Charoentawee, K., Poompuang, S., and Nakorn, U. (2006). Isolation and characterization of microsatellite in giant freshwater prawn Macrobrachium rosenbergii. Mol. Ecol. Notes 6, 823–825. doi: 10.1111/j.1755-0998.2008.02127.x
De Bruyn, M., Nugroho, E., Hossain, M. M., Wilson, J. C., and Mather, P. B. (2005). Phylogeographic evidence for the existence of an ancient biogeographic barrier: the Isthmus of Kra Seaway. Heredity 94, 370–378. doi: 10.1038/sj.hdy.6800613
Dieringer, D., and Schlotterer, C. (2003). Microsatellite analyser (MSA): a platform independent analysis tool for large microsatellite data sets. Mol. Ecol. 3, 167–169. doi: 10.1046/j.1471-8286.2003.00351.x
Divu, D., Karunasagar, I., and Karunasagar, I. (2008). Microsatellite DNA markers in the giant freshwater prawn, Macrobrachium rosenbergii: a tool for genetic analysis. Mol. Ecol. Resour. 8, 1040–1042. doi: 10.1111/j.1755-0998.2008.02148.x
Evanno, G. G., Regnaut, S. S., and Gouder, J. J. (2005). Detecting the number of clusters of individuals using the software STRUCTURE: a simulation study. Mol. Ecol. 14, 2611–2620. doi: 10.1111/j.1365-294x.2005.02553.x
Excoffier, L., and Lischer, H. E. L. (2010). Arlequin suite ver 3.5: a new series of programs to perform population genetics analyses under Linux and Windows. Mol. Ecol. Resour. 10, 564–567. doi: 10.1111/j.1755-0998.2010.02847.x
Food and Agriculture Organization of the United Nations [FAO] (2018). Cultured Aquatic Species Fact Sheets: Giant Freshwater Prawn (Macrobrachium rosenbergii). Rome: Food and Agriculture Organization of the United Nations.
Fujimura, T., and Okamoto, H. (1972). “Notes on progress made in developing a mass culturing technique for Macrobrachium rosenbergii in Hawaii,” in Coastal Aquaculture in the Indo-Pacific Region, ed. T. V. R. Pilay (West Byfleet: Fishing News Books), 313–327.
Hedgecock, D., Stelmach, D. J., Nelson, K., Lindenfelser, M. E., and Malecha, S. R. (1979). Genetic divergence and biogeography of natural populations of Macrobrachium rosenbergii. Proc. World Maricult. Soc. 10, 873–879. doi: 10.1111/j.1749-7345.1979.tb00084.x
Jarne, P., and Lagoda, P. J. (1996). Microsatellites, from molecules to population and back. Trends Ecol. Evol. 11, 424–429. doi: 10.1016/0169-5347(96)10049-5
Jung, H., Lyon, R. E., Li, Y., Thanh, N. M., Dinh, H., Hurwood, D. A., et al. (2014). A candidate gene association study for growth performance in an improved giant freshwater prawn (Macrobrachium rosenbergii) culture line. Mar. Biotechnol. 16, 161–180. doi: 10.1007/s10126-013-9555-7
Lacy, R. C. (1987). Loss of genetic diversity from managed populations: interacting effects of drift, mutation, selection, and population subdivision. Conserv. Biol. 1, 143–158. doi: 10.1111/j.1523-1739.1987.tb00023.x
Lai, F. Y., Tu, P. A., Ding, S. T., Lin, M. J., Chang, S. C., Lin, E. C., et al. (2018). Survey of genetic structure of geese using novel microsatellite markers. Asian-Australas J. Anim. Sci. 31, 167–179. doi: 10.5713/ajas.17.0224
Ling, S. W. (1969). The General Biology and Development of Macrobrachium resonbergii. Rome: FAO. 589–606.
Liu, Z. J., and Cordes, J. F. (2004). DNA marker technologies and their application in aquaculture genetics. Aquaculture 238, 1–37. doi: 10.1016/j.aquaculture.2004.05.027
Manechini, J. R. V., da Costa, J. B., Pereira, B. T., Carlini-Garcia, L. A., Xavier, M. A., Landell, M. G. A., et al. (2017). Unraveling the genetic structure of Brazilian commercial sugarcane cultivars through microsatellite markers. PLoS One 13:e0195623. doi: 10.1371/journal.pone.0195623
Miao, W. M., and Ge, X. P. (2002). Freshwater prawn culture in China: an overview. Aquacult. Asia 7, 7–12.
Mohanty, P., Sahoo, L., Parida, K., and Das, P. (2013). Development of polymorphic EST-SSR markers in Macrobrachium rosenbergii by data mining. Conserv. Genet. Resour. 5, 133–136. doi: 10.1007/s12686-012-9751-1
New, M. B. (2000). “History and global status of freshwater prawn farming,” in Freshwater Prawn Culture; the Farming of Macrobrachium rosenbergii, eds M. B. New and W. C. Valenti (Oxford: Blackwell Science), 1–11. doi: 10.1002/9780470999554.ch1
Ng, P. K. L. (1997). The conservation status of freshwater prawn and crabs in Singapore with emphasis on the nature reserves. Proc. Natl. Res. Surv. Sem. Gard. Bull. Singap. 49, 267–272.
Park, S. D. E. (2001). Trypanotolerance in West African Cattle and the Population Genetic Effects of Selection. [Ph.D.Thesis]. Dublin University: Dublin
Peakall, R. R., and Smouse, P. E. P. (2006). GenAlEx 6: genetic analysis in Excel. Population genetic software for teaching and research. Mol. Ecol. Notes 6, 288–295. doi: 10.1111/j.1471-8286.2005.01155.x
Peakall, R. R., and Smouse, P. E. P. (2012). GenAlEx 6.5: genetic analysis in Excel. Population genetic software for teaching and research-an update. Mol. Ecol. Notes 28, 2537–2549.
Pritchard, J. K., Stephens, M., and Donnelly, P. (2000). Inference of population structure using multilocus genotype data. Genetics 155, 945–949.
Raymond, M., and Rousset, F. (1995). GENEPOP (version 1.2): population genetics software for exact tests and ecumenicism. J. Hered. 86, 248–249. doi: 10.1093/oxfordjournals.jhered.a111573
Saitou, N., and Nei, M. (1987). The neighboring-joining method: a new method for reconstructing phylogenetic tress. Mol. Biol. Evol. 4, 406–425.
Schneider, K., Tidwell, J., Gomelsky, B., Pomper, K., Waldbieser, G., Saillant, E., et al. (2012). Genetic diversity of cultured and wild populations of the giant freshwater prawn Macrobrachium rosenbergii (de Man, 1879) based on microsatellite analysis. Aquacult. Res. 44, 1425–1437. doi: 10.1111/j.1365-2109.2012.03147.x
Sun, C., Ye, X., Dong, J., Tian, Y., and Liang, J. (2015). Genetic diversity analysis of six cultured populations of Macrobrachium rosenbergii using microsatellite markers. South China Fish. Sci. 11, 20–26.
Thanh, H., Liu, Q., Zhao, L., Zhang, H., and Liu, J. (2015). Genetic diversity of the cultured giant freshwater prawn (Macrobrachium rosenbergii) in China based on microsatellite markers. Biochem. Syst. Ecol. 59, 144–154. doi: 10.1016/j.bse.2014.12.023
Van Oosterhout, C., William, F. H., Derek, P. M. W., and Peter, S. (2004). Micro- checker: software for identifying and correcting genotyping errors in microsatellite data. Mol. Ecol. Notes 4, 535–538. doi: 10.1111/j.1471-8286.2004.00684.x
Vieira, M. L. C., Santini, L., Diniz, A. L., Munhoz, C., and de, F. (2016). Microsatellite markers: what they mean and why they are so useful. Genet. Mol. Biol. 39, 312–328. doi: 10.1590/1678-4685-gmb-2016-0027
Weber, J. L., and May, P. E. (1989). Abundant class of human DNA polymorphisms which can be typed using the polymerase chain-reaction. Am. J. Hum. Genet. 33, 388–396.
Weir, B. S., and Cockerham, C. C. (1984). Estimating F-statistics for the analysis of population structure. Evolution 38, 1358–1370. doi: 10.1111/j.1558-5646.1984.tb05657.x
Yang, G., Frinsko, M., Chen, X., Wang, J., Hu, G., and Gao, Q. (2008). New technique for induced breeding and culture of giant freshwater prawn (part one). Sci. Fish Farm. 10, 12–13.
Yang, G., Frinsko, M., Chen, X., Wang, J., Hu, G., and Gao, Q. (2012). Current status of the giant freshwater prawn (Macrobrachium rosenbergii) industry in China, with special reference to live transportation. Aquacult. Res. 43, 1049–1055. doi: 10.1111/j.1365-2109.2011.03009.x
Keywords: genetic diversity, genetic structure, giant freshwater prawn, Macrobrachium rosenbergii, microsatellite
Citation: Yu L, Zhu X, Liang J, Fan J and Chen C (2019) Analysis of Genetic Structure of Wild and Cultured Giant Freshwater Prawn (Macrobrachium rosenbergii) Using Newly Developed Microsatellite. Front. Mar. Sci. 6:323. doi: 10.3389/fmars.2019.00323
Received: 05 March 2019; Accepted: 28 May 2019;
Published: 18 June 2019.
Edited by:
Dongdong Xu, Marine Fisheries Research Institute of Zhejiang, ChinaReviewed by:
Supawadee Poompuang, Kasetsart University, ThailandCopyright © 2019 Yu, Zhu, Liang, Fan and Chen. This is an open-access article distributed under the terms of the Creative Commons Attribution License (CC BY). The use, distribution or reproduction in other forums is permitted, provided the original author(s) and the copyright owner(s) are credited and that the original publication in this journal is cited, in accordance with accepted academic practice. No use, distribution or reproduction is permitted which does not comply with these terms.
*Correspondence: Lingyun Yu, bHlzbnBAMTYzLmNvbQ==; Xinping Zhu, emh1eGlucGluZ18xOTY0QDE2My5jb20=
Disclaimer: All claims expressed in this article are solely those of the authors and do not necessarily represent those of their affiliated organizations, or those of the publisher, the editors and the reviewers. Any product that may be evaluated in this article or claim that may be made by its manufacturer is not guaranteed or endorsed by the publisher.
Research integrity at Frontiers
Learn more about the work of our research integrity team to safeguard the quality of each article we publish.