 Victoria Futch
 Arthur Allen
95% of researchers rate our articles as excellent or good
Learn more about the work of our research integrity team to safeguard the quality of each article we publish.
Find out more
MINI REVIEW article
Front. Mar. Sci. , 06 June 2019
Sec. Ocean Observation
Volume 6 - 2019 | https://doi.org/10.3389/fmars.2019.00301
This article is part of the Research Topic Oceanobs'19: An Ocean of Opportunity View all 136 articles
Search and rescue (SAR) in remote maritime locations is a difficult mission. One of the limitations in these isolated regions is the low density of available oceanographic data for model validation. In order to examine the state of remote search and rescue a review of maritime search theory and advances was conducted. This included basic drift theory, leeway, available environmental data, and the current methods used by the United States Coast Guard for SAR operations. In particular the U.S. Coast Guard's fourteenth district's SAR case history was examined and it was found that 60% of SAR cases fall outside of areas that have high-resolution wind and current data, with only global scale model forecasts available. In addition, 2% of cases occurred in offshore waters (> 12 nm from land) and exceeded 36 h in asset response time. Three SAR simulations were run off the coast of Oahu, Hawaii using the same wind data but different surface current models. These simulations had extremely large (up to 12,000 km2) search areas, highlighting the need for solutions that narrow these expected areas.
The United States Coast Guard (USCG) is responsible for more than 21.3 million square nautical miles of ocean and oversees 11 mission areas including aids to navigation, living marine resources, law enforcement, and search and rescue. In 2017, the USCG responded to 16,000 search and rescue (SAR) cases and saved over 4,000 lives. Although most SAR cases are short lived and do not require an extensive search, the cases that do extend over multiple days and necessitate extensive asset allocations are quite expensive. These cases generally have a low probability of successfully finding missing persons alive. During a typical SAR case, nowcast and forecasted oceanographic and meteorological data from numerical models are used to predict the drift pattern of the lost object or person using leeway calculations. In many areas there are limited observational oceanographic datasets available to verify drift prediction from the fields, which can reduce the probability of success. A prime example is the Coast Guard's fourteenth district, which is responsible for the Hawaiian Islands, America Samoa, Guam, the Northern Mariana Islands, and the Republic of the Marshall Islands as well as the high seas in between. Many of these regions are isolated and lack observational current data for model validation. In addition, the island regime creates unique issues that are not common in mainland region cases such as the large ocean distance between population centers, crossing between islands can cover deep, exposed waters and may be done in small craft (Brushett et al., 2014). Here, we review the literature on SAR in maritime environments and examine SAR statistics in the USCG's fourteenth district to identify gaps in our current oceanographic data coverage. Then, using current methods and datasets available to USCG SAR, we run three example case studies in the Hawaiian Islands.
Objects lost at sea are subject to forcing from ocean currents, winds and waves. For SAR purposes, an object drifting in the ocean subject only to a current Vc is expected to drift at the same speed as and in the direction of Vc. However, the addition of wind complicates the equations. Due to the complex nature of wind forcing on the ocean surface and the fact that the area exposed to the wind is different for each search object, a drift prediction requires more than just knowledge of the surface current speed. Total drift is predicted from leeway, defined as the motion of the object induced by the 10-m reference height wind and surface waves relative to the ocean current in Breivik et al. (2013) as well as Allen and Plourde (1999). Using the definitions put forth in Allen (2005), wind forcing is treated as a vector with a direction and magnitude. Leeway speed is the velocity given to a drifting object from the wind, relative to the ambient currents. It is usually noted as a percentage of the wind speed. Leeway angle represents the angular offset from the downwind direction. This angle, when combined with the downwind component leeway, and the crosswind component, creates the full leeway vector. A thorough discussion of these principles is given in many previous key publications (Allen, 2005; Hackett et al., 2006; Breivik and Allen, 2008; Breivik et al., 2013).
The leeway of an object does not just represent wind forcing on a drifting object. As detailed in Brushett et al. (2014) and Hodgins and Hodgins (1998), the total drift of an object is the sum of the drift caused by the currents and the drift caused by leeway. However, inside both of these sources of drift are subcategories. The drift caused by currents can be thought of as the superposition of the drift caused by surface currents and the drift caused by stokes drift. The drift caused by leeway can similarly be broken down into a component caused by wind upon the surface of the ocean and the impact of waves. Leeway estimates therefore include impacts from stokes drift, waves, and wind. It has been shown by Hodgins and Hodgins (1998) and Breivik and Allen (2008) that leeway impacts caused by wave motion can be ignored for objects smaller than one half of the wavelength of the average wave. The leeway caused by the stokes drift from local wind driven sea waves will predominantly be in the downwind direction. Leeway caused by stokes drift from swell could occur in any direction and would therefore be wrapped into both the downwind and crosswind leeway estimates.
Leeway is normally calculated using either the direct method, by measuring drift through water using attached current meters and anemometers, or the indirect method of subtracting the estimate of current drift from the total drift (Allen and Plourde, 1999). For different drift objects such as a person in the water, a liferaft, or a 36′ sailboat, leeway parameters specific to each object need to be measured and recorded for use during SAR operations. As of this publication date there are 89 different leeway categories available, with more being tested every year. New advancements in leeway calculation have shown that it is possible to create a model of leeway drift using the balance of hydrodynamic and aerodynamic forces. This was conducted by Di Maio et al. (2016) on a person in the water, with the modeled leeway performing better than the statistical approach described above. If this model proves accurate with other objects, it could reduce the need for direct measurement of leeway parameters.
Observational data can be used during search and rescue operations in three main ways: (a) validation of numerical model output, (b) used directly or through a short term predictive model to predict drift, or (c) through assimilation into ocean models that are then used to predict drift.
Surface drifting buoys are commonly used to validate ocean currents during SAR operations (Breivik et al., 2013). These units are deployed in the area of interest and their drift is compared to available numerical model outputs, which aide in the placement of search patterns used by response assets. A thorough discussion of the use of surface drifting buoys for SAR is provided in Berkson et al. (2019), Wilkin et al. (2017), Roarty et al. (2018), and Roarty et al. (2016).
The availability of High Frequency (HF) Radar surface current data has expanded over the last twenty years. Integrated HF radar networks are available for operational oceanographic use in the United States (IOOS, discussed below), Australia (Australian Coastal Ocean Radar Network, ACORN), the Mediterranean Sea (Tracking Oil Spill and Coastal Awareness, TOSCA) and since 2017, as a global HF radar network (http://global-hfradar.org/). The U.S. Integrated Ocean Observing System (IOOS), through its academic and state partners, is one of the main providers of HF radar data for SAR operations (Harlan et al., 2011) in the United States. Work by Bellomo et al. (2015) showed that the use of HF radar data in SAR and oil tracking operations reduced position error and search range by up to a factor of 5. In addition to the real-time surface currents which can be used for model validation, in some regions the data is used to produce forecast fields from a program called the Short Term Predictive System (STPS) (Harlan et al., 2011). As discussed by Ullman et al. (2003), the STPS, developed and run by the University of Connecticut with support from US IOOS, predicts the surface currents up to 25 h in advance by breaking them down into two components: a tidal-driven flow and a non-tidal driven flow (2003). The tidal driven flow is predicted using harmonic analysis of 1 month of HF radar data and the non-tidal flow is predicted using Gauss-Markov estimation (Ullman et al., 2003). This STPS is presently available for SAR use for the entire West Coast where there is HF radar coverage and on the East Coast in the Mid-Atlantic region. However, this is not the only STPS available. Two complementary studies used different modeling methods for STPS from HF radar data, one using a long historical record of HF radar currents to train the model and the second was developed as STPS for rapid deployment. Frolov et al. (2012) developed a predictive algorithm for surface currents up to 48 h in the future by using empirical orthogonal functions (EOFs). They used 1–2 years (minimum) of previous HF radar data and deconstructed it using EOFs to capture spatial variability which they then used to train their model. Their EOF-based STPS was more accurate for their area of interest than other existing operational model forecasts. In contrast, Barrick et al. (2012) developed a STPS for rapid deployment of HF radars in cases where radars are deployed for emergency operations, such as oil spill response. In this case, 1–2 years of HF radar data was not available to initiate a short-term predictive model. Instead, they created a STPS algorithm that could work with as little as 12 h of previous data with predictions 24 h into the future. They did experience poor performance during short-term local wind events, but the majority of the predictions agreed with actual drift where mean winds were used. Where available, these STPS programs provide a spatially robust data set of predicted ocean currents for emergency responders.
The purpose of data assimilation into numerical models is to move beyond a purely mathematical solution to one that resembles reality as closely as possible. Le Traon (2013) outlines three major advancements in oceanography: satellite altimetry, Argo, and operational oceanography, but the three advancements are not independent, instead they work hand in hand to improve our knowledge of ocean science. Satellite altimetry provides global high resolution, near-real time sea surface heights. Oke and Schiller (2007) found that for the Ocean Forecasting Australia Model (OFAM) altimetry was critical in order to represent mesoscale variability, but without Argo measurements salinity variations were not well resolved. This was reinforced by Le Traon (2013), who showed that ocean models rely on altimetry and Argo data sets to constrain the models. Using data assimilation, improvements were also noted in the Forecast Ocean Assimilation Model (FOAM) in the North Atlantic and Nucleus for European Modeling of Ocean VARiational (NEMOVAR) global output (Cummings et al., 2009). However, data assimilation into models can be a computationally intense processes that requires dedicated supercomputers. In addition, not all observations are available in real time and most observational data runs through at least a preliminary quality control process before assimilation into a model (Martin et al., 2015).
To run drift simulations, the USCG uses the Search and Rescue Optimal Planning System (SAROPS) computer program. This program represents a large improvement in SAR technology and methods, from previous versions or hand calculations. For reference, Frost and Stone (2001) and Breivik et al. (2013) provide a robust overview of search methods prior to the implementation of SAROPS in the early 2000s. SAROPS is computationally similar to SAR models used in the East and South China Seas (Cho et al., 2014) and the Australian SARMAP program (http://asascience.com/software/sarmap/). SAROPS subjects drift objects to an ambient current with the specific leeway coefficients input for each search object given the observed or modeled wind speed and direction. It then uses a Monte Carlo approach to forecast drift position from a variety of initial condition scenarios that reflect the information from the reporting sources. The initial conditions include one to four search objects, uncertainty in time and spatial distributions. The spatial distributions include: (1) bi-variate normal distribution about point from a Last-Known-Position, (2) uniform distribution over a regular polygon for simulating fishing grounds, (3) distributions from lines of position(s) from radio transmissions or flare sightings, and (4) simulated voyages of the originating craft. Each object's position is subject to random walks to account for noise in the wind and current fields at the location of the particles, where each subsequent application of the random walk is correlated to the one before. One simulation can be run with up to 10,000 particles (representing 10,000 different drift runs for each object) per initial scenario. The output is then a probability map showing where the object is most likely to be found at each time-step, based on location of the highest particle density at that point in the simulation and accounting for all previous search efforts and the subjective weighting of the scenarios and 1–4 search objects likelihood. In order to complete these calculations, SAROPS requires access to oceanographic and meteorological data. This data is pulled from the Environmental Data Server (EDS) that aggregates and stores observational and forecasted wind and currents. This data includes global and regional numerical model forecasts of ocean currents and winds. It also includes inputs of observational data from High Frequency (HF) Radars and Self-Locating Datum Marker Buoys (SLMDBs), a code-style drifter deployed during a SAR case to validate model currents. Both West and East Coast STPS current fields are provided to the EDS for use by SAROPS.
What makes remote search and rescue different from mainland scenarios is the low density of oceanographic data and the distance from response assets. Outside of the near-shore waters, many valuable resources are unavailable and due to the travel distance for response assets, time available to search on scene is reduced. In addition, responders have to take into account fuel costs and crew fatigue constraints. The Central Pacific SAR area of responsibility, and the Hawaiian Islands in particular, make a good case study for remote SAR. The Hawaiian Islands are isolated and have a low ratio of land to water (the islands only make up around 28,000 km2). Here we investigate the location and density of SAR cases relative to available oceanographic datasets in the Central Pacific and run three drift simulations using SAROPS. These case studies allow us to look at SAR statistics relative to available oceanographic resources and identify areas for improvement.
There are very few observational data sets available in the Central Pacific that can be pulled into the EDS for use in SAROPS. One observational data set that has recently been tested for use is the surface portion of the 10-day ARGOS float cycle. While there are close to 4,000 ARGO floats globally in the deep waters, only a few of the open ocean SAR cases can directly benefit from this data set. Most of the observations in the region are located near the main Hawaiian Islands due to the large population center located there. The only HF radar surface current data in the entire Central Pacific is found on the Hawaiian Islands (Figure 1). However, coverage is small. Only the southern and western shores of Oahu, and Hilo Bay on the island of Hawaii, are covered by real-time surface current data (red stars shown in Figure 1). By comparison, near continuous HF radar surface currents are available from Portland, Oregon to the California-Mexico border. Also, in contrast from the continental United States, there is a lack of STPS for surface currents based on the HF Radar data. The Hawaiian Islands do have a local ROMS model available. The Hawaii Regional Ocean Modeling System (HROMS) is a 4-km resolution ocean model that covers the main Hawaiian Islands. Nested inside are localized, higher resolution models in frequently trafficked areas such as the south shore of Oahu. Further information on HROMS is provided on the Pacific IOOS (PacIOOS) website. Available from PacIOOS is a regional Guam ROMS model with 2km resolution, as well as a Western North Pacific ROMS model with 4 km resolution (Figure 2). Outside of those resources, the rest of the Central Pacific is left with only global scale ocean circulation models to conduct drift predictions.
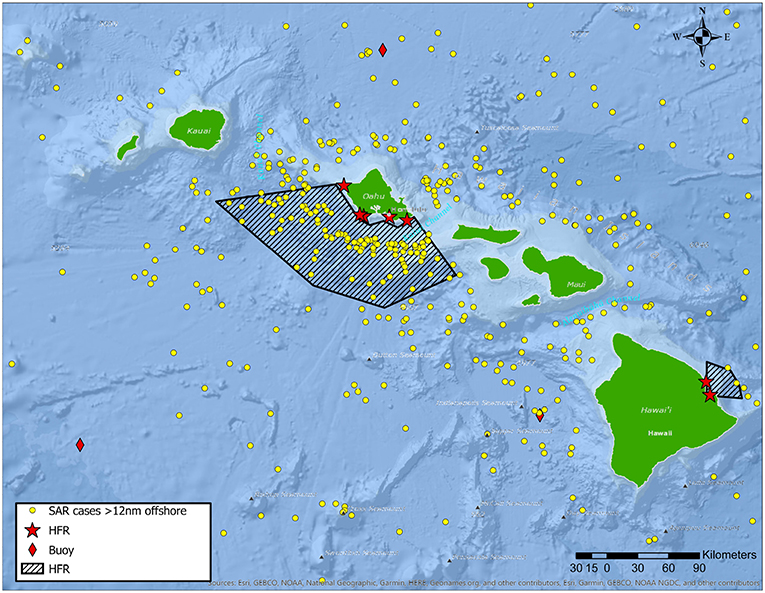
Figure 1. Search and Rescue cases (yellow dots) in the Hawaiian Island region from 2002 through 2018. Only offshore cases (>12 nm from land) are shown. Red stars indicate the locations of High Frequency Radars, red diamonds are the locations of moored surface buoys. The black hatched boxes represents the spatial coverage of the HF Radars.
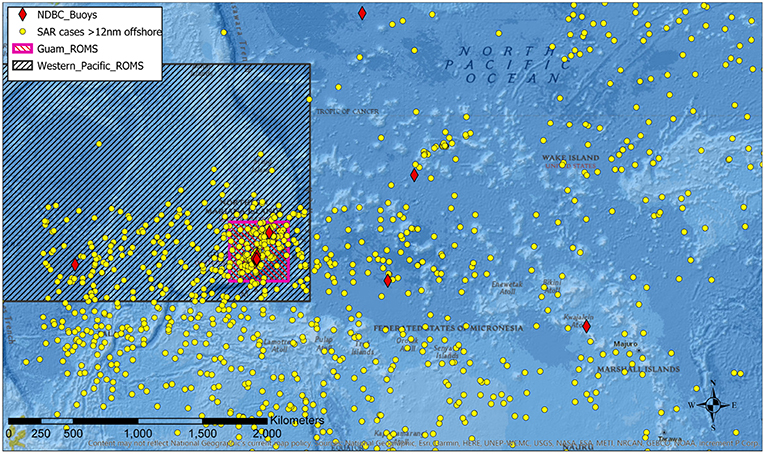
Figure 2. Search and Rescue cases (yellow dots) in the Western Pacific region from 2002 through 2018. Only offshore cases (>12 nm from land) are shown. Red diamonds are the locations of moored surface buoys. The hatched areas represent coverage of ROMS models.
SAR case data in the Pacific were examined using geographical position and case length, in hours (Figure 1). Most (66%) search and rescue cases in the Central and Western Pacific occur within 12 nautical miles of land and were excluded from this analysis in order to focus on offshore search and rescue. For these offshore cases only a small percentage fall within the range of the HF radar real-time surface currents (4.5%) while one fifth fall within the Hawaii ROMS model currents (20%). If the Western Pacific and Guam ROMS model currents are added, the total number of offshore cases that are covered by ROMS increases to 40%. A detailed breakdown of SAR cases covered by each data source is provided in Table 1. The highest case density occurs near the two main population centers, the Hawaiian Islands (Figure 1) and Guam (Figure 2). However, once the cases are weighted by the time response assets spent on scene, other areas grow in importance. Since 2002, there have been 146 cases in offshore waters (>12nm from land) that exceeded 36 h with response assets on scene. The majority of these cases occurred in the Western Pacific near Guam, Palau, and the Federated States of Micronesia. Although this represents only 2% of SAR cases, due to the high hourly cost of response assets, these represent long search time and high cost cases with a low probability of success. In these locations, direct observations of ocean currents are sparse, STPS from HF radars is unavailable, and coverage of the data assimilating regional ocean models is unavailable for the Federated States of Micronesia.
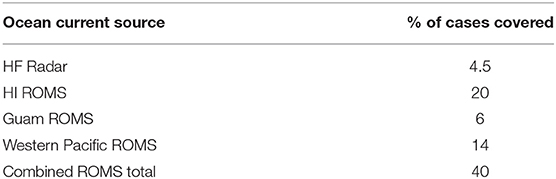
Table 1. Percentage of SAR cases covered by available ocean current data sources.
In order to investigate the impact of various observational data on SAR predictions, a drift simulation was conducted near the island of Oahu. The goal of the SAR simulation was to compare drift results from three different surface current data sources: direct observations via HF radar with 2-km horizontal resolution, modeled surface currents from HROMS with 4-km horizontal resolution, and modeled surface currents from Global HYCOM at 1/12° horizontal resolution. Two SAR cases were run simultaneously: a person in the water (PIW) without a lifejacket and a 14′ sit-on-top kayak, both using the most current leeway coefficients available in SAROPS. The case was initiated with a last known position (LKP) for both objects of 21°10.302′N, 158°02.948′W. The objects were drifted for 48 h. This time frame was chosen because it kept the objects within the coverage of all three respective surface current sources during the whole drift. Additional time allowed both the objects to drift outside the coverage of the HF radar, invalidating the comparison. For all three simulations, the same wind source was used, the Hawaii-based Weather Research and Forecasting (WRF) model at 3-km resolution. Particles were allowed to both run ashore (sticky shoreline) or “bounce” off the shoreline (slippery shoreline). The results of the three drift scenarios are shown in Figure 3. Pink particles represent the PIW and brown particles represent the kayak. The drift run using the HF radar (Figure 3, top) resulted in the smallest area, with the particles (both PIW and kayak) covering a 2,879 km2 area, compared to the HROMS run (Figure 3, middle) coming in at 7,863 km2 and HYCOM (Figure 3, bottom) with the largest area of 12,196 km2. These results match previous studies that found that the use of observational data including HF radar reduces search areas by up to a factor of 3 (O'Donnell et al., 2005; Roarty et al., 2010; Kohut et al., 2012).
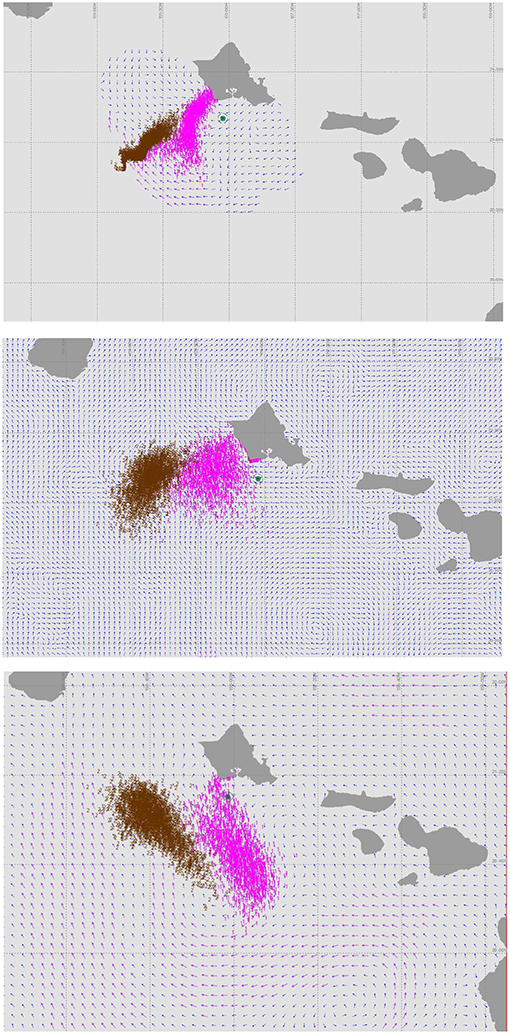
Figure 3. SAROPS output from a simulated SAR case off Oahu. top: Particle density map for a 14 foot sit on top kayak (brown) and person in the water (pink) using ocean current data from available HF Radars. middle: Particle density map for a 14-foot sit on top kayak (brown) and person in the water (pink) using ocean current data from available HROM. bottom: Particle density map for a 14-foot sit on top kayak (brown) and person in the water (pink) using ocean current data from available global HYCOM.
One region in the Central Pacific that is not covered by ROMS is the area to the south of Guam, extending from Palau to the Federated States of Micronesia. This area contains 14.8% of offshore SAR cases, including the majority of the cases lasting longer than 36 h. Increasing available observations in this region could benefit a large percentage of SAR cases. On a smaller scale, near the population hubs of Guam and Hawaii, case dense regions are the southern coast of Guam and the western shores of Hawaii and Maui. Additional coverage here could increase offshore SAR case coverage from 4.5 to 10%.
Another more cost effective alternative to installing additional equipment is to maximize the use of what is already available. Brushett et al. (2017) used consensus modeling to evaluate search prediction effectiveness in the tropical Pacific. Using four different global ocean models, they found that a three or four model consensus search area was greatly reduced from a single model search area with a four model consensus being approximately one third the size of a search area produced by a single model. In addition to the large reduction in search area, they found that for their experiments, the consensus search area always contained the actual found position of the drift object. This is a promising result that suggests in areas with few options, consensus forecasts for SAR objects could reduce search area and decrease individual model error.
Even as sensors and search platforms continue to improve, mariners lost at sea aboard small craft which are difficult to detect, remain a problem for the world's coast guards. Narrowing search areas by accessing accurate, verified surface current fields will go a long way toward successfully locating survivors and survivor craft, both saving lives and saving limited and expensive resource hours. Accessing and fully using all the available oceanographic data sets and numerical models is key to providing accurate predictions for the SAR trajectory models.
VF conceived of the presented idea and performed the case study analysis. VF and AA contributed to the final manuscript.
The authors declare that the research was conducted in the absence of any commercial or financial relationships that could be construed as a potential conflict of interest.
The authors would like to thank Matthew Guanci for sharing insights into Pacifc SAR. The authors would also like to thank the two reviewers for their detailed feedback and suggestions that contributed to the final manuscript.
Allen, A., and Plourde, J. (1999). Review of Leeway: Field Experiments and Implementation. Report No. CG-D-08-99.
Barrick, D., Fernandez, V., and Ferrer, M. (2012). A short-term predictive system for surface currents from a rapidly deployed coastal hf radar network. Ocean Dynam. 62, 725–740. doi: 10.1007/s10236-012-0521-0
Bellomo, L., Griffa, A., Cosoli, S., Falco, P., Gerin, R., Iermano, I., et al. (2015). Toward an integrated hf radar network in the mediterranean sea to improve search and rescue and oil spill response: the tosca project experience. J. Oper. Oceanogr. 8, 95–107. doi: 10.1080/1755876X.2015.1087184
Berkson, J., Woityra, W., Boda, K., Allen, A., Hicks, M., and Futch, V. (2019). The role of marine science and oceanography in the united states coast guard. Proc. Coast Guard J. Saf. Secur. Sea 76, 21–29. Available online at: https://www.dco.uscg.mil/Featured-Content/Proceedings-Magazine/
Breivik, O., and Allen, A. (2008). An operational search and rescue model for the norwegian sea and the north sea. J. Marine Syst. 69, 99–113. doi: 10.1016/j.jmarsys.2007.02.010
Breivik, O., Allen, A., Maisondieu, C., and Olagnon, M. (2013). Advances in search and rescue at sea. Ocean Dyn. 63, 83–88. doi: 10.1007/s10236-012-0581-1
Brushett, B., Allen, A., Futch, V., King, B., and Lemckert, C. (2014). Determining the leeway drift characteristics of tropical pacific island craft. Appl. Ocean Res. 44, 92–101. doi: 10.1016/j.apor.2013.11.004
Brushett, B., Allen, A., King, B., and Lemckert, C. (2017). Application of leeway drift data to predict the drift of panga skiffs: Case study of martime search and rescue in the tropical pacific. Appl. Ocean Res. 67, 109–124. doi: 10.1016/j.apor.2017.07.004
Cho, K.-H., Li, Y., Wang, H., Park, K.-S., Choi, J.-Y., Shin, K.-I., et al. (2014). Development and validation of an operational search and rescue modeling system for the yellow sea and the east and south china seas. J. Atmom. Ocean. Tech. 31, 197–215. doi: 10.1175/JTECH-D-13-00097.1
Cummings, J., Bertino, L., Brasseur, P., Fukumori, I., Kamachi, M., Martin, M., et al. (2009). Ocean data assimilation systems for godae. Oceanography. 22, 96–109. doi: 10.5670/oceanog.2009.69
Di Maio, A., Martin, M., and Sorgente, R. (2016). Evaluation of the search and rescue leeway model in the tyrrhenian sea: a new point of view. Nat. Hazards Earth Syst. Sci. 16, 1979–1997. doi: 10.5194/nhess-16-1979-2016
Frolov, S., Paduan, J., and Cook, M. (2012). Improved statistical prediction of surface currents based on historic hf-radar observations. Ocean Dynam. 62, 1111–1122. doi: 10.1007/s10236-012-0553-5
Frost, J., and Stone, L. (2001). Review of Search Theory: Advances and Applications to Search and Rescue Decision Support. USCG Research and Development Center. Report No. CG-D-15-01.
Hackett, B., Breivik, O., and Wettre, C. (2006). “Forecasting the drift of objects and substances in the oceans,” in Oceans Weather Forecasting: An Integrated View of Oceanography, eds E. P. Chassignet and J. Verron (Dordrecht: Springer), 507–524.
Harlan, J., Allen, A., Howlett, E., Terrill, E., Kim, S., Otero, M., et al. (2011). “National ioos high frequency radar search and rescue project,” in OCEANS'11 MTS/IEEE KONA (Waikoloa, HI).
Hodgins, D., and Hodgins, S. (1998). Phase II Leeway Dynamics Study Program Development and Verification of a Mathematical Drift Model for Liferafts and Small Boats. Prepared for Canadian Coast Guard College, Dept. Fisheries and Oceans.
Kohut, J., Roarty, H., and Randall-Goodwin, E. (2012). Evaluation of two algorithms for a network of coastal hf radars in the mid-atlantic bight. Ocean Dynam. 62, 953–968. doi: 10.1007/s10236-012-0533-9
Le Traon, P. (2013). Efrom satellite altimetry to argo and operational oceanography: three revolutions in oceanography. Ocean Sci. 9, 901–915. doi: 10.5194/os-9-901-2013
Martin, M., Balmaseda, M., Bertino, L., Brasseur, P., Brassington, G., Cummings, J., et al. (2015). Status and future of data assimilation in operational oceanography. J. Oper. Oceanogr. 8, s28–s48. doi: 10.1080/1755876X.2015.1022055
O'Donnell, J., Ullman, D., Spaulding, M., Howlett, E., Fake, T., Hall, P., et al. (2005). Integration of Coastal Ocean Dynamics Application Radar (codar) and Short-Term Predictive System (stps) Surface Current Estimates Into the Search and Rescue Optimal Planning System (sarops). Report No. CG-D-01-2006.
Oke, P., and Schiller, A. (2007). Impact of argo, sst, and altimeter data on eddy-resolving ocean reanalysis. Geophys. Res. Lett. 34:L19601. doi: 10.1029/2007GL031549
Roarty, H., Allen, A., Glenn, S., Kohut, J., Nazzaro, L., and Fredj, E. (2018). Evaluation of Environmental Data for Search and Rescue II. Kobe: OCEANS 2018.
Roarty, H., Glenn, S., and Allen, A. (2016). Evaluation of Environmental Data for Search and Rescue. Shanghai: OCEANS 2016.
Roarty, H., Glenn, S., Kohut, J., Gong, D., Handel, E., Rivera Lemus, E., et al. (2010). Operation and application of a regional high frequency radar network in the mid atlantic bight. Mar. Technol. Soc. J. 44, 133–145. doi: 10.4031/MTSJ.44.6.5
Ullman, D., O'Donnell, J., Edwards, C., Fake, T., Morschauser, D., Sprague, M., et al. (2003). Use of Coastal Ocean Dynamics Application Radar (Codar) Technology in U.S. Coast Guard Search and Rescue Planning. Report No. CG-D-09-03.
Keywords: search and rescue, ocean currents, drift, leeway, remote regions
Citation: Futch V and Allen A (2019) Search and Rescue Applications: On the Need to Improve Ocean Observing Data Systems in Offshore or Remote Locations. Front. Mar. Sci. 6:301. doi: 10.3389/fmars.2019.00301
Received: 31 October 2018; Accepted: 21 May 2019;
Published: 06 June 2019.
Edited by:
Justin Manley, Independent Researcher, Boston, United StatesReviewed by:
Jaeil Kwon, Korea Institute of Ocean Science and Technology, South KoreaCopyright © 2019 Futch and Allen. This is an open-access article distributed under the terms of the Creative Commons Attribution License (CC BY). The use, distribution or reproduction in other forums is permitted, provided the original author(s) and the copyright owner(s) are credited and that the original publication in this journal is cited, in accordance with accepted academic practice. No use, distribution or reproduction is permitted which does not comply with these terms.
*Correspondence: Victoria Futch, dmljdG9yaWEuYy5mdXRjaEB1c2NnYS5lZHU=
Disclaimer: All claims expressed in this article are solely those of the authors and do not necessarily represent those of their affiliated organizations, or those of the publisher, the editors and the reviewers. Any product that may be evaluated in this article or claim that may be made by its manufacturer is not guaranteed or endorsed by the publisher.
Research integrity at Frontiers
Learn more about the work of our research integrity team to safeguard the quality of each article we publish.