 Anne-Cathrin Wölfl1*
 Helen Snaith2
 Sam Amirebrahimi3Colin W. Devey1Boris Dorschel4
 Vicki Ferrini5
 Veerle A. I. Huvenne6
 Martin Jakobsson7
 Jennifer Jencks8Gordon Johnston9
 Geoffroy Lamarche10,11Larry Mayer12David Millar13Terje Haga Pedersen14Kim Picard15
 Anja Reitz1Thierry Schmitt16
 Martin Visbeck1Pauline Weatherall17Rochelle Wigley12
- 1GEOMAR Helmholtz Centre for Ocean Research Kiel, Kiel, Germany
- 2British Oceanographic Data Centre, National Oceanography Centre, Southampton, United Kingdom
- 3FrontierSI, Melbourne, VIC, Australia
- 4Alfred Wegener Institute, Helmholtz Centre for Polar and Marine Research, Bremerhaven, Germany
- 5Lamont–Doherty Earth Observatory, Columbia University, Palisades, NY, United States
- 6National Oceanography Centre, Marine Geoscience, Southampton, United Kingdom
- 7Department of Geological Sciences, Stockholm University, Stockholm, Sweden
- 8National Centers for Environmental Information, National Oceanic and Atmospheric Administration, Boulder, CO, United States
- 9Venture Geomatics Limited, Sutton, United Kingdom
- 10National Institute of Water and Atmospheric Research (NIWA), Wellington, New Zealand
- 11School of Environment, The University of Auckland, Auckland, New Zealand
- 12Center for Coastal and Ocean Mapping, University of New Hampshire, Durham, NH, United States
- 13Fugro USA Marine, Inc., Frederick, MD, United States
- 14Kongsberg Maritime AS, Subsea Division, Horten, Norway
- 15Geoscience Australia, Symonston, ACT, Australia
- 16Service Hydrographique et Océanographique de la Marine, Brest, France
- 17British Oceanographic Data Centre, National Oceanography Centre, Liverpool, United Kingdom
Detailed knowledge of the shape of the seafloor is crucial to humankind. Bathymetry data is critical for safety of navigation and is used for many other applications. In an era of ongoing environmental degradation worldwide, bathymetry data (and the knowledge derived from it) play a pivotal role in using and managing the world’s oceans in a way that is in accordance with the United Nations Sustainable Development Goal 14 – conserve and sustainably use the oceans, seas and marine resources for sustainable development. However, the vast majority of our oceans is still virtually unmapped, unobserved, and unexplored. Only a small fraction of the seafloor has been systematically mapped by direct measurement. The remaining bathymetry is predicted from satellite altimeter data, providing only an approximate estimation of the shape of the seafloor. Several global and regional initiatives are underway to change this situation. This paper presents a selection of these initiatives as best practice examples for bathymetry data collection, compilation and open data sharing as well as the Nippon Foundation-GEBCO (The General Bathymetric Chart of the Oceans) Seabed 2030 Project that complements and leverages these initiatives and promotes international collaboration and partnership. Several non-traditional data collection opportunities are looked at that are currently gaining momentum as well as new and innovative technologies that can increase the efficiency of collecting bathymetric data. Finally, recommendations are given toward a possible way forward into the future of seafloor mapping and toward achieving the goal of a truly global ocean bathymetry.
Introduction
The world’s oceans cover 71% of the Earth. This is about 362 million square kilometers of the total surface area (Eakins and Sharman, 2010), but only a small fraction has been mapped by direct observation. The last few years have seen a resurgence in the recognition of the importance of seafloor mapping and many national and international initiatives are currently underway. Recent tragedies such as the disappearance of Malaysia Airlines flight MH370 as well as natural disasters, habitat loss and the increasing demand for offshore energy and marine resources have highlighted the need for better knowledge of the seafloor (e.g., Smith et al., 2017). In 2015, the sustainable development of our oceans was targeted in the sustainable development goals (SDG) of the United Nations (UN) that aim to achieve a better and more sustainable future for all by 2030. Goal 14 – Life below water – aims to conserve and sustainably use the oceans, seas and marine resources through enhanced scientific knowledge and research capacity amongst other things (United Nations, 2015). In 2017, the UN proclaimed the Decade of Ocean Science for Sustainable Development (2021–2030) to promote sustainable ocean management highlighting the need for ocean observation and ocean research. At the same time, the Nippon Foundation-GEBCO Seabed 2030 Project issued the challenge to survey the ocean floor across the globe by 2030. In addition, inter-governmental agreements, including the Galway Statement (2013) for the North Atlantic and the Belém Statement (2017) for the whole Atlantic, seek to encourage collaborative ocean research with bathymetric mapping at their core. All of these initiatives have provided a strong push to better understand our oceans and have also increased awareness of the advantages of data sharing, by both research and commercial sectors, to reduce duplication of effort and mitigate environmental impacts.
Despite collecting data for centuries and, in recent decades, the introduction of new and improved sounding techniques, the depth of the ocean has been determined over less than 18% of the seafloor using echo-sounders at a resolution of about 1 km (Mayer et al., 2018). The current rate of progress is not sufficient to complete the task of mapping the world’s oceans in the near future without international collaboration, appropriate strategies and significant technological developments. Large parts of the area beyond the limits of national jurisdiction, where the international seabed authority (ISA) organizes and controls resource-related activities on the seabed and subsoil (United Nations, 1982), are still unmapped. Exceptions are areas of interest for the marine industry and exploration areas that are allocated to contractors by the ISA for exploring deep-sea mineral resources. Seafloor exploration is also well-advanced in exclusive economic zones (EEZs) of coastal states that have the capabilities and facilities to conduct mapping surveys. For a better understanding of the marine environment and the development of sustainable ocean management regimes, a comprehensive and systematic survey of the world’s ocean floor is essential.
This paper reviews the efforts made so far to produce a truly global ocean bathymetry map derived from direct observation. An overview of the current state of seafloor mapping is presented with a main focus on large-scale ocean mapping solutions. Starting with an outline of the history of seafloor mapping leading up to recent developments including data compilation efforts, it highlights the importance of bathymetric data and gives examples of their use for societal and environmental benefits. Then a selection of repositories and syntheses is presented as best practice examples for bathymetry data compilation, archiving of source data, data discoverability and availability. All these initiatives require a strategy that can combine the efforts to accomplish the task of mapping the world’s oceans. The Nippon Foundation-GEBCO Seabed 2030 Project aspires to facilitate this through global coordination and capacity building, and is briefly introduced in this context. The challenge of mapping the gaps will be discussed and the seafloor community network with its main linkages illustrated. Finally, an outlook is given toward the future of seafloor mapping, including key recommendations.
The History of Seafloor Mapping
How Do We Map?
Bathymetry deals with the topography of the seafloor. The history of this branch of hydrography goes back more than 3,000 years, with the first evidence of water depth measurements in historical records from ancient Egypt (Theberge, 1989). The first measuring devices were sounding poles and lines with weights attached to them. The first large-scale scientific application using lead weights occurred during the HMS Challenger oceanographic expedition around the globe in the 1870s. Such “plumb-line” measurements were the standard practice until the beginning of the 20th century.
The foundation for replacing plumb-lines with acoustic techniques was laid at the end of the 15th century, when Leonardo da Vinci discovered that ship noise could be heard under water from afar, thereby discovering that sound travels under water (Urick, 1983). Nowadays, a large proportion of the information we receive from ocean environments is brought to us by sound waves, similar to the information carried by electromagnetic waves above water. The trigger for further development of underwater acoustic techniques in the beginning of the 20th century was the need to detect underwater objects, exemplified by the search for the Titanic that sank in 1912, as well as submarine warfare during World War I (Lurton, 2002). This time marks the start of the echo sounding era.
Single Beam Echo-Sounders (SBES)
The development of SBESs constituted a significant improvement in terms of accuracy and efficiency over earlier equipment. SBESs are configured with piezoelectric crystal- or ceramic-based transducers that can generate and receive acoustic signals. The depth of the seafloor is determined by measuring the two-way travel time of a sound wave that is sent toward the seafloor and back. This technique combined with accurate measurements of acoustic wave travel time laid the foundation for this success story (Mayer, 2006).
Multibeam Echo-Sounders (MBES)
Multibeam echo-sounder systems became publically available in the 1970s (e.g., Glenn, 1970; Renard and Allenou, 1979), coincident with the development of the satellite-based navigation system global positioning system (GPS), enabling high spatial accuracy for environmental measurements globally. Multibeam systems radiate a fan of sound and listen to the returning echoes of the emitted signals in narrow sectors perpendicular to that fan, resulting in the mapping of a swath of seafloor instead of just a line. They have the advantage of collecting higher-resolution bathymetric data and of making mapping efforts much more efficient, by mapping an area in a much shorter time compared to SBESs. Modern systems can have many hundreds of beams and can achieve swath angles between 120 and 150 degrees.
The area on the seafloor that an acoustic beam ensonifies is mainly dependent on beam widths of the transmit and receive beams, the opening angle chosen by the surveyor and the water depth. Small angles and shallow water depths generally result in smaller “acoustic footprints” and therefore higher-resolution data than large angles and deeper water depths, due to the expansion of the beam as it travels through the water column (Lurton, 2002). This means that very high-resolution data can be obtained using ships in shallow water, but that the resolution decreases with increasing water depth. In deep water, vehicles operated near the seafloor can address this challenge.
Satellite-Derived Bathymetry (SDB)
Two other seafloor mapping techniques are used in coastal environments. Collecting bathymetric data with ship-based systems in shallow water is substantially more time-consuming and hazardous than collecting deep-water data. SDB from multispectral satellite imagery, developed in the 1970s, can be used to map shallow areas where water clarity permits. Satellite platforms collect data in multiple spectral bands, spanning the visible through infrared portions of the electromagnetic spectrum. Water depth estimations are based on the attenuation of radiance as a function of depth and wavelength in the water column (Pe’eri et al., 2014; IHO and IOC, 2018).
Light Detection and Ranging (LIDAR)
Another option to map shallow areas is the use of bathymetric LIDAR, a technique that transmits laser pulses from an airborne platform and measures their return. The water depth is calculated from the time difference between the reflection from the water surface and the reflection from the seafloor (Irish and White, 1998). However, the use of such optical solutions is limited to shallow areas with optimal water clarity.
Satellite Altimetry
The first altimetric satellites were launched in the 1970s. Altimeters do not directly measure ocean depth, but the height of the ocean’s surface, which is affected, among other things, by the gravitational effects of topographic features on the seafloor. When the first satellite-altimetry derived digital terrain model (DTM) was first released it revolutionized the study of plate tectonics. Altimetry data have far lower horizontal resolution than ship’s bathymetry and provide depth estimates which are inherently under-determined. They can, however, reveal large geomorphological features of the ocean floor. Resolution of features with horizontal scales as small as 6–9 km can be achieved under ideal conditions in the deep ocean (Sandwell et al., 2006). Smith and Sandwell (1997) published a topographic map of the world’s oceans with a resolution between 1 and 12 km, by combining depth soundings from ships and marine gravity data from satellite altimetry. The gravity models on which the topographic maps are based have been updated several times since (Sandwell et al., 2014).
Current Developments and Future Plans
In order to convert depth soundings into a bathymetric surface, several steps need to be taken. There is a trend toward the development of effective automation routines that include data acquisition, vessel-to-shore data transmission and data processing. The Shell Ocean Discovery XPRIZE challenge (2015–2019) – Discovering the Mysteries of the Deep Sea – designed to accelerate innovation for the rapid and unmanned exploration of the seafloor, is one example that addresses a need for new technologies in order to meet the goals of various ocean initiatives.
Autonomous Systems
Modern multibeam echo-sounders have a size and power consumption that makes them suitable for autonomous operations. The use of autonomous surface vehicles (ASV) and autonomous underwater vehicles (AUV) equipped with such echosounders can release ships from dedicated mapping activities (Figure 1). The time and human resources (and therefore costs) associated with the ship-based acquisition of bathymetric data can be considerable. Industry-leading companies are developing vessel-to-shore communication systems to reduce the number of people needed on board and at the same time enable full survey operability (e.g., Haugen, 2018). Improved vessel-to-shore communication not only provide means to remotely control survey operations, but can also ensure rapid and autonomous delivery of newly acquired multibeam data to research institutes, survey companies and ideally data repositories. Communication may still be limited by bandwidth and high costs restricting the transfer of the large volumes of data. An alternative strategy is to process data automatically on the vessel and create products that are small enough to be easily transferred over the available connection (e.g., Hamilton, 2018).
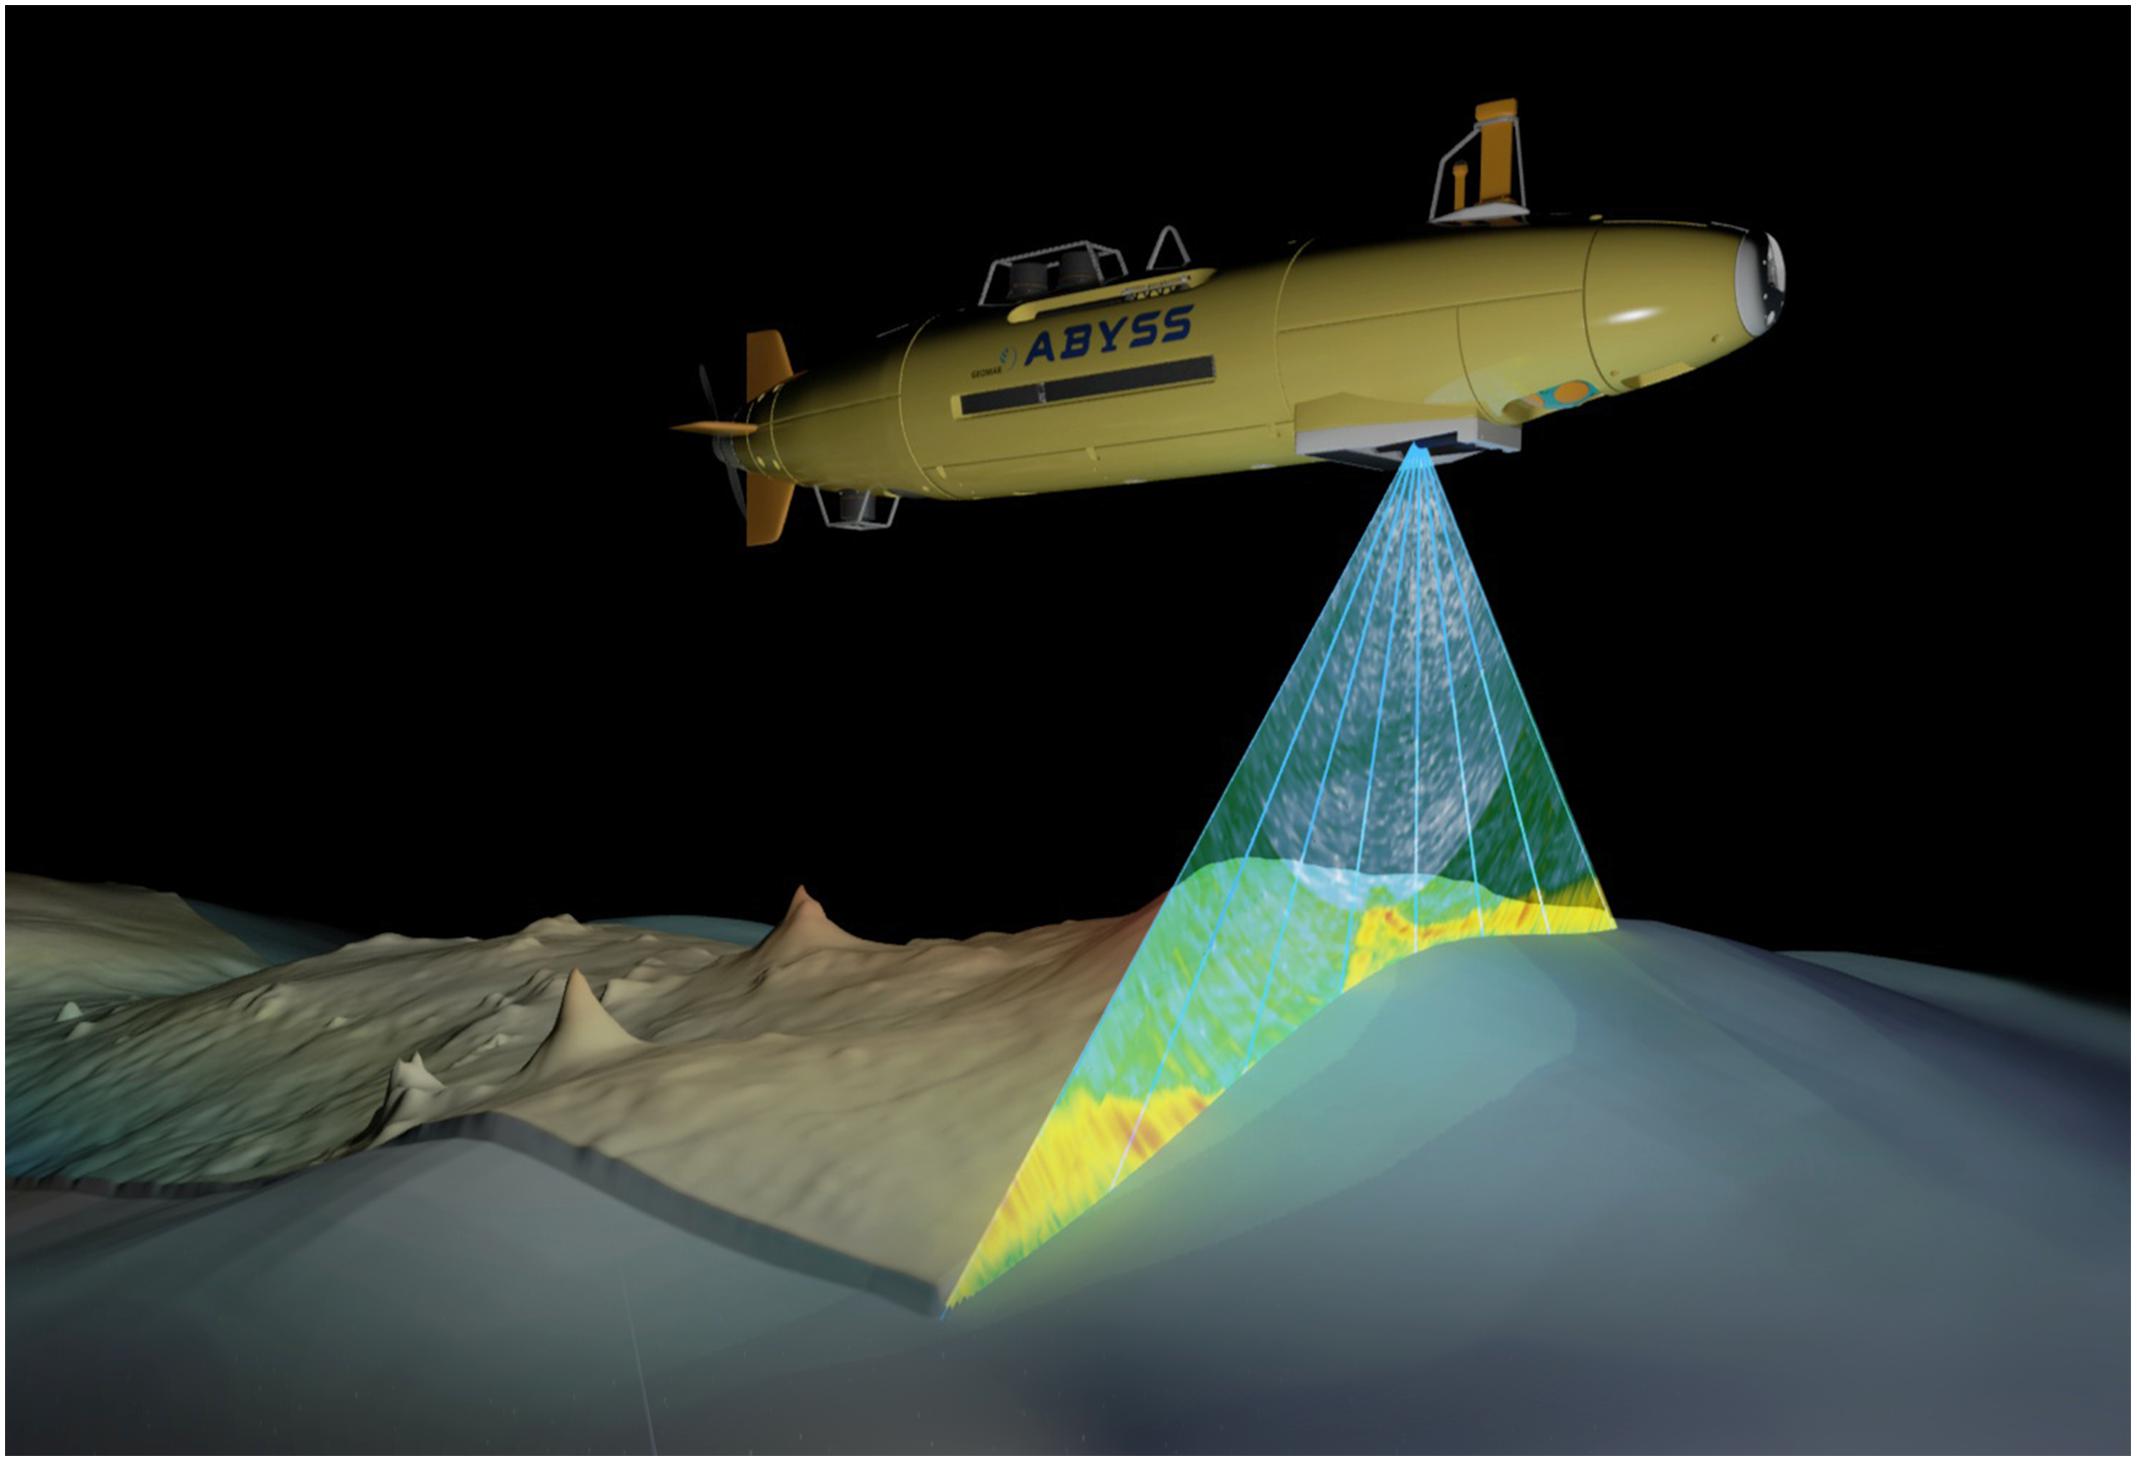
Figure 1. Artistic impression of an AUV performing a deep-sea multibeam survey (courtesy of Tom Kwasnitschka/Nico Augustin, GEOMAR).
Making data acquisition autonomous can also reduce safety risks by allowing operators to stay away from hazardous situations and still access traditionally inaccessible regions, e.g., under ice or navigationally complex areas, such as shallow waters, steep slopes or volcanic areas (e.g., Lucieer et al., 2016; Carlon, 2018). Furthermore, in deep water AUVs and remotely operated vehicles (ROV) can obtain multibeam data with a much higher resolution than ship-based systems, since they are not limited to the sea surface (Wynn et al., 2014; Kelley et al., 2016; Lucieer and Forrest, 2016) with the most advanced vehicles reaching water depths of almost 11,000 m (e.g., Bowen et al., 2007). While ROVs are remotely piloted and powered from a ship, AUVs operate independently, with their range only limited by their onboard power supply (Huvenne et al., 2018). The deployment of these near-bottom mapping systems is currently still inefficient for the mapping of large areas, partly because of their slow speeds compared to ships. However, in the case of AUVs this can be compensated for by multiple vehicles working in tandem. Furthermore, the positioning accuracy for AUVs is still limited, and at present, they are not able to make ship-based surveys obsolete, since it is still essential to roughly understand the bathymetry of an area before a submersible can be sent down toward the seafloor.
Automated Data Processing and Quality Assurance
The processing of raw multibeam data into a high-quality data product, often a gridded DTM at the best possible resolution, can take a considerable amount of time and resources for data cleaning, integration of auxiliary data and gridding (Lamarche et al., 2016). Multiple efforts are underway to accelerate this process, especially with regard to ever-increasing data volumes. With adequate data density achieved by overlapping survey lines, statistical filters can be used for automated data cleaning to identify and exclude spikes or outliers, but with marginal time benefit. Modern bathymetry processing software all offer some level of filters and automation, but careful human review of the product is still needed. In an effort to further improve efficiency of data cleaning and processing, the CUBE (Combined Uncertainty Bathymetry Estimate) model was developed (Calder and Mayer, 2003). As part of this procedure, the TPU (Total Propagated Uncertainty) is calculated for each sounding, which combines information about positional accuracy, environmental conditions and system performance into one value. The TPU is used to weight the contributions of each sounding to the estimate of depth at a defined position (grid node). Apart from this, other automatic methods for reliably reducing the volume of the bathymetric data have been proposed (e.g., Rezvani et al., 2015). Generally speaking, the automated processing of multibeam datasets, while potentially offering ways to minimize processing and other resources associated with acquisition, may in some cases result in loss of information and propagation of errors.
Furthermore, in order to ensure fit-for-purpose bathymetric data, a quality assurance (QA) process is needed. It usually encompasses manual effort and working with a number of different tools to verify and validate acquired data against a range of issues like file corruption, accuracy and consistency, coverage holes or artifacts in the data. The IHO has already developed Standards for Hydrographic Surveys (International Hydrographic Bureau, 2008) that provide minimum standards to help improve the safety of navigation. However, in comparison with other technologies, seabed mapping has less standardization across the community. Hence, a QA process can contribute to building best practices of data acquisition and processing and facilitates the compilation of collected data.
Why Do We Need Bathymetric Data?
Knowledge of bathymetry is important for a wide variety of uses starting with the fundamental understanding of geological and oceanographic processes affecting our planet. Early echo-sounding profiles across the Atlantic Ocean for instance enabled Bruce Heezen and Marie Tharp to understand the relationship between mid-ocean ridges and earthquake seismicity and played an important part in the recognition of one of the most significant paradigm shifts in science – the development of the hypothesis of seafloor spreading and plate tectonics (Hess, 1962).
A seabed mapping user survey conducted in 2018 by Geoscience Australia and FrontierSI captured information from national and international stakeholders across all sectors. It revealed that habitat mapping and hydrographic charting were the most common applications for the use of high-resolution bathymetric data (Amirebrahimi et al., in press).
Seafloor bathymetry is essential for safety of navigation and for establishing the limits of the extended continental shelf (ECS) under the United Nations Convention on Law of the Sea (UNCLOS) (Jakobsson et al., 2003). This exemplifies that a detailed knowledge of a nation’s coastal bathymetry is also vital for political and commercial purposes. A few other examples for the use of bathymetric data are looked at in more detail below.
MH370
The recent loss of Malaysia Airlines flight MH370 has highlighted the lack of detailed bathymetry in large areas of the world’s oceans. The existing data in the search area were based on a bathymetric model derived from marine gravity information estimated from satellite-altimetry combined with sonar soundings (Smith and Sandwell, 1997). At the time of the search for the fuselage, single and multibeam data coverage in the area was insufficient to deploy deep-water instruments to provide a detailed inspection of the seafloor (Picard et al., 2017) and so ship-based bathymetric data had to be collected. By comparing this newly acquired high-resolution data with the modeled data (Figure 2), it was found that 38% of the grid cells differed vertically from the high-resolution data by more than 100 m with maximum differences of 1900 m (Picard et al., 2018).
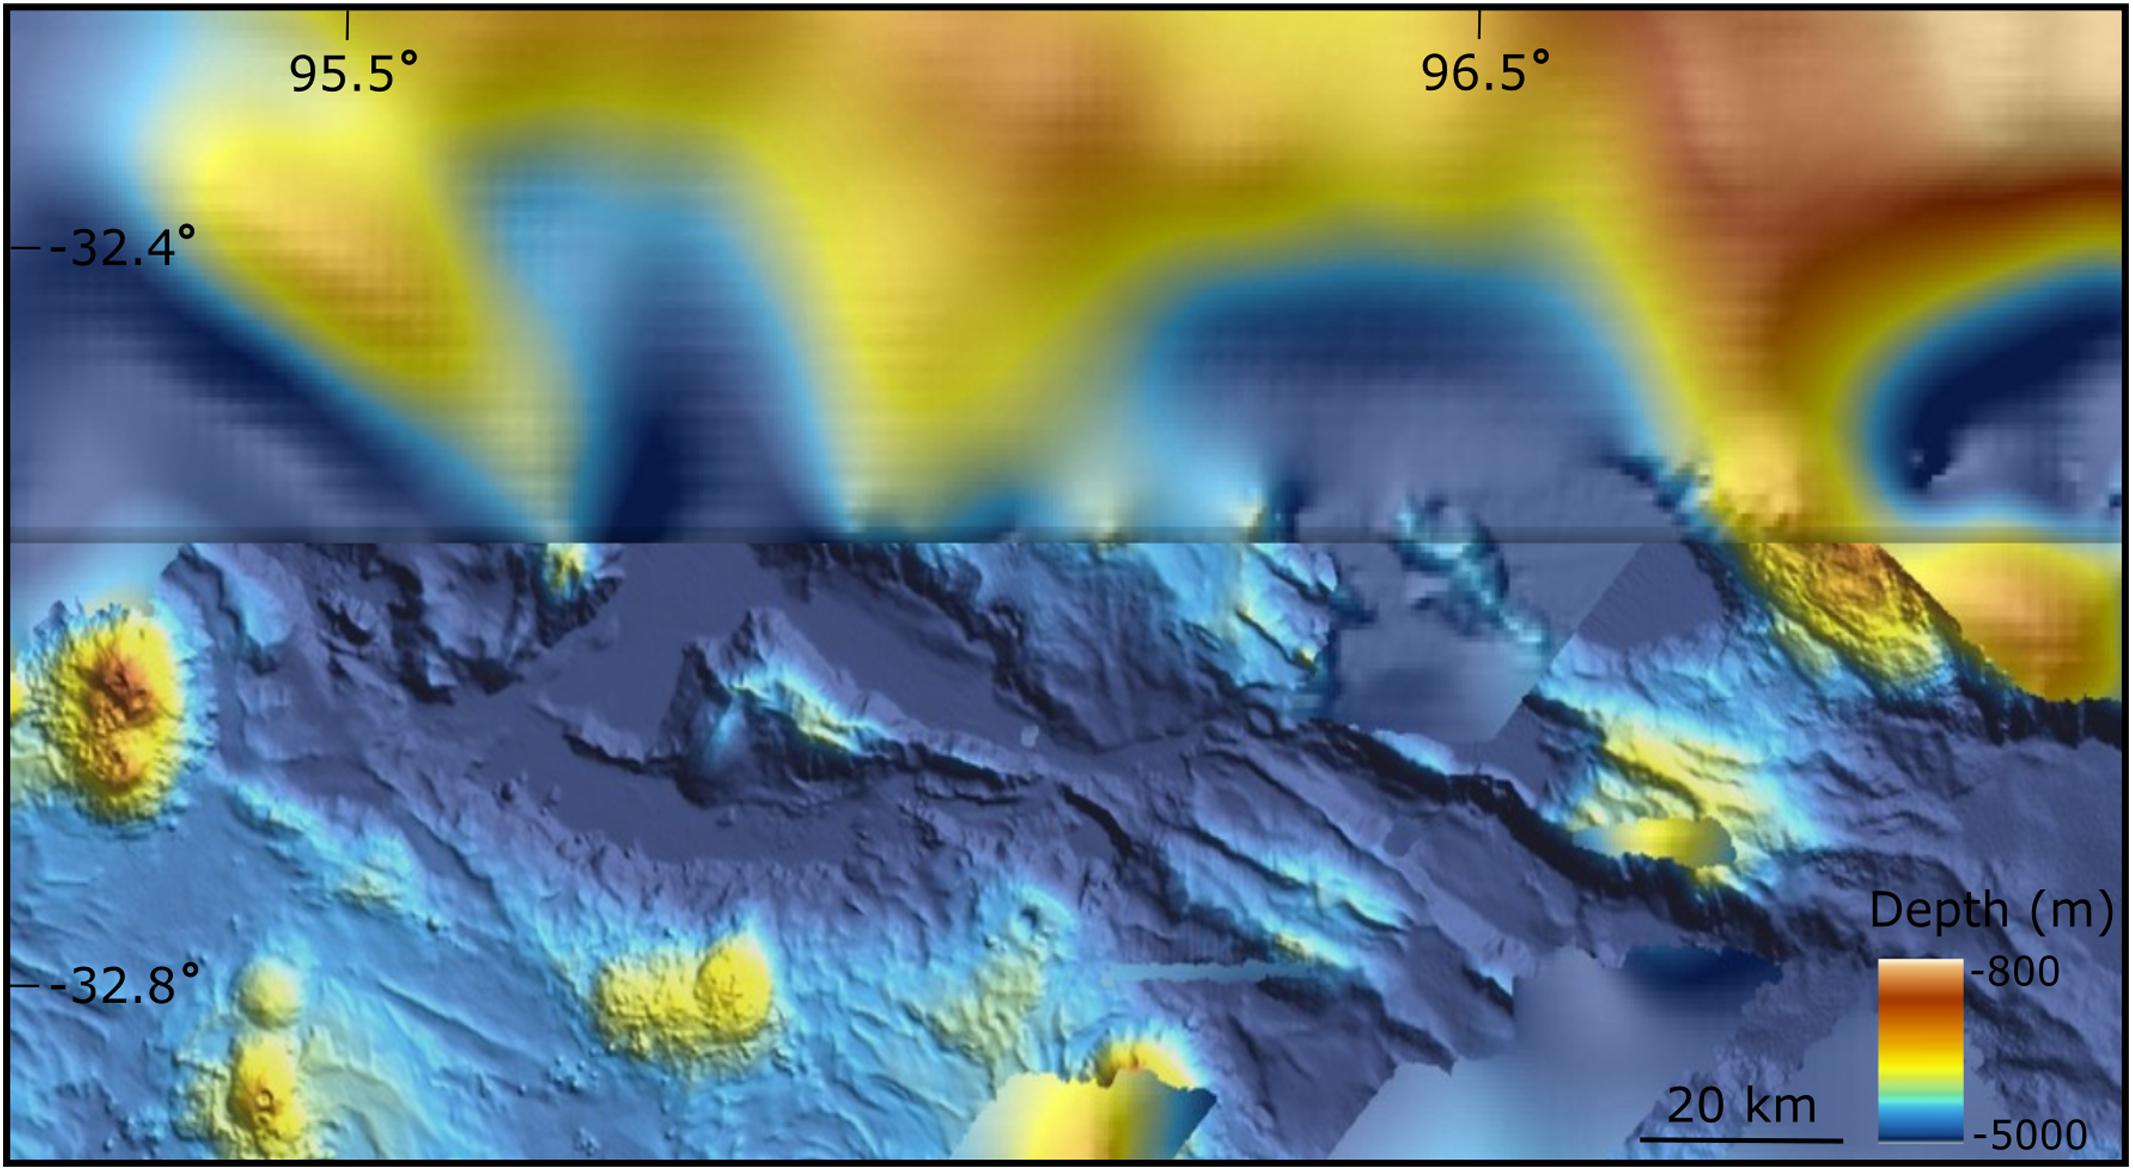
Figure 2. Plan view of the Diamantina trench seafloor area in the Southeast Indian Ocean. The curtain image shows from top to bottom the data resolution increase between altimetry derived bathymetry data, sourced from the SRTM15_PLUS model (Olson et al., 2016), and multibeam bathymetry, gridded at 110 m horizontal resolution, that was acquired to assist the search for Malaysia Airline flight MH370. Image modified from the MH370 storymap (Australian Government, 2017).
Hazard Studies
Marine geohazards are not only of concern to coastal communities, but also to industries dealing with marine infrastructure. Geohazard assessments in the marine realm are mainly based on bathymetric data. Although only a snapshot in time, bathymetric data deepens the understanding of the seafloor fabric and helps to identify potential risks linked to hazardous processes, such as slope failures or turbidity currents, and with repeat surveys, can be used to monitor seafloor changes over time (Chiocci et al., 2011). Clearly, bathymetric resolution appropriate to the target features is required. The morphology of the seafloor is also linked to the formation and propagation of tsunamis and is of vital importance in the context of tsunami forecasting. Generally, bathymetric data represent a fundamental dataset for addressing the growing challenges associated with climate change (Stocker et al., 2013; Fenty et al., 2016).
Ocean Circulation Models
Bathymetric data are also fundamental to our ability to model ocean circulation, with the predicted location of key circulation features, such as the separation point of the Gulf Stream from the United States’ coast, being critically dependent on accurate topography representation in the model in question (Thompson and Sallée, 2012; Gula et al., 2015). Similarly, accurate ocean models can have a major impact on the ability of climate models to simulate global phenomena such as El Niño events (e.g., Santoso et al., 2011). The resolution requirements of bathymetry data for the models are limited by the resolution that the ocean models themselves are able to achieve. As this resolution is increasing all the time, there is a growing need for better-resolved seafloor bathymetry.
Seafloor Installations
Marine infrastructure development, such as cable laying, pipeline and platform installation, rig anchoring, or deployment of machines requires high-resolution bathymetric data. Environmental assessments, a requirement prior to any industrial activity affecting the seafloor, starts with a geomorphometric analysis of the region. The need for high-resolution bathymetric data for monitoring of seabed activities will increase in the future (Clark et al., 2017; Ellis et al., 2017). Identification and characterization of areas suitable for seafloor mining also rely on precise bathymetric information (e.g., Hein et al., 2009). For instance, areas of seafloor mineralization from hydrothermal vent systems can be predicted using high-resolution bathymetric data.
Marine Conservation
Precise seafloor information, foremost high-resolution bathymetric data, is required to work toward the goal of protecting at least 10% of the world’s oceans by 2020 (UN Convention on Biodiversity Aichi Target 11, Sala et al., 2018) and to support the achievement of SDG 14 – Life below water – of the Agenda 2030 for Sustainable Development. Marine protected areas (MPA) are designated for the protection of the marine environment, but in most cases their initial designation and the development of management plans is hampered by a lack of accurate knowledge about the distribution of marine species and habitats. The direct visual observation of every part of the seafloor for this purpose is an unrealistic expectation, hence environmental parameters are increasingly used for habitat predictions (Howell et al., 2011 Rengstorf et al., 2014). Particularly for benthic species, bathymetry has turned out to be one of the main driving factors behind species distribution. In addition to depth information, associated variables such as slope, aspect, curvature and terrain variability have been demonstrated to act as significant predictors in benthic species distribution models (Wilson et al., 2007). Particularly in areas where biological information is absent, the availability of reliable bathymetric data provides environmental managers with the chance to create a basic habitat map to guide the development of management plans.
Bathymetric Data Sources
One large source, by area, of high-quality bathymetric data is from research cruises, undertaken by a range of research and government institutions across the globe. Data are traditionally held by the host institutions and used for specific research purposes. Exceptions are individual agreements with, for example, funding agencies that oblige institutions to make their data publicly available after a certain amount of time. With more widely accepted data sharing policies, institutions are encouraged to archive their data on central open-access repositories and portals, where data can be easily discovered and freely accessed for wider purposes. This way data are collected once and can be used many times. Sharing these data for re-use ensures that new data acquisition efforts can focus on unmapped regions and maximizes return on public investment.
Within a country’s EEZ, national hydrographic offices are usually responsible for the mapping efforts. For many parts of the world, these are closely linked to military organizations, reflecting the key importance of bathymetry for naval and defense operations. Hydrographic offices are legally responsible for the safety of navigation under the International Convention for the safety of life at sea (SOLAS) 1974. Given the physical constraints on gathering large areas of bathymetry in shallow water described above, these data are often expensive to acquire in terms of ship-time. Some national hydrographic offices are joining a growing trend of granting access to their holdings. However, the sensitivity related to national security of some of these data is limiting access to bathymetric information.
Another source of significant amounts of bathymetric data is commercial survey companies. As commercial exploration and exploitation of the marine environment becomes more extensive, commercial survey companies operate to provide high-resolution survey data to their commercial customers. Whilst the extent of these data may be limited to areas with potential for economic development, they are often of very high resolution and high quality. Since the customers are usually the data owners, it has been uncommon on the past for these data to be made available in the public domain. Some survey companies, however, are spearheading an effort to communicate the wider significance and societal benefit of these data to their customers, opening up the possibility of significantly increased public access to these data in the future.
Transit Data – Making the Most of Every Nautical Mile
Research vessels that operate internationally usually have long transit routes, whether transiting from port to study area or between different study areas. Often these routes lead them through international waters, where data recording is unrestricted. Several nations have procedures in place to collect such data and make them publicly available.
In the United States, the Rolling Deck to Repository (R2R) Program was initiated in 2009 to ensure that all underway data acquired aboard the United States Academic Research Fleet is documented and archived in public repositories. Data from each cruise are routinely submitted by the vessel operator to R2R which ensures delivery to the appropriate national repository. This project has resulted in a significant increase of multibeam data made available at the International Hydrographic Organization Data Centre for Digital Bathymetry (IHO DCDB). In 2011, the Multibeam Advisory Committee, was formed to help coordinate fleet-wide multibeam calibrations and system monitoring for the United States Academic Research Fleet and to develop and make publicly available tools and best practices for operational procedures that promote the acquisition of high-quality multibeam data. These projects share the common goal of promoting high-quality publicly available data and encourage the acquisition of transit data.
In 2015, three German research vessels (RV Maria S. Merian, RV Meteor, and RV Sonne) started to collect multibeam data on their transit routes, mapping approximately 200,000 km2 every year. Recently, RV Polarstern, a fourth German research vessel and the Dutch RV Pelagia have announced an intention to join this approach. The transit data are sent to GEOMAR Helmholtz Centre for Ocean Research Kiel, Germany, where the data are processed and several data products created. The data are integrated into the international Pangaea Data Publisher for Earth and Environmental Science as well as into the IHO DCDB. Data collection is actively supported by the ship’s crew and usually by the chief scientists. Of key importance for getting this support has been the commitment to make the data freely available for all.
Another supporting example that transit matters is the search for flight MH370. Seabed mapping contractors were asked and agreed very early on to acquire data (at no cost) during transit between the search area and the port-of-call, and where possible, to build on the coverage. After over 3 years of operation, transit data accounted for ∼432,000 km2, the equivalent of 1.5 time the search area (238,000 km2). This data was of similar resolution to the search area, however, it is of lesser quality and density due to the nature of transit acquisition. Overall, the data collected for the search of the flight MH370 was made freely available, but still only accounts for 1% of the Indian Ocean seafloor (Picard et al., 2017).
Crowdsourced Bathymetry
The IHO has a history of encouraging both innovative ways to gather data and data maximizing initiatives to gain a better understanding of the bathymetry of the seas, oceans and coastal waters. In 2014, the IHO, at its Fifth Extraordinary International Hydrographic Conference, recognized that traditional survey vessels alone could not be relied upon to solve our data deficiency issues and agreed there was a need to encourage and support all mariners in an effort to “map the gaps.” One outcome of the conference was an initiative to support and enable mariners and professionally manned vessels to collect crowdsourced bathymetry (CSB) to be used as a powerful source of information to supplement the more rigorous and scientific bathymetric coverage generated by hydrographic offices, industry, and researchers around the world.
An IHO CSB Working Group, comprising international scientific, governmental and commercial hydrographic experts, was tasked by the IHO to draft a guidance document meant to empower as many mariners as possible to map the gaps in the bathymetric coverage of the world’s ocean. The document, which will become an adopted IHO publication in 2019, describes what constitutes CSB, the installation and use of data loggers, preferred data formats, and instructions for submitting data to the IHO DCDB. The document also provides information about data uncertainty to help data collectors and data users better understand quality and accuracy issues with CSB. The working group is now focusing on developing an outreach plan covering the “why, what, where, and how” to encourage all vessels at sea to collect bathymetric data as part of a mariner’s routine operations.
Under the guidance of the working group, NOAA’s national centers for environmental information (NCEI) has implemented the ability to archive, discover, display and retrieve global crowdsourced bathymetric data contributed from mariners around the world. These data reside in the IHO DCDB which offers access to archives of oceanic, atmospheric, geophysical, and coastal data (Jencks et al. “Citizen-Science for the Future: Advisory Case Studies from Around the Globe,” this issue).
Release of Data From National Archives
Many countries hold large amounts of bathymetric data, but it is often difficult to get access to this data. Countries providing unrestricted access to their data holdings are still an exception. A country’s bathymetric data might ideally be archived in a national data repository, but in reality is often distributed over several data archives and institutional repositories throughout the country. Few of these archives have open access policies, accordingly, the data are not freely available for others. Data that are freely available are often not directly downloadable, they are only available upon request. Another challenge is that national data archives are often only known in the respective country but not abroad, which makes it difficult to find data.
The availability of bathymetric data is regulated by each country’s national legislation. If a country decides to make its data available, the question remains of how to make the data discoverable and accessible to the interested user. Several bathymetric syntheses, some of which are described below, are addressing this question. Another collaborative approach has been started by the EU Horizon 2020 research and innovation project AtlantOS Optimizing and Enhancing the Integrated Atlantic Ocean Observing System. The project covers various disciplines, including seafloor mapping, with the objective of enhancing ship-based observing networks. Within this approach, several European data centers are working together to trace deep-sea bathymetric data and integrate them to the IHO DCDB in order to make them accessible and usable for the specialist and non-specialist user. A standard workflow regarding data integration into the IHO DCDB, including metadata provision and data transfer, has been successfully established for future data transfer.
Release of Private and Commercial Data
A source of bathymetric data that has, until recently, been poorly exploited, is the wealth of data being collected by commercial surveying companies. For the most part, these data are owned by the customers of the survey companies that collect them. As a result, the primary survey data cannot be placed in the public domain or contributed to mapping projects without the express permission of those customers.
Based on their user survey, Amirebrahimi et al. (in press) highlighted that most participating organizations are willing to contribute to national or international mapping initiatives. However, this is usually done on a case-by-case basis. The unwillingness of private companies or their clients to have their data contributed to public domain was directly linked to the financial side of data capture and establishing appropriate license for use of the data. By covering the cost of data acquisition, organizations often consider the data their intellectual property and accordingly, are not willing to easily share them with others. Additional barriers for releasing data may include but are not limited to security considerations and confidentiality of data. The perceived sensitivity of the data is sometimes so high that organizations are not even willing to publish the coverage or the metadata of the survey data.
GEBCO is working to build relationships with survey companies and their customers to release the data they hold or own. The first agreement was made in early 2018 with Fugro, a large offshore company providing geotechnical and survey services, who acquire vast quantities of bathymetric data with a global fleet of ocean-going survey vessels. As they move vessels from project to project, they also have the opportunity to collect data during transits as a form of CSB contribution. Since commencing the program, over 167,000 km2 of multibeam bathymetric data have been contributed to the IHO DCDB.
In addition, Fugro has begun to make their customers aware of this approach and has begun to explore if there are any terms under which they might consider donations of data. In many cases, as mentioned above, these datasets may contain market-sensitive information and when this is the case, it is determined if a reduction in resolution and/or a delay in release may mitigate any data sensitivity concerns. In the first instance, provision of simple metadata to allow identification of the area of data coverage and data characteristics is a step forward in identifying the areas of seafloor that have already been surveyed, even if the data cannot yet be released.
Following the success of the Fugro initiative, further collaborations are now being developed with other commercial partners. The best-practice being developed, promoting public access to the transit data through IHO DCDB combined with potentially limited release of commercially sensitive data, is now being encouraged across the marine survey industry. It is expected that this approach will not eliminate the need for marine site characterization services, but rather increase its demand. Only through a comprehensive mapping of the ocean will areas of interest become known. The expectation is that within those areas of interest, high-resolution mapping services will still be required to support marine projects and activities.
Bathymetric Data Repositories and Syntheses
Data centers act as central repositories for the secure archiving of source data and ideally provide resources for data discoverability and access. There are many international, regional and national repositories, including some national hydrographic offices, that serve this function. While we recognize the efforts of some nations in building and managing national data centers [e.g., Australia with the Geoscience Australia’s Marine Data Portal, Japan with DARWIN from the Japan Agency for Marine-Earth Science and Technology (JAMSTEC), or France with data.shom.fr from the French Hydrographic and Oceanographic Service], we have deliberately chosen to focus on one international data repository and several bathymetric syntheses providing bathymetric data products. In this section, we will introduce some examples and examine their wider international linkages regarding data sharing as demonstrations of best practices. The examples presented here are not intended as an exhaustive list.
The IHO DCDB
The International Hydrographic Organization Data Centre for Digital Bathymetry (IHO DCDB) was established in 1990 to steward the worldwide collection of bathymetric data. The intent was for the center to archive and share, freely and without restrictions, raw unedited single- and multibeam bathymetric data acquired by hydrographic, oceanographic and other vessels. In the original proposal, the former NOAA national geophysical data center (NGDC), now the NCEI, agreed to “operate a worldwide digital data bank of oceanic bathymetry on behalf of the Member States of the IHO.”
Almost 30 years later, NCEI and the DCDB remain committed to providing easy, open access to the wealth of data from a variety of sectors (e.g., industry, government, academia, crowdsource efforts) for long-term archive, stewardship, and public use. Enabling users to locate and access the data they need is critical in maximizing the re-use of data. NCEI accomplishes this with quality standard metadata registered in catalogs to support search and discovery, map services that can be used by anyone as building blocks in custom web applications, and by developing and hosting web map applications that provide an intuitive interface to display, select, and download many different types of data.
The public can discover bathymetric data from the IHO DCDB Digital Bathymetry viewer (Figure 3). There is also the option to display a multibeam bathymetry mosaic of NCEI’s bathymetry holdings with elevation values and color shaded relief visualizations as well as the single-beam sounding density. The data sets are freely accessible and the majority can be directly downloaded. Along with displaying the DCDB’s bathymetric data holdings, the viewer also shows the locations of data accessible from other repositories (e.g., AusSeabed, Canadian Hydrographic Service, EMODnet Bathymetry, MAREANO) through the ingestion of their web services. Global seafloor mapping campaigns, such as The Galway Initiative and Seabed 2030, can use this viewer as a tool for identifying where data already exist to reduce costly, duplicative surveying efforts. In addition to encouraging countries, organizations, academia, industry, and individuals to contribute their data, the DCDB also strongly encourages other repositories to make their web services available so that their data holdings can be more broadly shared.
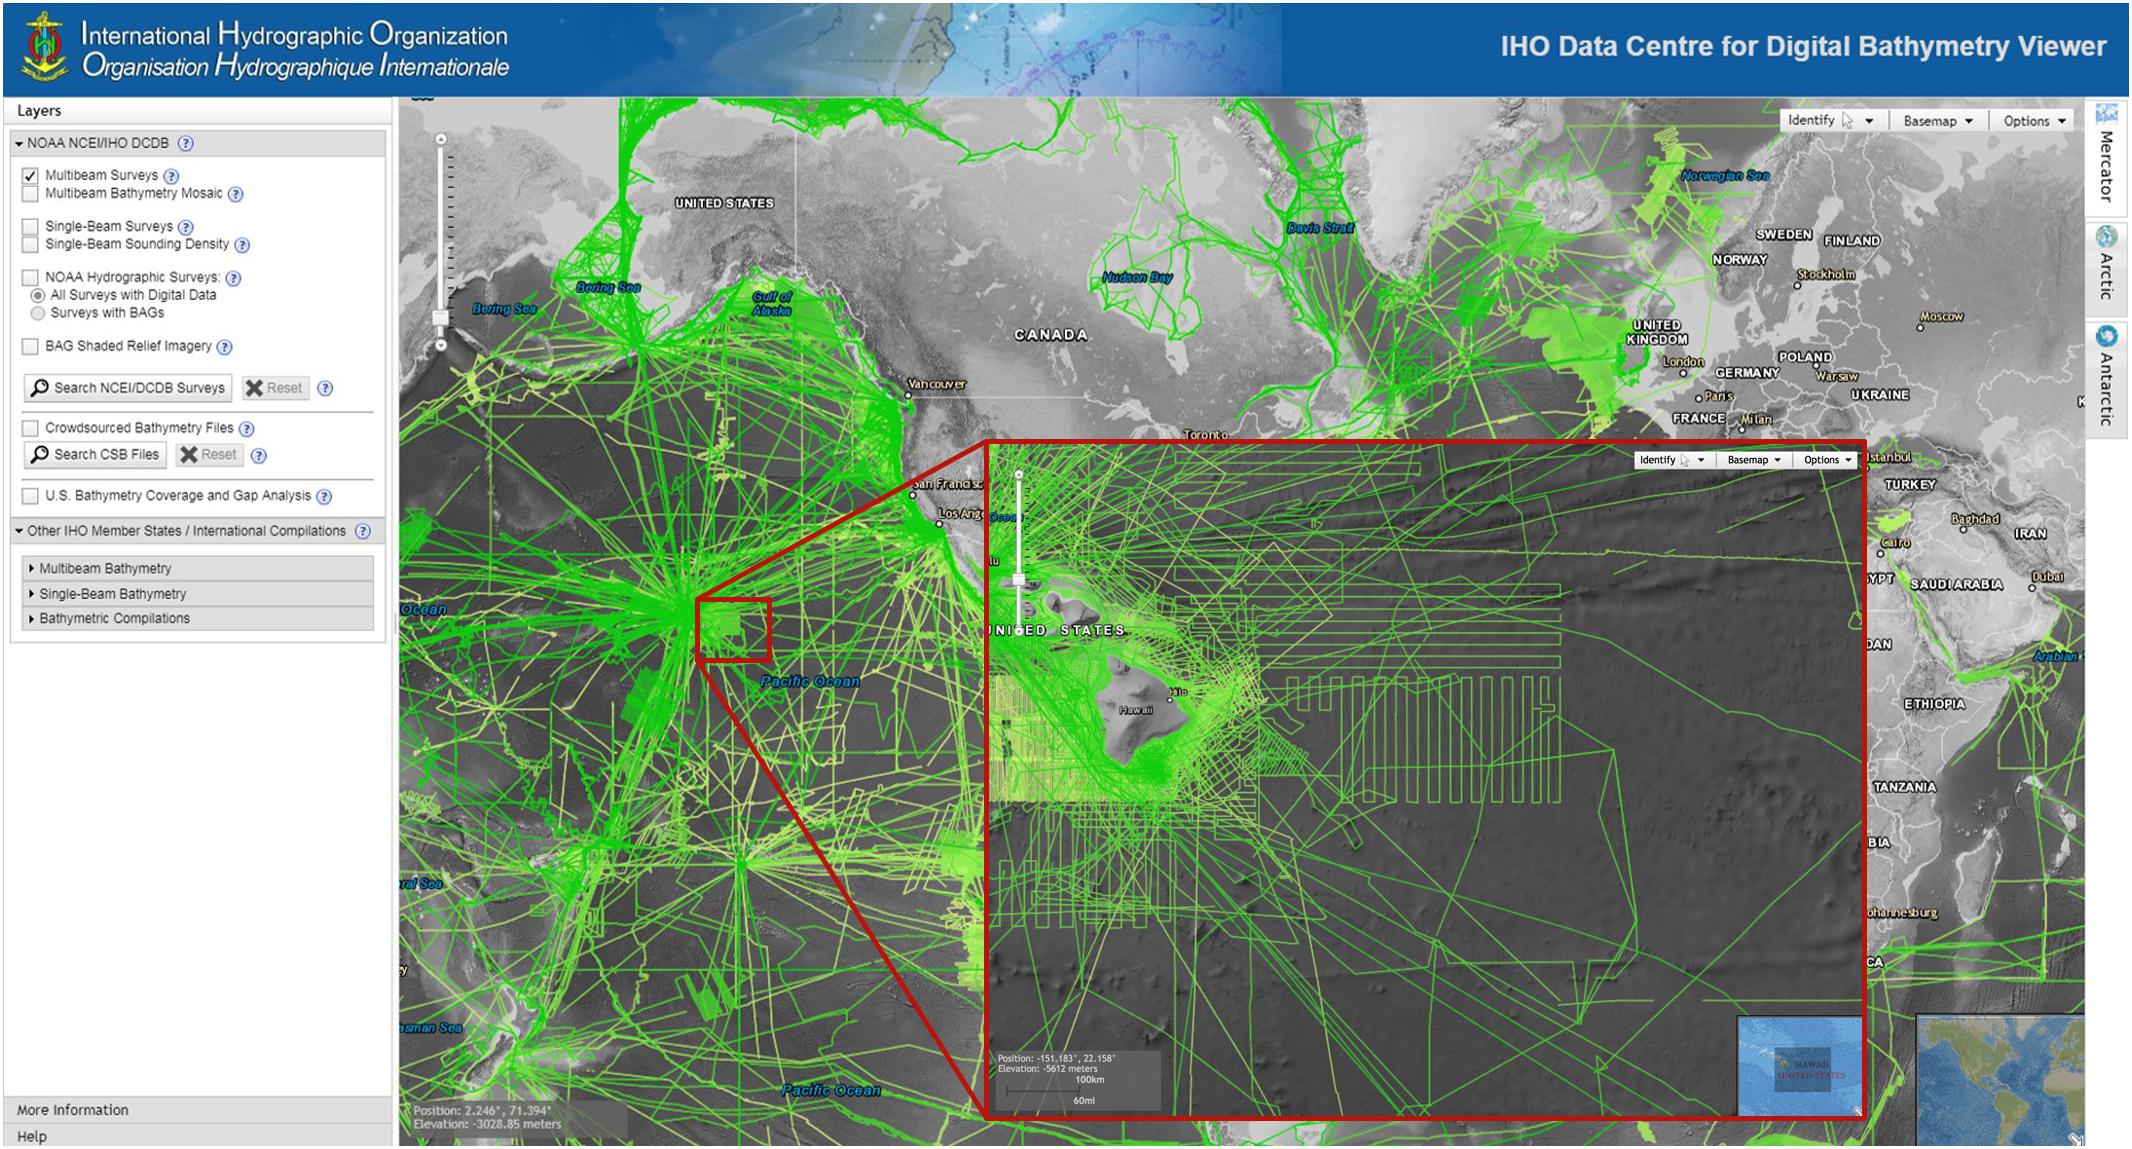
Figure 3. The IHO DCDB Bathymetry viewer which displays bathymetric data holdings (including multibeam bathymetry, shown here) from NOAA NCEI, along with data from other repositories, in order to support ongoing international seafloor mapping efforts.
EMODnet Bathymetry
An example for a regional bathymetric synthesis for Europe is the European marine observation and data network (EMODnet). This initiative aims at assembling and granting access to European marine data, data products and metadata from diverse sources originating from organizations in countries around European seas (Miguez et al. “EMODnet: Roles and Visions,” this issue). The EMODnet Bathymetry Project is an example of a regional approach that develops and provides a bathymetric DTM for the European seas. The DTM is made publicly available for downloading, whereas access to the source data might be restricted. User access to source data, generally at higher resolution than the DTM, might be granted by the data provider directly upon request, depending on the national and/or distribution policy of the hosting organization. With this respect, licenses detailing simple acknowledgment of the source data (more than often through DOI identification) tend to generalize. The grid resolution of the model has increased since the early stages of the project from ∼500 m in 2010, ∼250 m in 2015 to ∼115 m in 2018. Each grid cell has a reference to the source data – bathymetric survey via Common Data Index, composite DTM via the Sextant catalog, and GEBCO in case of gaps – used for determining the water depth. The model is produced from aggregated surveys, collated by a network of contributors from marine research institutes, hydrographic services, government agencies and private companies. In 2018, over 27,000 survey data sets from 42 providers and 140 composite DTMs from 28 providers were included.
The overall EMODnet DTM is generated from the compilation of the data sources available through a commonly adopted methodology (Emodnet Bathymetry, 2009). Data providers provide metadata and make sure their data are processed for erratic soundings and remaining bias. They sample and pre-grid their datasets with a common software tool into data files which are handed over to so-called basin coordinators. The task of the coordinators consists of selecting and then merging selected datasets for their basin, and building the most realistic and accurate regional basin DTM by ensuring a coherent and smooth transition between data sources. Finally, basin coordinators provide their regional DTM to an integrator for composing the full DTM (Figure 4).
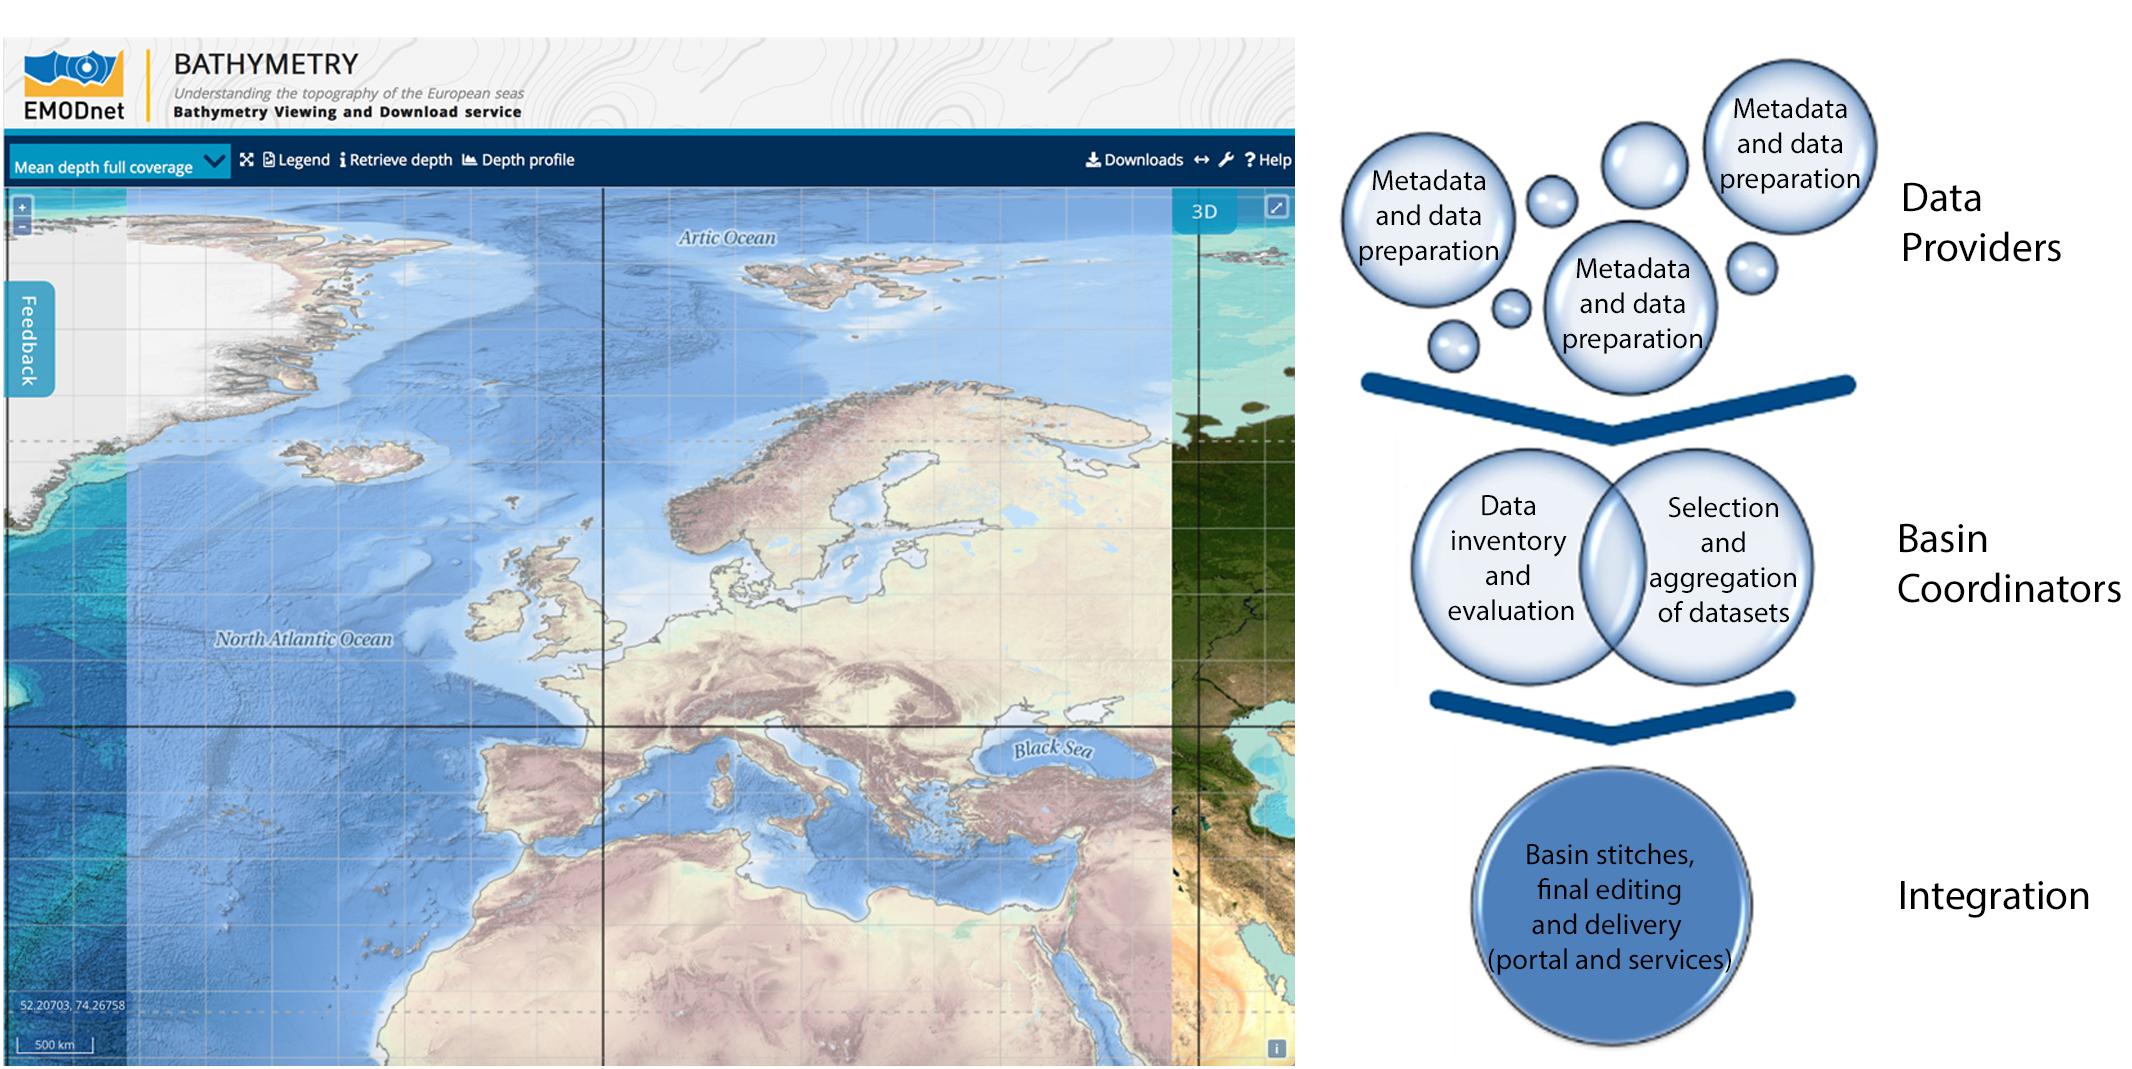
Figure 4. EMODnet Bathymetry grid (version 2018) around the European waters (www.emodnet-bathymetry.eu) and schematic representation of the tasks and roles of each of the contributors of the EMODnet Bathymetry distributed infrastructure.
GMRT
The Global Multi-Resolution Topography (GMRT, Ryan et al., 2009) Synthesis is a global, multi-resolutional Digital Elevation Model (DEM) that includes edited ship-based multibeam data at full spatial resolution (∼100 m in the deep sea). It began as the Ridge Multibeam Synthesis in 1992 at Columbia University’s Lamont-Doherty Earth Observatory and is funded primarily by the United States National Science Foundation (NSF). Its initial purpose was to support research at mid-ocean ridges by synthesizing available bathymetric data into composite grids and images. In 2003, the focus of the compilation was extended to include the Southern Ocean, and GMRT was initiated with a multi-resolutional architecture maintained in three projections. Since 2005, GMRT has provided free public access to curated gridded ocean bathymetric and terrestrial elevation data in support of global scientific investigations.
A core principle in the design of GMRT is to make elevation data products accessible to specialist and non-specialist users alike while providing full attribution to data sources, and access to source data for advanced users. Access to GMRT is provided through a web application called GMRT MapTool, several web services, and the java-based GeoMapApp desktop application. All of these tools and applications allow access to gridded elevation data in the form of grids, points, and profiles, as well as images and metadata information. Data can be extracted and downloaded from GMRT at user-defined resolutions in a variety of formats.
Terrestrial and bathymetric elevation components combined into GMRT are managed independently, which enables updating content on different schedules. New versions of GMRT are released twice each year and typically ∼2 million km2 of new multibeam data coverage is added annually. Most curatorial effort for GMRT is focused on preparing and integrating multibeam data that are publicly available through the IHO DCDB. Multibeam data processing and curation efforts are focused on the needs of the United States Research Community, with an emphasis on data collected by the United States Academic Research Fleet both during transits and surveys.
Data curation efforts include ping editing, sound velocity corrections, adjustments of attitude sensor offsets, the review and assessment of the data in the context of the high-resolution global compilation, and other adjustments necessary to create high-quality grids of multibeam data at 100 m resolution or better. Source sonar files that were gridded into the compilation are also available for download. GMRT v.3.6, which was released in December 2018, includes edited multibeam data from 1,046 research cruises, conducted between 1980 – 2018 aboard 29 different vessels operated by 26 different institutions (Figure 5). This includes more than 225,000 swath data files with more than 31 billion input soundings, which together cover an estimated area of > 31 Million km2 (8.6%) of the global ocean.
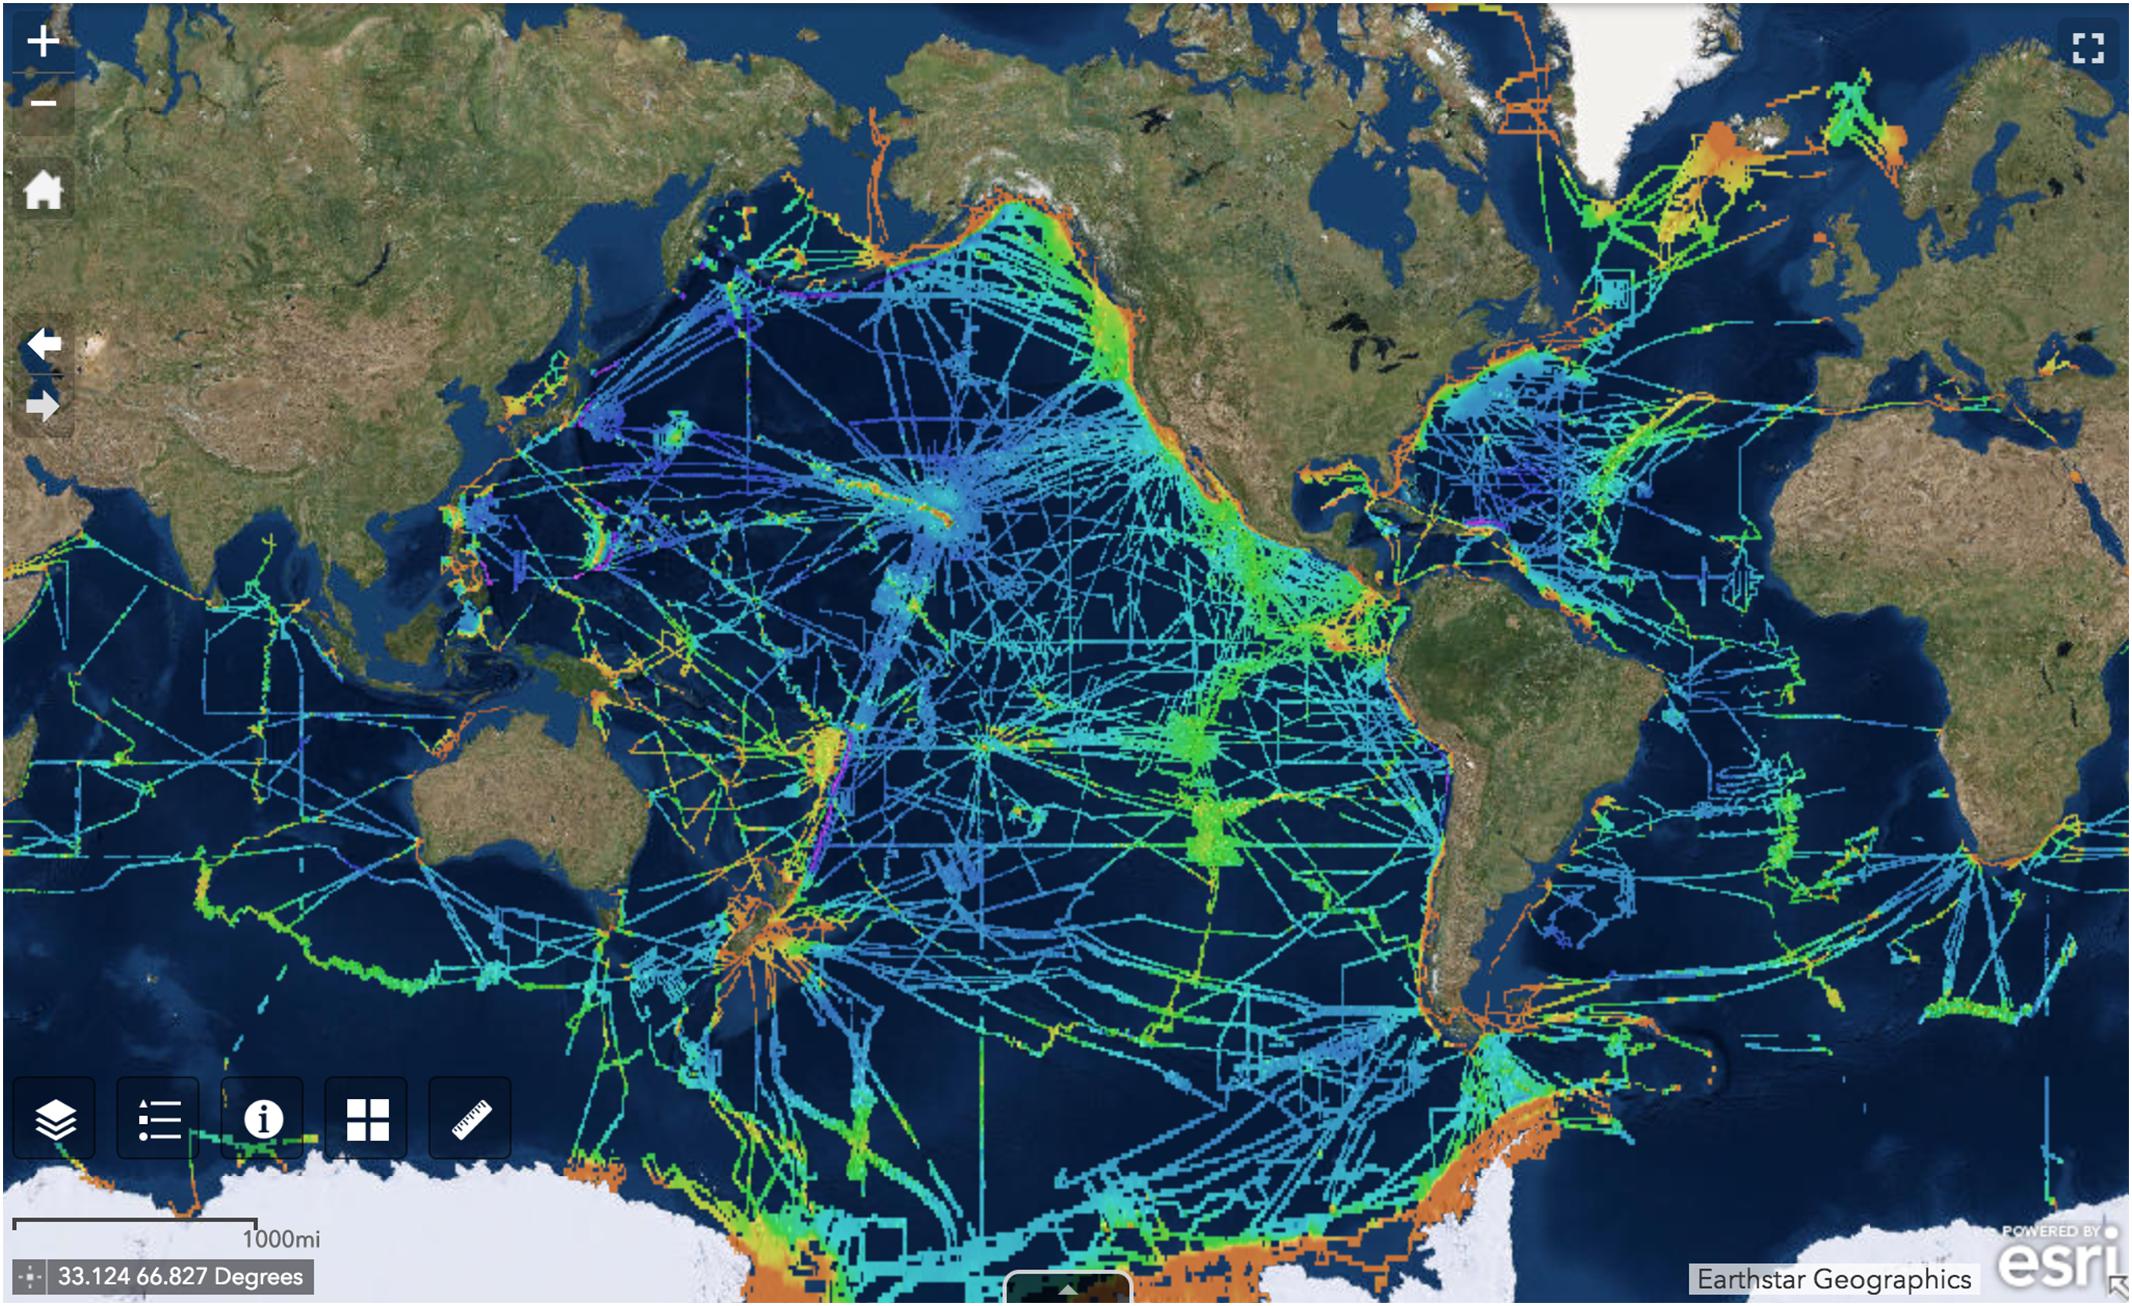
Figure 5. Global extent of curated multibeam sonar data included in GMRT v3.6. Data have been reviewed, processed and gridded at 100 m. Combined with gridded data sets at a variety of resolutions and complemented by the GEBCO basemap, GMRT provides seamless access to global multi-resolutional bathymetric and elevation data.
GEBCO
The general bathymetric chart of the oceans (GEBCO) makes available a range of bathymetric data sets and data products. It operates under the joint auspices of the international hydrographic organization (IHO) and the intergovernmental oceanographic commission (IOC) of UNESCO (United Nations Educational, Scientific and Cultural Organization).
The GEBCO chart series has its origins at the beginning of the 20th Century with the initiation of the first chart series by Prince Albert I of Monaco in 1903. Through the 20th Century, five paper editions of the GEBCO chart series were produced (Figure 6). In response to the need for digital products, the first edition of the GEBCO Digital Atlas was published on CD-ROM in 1994. In 2003 the Centenary Edition of the GEBCO Digital Atlas was produced and included GEBCO’s first gridded bathymetric product, the GEBCO One Minute Grid.
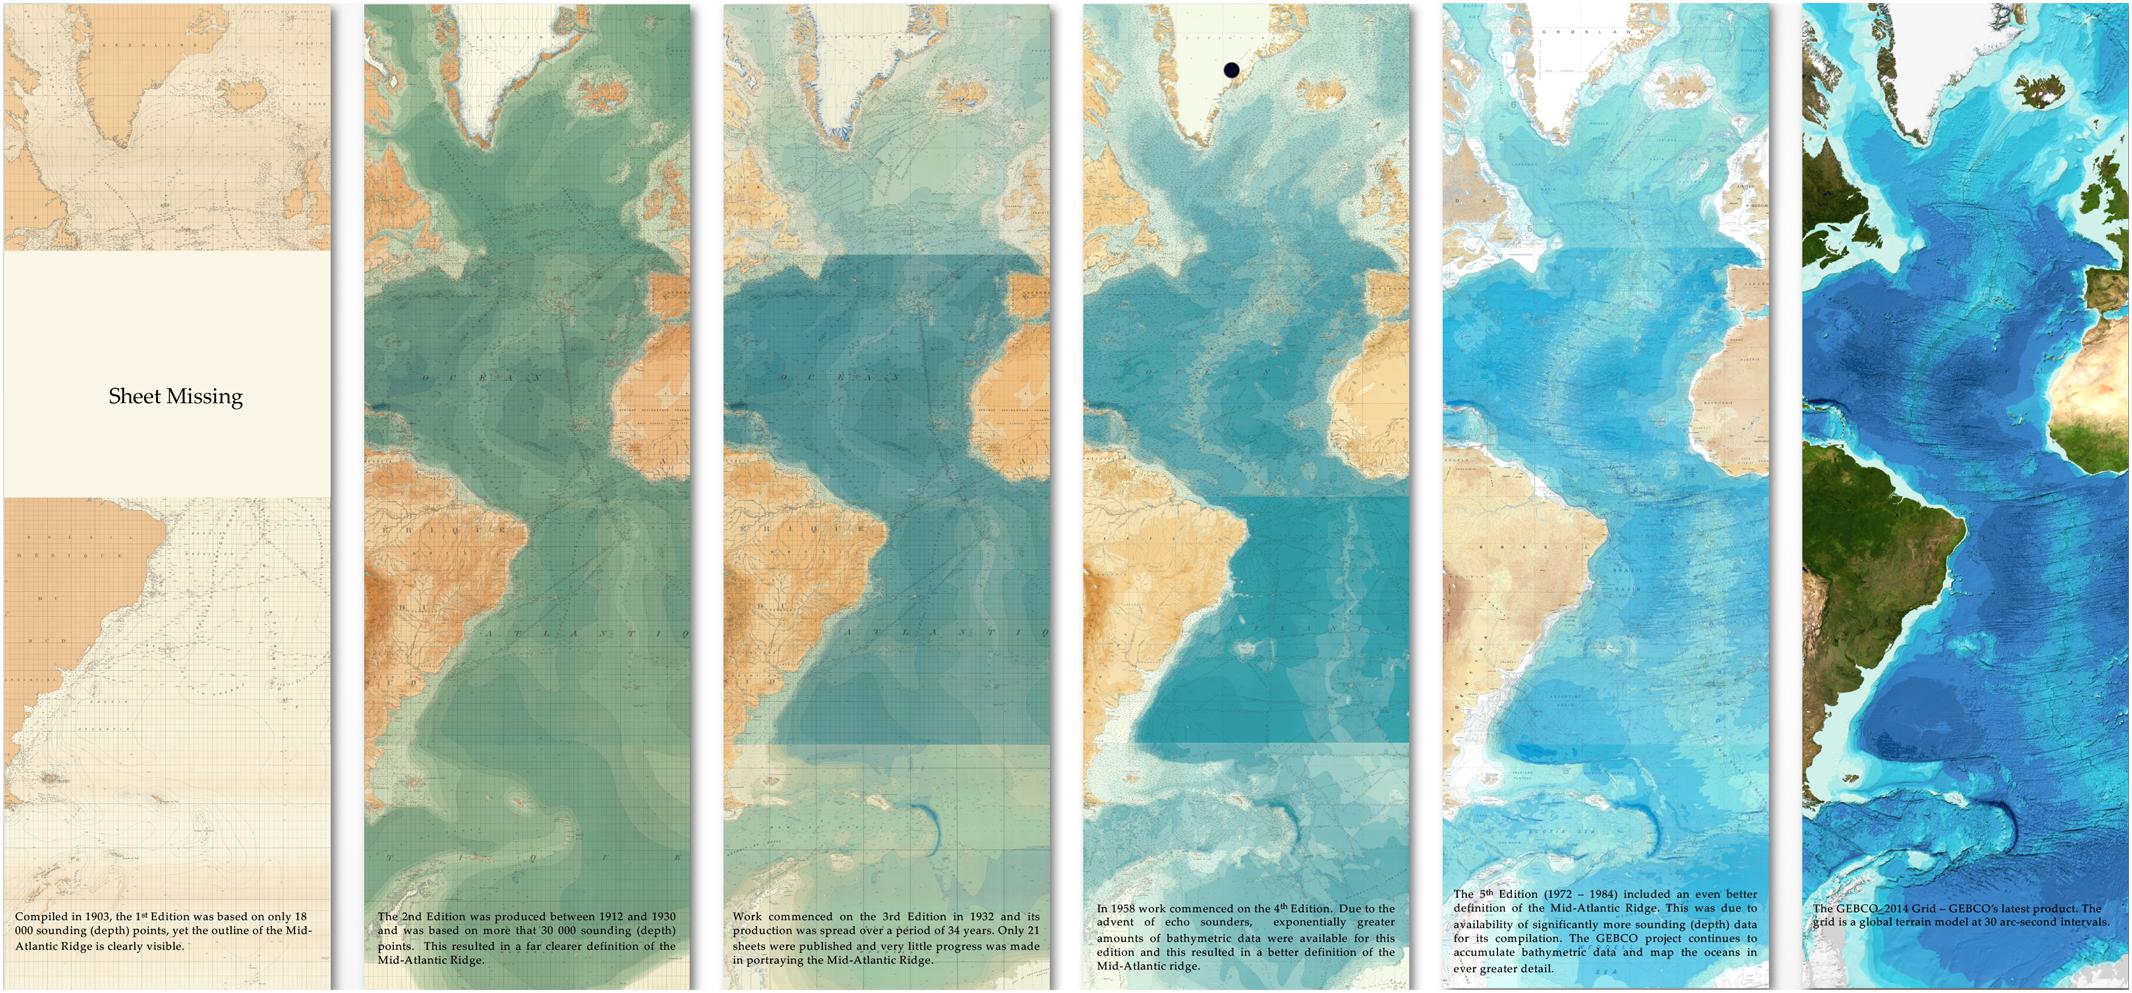
Figure 6. The Mid-Atlantic Ridge as Portrayed in GEBCO charts since 1903 (courtesy of Anthony Pharaoh, IHO).
Published in April 2019, GEBCO’s latest grid, GEBCO_2019, is a global terrain model at 15 arc-second intervals, which near the equator is about half a kilometer. This is the first GEBCO grid produced under the framework of the Nippon Foundation-GEBCO Seabed 2030 Project. The GEBCO_2019 Grid uses Version 1 of the SRTM (Shuttle Radar Topography Mission)15_PLUS data set (Olson et al., 2014) as its base. This data set is a fusion of land topography with measured and estimated seafloor topography. The data set is augmented with bathymetric data sets developed by the four Seabed 2030 Regional Centers and the international seafloor mapping community.
GEBCO makes available a range of bathymetric products and services, including:
- GEBCO_2019 grid. A global terrain model at 15 arc-second intervals.
- Gazetteer of Undersea Feature Names. A digital data set giving the name, generic feature type and geographic location of names of features on the seafloor.
- GEBCO world map. The map shows the bathymetry of the world’s ocean floor in the form of a shaded relief color map. It is based on the GEBCO_08 Grid and can be accessed as an image file.
- GEBCO web map service (WMS). The GEBCO grid is available as a WMS, a means of accessing geo-referenced map images over the internet.
- IHO-IOC GEBCO Cook Book. The Cook Book is a technical reference manual containing information on the development of bathymetric grids and related topics.
The current generation of GEBCO gridded data products is reliant on a range of regional and global mapping projects. GMRT routinely contributes to GEBCO data products. EMODnet Bathymetry is another contributor, together with international bathymetric chart of the arctic ocean (IBCAO) and international bathymetric chart of the southern ocean (IBCSO). Regional grids were also provided for the Caspian, Black, Baltic and Weddell Seas, and for the parts of the Pacific, Atlantic and Indian Oceans by a variety of national agencies and international projects (Weatherall et al., 2015). This collaboration within GEBCO, taking advantage of regional mapping expertise, is fundamental to the production of a global high-quality gridded bathymetry.
International Collaboration in Global Mapping
From the descriptions of the example initiatives above, synergies between regional and worldwide bathymetric synthesis efforts is self-evident. Figure 7 shows the general flow of data from data sources into publicly accessible repositories and bathymetric syntheses, and how various synthesis efforts relate to one another. The IHO DCDB serves as the long-term repository for global bathymetric data, that can receive, archive and make available existing data that is not yet shared as well as newly acquired data. Data sources including CSB as well as bathymetric data from the science and the private sector have been described in detail above. In turn, regional and global bathymetric synthesis projects and initiatives provide quality controlled data products, such as GMRT and EMODnet, are important building blocks that contribute to Seabed 2030 and the GEBCO global map. All data products are delivered directly to the public, shared among syntheses, and are ultimately assembled at Seabed 2030 into new regional data products that feed into GEBCO global products. Coordination between and among these efforts is important to avoid duplication of effort, to bring all data sources together efficiently, and to acknowledge the work and contributions of all efforts and projects.
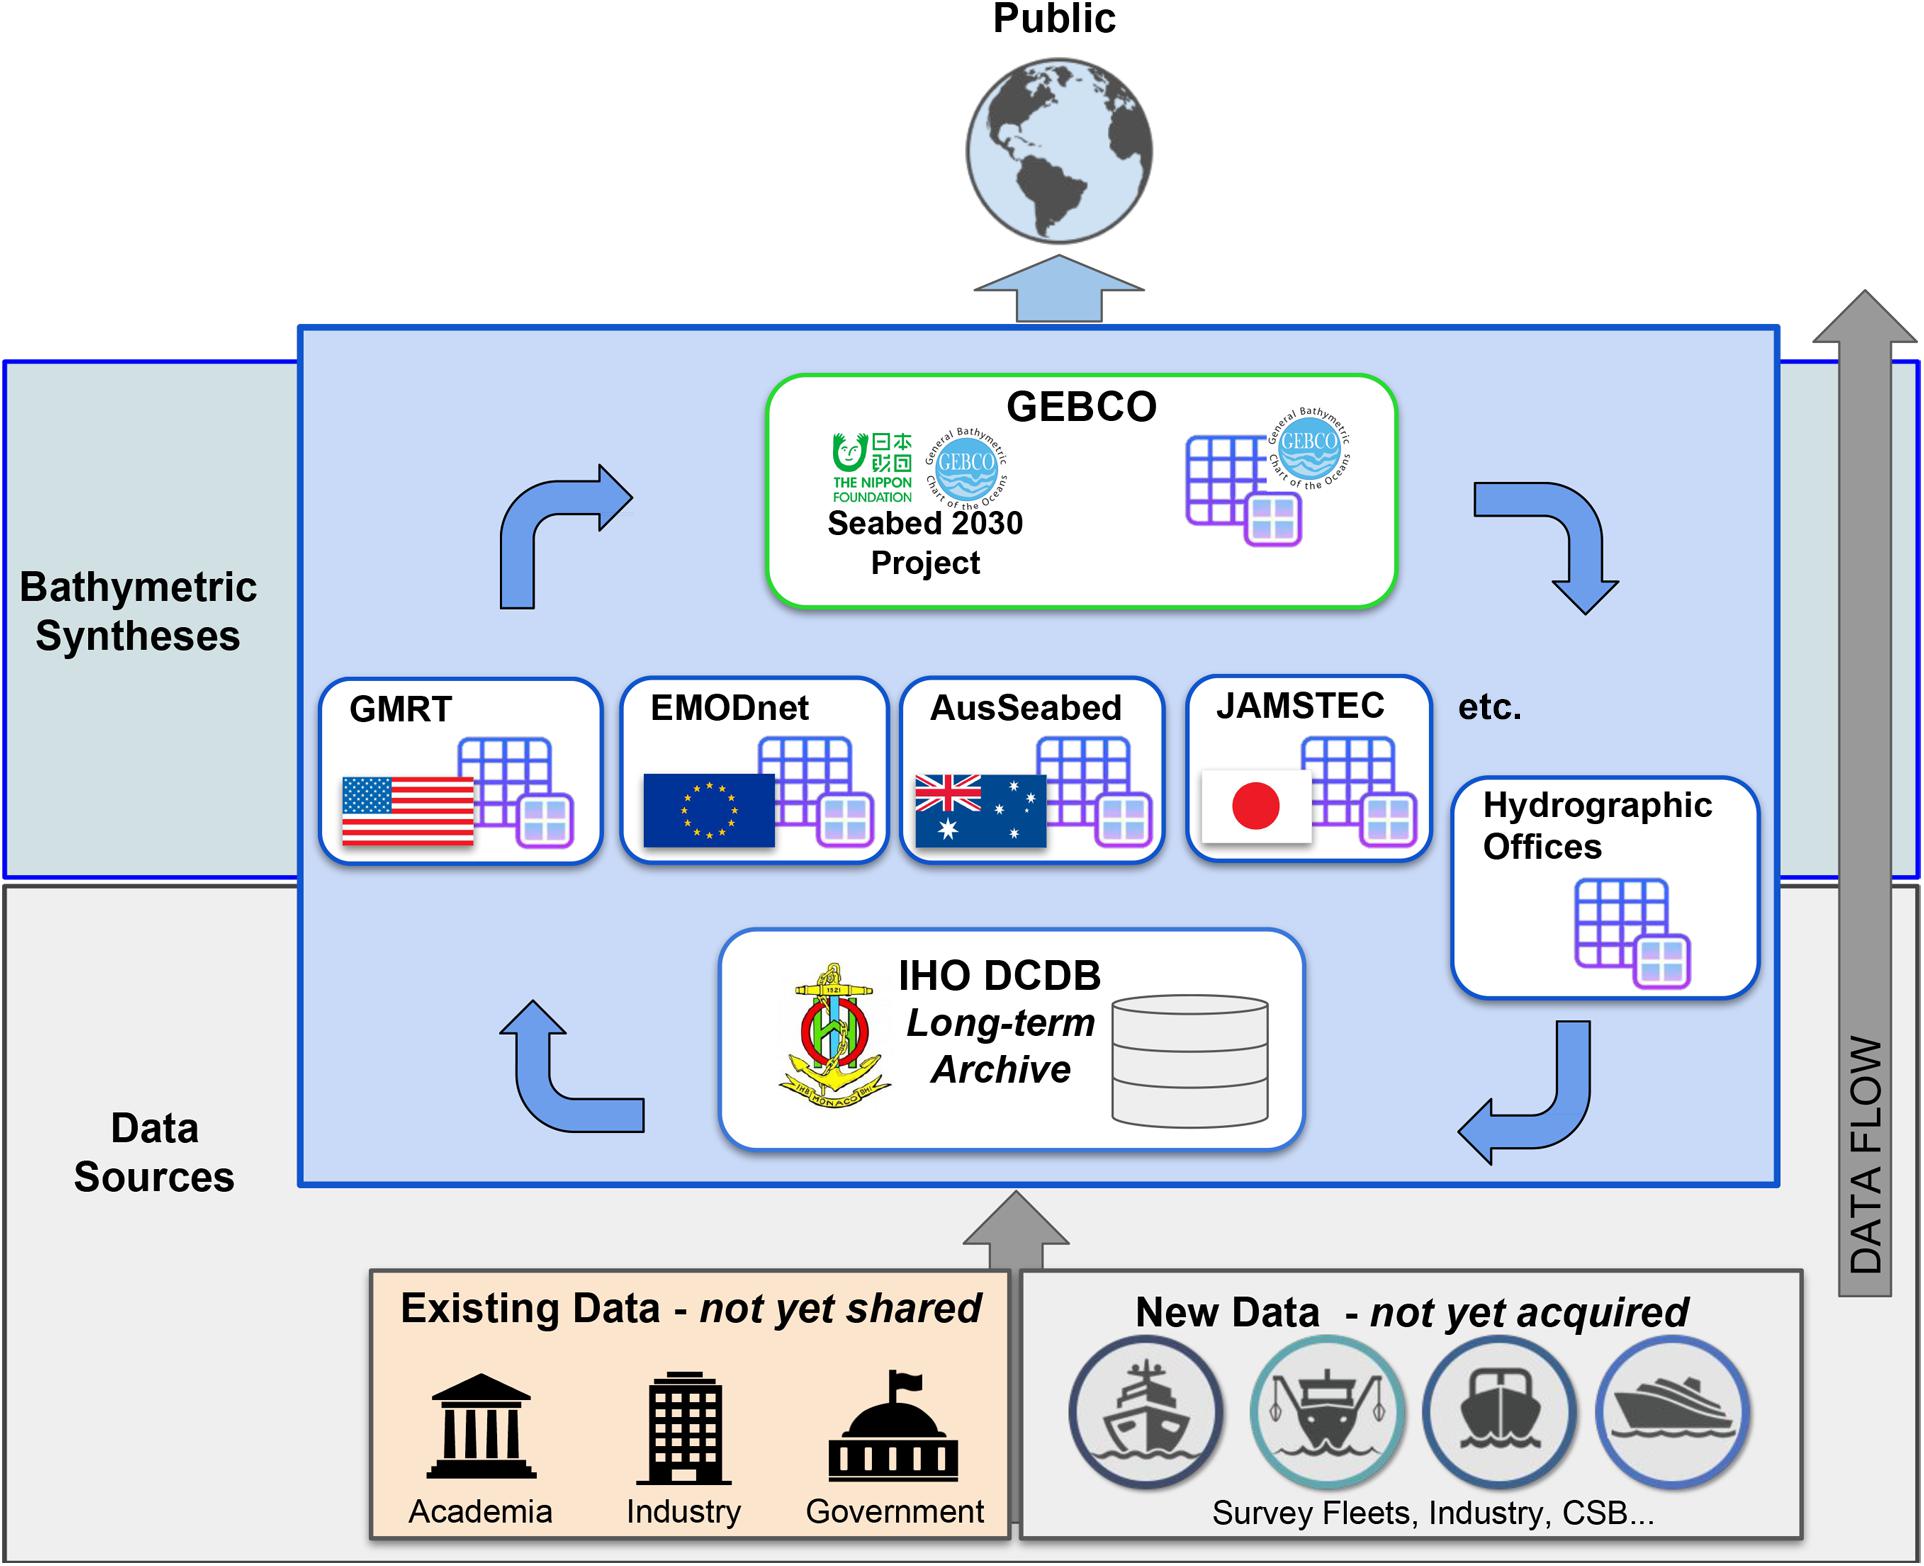
Figure 7. Schematic showing overall flow of data from academic, public and industry sources into public repositories and bathymetric synthesis efforts. This diagram highlights some of the efforts that are underway globally, but is not an exhaustive list of all projects and scales of coordination.
A Seafloor Mapping Strategy is Needed
Nippon Foundation-GEBCO Seabed 2030 Project
Seabed 2030 is a collaborative project between the Nippon Foundation of Japan and GEBCO. It aims to bring together all available bathymetric data to produce the definitive map of the world ocean floor by 2030 and make it available to all (Jakobsson et al., 2017). The project was launched at the UN Ocean Conference in June 2017 and is aligned with the SDG 14 – Life below water.
The project has established four Regional Centers and a Global Center, is managed by a project director, and is overseen by the GEBCO Guiding Committee. The Regional Centers are responsible for championing mapping activities; assembling and compiling bathymetric information and collaborating with existing mapping initiatives in their regions. The Global Center is responsible for producing and delivering centralized GEBCO/Seabed 2030 products, such as global bathymetric grids. The most recent GEBCO grid, GEBCO_2019, is the first product of the Seabed 2030 Project.
To define the scope of work to populate the map with direct measurement, the project has established a variable-resolution and depth-dependent data scheme to be used for determining “mapped” status (Table 1), based on the varying resolution of modern hull-mounted swath bathymetry systems as a function of water depth.
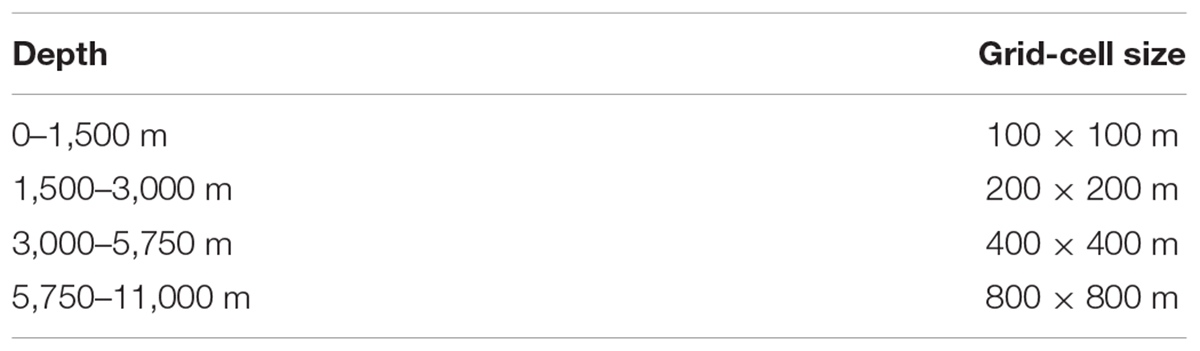
Table 1. Seabed 2030 resolution targets at different depth ranges (Mayer et al., 2018).
Using this scheme, an analysis of the source data for the GEBCO_2014 grid, i.e., those data included in GEBCO before the start of the Seabed 2030 Project, showed that actual bathymetric data were available for approximately 6.2% of the global ocean grid cells, 6% of those in international waters, and 5.7% in EEZ. More than two thirds of the data contribution is for grid cells in the 3000–5750 m depth range (Figure 8). Using the same scheme, the recently released GEBCO_2019 product has almost 15% of the depth-dependent resolution grid cells based on actual data.
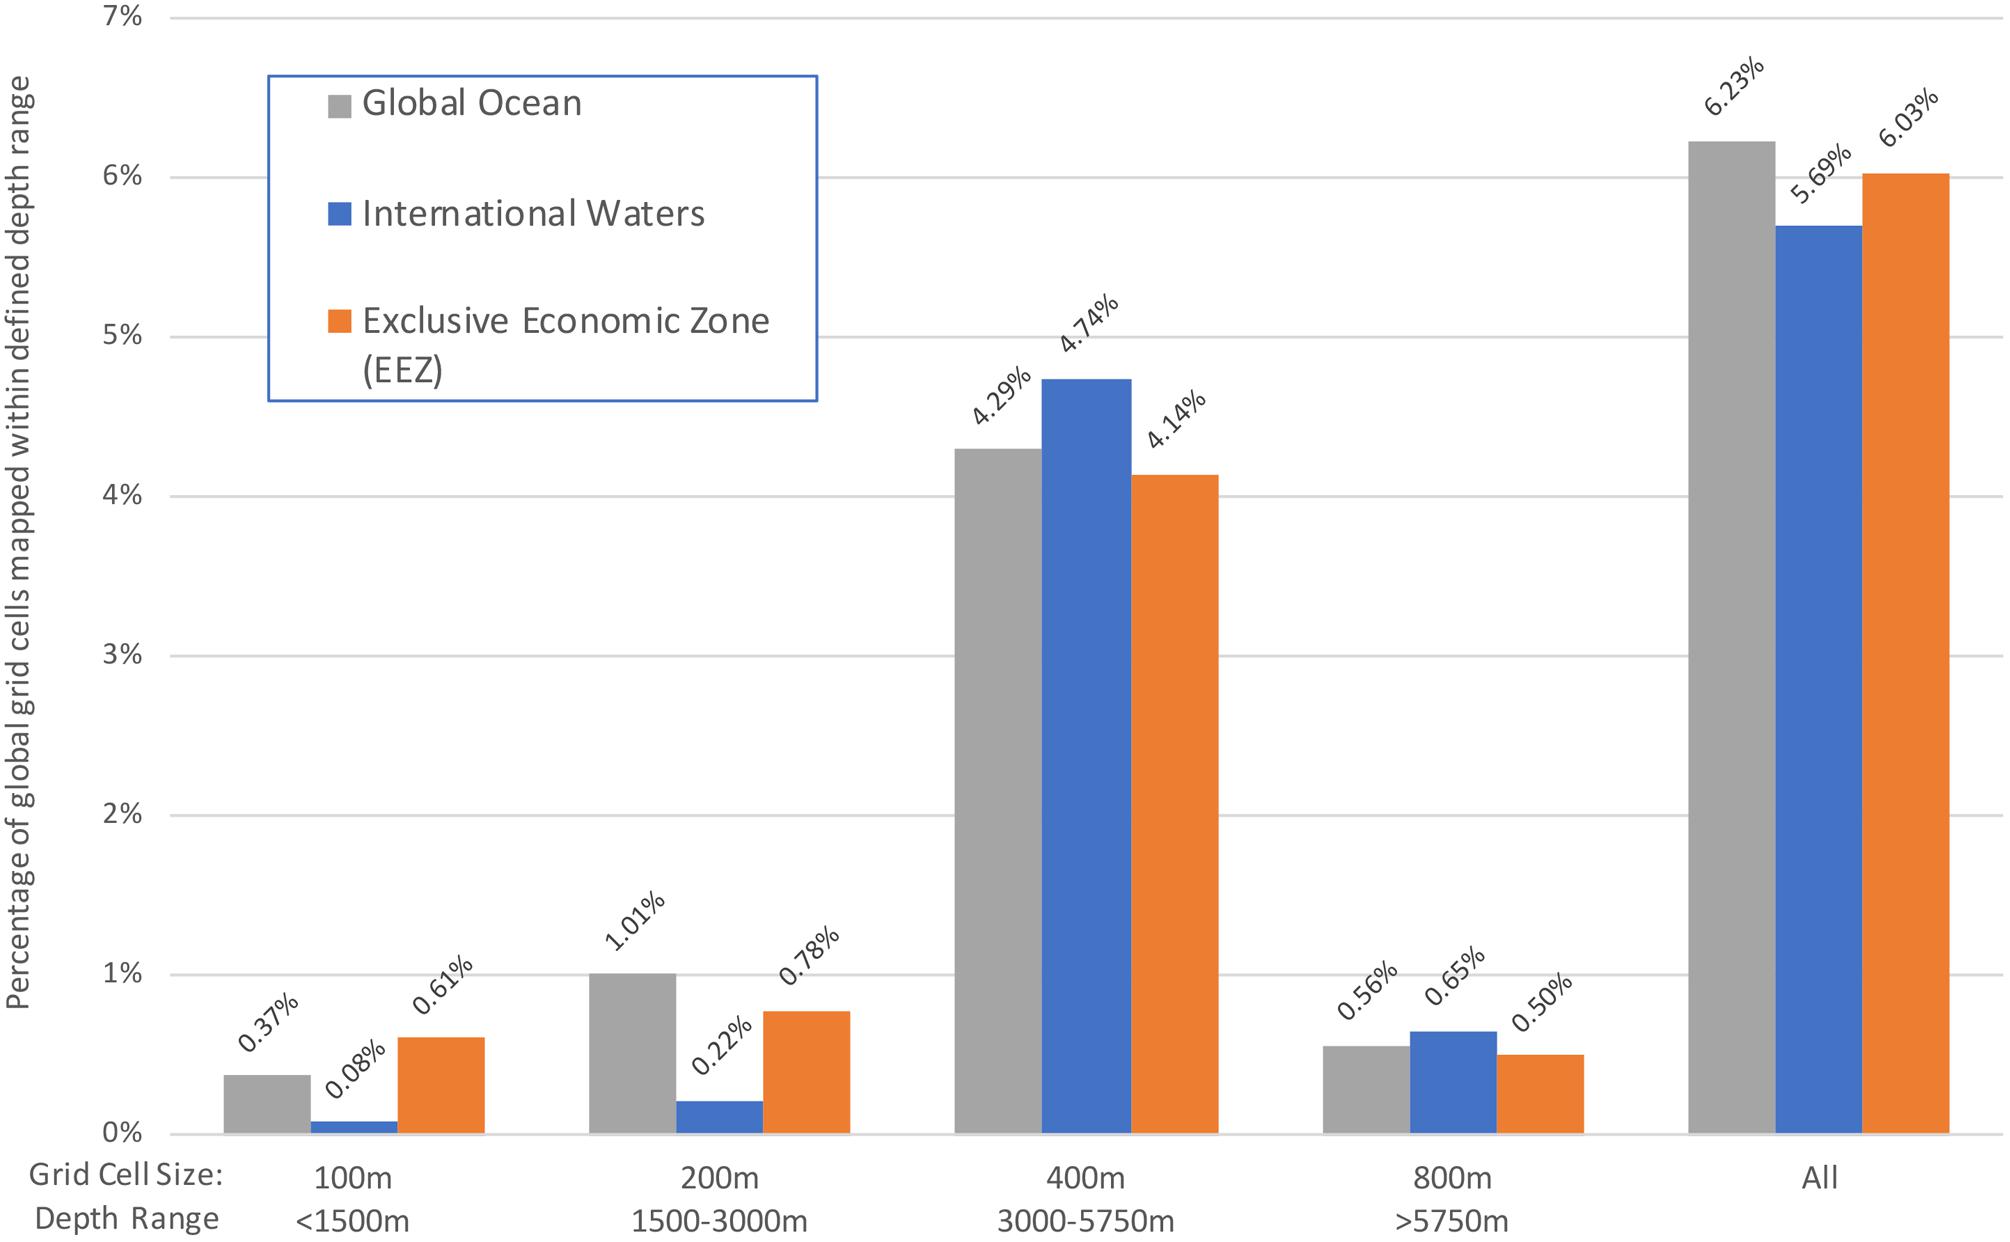
Figure 8. Percentage of the Seabed 2030 target depth-dependent resolution global grid that would be considered “mapped” using the GEBCO_2014 source data, split by contribution from each depth range: calculated as percentage of grid cells in the global ocean, in international waters and in exclusive economic zones (EEZ; all data in Antarctic waters are considered to be outside countries’ EEZs).
Early priorities of the project include identification of existing data that are not yet included in GEBCO products, using sources outlined earlier. Seabed 2030 is working on building relationships with the survey companies and their customers to release the data they hold or own for use in generating the next generation of GEBCO products. Furthermore, it is critical that a concerted effort is made to identify other available sources and how they can be accessed. Achieving this aim, however, is challenging, especially where the data require to be transferred either via internet or in physical storage devices. First-hand experience in the AusSeabed initiative in Australia has highlighted that transfer of large acoustic seabed data over the internet is difficult for many organizations and can be barrier to accessing these data for producing consistent, consolidated products. In addition, QA of the data prior to submission is necessary to ensure the data can be easily integrated with other existing data. Manual work for preparing and integrating the data and making them available on these end-point portals is another challenge that can become complicated by the variety of proprietary and open formats commonly used in the community.
The Seabed 2030 Project also has, as part of its mission, a requirement to work with the wider bathymetry community to develop strategies for effective mapping. Working through existing partnerships, such as IBCAO and IBCSO, exploration efforts are already being concentrated on those areas with no swath bathymetry coverage (Jakobsson et al., 2012; Arndt et al., 2013). The Regional Mapping Committees being developed in support for the project Regional Centers will aim to expand these efforts to global international waters.
Mapping the Gaps
At present, the chances are still high that any particular multibeam survey will cover unmapped terrain, especially in the deep sea remote from much frequented shipping lanes. In the long term a more strategic approach from the seafloor mapping community is needed, especially in international waters, in order to avoid duplication of effort, efficiently utilize sea-going assets, and to mitigate environmental impacts associated with at-sea operations, such as ocean noise. But how do we choose where to map? An initial attempt has been made by Wölfl et al. (2017) by identifying target areas for future mapping initiatives in the North Atlantic based on multibeam data density and carefully chosen and publicly available marine environmental parameters.
Furthermore, there are regions within the ocean that are of special interest for different kinds of stakeholder groups and it seems reasonable to prioritize those regions. However, it is also important to focus on those regions that are of interest for coastal states that have neither the capabilities nor the facilities to perform large mapping surveys with the systems used by large research institutions and industry. The focus of new technological developments is mainly on automation processes, higher-resolution and enhanced data quality at acquisition. Making the technology affordable for a wider range of user groups currently seems to be of secondary importance but should be tackled as a priority as well.
Outlook and Recommendations
Understanding the seafloor and associated processes is closely linked to its bathymetry. Mapping the gaps in the world’s oceans will better our knowledge of the seafloor and the oceans in general. This knowledge is a significant contribution to the development of sustainable ocean management plans and allows us to respond appropriately to modern challenges, such as environmental degradation in the marine realm, climate change, geohazards and a growing ocean industry. This paper shows the importance of bathymetric data for a variety of applications, and describes the importance of many initiatives and projects that focus on compiling bathymetric data into publicly available archives and syntheses. Although these initiatives have slightly different approaches and goals, they all have in common a commitment to data sharing, and to making data and metadata discoverable and publicly available for all. It is clear that mapping the world’s ocean is not a task that can be tackled by one sector or project alone, and that collaboration and coordination across sectors and at a variety of scales is needed. Seabed 2030 is a project borne of this recognition, as presented at the Forum for Future Ocean Floor Mapping, held in Monaco in June 2016. Significant international collaborative efforts already in place within GEBCO, and the bathymetric syntheses described are important components of global mapping initiatives.
The success of future mapping efforts will be reliant on the continuation of these existing efforts and appropriate mapping strategies to provide ever-increasing volumes of high quality data from throughout the global oceans. Increasing the flow of existing, and new, high-quality data through the IHO DCDB and other recognized data centers from across the marine community including the international research community, the commercial sector and via crowdsourcing programs, will provide a huge boost to the data availability. The development of more efficient solutions for data transfer and data processing will be necessary to keep pace with increasing data volumes.
In sum, an increase in data gathering activities combined with effective targeting of future mapping programs and latest technology developments, as well as efficient data processing chains and mapping expertise will be needed if we are ever to deliver knowledge of the seafloor comparable to our knowledge of the land surface.
Based on this paper, the following recommendations regarding the future of seafloor mapping are given:
• Promotion of collaboration and transparency among all sectors.
• Further development of open access data policies for all sectors.
• Provision of bathymetric data sets to publicly accessible online repositories, or lower resolution products or metadata information in case of sensitive data.
• Further strategy development regarding new bathymetric data collection to effectively fill the gaps, leaving a low environmental impact.
• Explore and use opportunities for “underway” data collection, such as transit data and CSB data acquisition.
• Promote standards and establish a QA process for bathymetric data in the community.
• Continuous incorporation of updated bathymetric information into ocean management plans.
• Promote technology developments, regarding enhanced data quality, but also address the needs of low budget user groups by developing low budget solutions.
Author Contributions
Structure and basic content of the manuscript came from A-CW and HS. The section ‘Bathymetric data repositories and syntheses’ was compiled by JJ, TS, VF, and PW. All authors wrote or edited different text sections, reviewed the manuscript and contributed to the responses to the reviewer’s comments.
Funding
A-CW has received funding from the European Union’s Horizon 2020 Research and Innovation Program under grant agreement no. 633211 (AtlantOS). VH was supported by the CLASS programme (NERC Grant No. NE/R015953/1). GL’s contribution was funded by the Nippon Foundation-GEBCO Seabed 2030 Project and by the New Zealand Strategic Science Investment Funded (SSIF) programme Marine Geological Resources of NIWA. This manuscript is published with the permission of the CEO, Geoscience Australia.
Conflict of Interest Statement
GJ was employed by company Venture Geomatics Limited. DM was employed by company Fugro USA Marine, Inc. TP was employed by company Kongsberg Maritime AS. SA was employed by company FrontierSI. All other authors declare no competing interests.
Acknowledgments
The authors would like to thank two reviewers for their constructive comments that significantly helped to improve this manuscript.
References
Amirebrahimi, S., Picard, K., and Quadros, N. (in press). Multibeam Echo Sounder Data Acquisition in Australia and Beyond —- User Needs Summary. Record 2019/XX. Symonston, ACT: Geoscience Australia.
Arndt, J. E., Schenke, H.-W., Jakobsson, M., Nitsche, F. O., Buys, G., Goleby, B., et al. (2013). The international bathymetric chart of the southern ocean (IBCSO) version 1.0 – a new bathymetric compilation covering circum-antarctic waters. Geophys. Res. Lett. 40, 1–7. doi: 10.1002/grl.50413
Australian Government (2017). The Data Behind the Search for MH370. Available at: https://geoscience-au.maps.arcgis.com/apps/Cascade/index.html?appid=038a72439bfa4d28b3dde81cc6ff3214 (accessed April 6, 2019).
Bowen, A., Yoerger, D., and Whitcomb, L. (2007). “Hybrid ROV for 11,000 meter operations,” in Proceedings of the Symposium on Underwater Technology and Workshop on Scientific Use of Submarine Cables and Related Technologies, Tokyo, 206–207.
Calder, B. R., and Mayer, L. A. (2003). Automatic processing of high-rate, high-density multibeam echosounder data. Geochem. Geophys. Geosyst. 4
Carlon, R. (2018). Going where no humans should go – unmanned surface vehicles monitoring kilauea volcano lava flow. Hydro Int. 22, 23–25.
Chiocci, F. L., Cattaneo, A., and Urgeles, R. (2011). Seafloor mapping for geohazard assessment: state of the art. Mar. Geophys. Res. 32, 1–11. doi: 10.1007/s11001-011-9139-8
Clark, M. R., Rouse, H. L., Lamarche, G., Ellis, J. I., and Hickey, C. (2017). Preparation of Environmental Impact Assessments: General Guidelines for Offshore Mining and Drilling with Particular Reference to New Zealand. Report No: NIWA Science and Technology Series. Wellington: NIWA.
Eakins, B. W., and Sharman, G. F. (2010). Volumes of the World’s Oceans from ETOPO1. Boulder, CO: NOAA National Geophysical Data Center.
Ellis, J., Clark, M., Rouse, H., and Lamarche, G. (2017). Environmental management frameworks for offshore mining: the New Zealand approach. Mar. Policy 84, 178–192. doi: 10.1016/j.marpol.2017.07.004
Fenty, I., Willis, J. K., Khazendar, A., Dinardo, S., Forsberg, R., Fukumori, I., et al. (2016). Oceans melting greenland: early results from NASA’S ocean-ice mission in greenland. Oceanography 29, 72–83. doi: 10.5670/oceanog.2016.100
Gula, J., Molemaker, M. J., and McWilliams, J. C. (2015). Gulf stream dynamics along the southeastern U.S. Seaboard. J. Phys. Oceanogr. 45, 690–715. doi: 10.1175/JPO-D-14-0154.1
Hamilton, T. (2018). Improving survey efficiency through real-time survey visualization. Fredericton, NB: Teledyne CARIS Incorporated
Haugen, J. J. (2018). Expanding operations over the horizon - optimising workflows on the maritime information highway. Hydro Int. 22, 27–29.
Hein, J. R., Conrad, T. A., and Dunham, R. E. (2009). Seamount characteristics and mine-site model applied to exploration- and mining-lease-block selection for cobalt-rich ferromanganese crusts. Mar. Georesour. Geotechnol. 27, 160–176. doi: 10.1080/10641190902852485
Hess, H. H. (1962). “History of ocean basins,” in Petrologic Studies: A Volume to Honor, eds A. F. Buddington, A. E. J. Engel, H. L. James, and B. F. Leonard (Boulder, CO: Geological Society of America), 599–620. doi: 10.1130/petrologic.1962.599
Howell, K. L., Holt, R., Endrino, P., and Stewart, H. (2011). When the species is also a habitat: comparing the predictively modelled distributions of Lophelia pertusa and the reef habitat it forms. Biol Conserv. 144, 2656–2665. doi: 10.1016/j.biocon.2011.07.025
Huvenne, V. A. I., Robert, K., Marsh, L., Lo Iacono, C., Le Bas, T. P., and Wynn, R. B. (2018). “ROVs and AUVs,” in Submarine Geomorphology, eds A. Micallef, S. Krastel, and A. Savini (Heidelberg: Springer), 93–108.
International Hydrographic Bureau (2008). IHO Standards for Hydrographic Surveys, 5th Edn. Monaco: IHO.
Irish, J. L., and White, T. E. (1998). Coastal engineering applications of high-resolution lidar bathymetry. Coast. Eng. 35, 47–71. doi: 10.1016/S0378-3839(98)00022-2
Jakobsson, M., Allen, G., Carbotte, S. M., Falconer, R., Ferrini, V., Marks, K., et al. (2017). The Nippon Foundation - GEBCO - Seabed 2030: Roadmap for Future Ocean Floor Mapping. Available at: https://www.gebco.net/documents/seabed_2030_roadmap_v10_low.pdf (accessed July 27, 2018).
Jakobsson, M., Mayer, L., and Armstrong, A. (2003). Analysis of data relevant to establishing outer limits of a continental shelf under law of the sea article 76. Int. Hydrogr. Rev. 4, 1–18.
Jakobsson, M., Mayer, L. A., Coakley, B. J., Dowdeswell, J. A., Forbes, S., Fridman, B., et al. (2012). The international bathymetric chart of the arctic ocean (IBCAO) version 3.0. Geophys. Res. Lett. 39:L12609. doi: 10.1029/2012GL052219
Kelley, C., Kerby, T., Sarradin, P., Sarrazin, J., and Lindsay, D. J. (2016). “Submersibles and Remotely Operated Vehicles,” in Biological Sampling in the Deep Sea, eds M. R. Clark, M. Consalvey, and A. A. Rowden (Hoboken, NJ: Wiley Blackwell).
Lamarche, G., Orpin, A., Mitchell, J., and Pallentin, A. (2016). “Benthic habitat mapping,” in Biological Sampling in the Deep Sea, eds M. R. Clark, M. Consalvey, and A. A. Rowden (Hoboken, NJ: Wiley-Blackwell).
Lucieer, V. L., and Forrest, A. L. (2016). “Emerging mapping techniques for autonomous underwater vehicles (AUVs),” in Seafloor Mapping Along Continental Shelves: Research and Techniques for Visualizing Benthic Environments, eds W. C. Finkl and C. Makowski (Cham: Springer International Publishing).
Lucieer, V. L., Nau, A. W., Forrest, A. L., and Hawes, I. (2016). Fine-Scale sea ice structure characterized using underwater acoustic methods. Remote Sens. 8:821. doi: 10.3390/rs8100821
Lurton, X. (2002). An Introduction to Underwater Acoustics, Principles and Applications. Cham: Springer.
Mayer, L. (2006). Frontiers in seafloor mapping and visualization. Mar. Geophys. Res. 27, 7–17. doi: 10.1007/s11001-005-0267-x
Mayer, L., Jakobsson, M., Allen, G., Dorschel, B., Falconer, R., Ferrini, V., et al. (2018). The nippon foundation—GEBCO seabed 2030 project: the quest to see the world’s oceans completely mapped by 2030. Geosciences 8:63. doi: 10.3390/geosciences8020063
Olson, C. J., Becker, J. J., and Sandwell, D. T. (2014). “A new global bathymetry map at 15 arcsecond resolution for resolving seafloor fabric: SRTM15_PLUS,” in Proceedings of the AGU Fall Meeting Abstracts 2014, San Francisco, CA.
Olson, C. J., Becker, J. J., and Sandwell, D. T. (2016). SRTM15_PLUS: Data Fusion of Shuttle Radar Topography Mission (SRTM) Land Topography with Measured and Estimated Seafloor Topography (NCEI Accession 0150537). Version 1.1. Asheville: NOAA National Centers for Environmental Information.
Pe’eri, S., Parrish, C., Azuike, C., Alexander, L., and Armstrong, A. (2014). Satellite remote sensing as reconnaissance tool for assessing nautical chart adequacy and completeness. Mar. Geod. 37, 293–314. doi: 10.1080/01490419.2014.902880
Picard, K., Brooke, B. P., Harris, P. T., Siwabessy, P. J. W., Coffin, M. F., Tran, M., et al. (2018). Malaysia Airlines flight MH370 search data reveal geomorphology and seafloor processes in the remote southeast Indian Ocean. Mar. Geol. 395, 301–319. doi: 10.1016/j.margeo.2017.10.014
Picard, K., Smith, W. H., Tran, M., Siwabessy, J. P., and Kennedy, P. (2017). Increased resolution bathymetry in the southeast indian ocean. Hydro International Magazine. Available at: https://www.hydro-international.com/content/article/increased-resolution-bathymetry-in-the-southeast-indian-ocean (accessed September 28, 2017).
Renard, V., and Allenou, J. P. (1979). SeaBeam multibeam echo sounding in jean charcot: description, evaluation and first results. Intern. Hydrog. Rev. 1, 35–67.
Rengstorf, A. M., Mohn, C., Brown, C., Wisz, M. S., and Grehan, A. J. (2014). Predicting the distribution of deep-sea vulnerable marine ecosystems using high-resolution data: considerations and novel approaches. Deep Sea Res. Part I Oceanogr. Res. Pap. 93, 72–82. doi: 10.1016/j.dsr.2014.07.007
Rezvani, M.-H., Sabbagh, A., and Ardalan, A. A. (2015). Robust automatic reduction of multibeam bathymetric data based on M-estimators. Mar. Geod. 38, 327–344. doi: 10.1080/01490419.2015.1053639
Ryan, W. B. F., Carbotte, S. M., Coplan, J. O., O’Hara, S., Melkonian, A., Arko, R., et al. (2009). Global multi-resolution topography synthesis. Geochem. Geophys. Geosyst. 10, 1525–2027. doi: 10.1029/2008GC002332
Sala, E., Lubchenco, J., Grorud-Colvert, K., Novelli, C., Roberts, C., and Sumaila, U. R. (2018). Assessing real progress towards effective ocean protection. Mar. Policy 91, 11–13. doi: 10.1016/j.marpol.2018.02.004
Sandwell, D. T., Müller, R. D., Smith, W. H. F., Garcia, E., and Francis, R. (2014). New global marine gravity model from Cryo-Sat-2 and jason-1 reveals buried tectonic structure. Science 346, 65–67. doi: 10.1126/science.1258213
Sandwell, D. T., Smith, W. H. F., Gille, S., Kappel, E., Jayne, S., Soofi, K., et al. (2006). Bathymetry from space: rationale and requirements for a new, high-resolution altimetric mission. C. R. Geosci. 338, 1049–1062. doi: 10.1016/j.crte.2006.05.014
Santoso, A., Cai, W., England, M. H., and Phipps, S. J. (2011). The role of the indonesian throughflow on ENSO dynamics in a coupled climate model. J. Clim. 24, 585–601. doi: 10.1175/2010JCLI3745.1
Smith, W. H. F., and Sandwell, D. T. (1997). Global seafloor topography from satellite altimetry and ship depth soundings. Science 277, 1957–1962.
Stocker, T. F., Qin, D., Plattner, G.-K., Tignor, M., Allen, S. K., Boschung, J., et al. (2013). Climate Change 2013: The Physical Science Basis. Cambridge: Cambridge University Press.
Theberge, A. E. (1989). “Sounding pole to sea beam,” in Paper Presented at the 1989 ASPRS/ACSM Annual Convention Surveying and Cartography, (Silver Spring, MD: NOAA Central Library), 334–346.
Thompson, A. F., and Sallée, J.-B. (2012). Jets and topography: jet transitions and the impact on transport in the antarctic circumpolar current. J. Phys. Oceanogr. 42, 956–972. doi: 10.1175/jpo-d-11-0135.1
United Nations (1982). Convention on the Law of the Sea (UNCLOS). Available at: http://www.un.org/depts/los/convention_agreements/texts/unclos/unclos_e.pdf (accessed December 10, 1982).
United Nations (2015). Transforming Our World: the 2030 Agenda for Sustainable Development. Available at: https://sustainabledevelopment.un.org/post2015/transformingourworld/publication (accessed October 21, 2015).
Weatherall, P., Marks, K. M., Jakobsson, M., Schmitt, T., Tani, S., Arndt, J. E., et al. (2015). A new digital bathymetric model of the world’s oceans. Earth Space Sci. 2, 331–345. doi: 10.1002/2015ea000107
Wilson, M. F. J., O’Connell, B., Brown, C., Guinan, J. C., and Grehan, A. J. (2007). Multiscale terrain analysis of multibeam bathymetry data for habitat mapping on the continental slope. Mar. Geod. 30, 3–35. doi: 10.1080/01490410701295962
Wölfl, A.-C., Jencks, J., Johnston, G., Varner, J. D., and Devey, C. D. (2017). Where to go next? Identifying target areas in the north atlantic for future seafloor mapping initiatives. J. Ocean Technol. 12, 28–42.
Keywords: bathymetry, seafloor, mapping, GEBCO, seabed 2030, SDG14
Citation: Wölfl A-C, Snaith H, Amirebrahimi S, Devey CW, Dorschel B, Ferrini V, Huvenne VAI, Jakobsson M, Jencks J, Johnston G, Lamarche G, Mayer L, Millar D, Pedersen TH, Picard K, Reitz A, Schmitt T, Visbeck M, Weatherall P and Wigley R (2019) Seafloor Mapping – The Challenge of a Truly Global Ocean Bathymetry. Front. Mar. Sci. 6:283. doi: 10.3389/fmars.2019.00283
Received: 01 November 2018; Accepted: 15 May 2019;
Published: 05 June 2019.
Edited by:
Tong Lee, NASA Jet Propulsion Laboratory (JPL), United StatesReviewed by:
David Sandwell, University of California, San Diego, United StatesMeredith Westington, Office of Coast Survey NOAA, United States
Copyright © 2019 Wölfl, Snaith, Amirebrahimi, Devey, Dorschel, Ferrini, Huvenne, Jakobsson, Jencks, Johnston, Lamarche, Mayer, Millar, Pedersen, Picard, Reitz, Schmitt, Visbeck, Weatherall and Wigley. This is an open-access article distributed under the terms of the Creative Commons Attribution License (CC BY). The use, distribution or reproduction in other forums is permitted, provided the original author(s) and the copyright owner(s) are credited and that the original publication in this journal is cited, in accordance with accepted academic practice. No use, distribution or reproduction is permitted which does not comply with these terms.
*Correspondence: Anne-Cathrin Wölfl, YXdvZWxmbEBnZW9tYXIuZGU=