 Goulven G. Laruelle1,2*
 Audrey Marescaux1,2
 Romain Le Gendre3
 Josette Garnier1,4
 Christophe Rabouille5Vincent Thieu1
- 1UMR 7619 Metis, CNRS, EPHE, Institute Pierre Simon Laplace (IPSL), Sorbonne Université, Paris, France
- 2FR636 Institute Pierre Simon Laplace (IPSL), CNRS, Sorbonne Université, Paris, France
- 3IFREMER LEAD NC, Noumea, New Caledonia
- 4FR3020 Fédération-Ile-de-France de Recherche sur l’Environnement (FIRE), CNRS, Sorbonne Université, Paris, France
- 5Laboratoire des Sciences du Climat et de l’Environnement, UMR CEA-CNRS-UVSQ et IPSL, Gif-sur-Yvette, France
The Seine river discharges over 700 Gg of carbon (C) every year into the sea mostly under the form of dissolved inorganic carbon (DIC) and emits 445 Gg under the form of carbon dioxide (CO2) to the atmosphere over its entire river network. The watershed, which drains 76,000 km2, is heavily populated with 18 106 inhabitants and is thus submitted to large anthropic pressure. The offline coupling of two Reactive Transport Models is used to understand the complex spatial and temporal dynamics of carbon, oxygen and nutrients and quantify the CO2 exchange at the air-water interface along the main axis of the river. The estuarine section of the Seine is simulated by the generic estuarine model C-GEM (for Carbon Generic Estuarine Model), while the upstream part of the network, devoid of tidal influence is simulated by the pyNuts-Riverstrahler modeling platform which also includes an explicit representation of the drainage network ecological functioning. Our simulations provide a process-based representation of nutrients, oxygen, total organic carbon (TOC) and the carbonate system (DIC and alkalinity) over the entire year 2010. Our coupled modeling chain allows quantifying the respective contributions of the estuarine and freshwater sections of the system in the removal of carbon as well as following the fate of TOC and DIC along the river network. Our results also allow calculating an integrated carbon budget of the Seine river network for year 2010.
Introduction
At the interface between the oceanic and terrestrial realms, rivers and estuaries transport ∼0.9 Pg⋅C (organic and inorganic) every year into coastal seas (Regnier et al., 2013a; Resplandy et al., 2018). Generally oversaturated in carbon dioxide (CO2) with respect to the atmosphere, these systems collectively further emit between 0.8 and 2.0 Pg⋅C every year into the air under the form of CO2 (Cai, 2011; Laruelle et al., 2013; Raymond et al., 2013; Regnier et al., 2013a; Lauerwald et al., 2015). Because of this significant role as carbon filters, rivers and estuaries are critical components of the Land-Ocean Aquatic Continuum (LOAC) and have been under growing scrutiny over the past decade (Cole et al., 2007; Battin et al., 2009; Bauer et al., 2013; Regnier et al., 2013a). However, large uncertainties are still currently associated to the quantification of global CO2 fluxes at the air-water interface in these systems, partly due to the scarcity of data available to constrain such global budgets and also due to the difficulty to derive reliable annual estimates of the CO2 exchange with the atmosphere at the system scale (Regnier et al., 2013b). For instance, the global outgassing of CO2 taking place in rivers have been estimated at 0.6 and 1.8 Pg⋅C⋅yr-1 only 2 years apart by Raymond et al. (2013) and Lauerwald et al. (2015), respectively, and the global outgassing of CO2 from estuaries has been successfully revised downward from 0.4 to 0.6 Pg⋅C⋅yr-1 (Abril and Borges, 2004; Borges, 2005; Borges et al., 2005; Chen and Borges, 2009) to 0.1–0.15 Pg⋅C⋅yr-1 over the past decade (Chen et al., 2013; Laruelle et al., 2013). Even at the scale of a single system, short scale spatial and temporal gradients (of the order of kilometers and days) cannot be captured by a realistic monitoring network. Moreover, the origin of the carbon outgassed [i.e., oversaturated waters in dissolved inorganic carbon (DIC) versus degradation of organic carbon] is also largely unknown in most systems. Spatially and temporally resolved numerical models are necessary to capture the CO2 dynamics at the air-water interface, both in time and space (Regnier et al., 2013b). In this context, reactive transport models (RTM) allow reproducing the changes in chemical species concentrations due to both transport and biogeochemical transformations, thus providing a mechanistic insight into the fate of chemical species of interest in riverine and estuarine environments (Volta et al., 2014, 2016a;Marescaux, 2018; Romero et al., 2018).
Here, the application to the Seine estuary-river system of the generic transport reactive model C-GEM (for Carbon Generic Estuarine Model, Volta et al., 2014) combined with pyNuts-Riverstrahler (Thieu et al., 2015; Raimonet et al., 2018) allows understanding the carbonate system dynamics in a well monitored and intensively studied system. Fully transient simulations over the entire year 2010 are performed to quantify the annually integrated CO2 exchange at the air-water interface and better understand the evolution over the year and along the estuarine-river continuum of the CO2 exchange with the atmosphere and organic carbon degradation as well as the longitudinal variations of inorganic to organic carbon ratio in response to anthropic pressures. 2010 was selected as a year representative of the average hydrology of the Seine river network both in terms of annually averaged water discharge and seasonal distribution of the flow (Marescaux et al., 2018). While Riverstrahler, and its simplistic derived application to the estuary, has been thoroughly validated for the Seine river over the years (Garnier et al., 2008, 2010), this integrated study is the first application of C-GEM to the Seine estuary. Moreover, the version of Riverstrahler used in our simulations includes a new biogeochemical module which explicitly resolves the complex carbonate system dynamics (Marescaux, 2018). This explicit representation of the organic (OC) and inorganic carbon (IC) cycles allows simulating and quantifying the different processes controlling the OC/IC ratio and the emission of CO2 into the atmosphere along the entire river network. Earlier modeling work in tidal estuaries using C-GEM alone evidenced the intense carbon processing taking place in the widest, marine part of estuaries (Regnier et al., 2013b; Volta et al., 2014, 2016a). The first integrated study presented here will allow further testing the hypothesis that the most downstream section of the river/estuarine system disproportionately contributes to the retention of carbon and CO2 outgassing at the scale of an entire river network. The first part of the results section thus consists of a validation of the hydrology of C-GEM in the estuarine section of the river domain. Then, the ability of both models to capture carbon, oxygen and nutrients dynamics is assessed over the year 2010. These simulations allow better understanding the fate of organic and inorganic carbon throughout the river network and the respective contributions of the different sections of this river network to the conversion of organic carbon into DIC and the outgassing of CO2 into the atmosphere. A comprehensive carbon budget is then assembled which allows quantifying the organic to inorganic carbon ratio in the different section of the Seine river network (i.e., the estuary, between Poses and Paris and upstream of Paris).
Materials and Methods
Study Area
The Seine river is the largest river flowing into the English Channel both in terms of nutrients, carbon loads and fresh water discharge. The river’s central part has a large urban area (the Paris conurbation: 12.4 M inhab), a very dense industrial network (40% of French industries) and the biggest wastewater treatment plant in Europe (The Seine Aval WWTP: 1.5 Mm3⋅d-1). Further downstream, the Rouen conurbation (0.4 M inhab) appears nowadays as a new pole of economic development, thus forming the “Grand Paris” (Attali, 2010) which steer urban sprawling along the Seine axis from Paris to the sea shore at Le Havre (Figure 1). The Seine watershed also supports intensive cropping activities with 57% of land devoted to intensive agriculture.
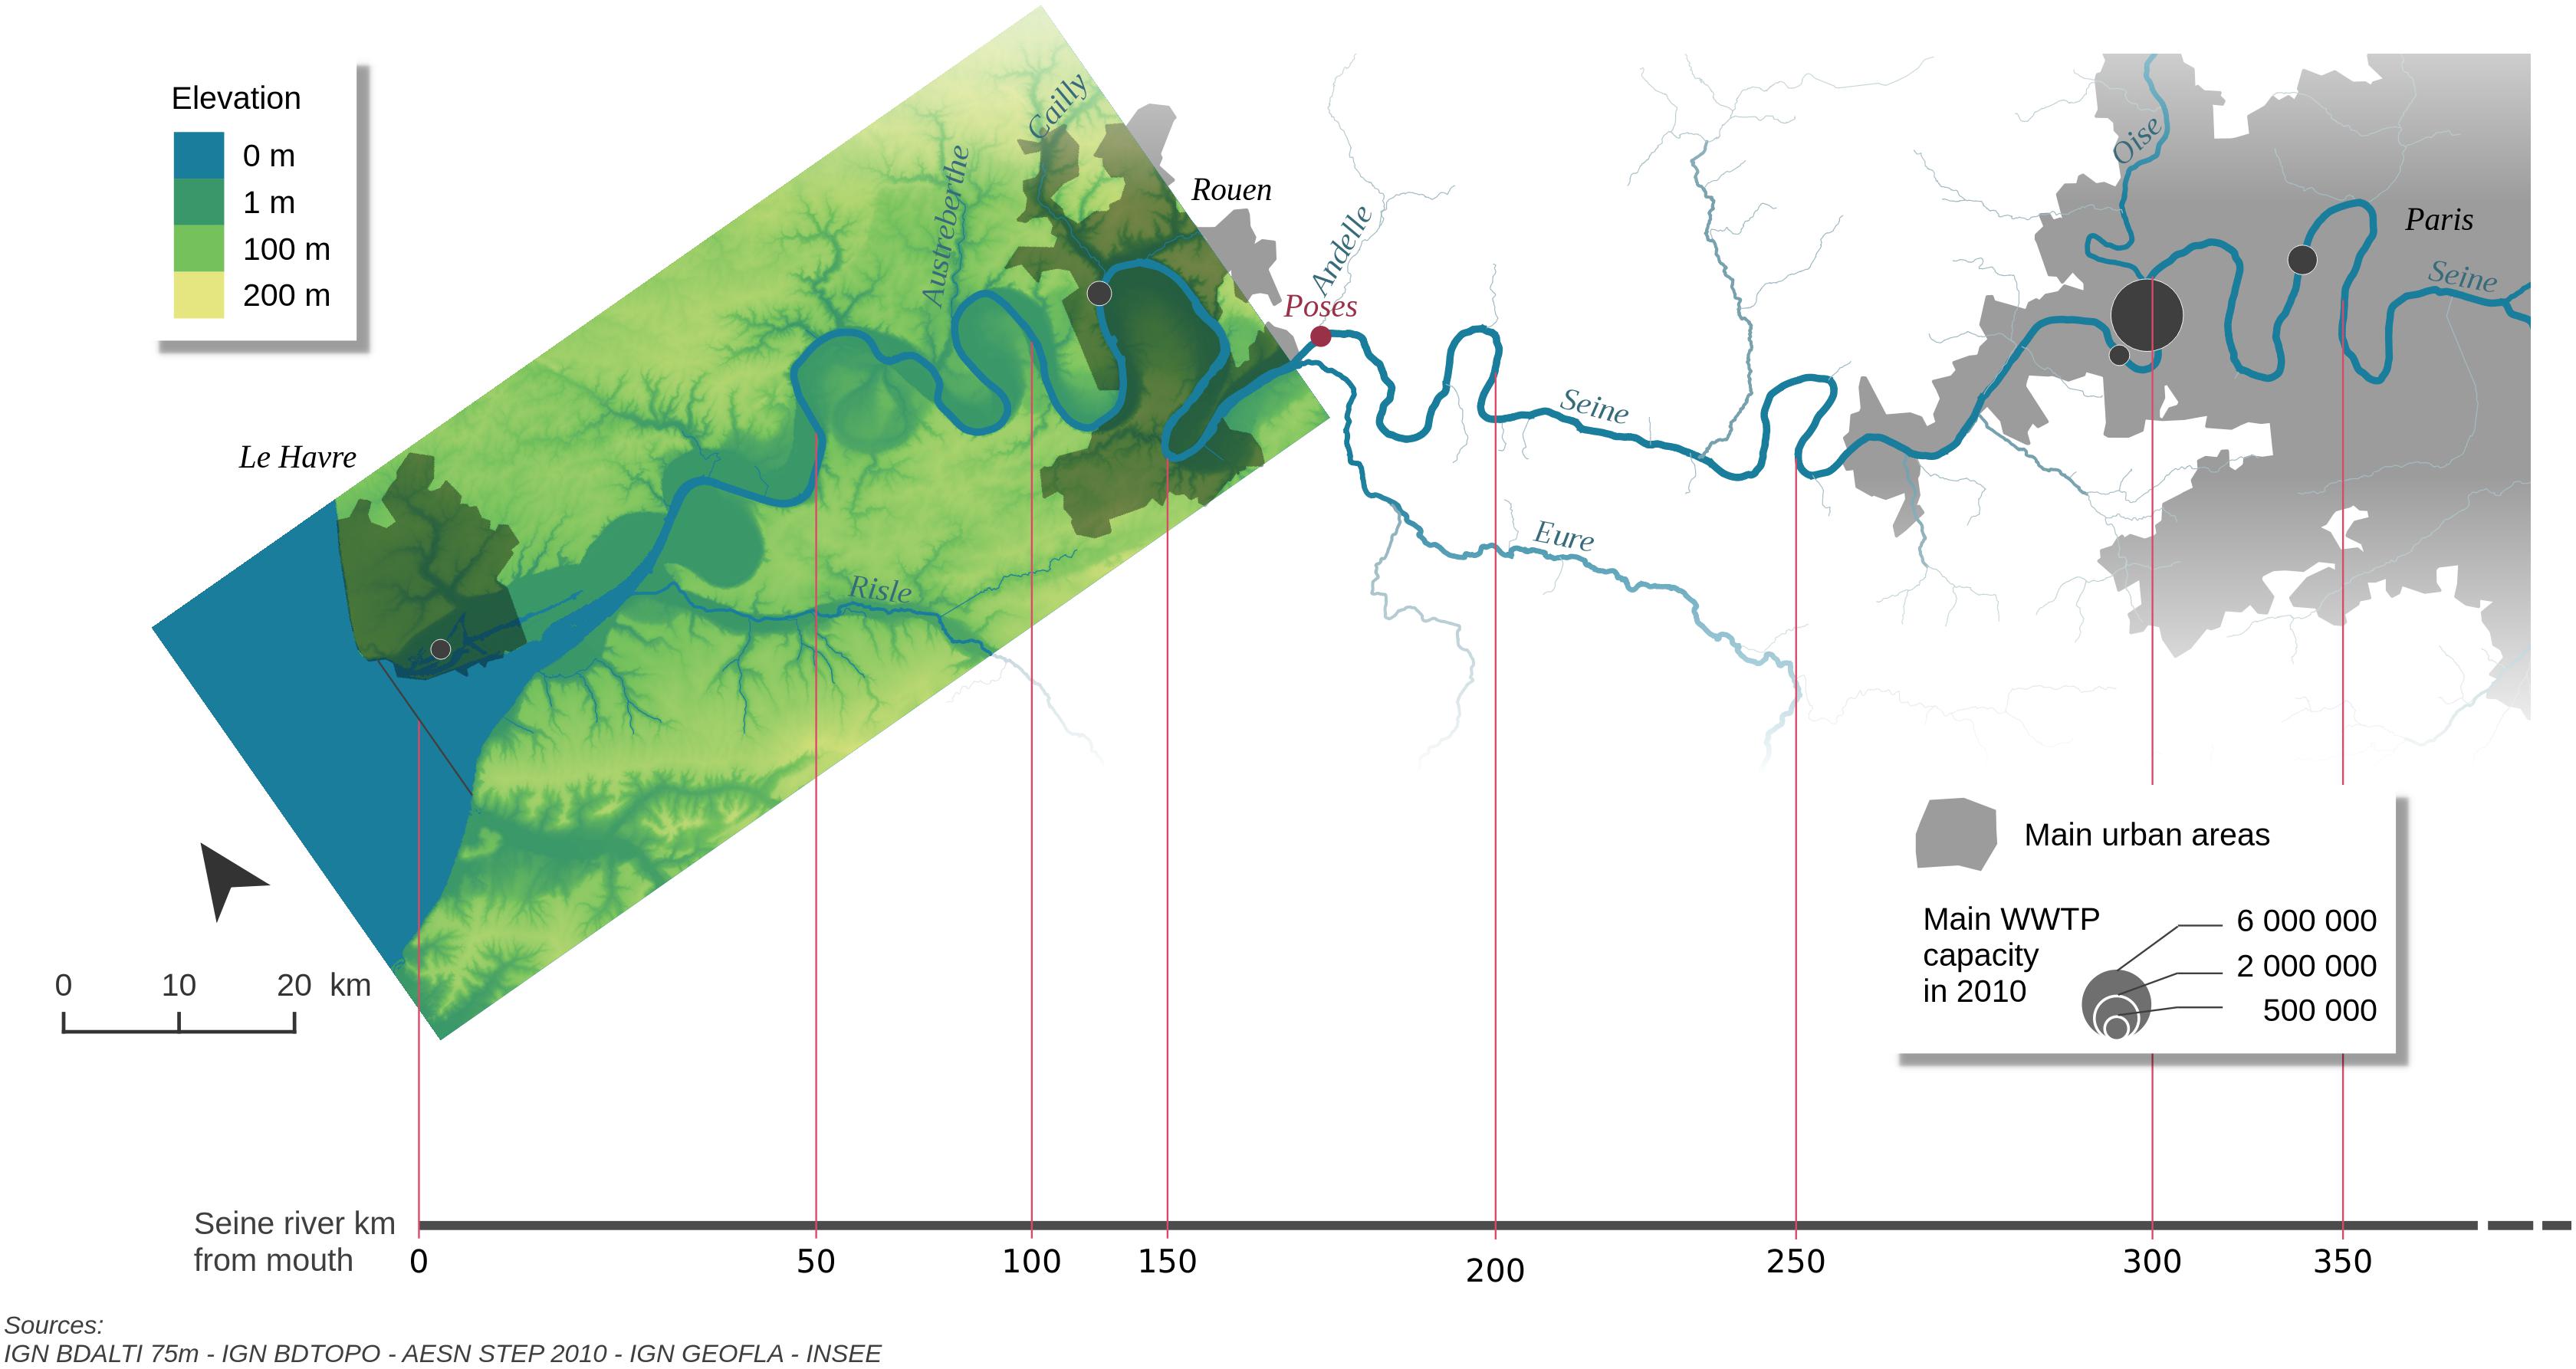
Figure 1. Map of the Seine Estuary (colored sector) and upstream river network including its main tributaries. The model extends upstream of Paris to the confluence with the Marne River.
The Seine estuary is characterized by tidal amplitudes comprised between 3 and 8 m at its mouth in Le Havre and a tidal penetration of 168 km up to a dam located at Poses (upstream area: 64,860 km2 which corresponds to 85% of the Seine watershed, Figure 1). At the estuarine mouth, the water discharge ranges from less than 200 m3⋅s-1 in summer to over 1,500 m3⋅s-1 under high waters conditions in winter with an average of 490 m3⋅s-1 over the 2010–2013 period (Marescaux et al., 2018). The annually average river discharge of 480 m3⋅s-1 for year 2010 is thus representative of an average hydrological year for this system. Our simulation domain includes the entire river network which is subdivided into three main areas: the estuary, simulated by C-GEM between Le Havre and Poses, the mid-section of the Seine between Poses and Paris and, finally all tributaries located upstream of Paris (Figure 1). Over this domain, the main axis of the Seine is fed by 3 major tributaries. The Eure (6,000 km2) and the Risle (2,300 km2) are both located within the extension of the tidal influence (16 and 152 km from the mouth of the estuary, respectively) while the Oise (17,000 km2) joins the main river 70 km downstream of Paris and delivers 20% of the freshwater of the entire system. In addition, a large WWTP located in Rouen (kilometer 116) discharges 76,000 m3⋅d-1 of treated effluents and significantly affects the biogeochemistry of the system.
Modeling Strategy
Our study relies on the off-line coupling of two transient, spatially discrete models: C-GEM and pyNuts-Riverstrahler. C-GEM is a recently developed generic estuarine model (Volta et al., 2014, 2016a) which has already been applied to several estuaries distributed along the coast of the North Atlantic Ocean (Volta et al., 2016b; Laruelle et al., 2017a) while the pyNuts-Riverstrahler platform is a well-established model coupling watersheds and river network (Billen et al., 1994; Garnier and Billen, 1994; Thieu et al., 2015). Simulations similar to those described in Marescaux (2018) are first performed with pyNuts-Riverstrahler for year 2010 over the entire Seine watershed. Then, the estuarine section of the main axis of the Seine river located between Poses (kilometer 168) and Le Havre (estuarine mouth, kilometer 0) is modeled by C-GEM using the outputs simulated by pyNuts-Riverstrahler at Poses as upstream boundary conditions. In addition, the several tributaries located downstream of Poses, which are also explicitly simulated by Riverstrahler are accounted for as point sources into C-GEM (the Risle, Austerberthe, Cailly, Andelle, and Eure Rivers, Figure 1). Downstream, C-GEM is constrained by modeling results from the ECO-MARS3D model at Le Havre (Romero et al., 2018). Both C-GEM and Riverstrahler include an explicit description of suspended particulate matter (SPM) which accounts for erosion and deposition processes as a function of the flow velocity. The explicit description of the SPM modules for C-GEM and Riverstrahler are described in Volta et al. (2014) and Billen et al. (2015, 2018), respectively.
Modeling Chain Description
C-GEM
Carbon Generic Estuarine Model is a generic depth-averaged one-dimensional reactive transport model designed to simulate estuarine hydrodynamics, transport and pelagic biogeochemistry of alluvial estuaries with relatively little data and computation demand. The hydrological module of C-GEM and underlying hypothesis are extensively described in Volta et al. (2014) and the biogeochemical reaction network used in the present study is presented as in Volta et al. (2016a). The model combines a set of algorithms for advection and dispersive transport of solids and solutes and mixes multi-component biogeochemical reactions with a 1-D hydrodynamic description. The C-GEM hydrodynamic module requires specification of the river discharge and the tidal amplitude at the estuarine mouth, and is supported by a simplified representation of the estuarine geometry. This geometry is adequate to describe the shape of tidal estuaries (Savenije, 1992, 2012; Volta et al., 2014) and only requires the implementation of a limited number of geometrical parameters (Table 1), such as the estuarine length and depth, as well as the channel width (B0) at both marine and land limits. In the particular case of the Seine estuary, two convergence lengths (CL) were used to best represent the observed width profile of the system (Figure 2A). Over the first 32 km of the estuary, B0 = 10,000 m and CL = 10,700 m. From this point forward and until Poses, the width was calculated using B0 = 480 m and CL = 105,500 m. The depth profile was approximated by a regular increase from 4.8 m at the mouth to 6.8 m 152 km upstream (i.e., Caudebec) followed by a linear decrease to 2.3 m at the end of the tidal influence at kilometer 168 (Figure 2B). The use of relatively simple representations of the depth profile was proven sufficient to reproduce the hydrodynamics and transport of several tidal estuaries with C-GEM in previous studies (Scheldt and Elbe Estuaries in Volta et al., 2016b and Delaware Bay in Laruelle et al., 2017a for instance).
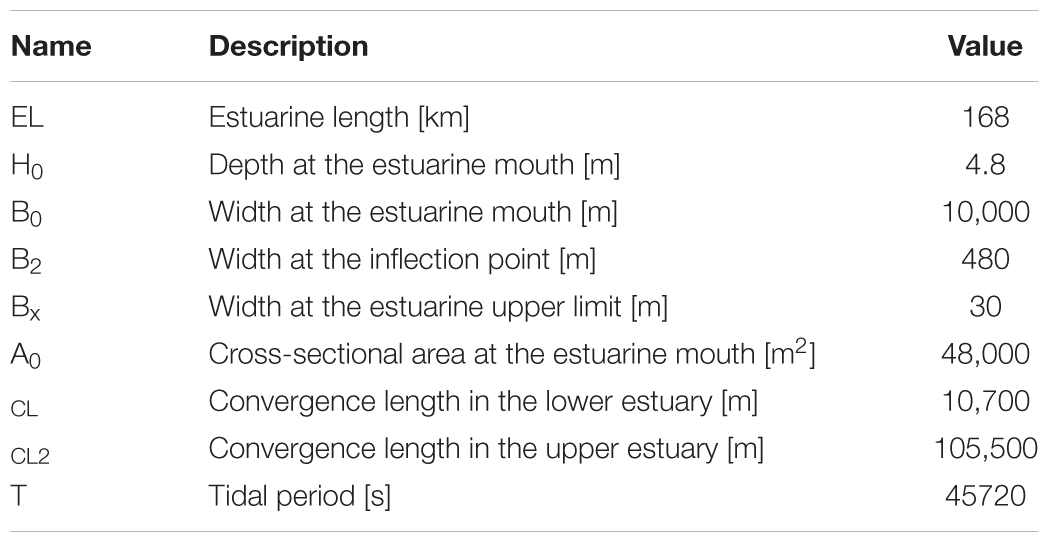
Table 1. Geometrical and hydrodynamic parameters in the idealized geometry of the Seine estuary.
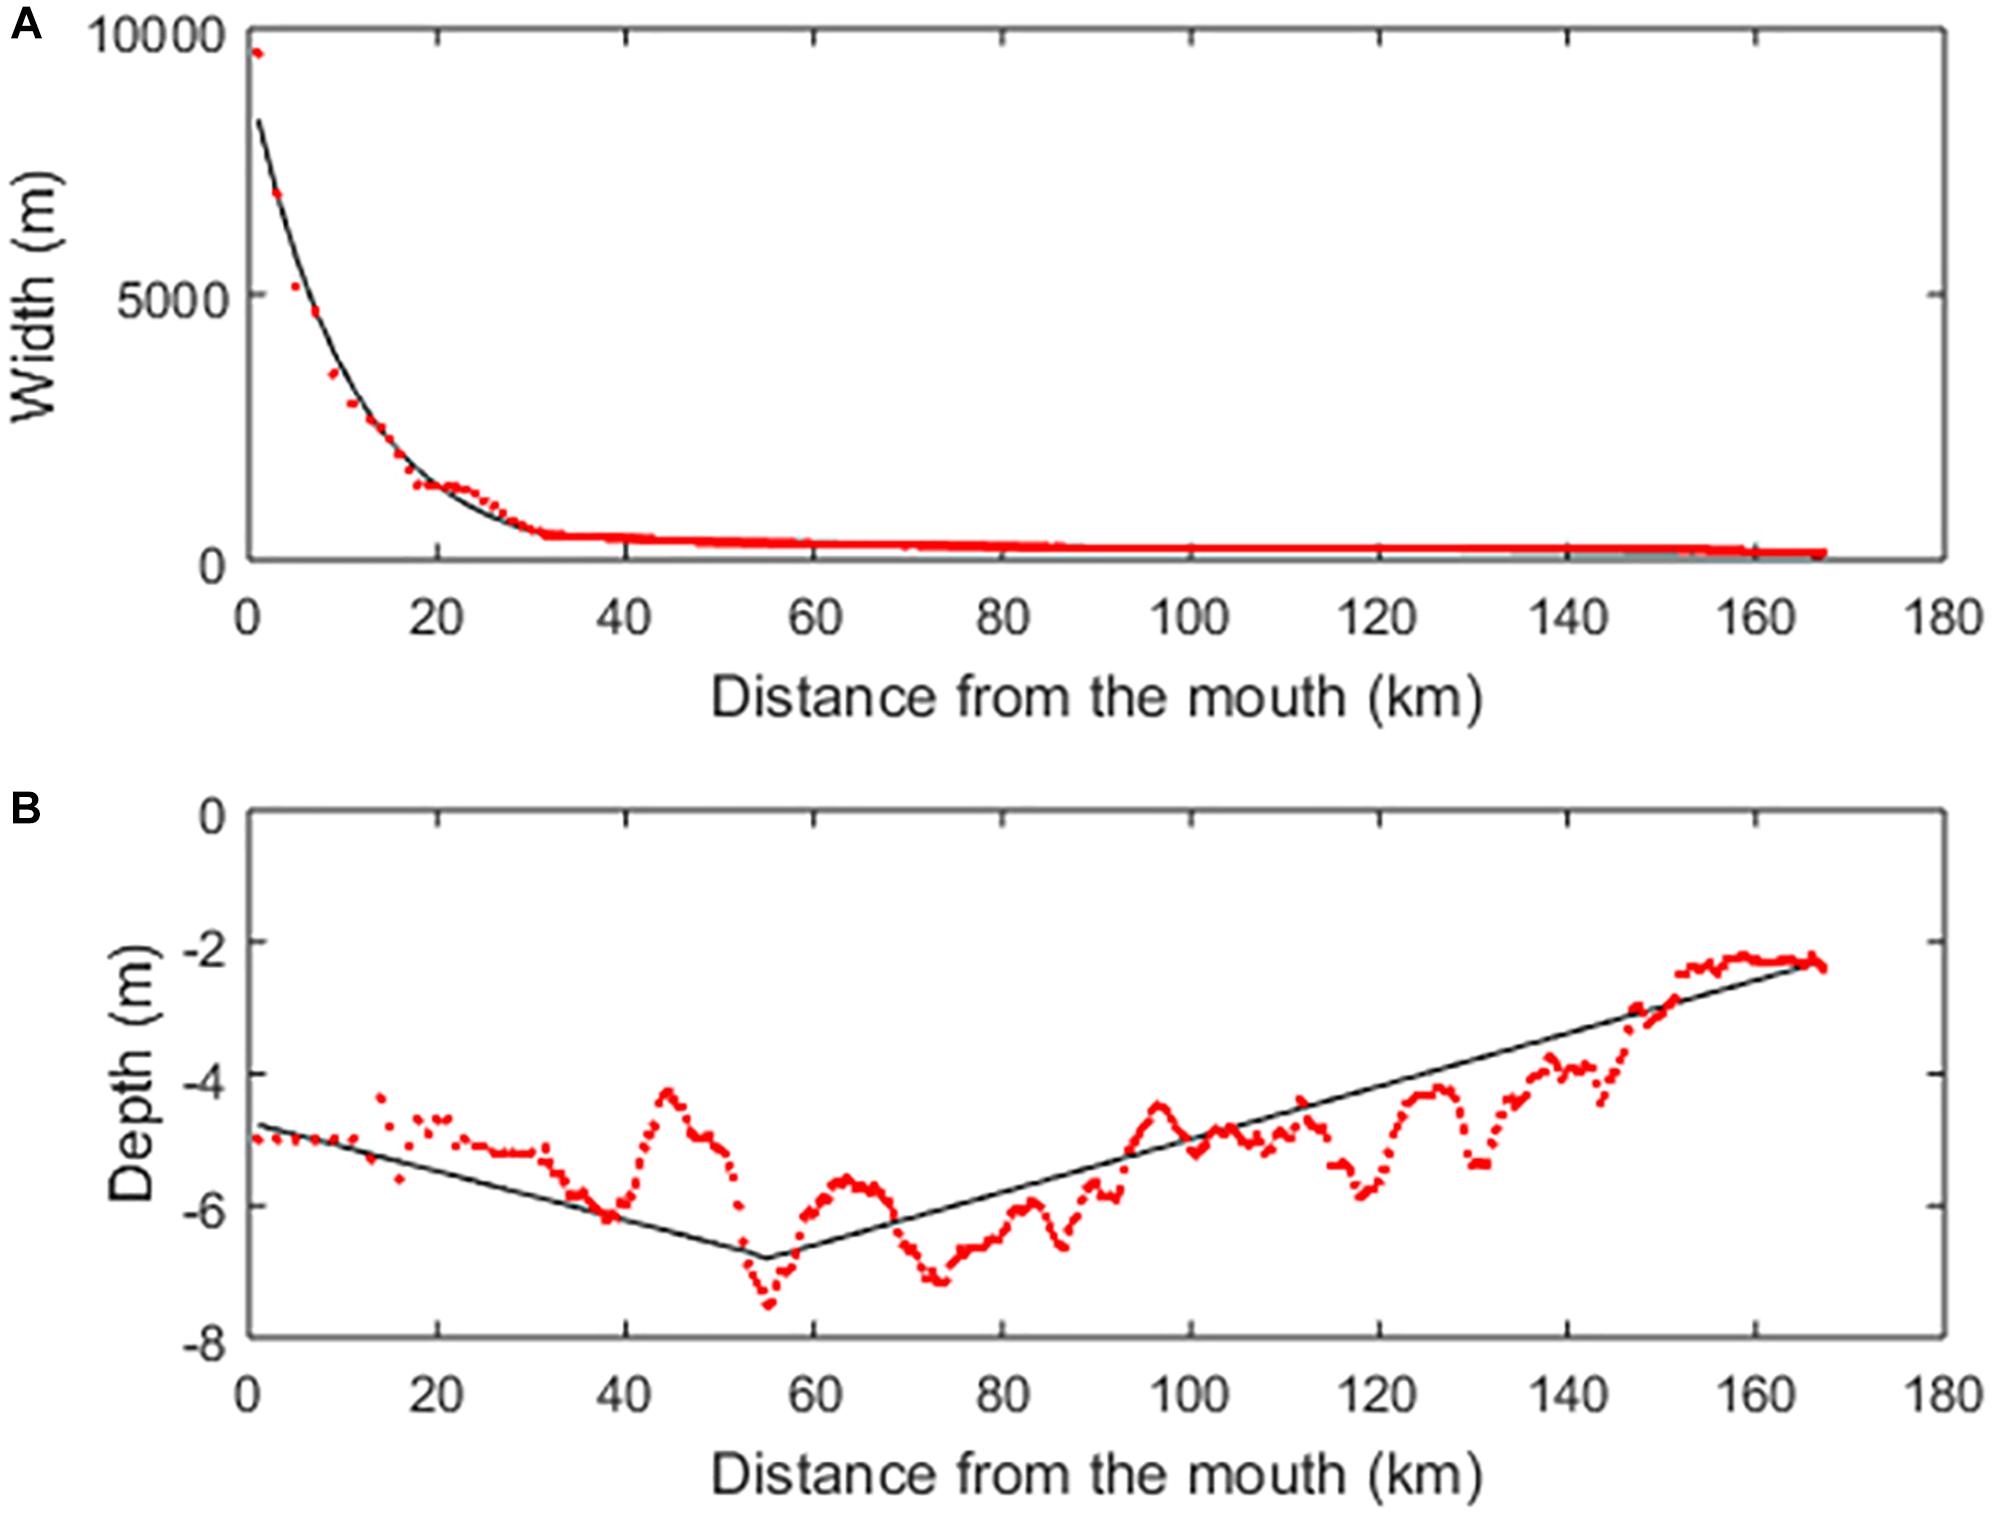
Figure 2. (A) Width and (B) depth profiles of the Seine estuary from its mouth to Poses. Red dots correspond to observations while black lines correspond to the values used to constrain C-GEM’s geometry.
pyNuts-Riverstrahler
pyNuts-Riverstrahler is a modeling environment written in python (the “py” prefix), setting up the Riverstrahler generic model of water quality for describing the cycling of carbon and nutrients (“Nuts” suffix) in large river systems (Billen et al., 2015, 2018; Raimonet et al., 2018). Biogeochemical processes are simulated within the water column (assumed perfectly mixed), at the water-atmosphere interface (for gaseous variables), at the interface with benthic sediments (see Billen et al., 2015), and at the interface with terrestrial part of the watershed, namely the riparian zone (see Billen et al., 2018).
It allows simulating seasonal (with a 10 days period resolution) and spatial (with a kilometric resolution) variations in the drainage network from small perennial streams to larger stem. The pyNuts-Riverstrahler covers the entire drainage network, and requires as inputs a spatially explicit knowledge of agricultural diffuse sources and urban point sources, as far as constraints imposed by the morphology of the rivers, weather and climate, thus forming the upstream limit conditions of the river model.
The genericity of the Riverstrahler model has been demonstrated throughout successful applications to contrasted fluvial basins, from temperate climate including (among other) the Moselle (Garnier et al., 2000), the Danube (Garnier et al., 2002), the Scheldt (Thieu et al., 2009) among other, sub-tropical climate as the Red River (Le et al., 2014) or the Nam Kan river (Causse et al., 2015) and or under nordic climate, such as the Kalix and Lule rivers (Sferratore et al., 2008) and the Seine river (Raimonet et al., 2018). The Riverstrahler model has also been chained with the coastal marine model (ECO-MARS3D, Cugier et al., 2005), extended to the estuarine part in terms of hydrosedimentary representation (Passy et al., 2016), and with nutrient description (Romero et al., 2018). The development of the pyNuts modeling environment has made it possible, with the same intention, to develop continental applications of the Riverstrahler to multiple hydrosystems on an entire marine façade in Western Europe (Desmit et al., 2018).
Biogeochemical Description
The biogeochemical modules of C-GEM and pyNuts-Riverstrahler include similar key state variables and processes in spite of a greater level of complexity of Riverstrahler’s reaction network (Figure 3). Both models include an explicit description of all nutrients (nitrate, ammonium, phosphates, and dissolved silica), dissolved oxygen, phytoplankton and a representation of the carbonate system. C-GEM only simulates diatoms and non-diatoms, while pyNuts-Riverstrahler described biogeochemical cycles including their interactions with biological compartments, including three functional phytoplankton groups (diatoms, Chlorophyceae, and Cyanobacteria), zooplankton (rotifers and microcrustaceans) and heterotrophic bacteria (small autochthonous and large allochthonous) as well as nitrifying bacteria. The most significant difference between both models regards the benthic compartment which is ignored in the current version of C-GEM while pyNuts-Riverstrahler explicitly takes into account a benthic module (recently updated: Billen et al., 2015) simulating exchanges with the water column for several variables (benthic organic matter, inorganic particulate phosphorus, benthic biogenic silica). The lack of benthos in C-GEM is implicitly compensated by the assumption that, in the estuary, denitrification especially occurs in the turbidity maximum zone within the water column. Both models use invariant parameterization within their respective simulation domain thus assuming homogeneity of the physiological properties of organisms along the river network (Garnier et al., 2002) but use different parametrizations between the riverine and estuarine sections of the Seine. pyNuts-Riverstrahler have been extensively validated for the Seine river and the set-up used for the current study is identical to that described in extenso in Marescaux (2018). C-GEM relies on a generic parametrization derived from a large collection of modeling studies performed on temperate estuaries (Volta et al., 2016b). Several modifications to this generic estuarine parameterization were implemented during the calibration stage (namely, the rate of aerobic degradation of organic matter which was increased from 6.08 10-4 to 1.2 10-3 μMC⋅s-1, the half-saturation constant for TOC degradation which was decreased from 183 to 100 μMC and the nitrification rate which was increased from 2.73 10-5 to 5 10-4 μMN⋅s-1) but these calibration values all fall with ranges reported by the literature survey of Volta et al. (2016b).
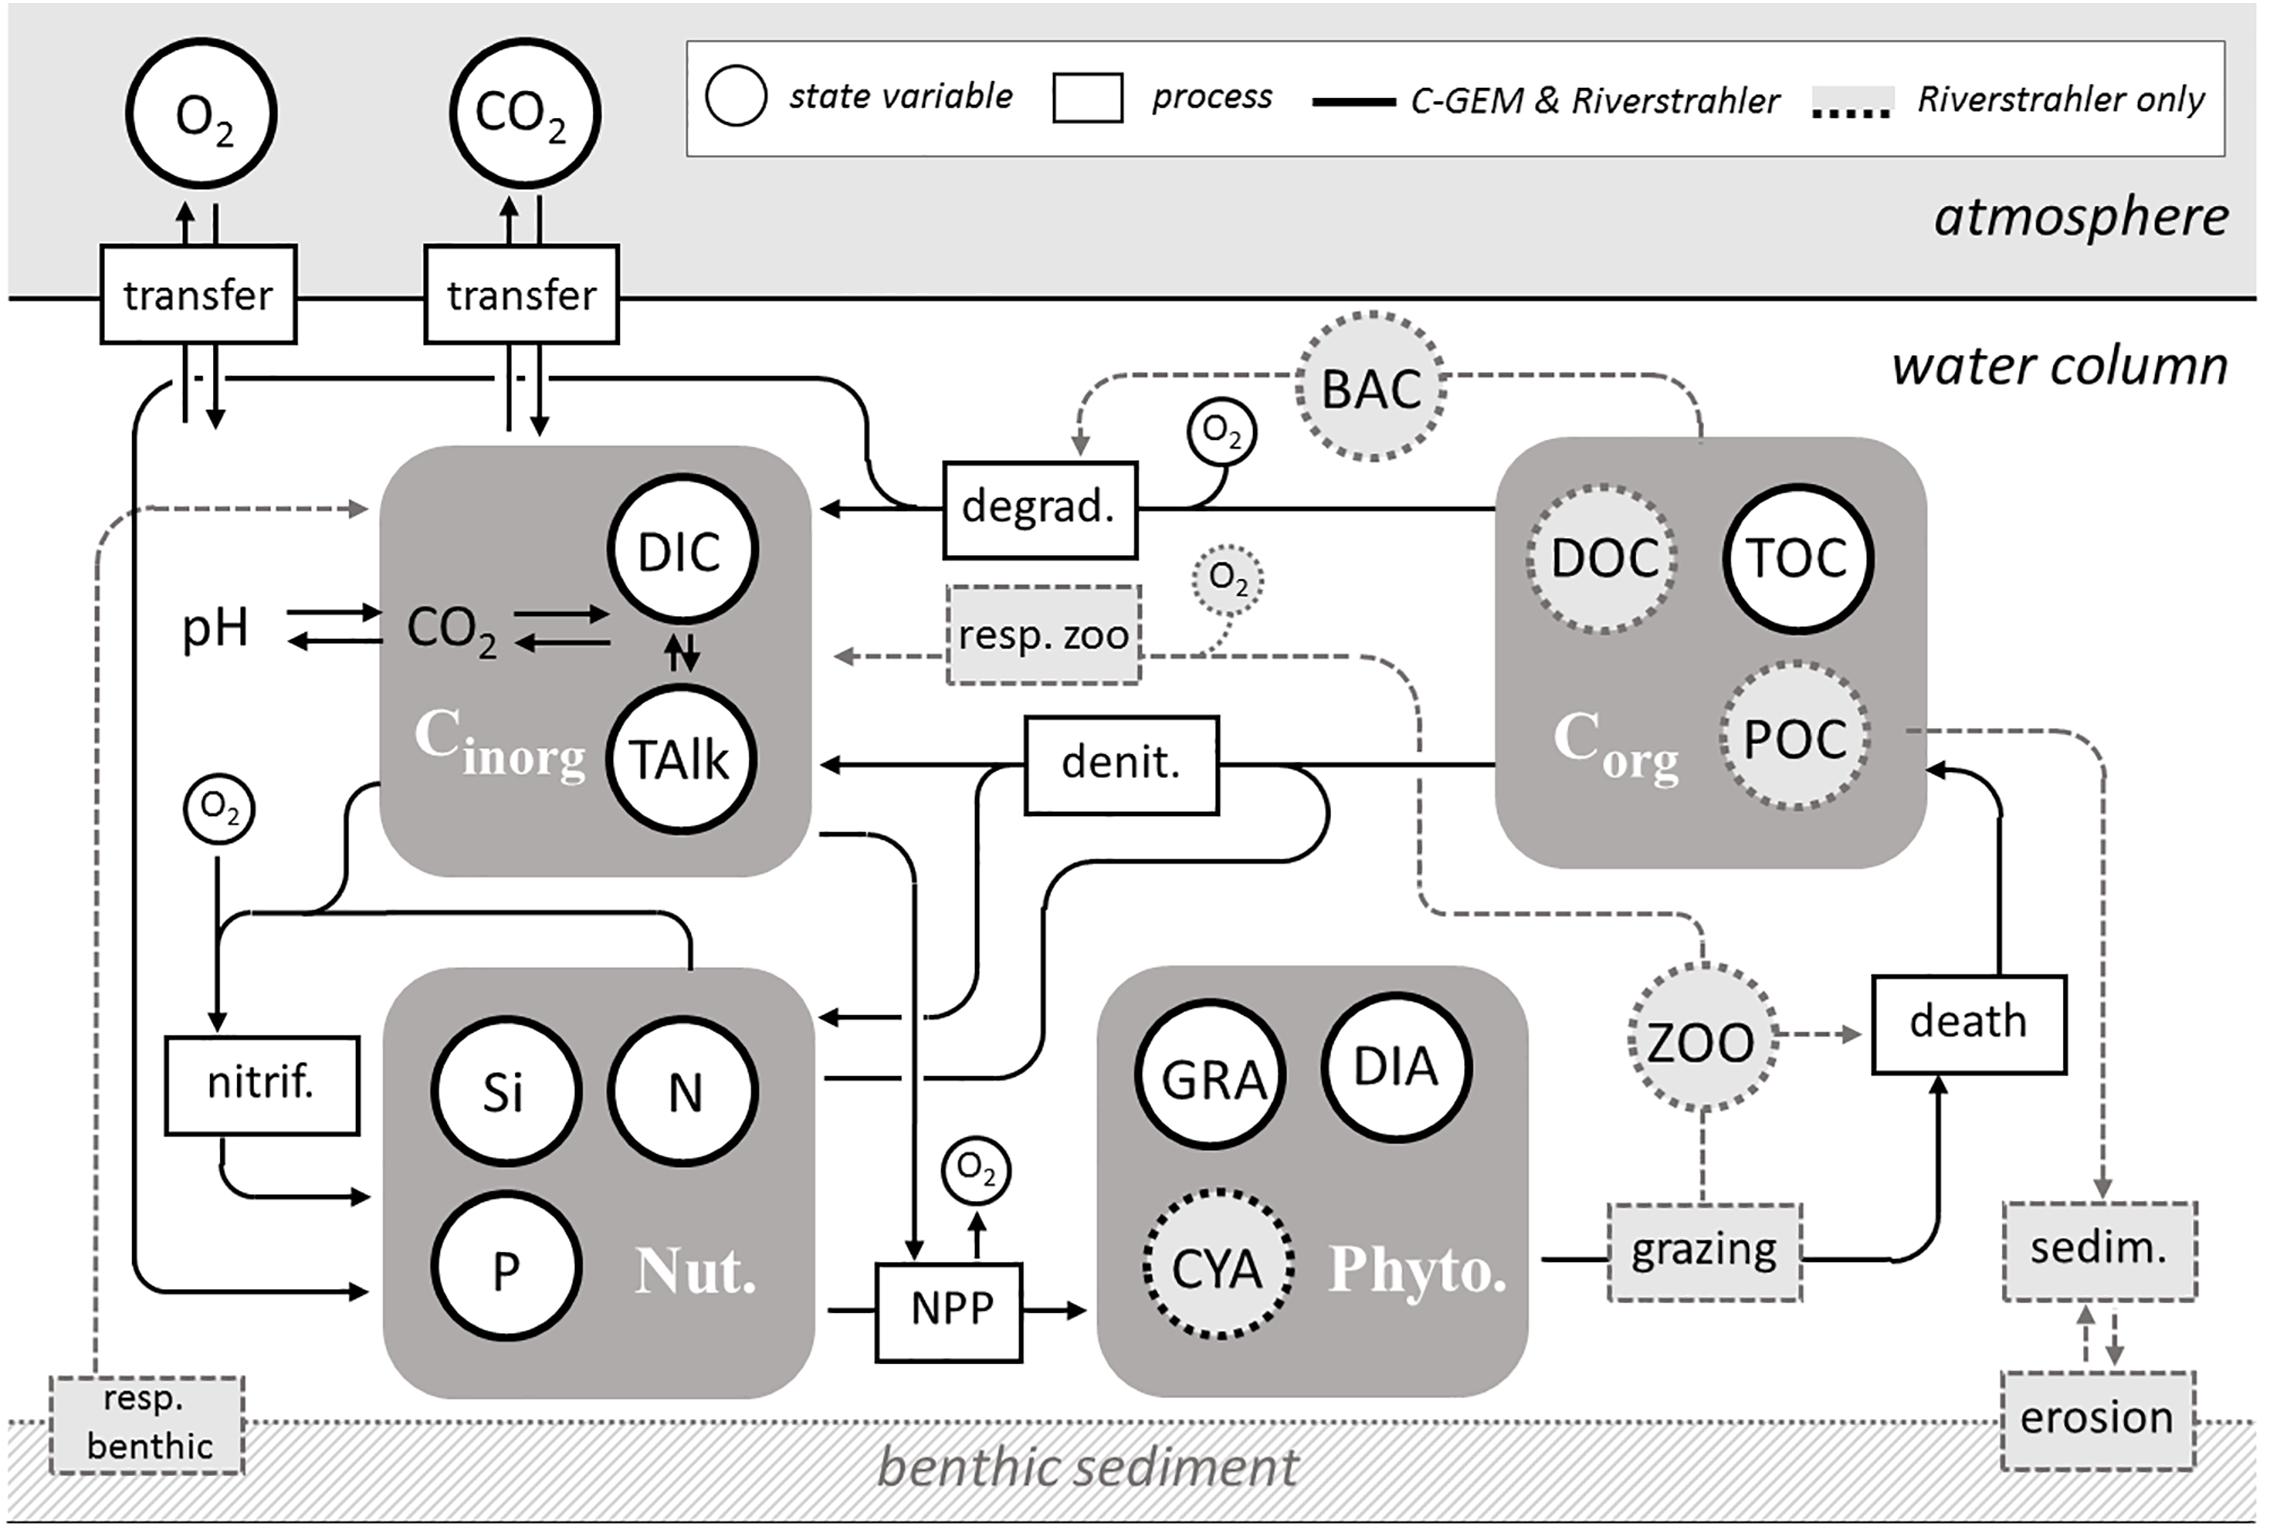
Figure 3. Simplified conceptual scheme of the shared state variables and processes between C-GEM and Riverstrahler models. The two models simulate nutrients as N (NO3, NH4), P (PO4, Total P), Si (DSi, BSi in Riverstrahler only). In the Riverstrahler, both dissolved (DOC) and particulate (POC) carbon are modeled according to three classes of degradability (rapid, slow, and refractory); heterotrophic bacteria (BAC) are described as large and small, and the zooplankton (ZOO) includes micro-crustaceans and rotifers-ciliates.
Finally, both models include similar inorganic carbon module, which allows quantifying the estuarine inorganic carbon dynamics. The latter is a recent development of pyNuts-Riverstrahler described in extenso in Marescaux (2018) while its implementation in C-GEM is described in Volta et al. (2014) and derived from Arndt et al. (2011). In both models pH is the main variable controlling the estimation of dissolution and hydration of CO2. Its computation follows numerical schemes provided by Culberson (1980, for pyNuts-Riverstrahler) and Follows et al. (2006, for C-GEM) using iterative procedures, which accounts for total (TAlk) and carbonate alkalinities. While the model accounts for borate species, contributions from ammonium, fluorine, phosphate, silicate, sulfide and other minor species are neglected because their concentrations are much lower than those of carbonate species (Vanderborght et al., 2002). In the estuarine model (C-GEM), the apparent equilibrium constants for CO2 solubility and dissociation of water (H2O), carbonic acid (H2CO3), bicarbonate (HCO3-), and boric acid [B(OH)-4] are functions of temperature and salinity following equations described in Dickson et al. (1992) and Cai and Wang (1998). In the riverine model, the influence of boric acid is not taken into account as it can generally be neglected in freshwaters (Emiroglu et al., 2010).
Simulations Set-Up
Numerical Schemes
The C-GEM calculations for transport and reaction are solved in sequence by applying an operator splitting approach (Regnier et al., 1998; Regnier and Steefel, 1999) and a finite difference scheme of a regular grid (Δx = 2,000 m) with a time step Δt = 150 s. The reaction network is formulated and numerically resolved as described in Volta et al. (2014). Each simulation begins with a spin-up period of 2 months using the boundary conditions and forcing of the first tidal cycle, which ensures that the system reaches steady-state conditions.
pyNuts-Riverstrahler calculations are based on a Lagrangian description of carbon and nutrient transformation along the drainage network (idealized as a regular scheme of confluences) taking into account sources and/or dilution by lateral water from direct watersheds and assuming permanent hydrological conditions every 10 days-period. Biogeochemical processes simulated are incremented according to the residence time of the water masses with a 6 min time step. Climatic constraints such as light and temperature are described with daily variations, while both point and diffuse sources concentrations are averaged over the simulated year.
Carbon Generic Estuarine Model uses the outputs of Riverstrahler as upstream boundary conditions for phytoplankton concentrations, nutrients, organic and inorganic carbon, SPM, as well as water discharge. The following section describes the specifics of the coupling between both models for each state variable and described the other forcing required to perform the simulations.
Model Coupling and Boundary Conditions
Carbon Generic Estuarine Model requires to be forced with a set of boundary conditions upstream and downstream. These include concentrations for all state-variables of the model and time series for water elevation at the marine boundary as well as fresh water discharge at the riverine boundary. Most of these data are provided by outputs of the ECO-MARS3D model (Romero et al., 2018) at the downstream boundary and by Riverstrahler at the upstream boundary (Table 2). Downstream, all required inputs were available at a 1 h temporal resolution, which allows capturing the tidal cycle. For each state variable, the concentration used as boundary condition was calculated by averaging in width and depth the concentrations extracted from ECO-MARS3D along a North–South transect interception the estuarine mouth at the longitude of 0.1°E. The only state variables not provided by ECO-MARS3D were DIC and TAlk. The latter was thus extracted from a recent global monthly climatology for oceanic alkalinity (Broullón et al., 2018). Monthly values for DIC were then calculated, using CO2SYS (van Heuven et al., 2011) from these TAlk values and monthly pCO2 estimates extracted from the global coastal pCO2 climatology of Laruelle et al. (2017b).
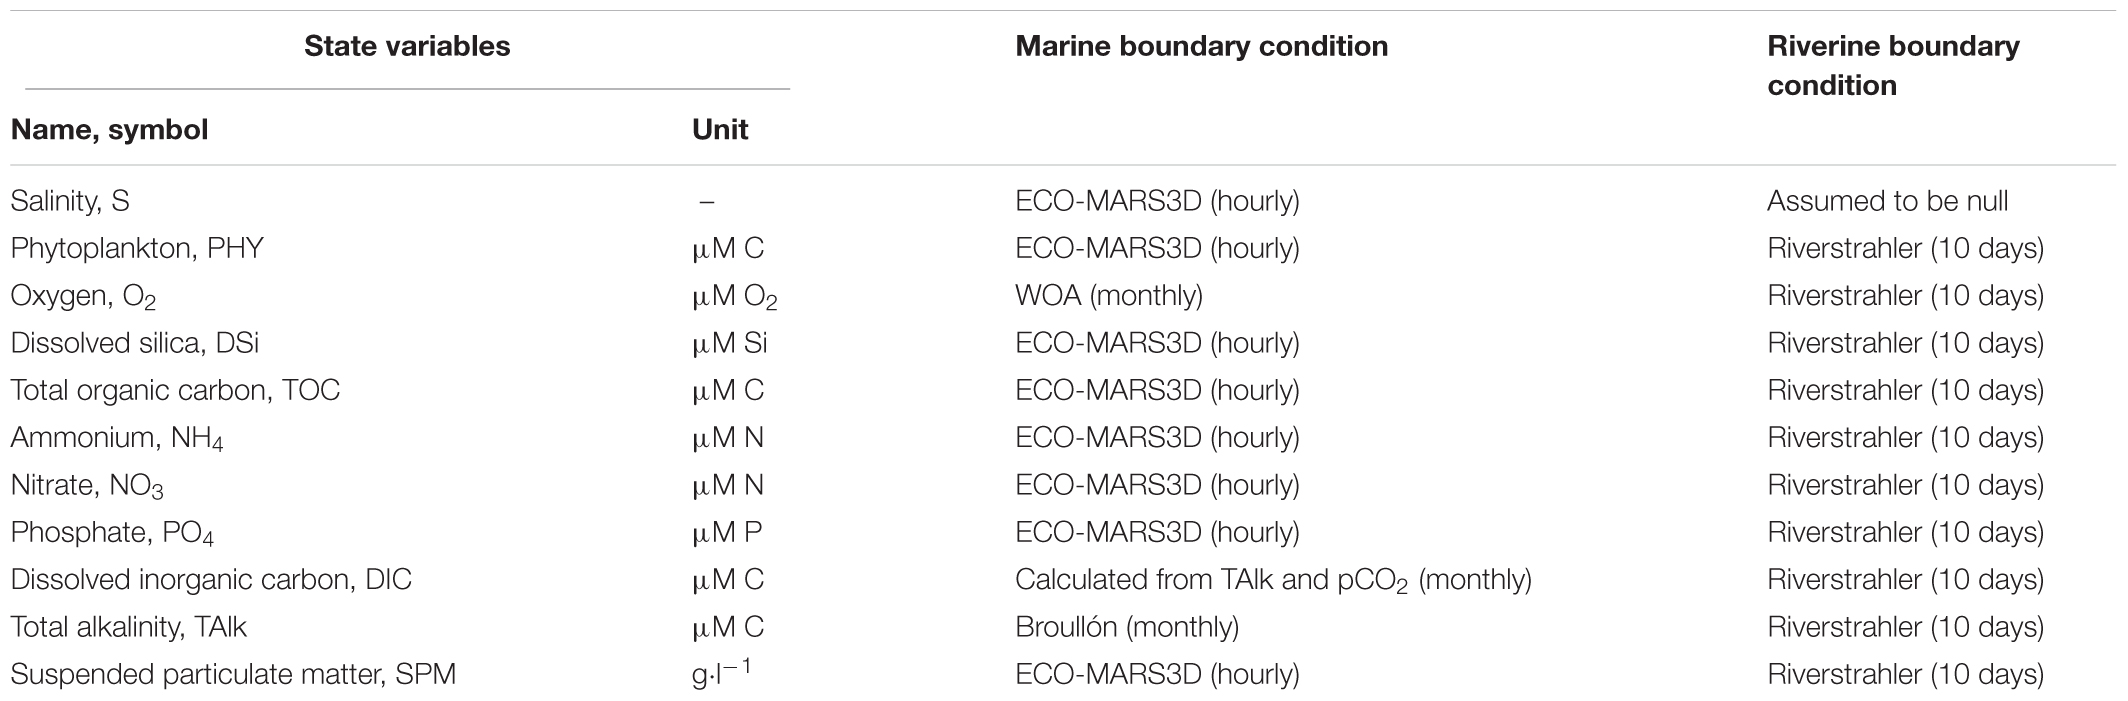
Table 2. State variables of C-GEM and boundary conditions.
At the upstream boundary condition, all state variables required to run C-GEM were provided by the outputs of Riverstrahler at Poses (kilometer 168) at a temporal resolution of 10 days except for salinity which was assumed to be null. Linear interpolations were performed to generate continuous values for each calculation time-step in C-GEM. Five tributaries connecting the main axis of the Seine river downstream of Poses were also taken into account as point sources following the procedure described in Volta et al. (2014, 2016a): the Risle, the Austreberthe, the Cailly, the Eure and the Andelle are, respectively, injected at 16, 88, 124, 152, and 166 km away from the estuarine mouth, and the effluents of the Rouen conurbation injected at kilometer 111 (Figure 1).
Results
C-GEM Model Validation
Hydrodynamics and Transport
The performance of the hydrodynamics module was first evaluated through a series of steady state simulations under varying discharge and tidal conditions (Figure 4). A set of six increasing tidal amplitudes from 3.1 to 7.7 m were applied at the marine boundary. The selected range of tidal amplitudes at the mouth corresponds to six tidal coefficients (C35, C45, C65, C80, C95, and C115) on a scale ranging from 20 to 120. The smallest (C35) and largest tidal coefficients (C115) represent extreme spring and neap tides, respectively. Two values of fresh water discharges were applied at the riverine boundary condition. The lowest value (250 m3⋅s-1) is roughly equivalent to summer moderate regime conditions while the highest value (800 m3⋅s-1) is equivalent to a moderately high water regime at Poses (based on long term discharge chronicle available in the Banque Hydro database1). The longitudinal profile of the tidal amplitude under the 12 possible combinations of the tidal amplitude and water discharge was compared to average profiles derived, for similar conditions, from observations collected by 18 tidal gauging stations located along the estuarine length provided by the ‘Grand Port Maritime de Rouen’ (Figure 4). The match between both models is very good under all conditions with average RMSE < 30 cm over the entire profile and in particularly good agreement under average conditions (i.e., tidal amplitudes at the mouth comprised between 4 and 7 m, Figures 4C–H).
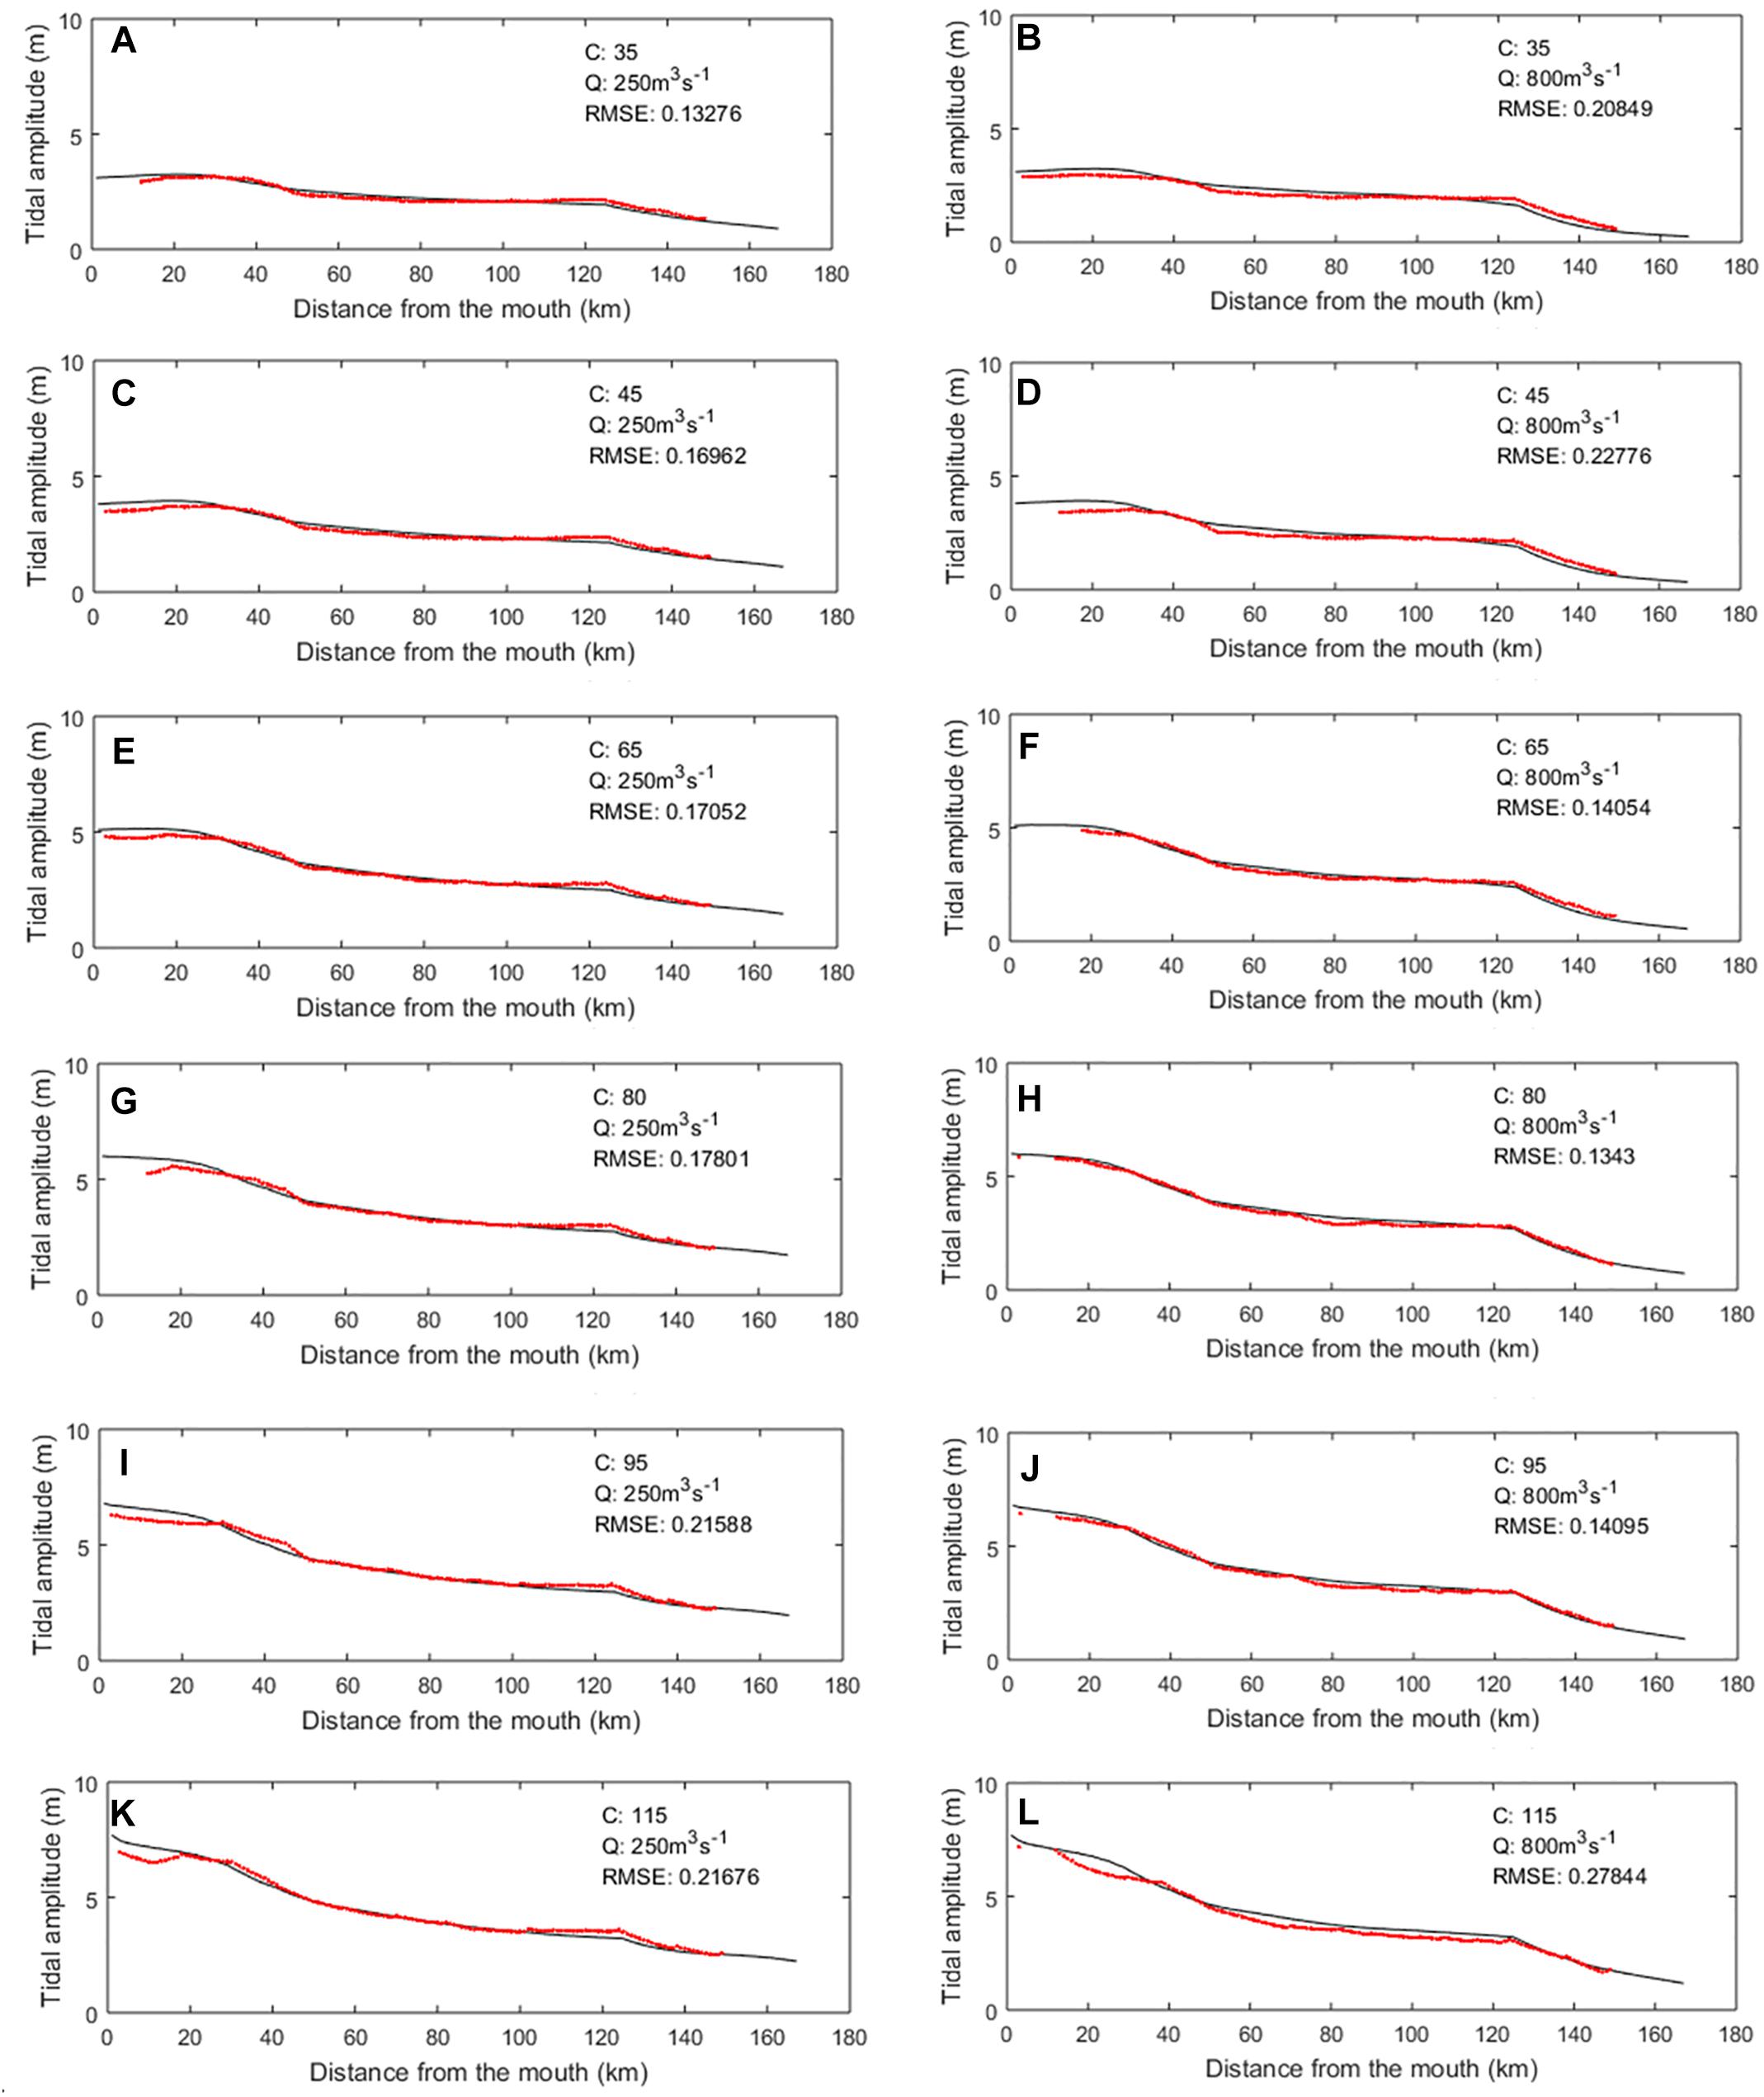
Figure 4. Simulated tidal amplitude profiles along the Seine estuary under varying discharges (Q) and tidal coefficients (C). The black lines are simulated by C-GEM while the red dots correspond to averaged profiles based on long term discharge chronicles. Panels (A–L) correspond to different combinations of values of Q and C.
The propagation of the tidal amplitude along the estuary is characterized by a gradual decrease of the tidal amplitude throughout the first 50 km of the estuary followed by a 70 km long section within which the tidal amplitude decreases at a slower rate. For any given tidal amplitude at the mouth, profiles under high and low water discharges are relatively similar until kilometer 120. After this point, the tidal amplitude decreases sharply in all simulations, as water depth reaches 4 m, to only about 1 m by kilometer 150 under high discharge and 2 m under low water discharge. The tidal propagation is stopped by a dam at Poses and the river is devoid of tidal influence upstream of this limit. Note that, because of the significant fluvial traffic in the Seine, the water discharge is regulated at Poses thus preventing extreme fresh water flows that could significantly modify the salt water and tidal intrusion in the estuary.
A transient simulation was performed with the full hydrodynamics and transport modules over the entire year 2010. Because of its relatively short convergence length compared to its width at the mouth, the Seine estuary is marine-dominated, which translates into a relatively short saline intrusion (Savenije, 2012). In our simulations, salinity never exceeds 1 further than 30 km upstream. A limited number of measurements in the downstream portion of the estuary at stations Honfleur (kilometer 16) and Tancarville (kilometer 32) only allows assessing performances of the model against field data under the form of longitudinal salinity profile. Figure 5 (left panels) presents six such longitudinal profiles reconstructed for the year 2010. These profiles reveal that observations always fall within the range reported by the model over a full tidal cycle but also that the magnitude of the salinity change between kilometers 10 and 20 is usually quite large. Also, our simulations reveal that the extension of the salinity intrusion is always comprised between 20 and 30 km from the estuarine mouth regardless of the tidal or freshwater discharge conditions, which is consistent with observations (Morelle, 2017) and previous modeling studies (Grasso et al., 2018).
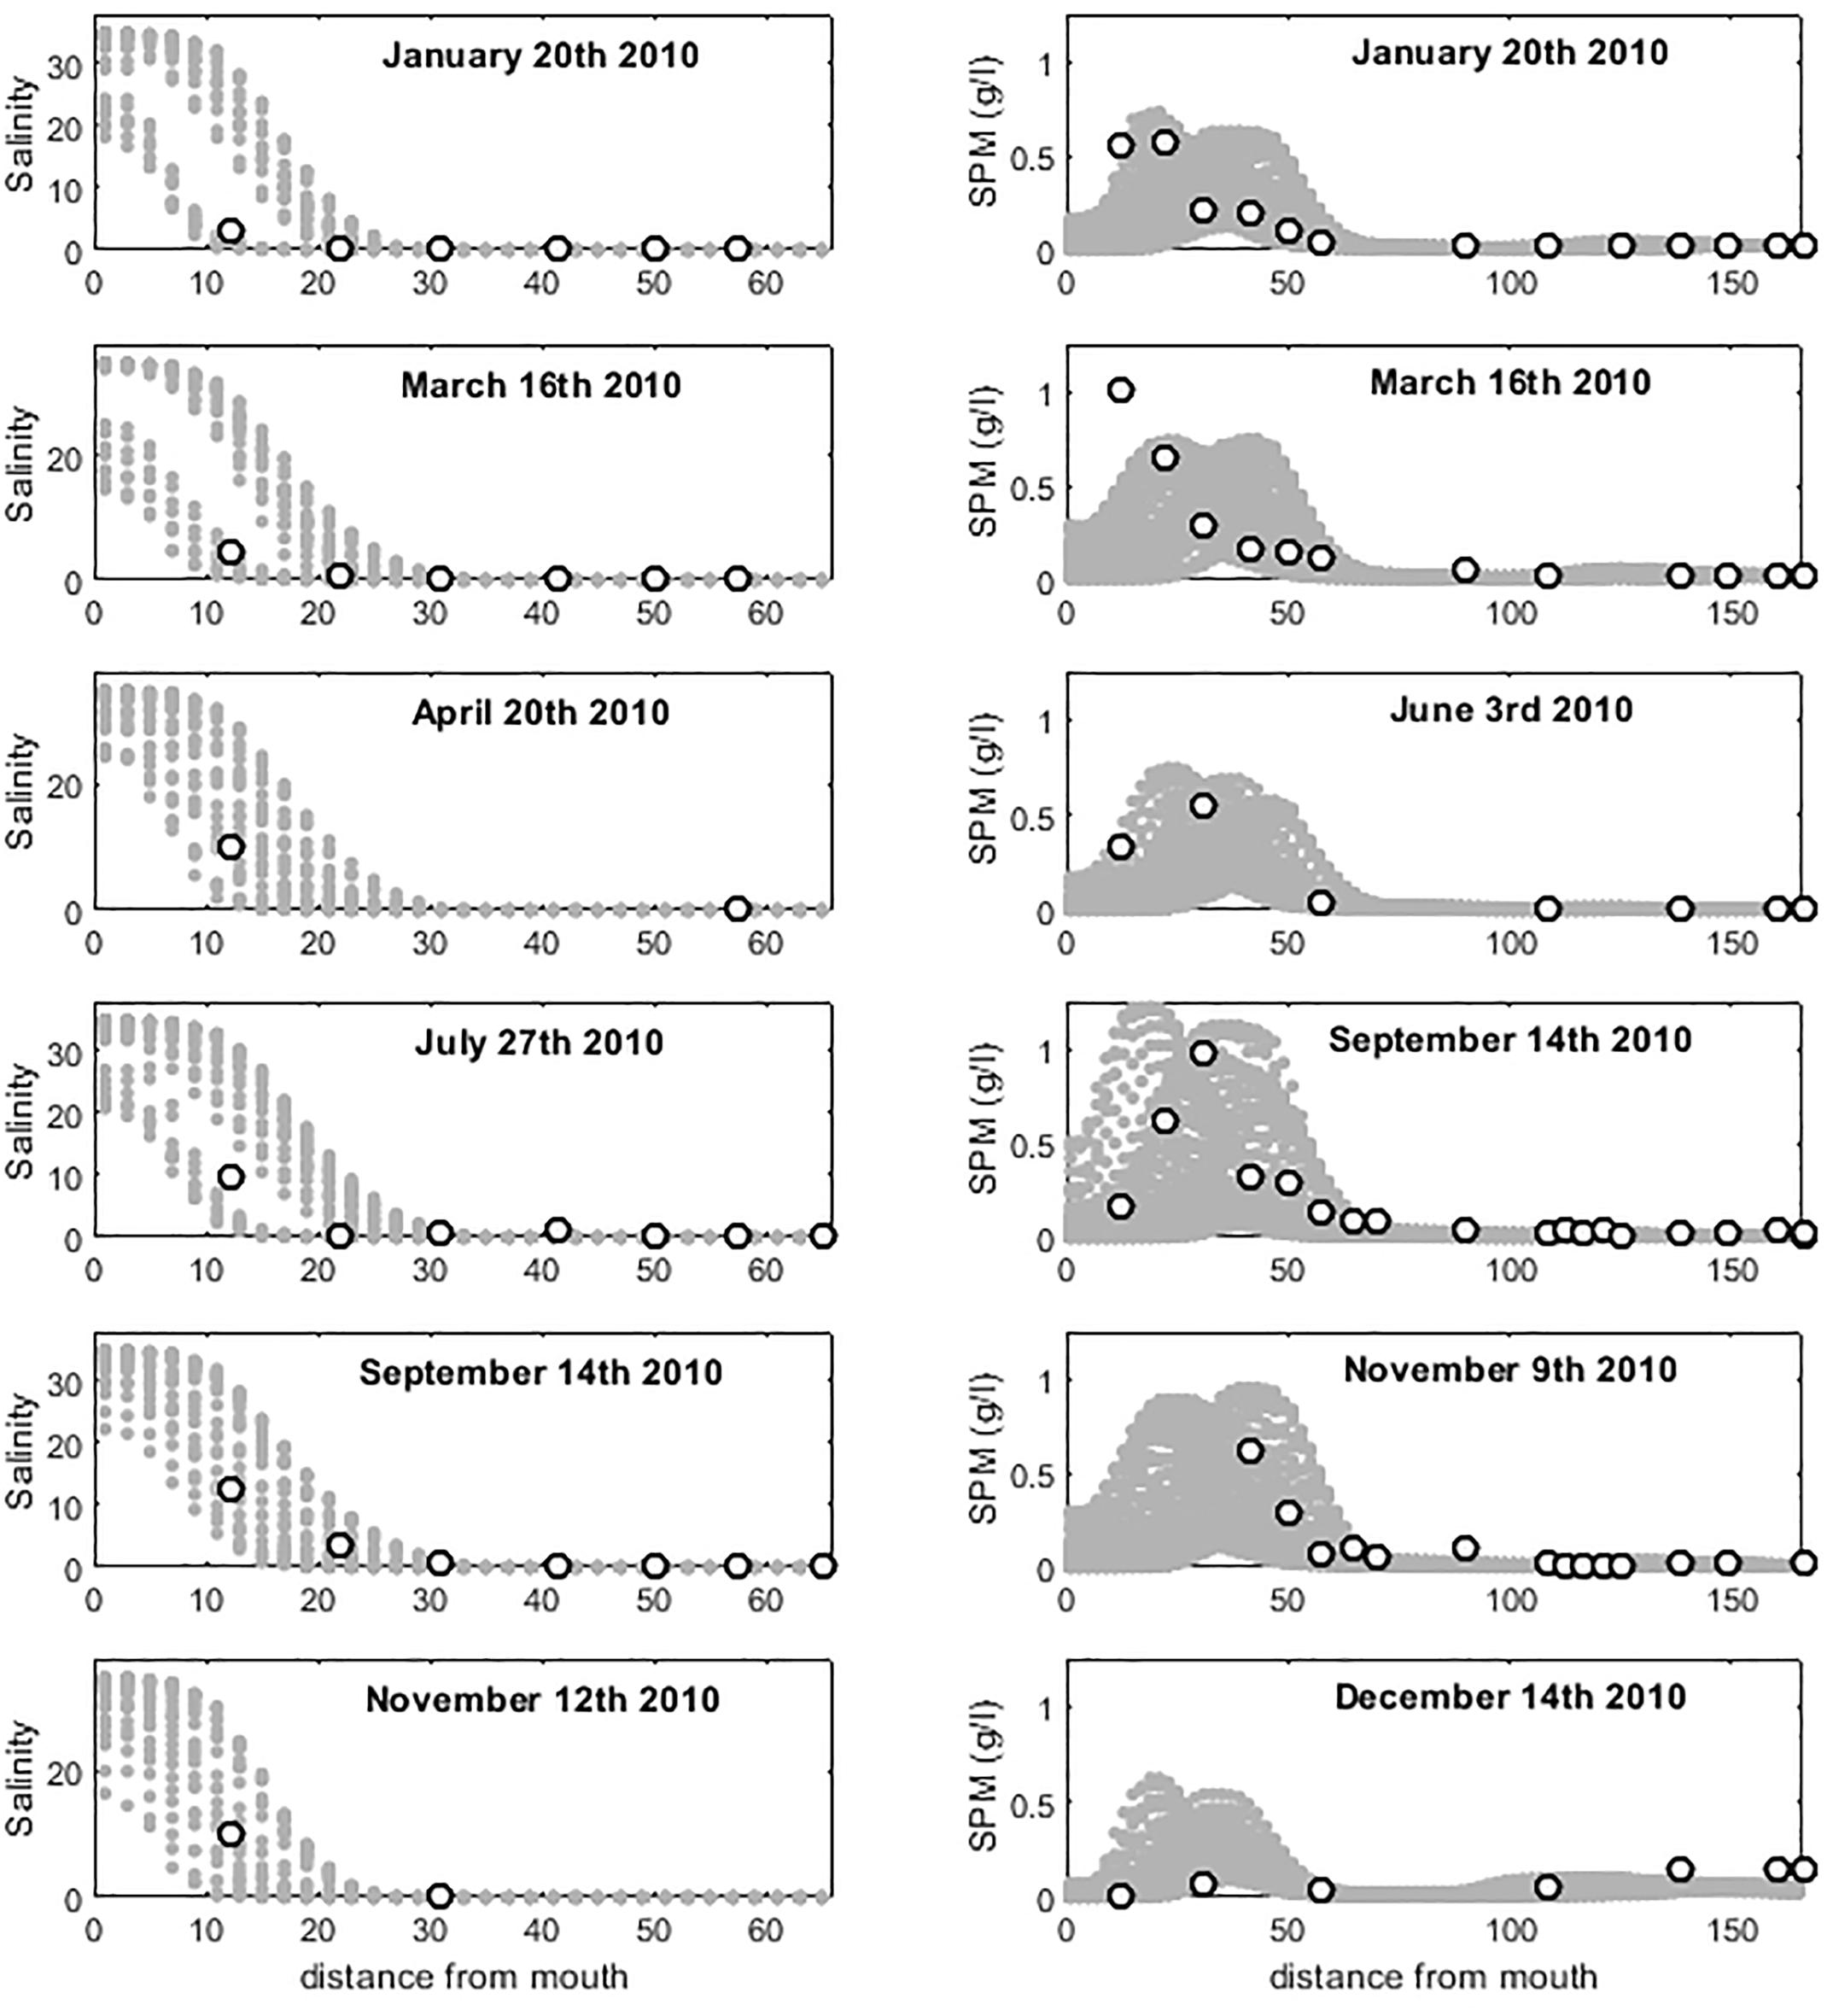
Figure 5. Salinity (left) and SPM profiles (right) along the Seine estuary for 6 dates. White dots correspond to measurements, gray dots correspond to simulated values over 2 tidal cycles for salinity and 20 for SPM.
Longitudinal profiles of SPM were also analyzed and compared with observations (Figure 5, right panels). Overall, the model properly captures the characteristic maximum of SPM around kilometers 20–30 which varies in intensity between 0.4 and 1.2 g⋅l-1 depending on the tidal amplitude, the water discharge and its SPM charge. The comparison between model and observation reveals a good match and is consistent with previous modeling studies (Grasso et al., 2018). Overall, the range of SPM concentrations predicted over 20 tidal cycles encompasses 88% of the observations and the location of the turbidity maximum is usually captured accurately by the model. The results reported compile values over a 10 days period in order to match the time step of the upstream boundary condition of the estuarine model for SPM concentrations and water discharge provided by pyNuts-Riverstrahler at Poses.
Biogeochemistry
Figure 6 displays the temporal evolution of concentrations for chlorophyll a, ammonium (NH4), nitrate (NO3), phosphate (PO4), dissolved silica (DSi), dissolved oxygen (O2), TOC, and the carbonate system (i.e., DIC, TAlk, pH, and pCO2) at five locations which combines outputs of both C-GEM and pyNuts-Riverstrahler along the main axis of the Seine. For each variable and location, time series are provided and compared with field measurements. The five locations correspond to the upstream end of the turbidity maximum zone (TMZ, 55 km from the estuarine mouth), 115 km upstream of, where the tidal amplitude is about half of that at the marine boundary, in Poses (kilometer 168) where both models are connected, and at kilometers 208 (upstream of Poses) and 300 (1 km before the Oise confluence), within the domain simulated by pyNuts-Riverstrahler. For each variable and station, the fit between modeled outputs and observations is evaluated under the form of bias and RMSE (Table 3).
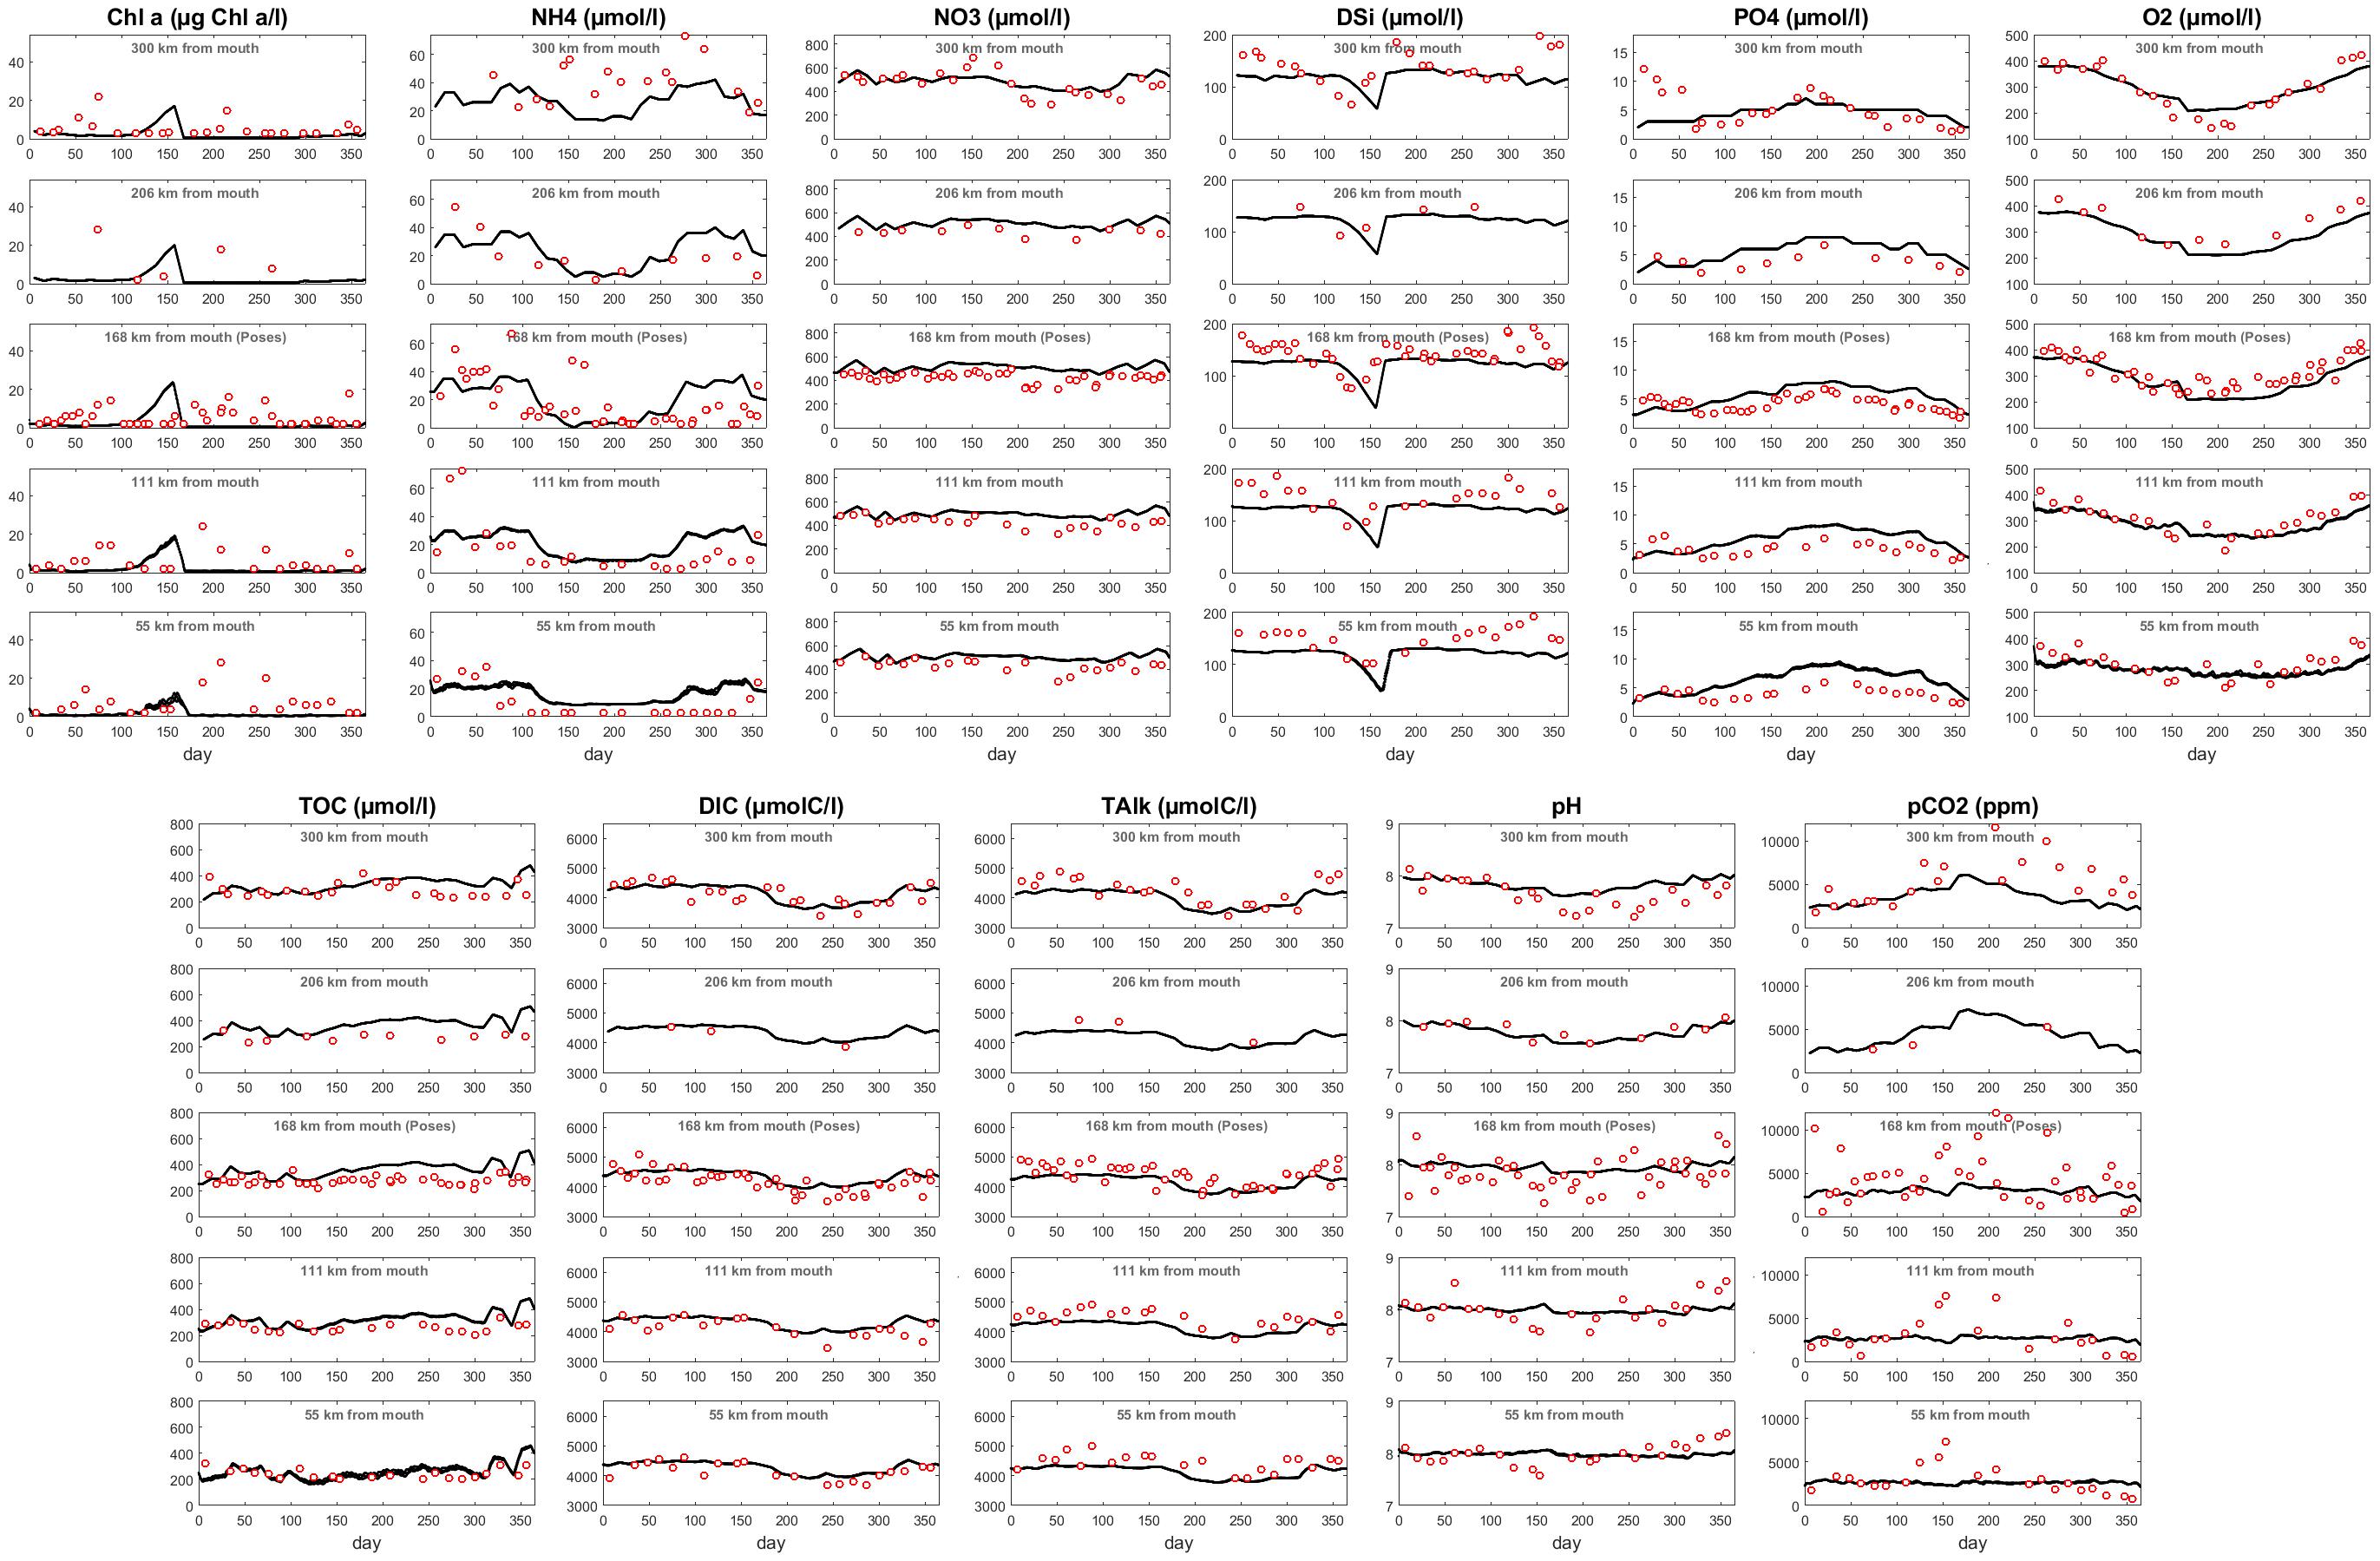
Figure 6. Time series for Chl a, NH4, NO3, DSi, PO4, O2, TOC, DIC, TAlk, pH, and pCO2 at five stations along the main axis of the Seine. Red dots correspond to measurements while black lines correspond to simulation outputs.
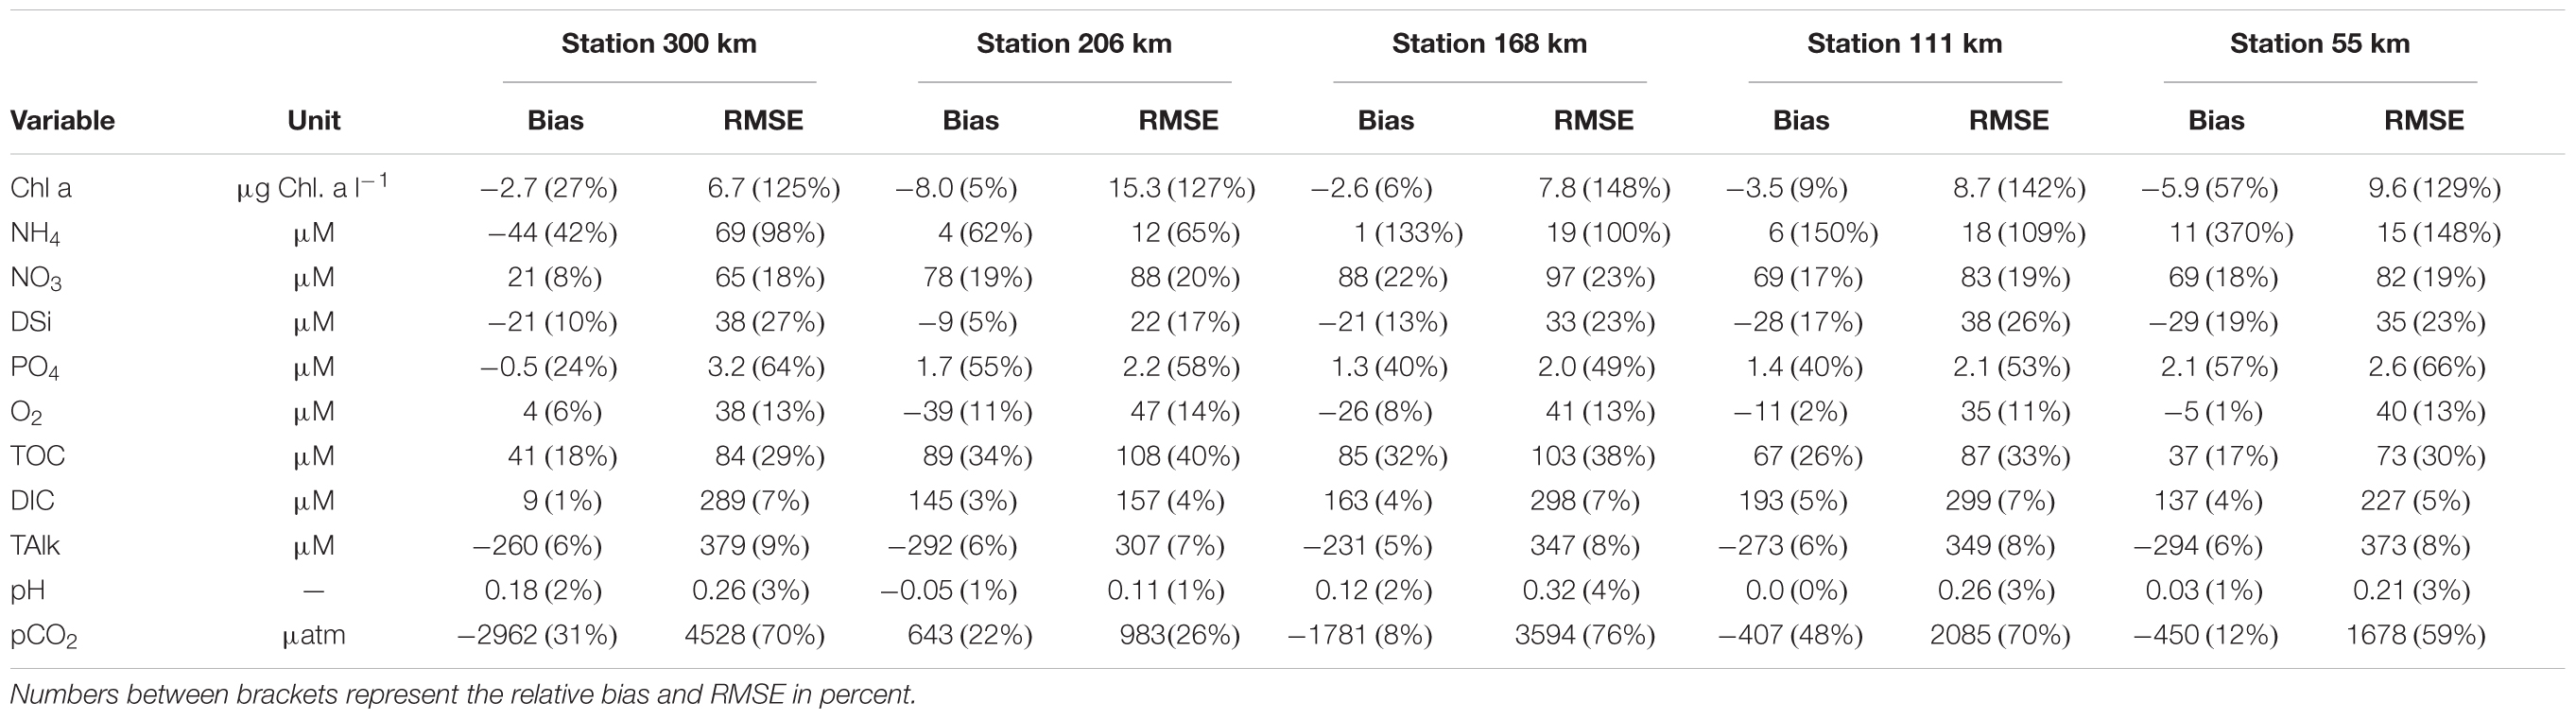
Table 3. Bias and root mean square error (RMSE) for Chl a, NH4, NO3, DSi, PO4, O2, TOC, DIC, TAlk, pH, and pCO2 at five stations along the main axis of the Seine.
In our simulation, phytoplankton concentrations (represented by Chl a, calculated as the sum of all phytoplankton species and converted from μmol⋅C⋅l-1 into mg⋅Chl. a⋅m-3) are characterized by a maximum in late Spring. This phytoplankton bloom is delayed by about a month compared to the observations and displays relatively constant values throughout the entire system until Honfleur. At this point, because of the combined effects of dilution and light attenuation generated by SPM preventing primary production, phytoplankton concentrations slightly decrease and never exceed 20 mg⋅Chl. a⋅m-3 at the marine boundary condition. The phytoplankton maximum is concomitant with the seasonal consumption of nutrients, particularly noticeable for DSi and NH4. The latter is also characterized by a decrease along the upstream-downstream axis, in spite of several punctual injections corresponding to the discharge of the different tributaries as well as the waste water treatment plant located in Rouen. NO3 displays relatively constant concentrations (∼500 μmol⋅l-1) along the river/estuarine gradient until the strong marine dilution taking place from kilometer 20 until the estuarine mouth after Honfleur where the width of the estuary increases exponentially because of the change in convergence length (Figure 2B). Data reveal a summer maximum in PO4 throughout the entire system, which is captured by the model, although over-estimated in the estuarine section. The annually averaged bias between model and observation increases from 0.5 μM 300 km from the mouth to 2.1 μM 55 km from the mouth. Overall, there is nonetheless a relatively good match between modeled and observed nutrient levels in spite of a slight over-estimation of NO3 and PO4 during the warmest month of the year in the estuarine domain and an over estimation of the DSi consumption in late spring generated by the delayed phytoplanktonic bloom in the simulations. The annually average relative biases over the 5 monitoring stations are 17, 13, and 43% for NO3, DSi, and PO4, respectively. Note that the latter is higher than the former two because of the very low concentrations observed in summer, which are not captured by the model. Similarly, the relative biases and RMSE for Chl a and NH4 are quite high (in excess of 100% at some stations) because of relatively low baseline values during part of the year. Finally, dissolved oxygen also displays seasonal variations with maximum values >400 μmol⋅O2⋅l-1 in winter and a drop below 300 μmol⋅O2⋅l-1 in the heat of summer. O2 is the variable which displays the best match between model outputs and observations at all locations with RMSE comprised between 35 and 47 μM depending on the location, which never exceeds 14% and relative biases ranging from 1 to 11%.
Time series for TOC, DIC and TAlk also reveal a relatively good fit with observations. TOC, which displays little seasonal variability and a progressive consumption from Paris to the estuarine mouth, is slightly over estimated by the model (averaged bias of 64 μM over 5 stations), particularly toward the end of the year. At kilometers 58, 111, and 308, the fit between modeled and observed TOC is very good until day 250. DIC and TAlk are both comprise between 3,500 and 4,500 μmol⋅C⋅l-1 in all locations throughout the year and display lower values between days 200 and 300. These seasonal variations are well captured by the model which predicts DIC with accuracy while slightly underestimating TAlk (average bias over 5 stations of -270 μM). RMSE for DIC and TAlk are generally comprised between 100 and 200 μM depending on the station, which represents less than 6% of their yearly average value at any station. pH and pCO2 predicted by both models are relatively close to observations in terms of seasonal average but also struggle to capture the seasonal signal observed in the data. Together, both models are able to simulate the progressive increase in pH from 7.8 in Paris to 8.1 at the estuarine mouth but the seasonal dip taking place in summer is only adequately reproduced by pyNuts-Riverstrahler at kilometer 208. The RMSE for pH at this station is 0.11 while is comprised between 0.21 and 0.32 elsewhere. Downstream, a pH maximum develops around day 150, as a consequence of the late phytoplankton bloom simulated by the model while observations report an annual minimum. The opposite seasonal trend is observed for pCO2 which is characterized by baseline values mostly comprised between 2000 and 3500 ppm in winter but exhibits a maximum in summer with values in excess of 10,000 ppm in Poses, which are not captured by the models, especially in the estuarine section. In our simulations, pCO2 does not exhibit any seasonal variations downstream of Poses and remains essentially bounded between 2,500 and 4,000 ppm over the entire estuarine section. This translates into large RMSE ranging from 983 to 4528 μatm depending on the station. The propagation of this seasonal mismatch at the boundary condition between both models (Poses) results in an underestimation of pCO2 in the estuarine section between days 120 and 180 and negative biases in all but one station.
Carbon Dynamics
Processes Controlling the Carbon Dynamics Along the Seine River and Estuary
A mechanistic understanding of the carbon dynamics along the main axis of the Seine can be provided by the analysis of the respective contributions of aerobic degradation (Respiration), denitrification, Net Primary Production (NPP) and CO2 outgassing to the change in DIC and TOC concentrations along the main axis of the Seine between Le Havre and Paris (Figure 7). The use of width-integrated yearly averaged rates allows analyzing the CO2 dynamics per unit length of estuarine segment and identifying variations all along the domain that would otherwise be difficult to compare by using volume/surface-integrated estimates (Figures 7A,B). In parallel, Figures 7C,D also reports those rates per unit surface area which provides insight regarding the intensity of the biogeochemical processes controlling the fate of carbon.
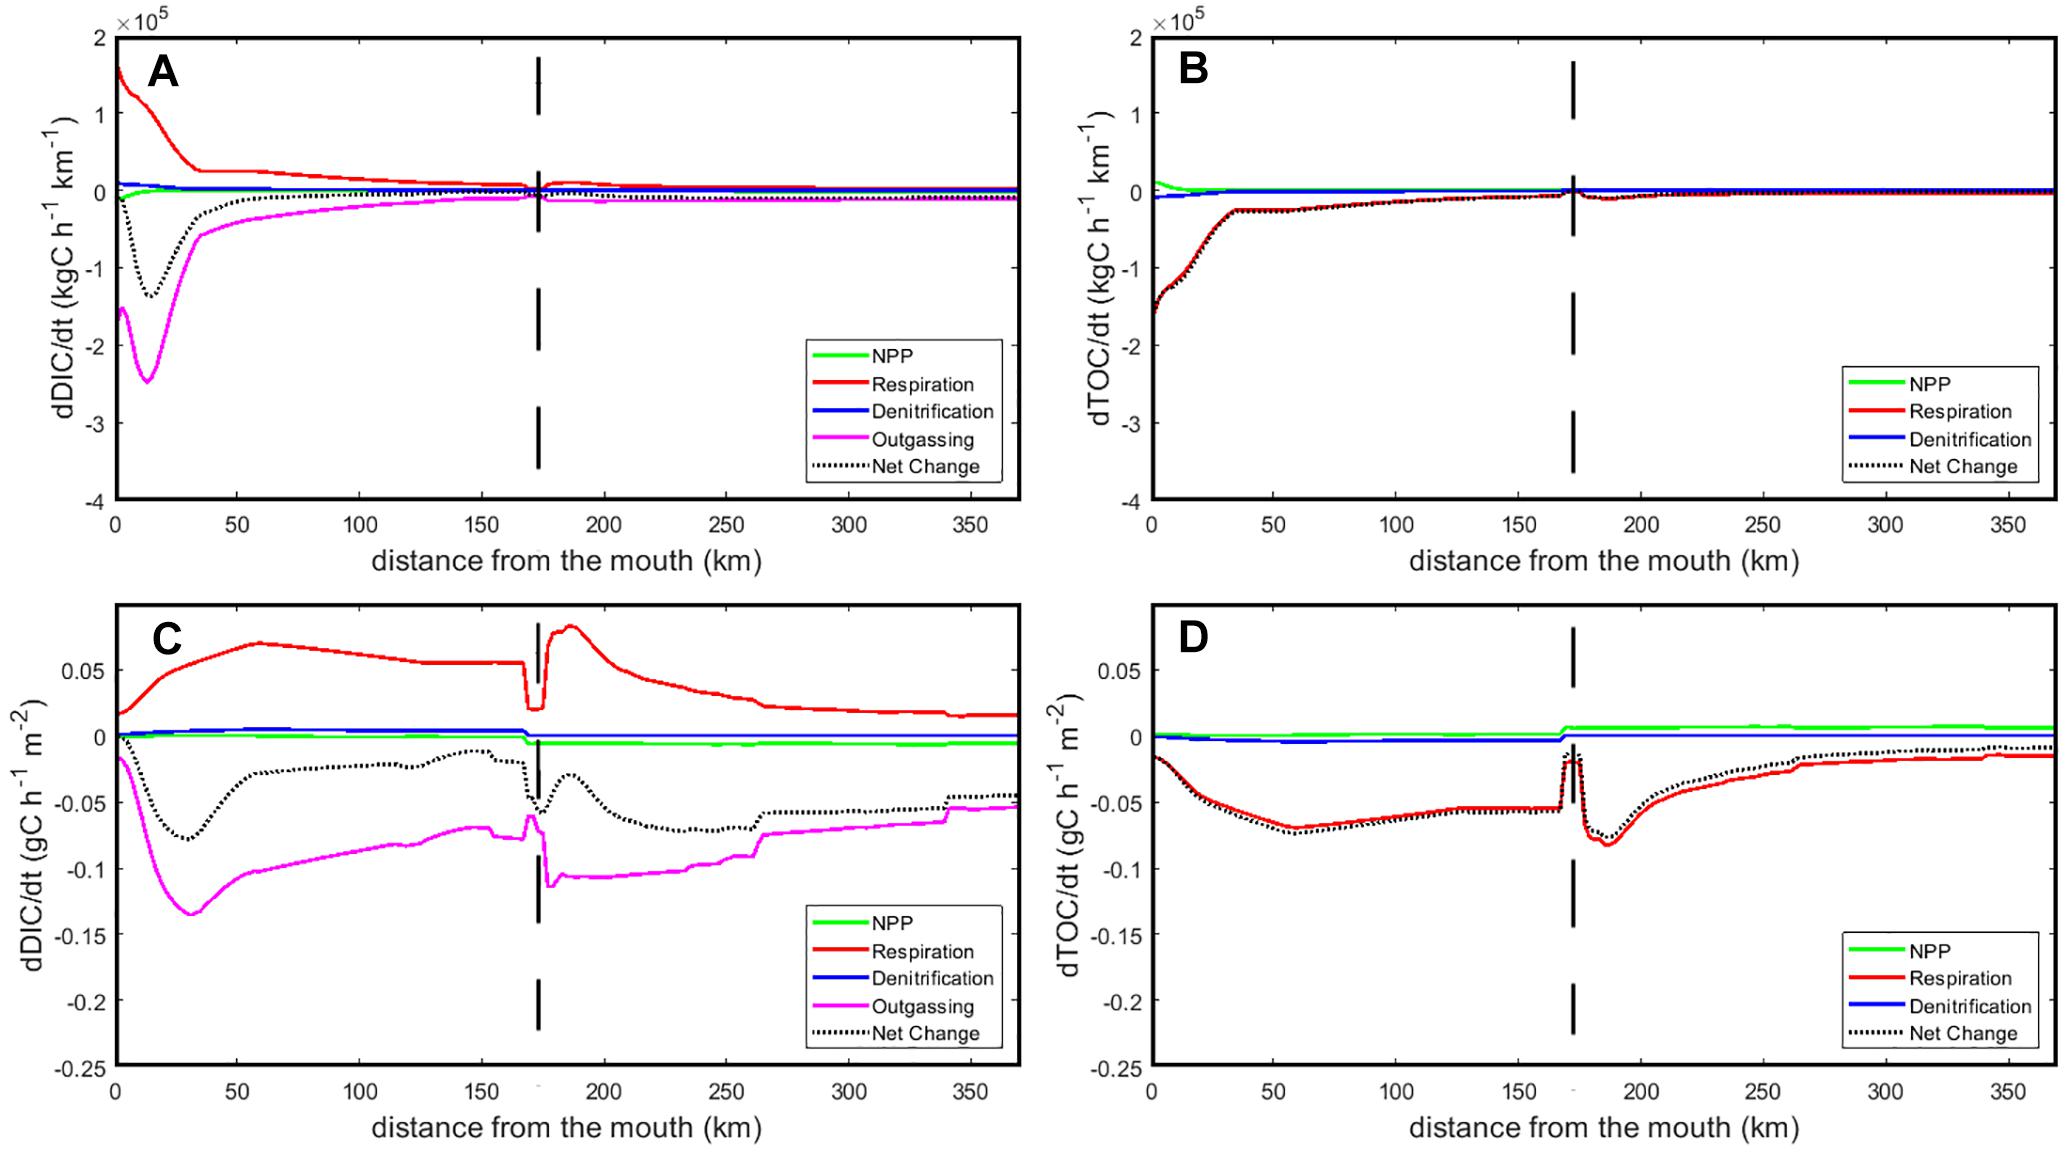
Figure 7. Longitudinal profiles along the main axis of the Seine of the different processes affecting the DIC (A,C) and TOC pools (B,D). In the top panels (A,B), the process rates are integrated over the Seine’s width while they are reported per surface area in the bottom panels (C,D). Zero is the mouth of the estuary in Le Havre, vertical dashed lines, represent Poses, Paris corresponds to kilometer 370.
The main process responsible for changes in DIC along the river-estuarine gradient is CO2 outgassing (a loss represented negatively), which goes increasing from Paris until Poses and reduces DIC concentrations in water (Figure 7A). In terms of outgassing intensity per surface area, however, the rates simulated in the estuarine and riverine sections of the model are comparable (Figure 7C). In the estuary (kilometers 0–168), the outgassing of CO2 increases from 0.2 to 3 gC⋅d-1⋅m-2 between Poses to 30 km upstream of Le Havre and drops sharply toward the estuarine mouth. The width integrated fluxes reveal that, in spite of lower emission rates, the 50 most downstream kilometers of the system account more than half of the total CO2 flux toward the atmosphere (51%) as a consequence of the exponential widening of Seine toward the sea (Figure 2A). The dominant biogeochemical source of DIC for the system is the aerobic degradation of organic matter, which displays a progressive increase from Paris (0.04 gC⋅d-1⋅m-2) to Poses (2 gC⋅d-1⋅m-2) and sustains a rate comprised between 0.8 and 1.2 gC⋅d-1⋅m-2 in most of the estuarine section, except for the 20 most downstream kilometers. Primary production and denitrification only contribute marginally to the DIC balance of the system and the net change in DIC is negative all along the simulated river-estuarine continuum.
Along its journey through the main axis of the Seine from Paris to the estuarine mouth, organic matter is mostly converted into DIC with a negative net change comprised between -0.1 and -2 gC⋅d-1⋅m-2. This consumption is almost exclusively driven by aerobic degradation and denitrification is almost negligible. The latter is nonetheless slightly more intense in the estuarine section of the Seine but remains two orders of magnitudes less intense than respiration. The source terms for organic carbon (i.e., NPP) never exceeds 0.1 gC⋅d-1⋅m-2 and reaches 100 kgC⋅d-1⋅km-1 at the estuarine mouth. Overall, these profiles reveal that the main axis of the Seine barely produces organic matter instream and is essentially sustained by tributaries and lateral inputs while converting a large proportion of the organic carbon produced upstream into DIC.
Integrated Budget of the Seine Estuarine/River Network
Every year, 1,204 Gg⋅C are injected into the Seine river network, including 101 Gg⋅C⋅yr-1 under the form of organic carbon as diffuse and point sources (Marescaux et al., 2018) providing a ratio of OC/IC of around 0.1. This organic to inorganic carbon ratio drops below 4% at the estuarine mouth where 716 and 29 Gg⋅C⋅yr-1 of DIC and TOC are exported to the sea, respectively. The overall CO2 outgassing of the entire Seine and estuarine system reaches 445 Gg⋅C⋅yr-1 (Figure 8). 44% of this CO2 release takes place upstream of Paris (196 Gg⋅C⋅yr-1), mostly in the large upstream Seine river network (137 Gg⋅C⋅yr-1) compared to the smaller Marne one (59 Gg⋅C⋅yr-1). Downstream of Paris, however, the main axis only contributes 21 Gg⋅C⋅yr-1 between Paris and Poses while the estuary and the various tributaries emit 101 and 127 Gg⋅C⋅yr-1, respectively. Looking at the inputs, 465 Gg⋅C⋅yr-1 reach Paris, mostly under the form of DIC (92%). Another 319 Gg⋅C⋅yr-1 are introduced into the main axis of the Seine between Poses and Paris. 71% of those come from tributaries, which mostly contribute to the DIC pool (216 Gg C yr-1) while the 91 Gg⋅C⋅y-1 provided by urban releases and point sources exhibit a much high proportion of OC (18%). 31% of the OC reaching the main axis of the Seine between Paris and Poses is thus delivered by urban releases and point sources. Within this section of the network, a significant DIC removal takes place in the various tributaries of the Seine, most notably the Oise for which the total outgassing amounts to 98 GgC⋅yr-1. Downstream of Poses, in the section of the main axis simulated by C-GEM, most of the carbon processing takes place in the estuary where 46 Gg⋅C⋅yr-1 are converted from organic matter into DIC (71% of the entire river network) and 101 Gg⋅C⋅yr-1 are emitted as CO2 into the atmosphere. The estuarine net primary production, however, remains relatively low with 3.6 Gg⋅C⋅yr-1 but still represents 32% of the production occurring in the upstream fluvial part. As illustrated by Figure 7, the large contribution of the estuarine section of the Seine to NPP and respiration can be partly attributed to its relatively large water surface area.
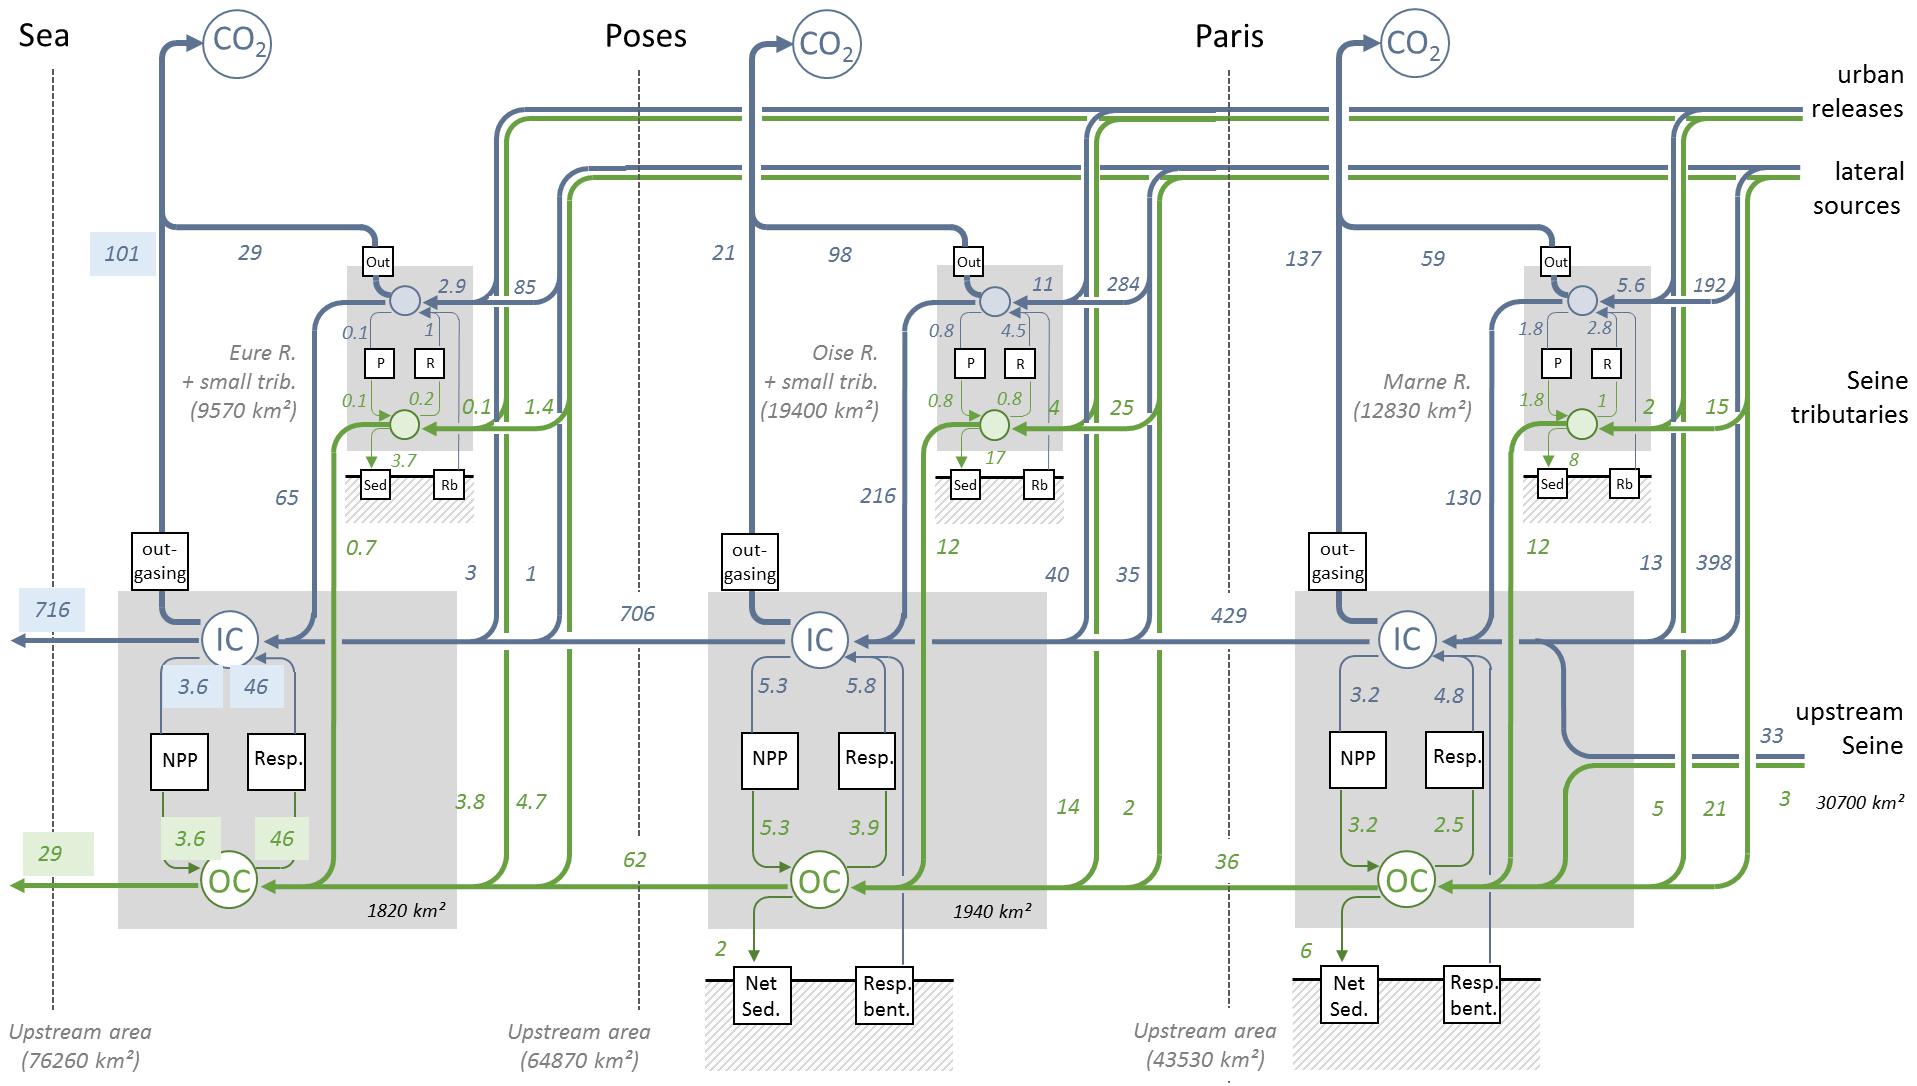
Figure 8. Organic (green) and inorganic carbon budget (blue) for the Seine river network. The surface area all the different sub-sections of the watershed are indicated in italic.
Discussion
Interests and Weaknesses of the Approach
The simulations presented in this study are, to our knowledge, the first transient representation of the inorganic carbon biogeochemical processing of an entire river network resulting from the full coupling of a riverine and estuarine RTM. Such an off-line coupling was recently published using Riverstrahler and ECO-MARS3D for nutrients biogeochemical processing only (Romero et al., 2018). The relatively good performances, at least in terms of level of water quality variables, of both C-GEM and Riverstrahler for chlorophyll, nutrients, oxygen as well as organic and inorganic carbon dynamics proves that our approach is able to capture the main biogeochemical dynamics of the Seine river network all along its main axis and provide a realistic representation of the main biogeochemical processing taking place in the different tributaries (i.e., nutrient consumption, organic matter degradation etc.). All variables simulated fall within the range of the values observed on the field and most seasonal patterns such as nutrient consumption are reproduced. O2, DSi, and NO3, in particular display relative biases mostly falling in the 5–20% range when compared with observations depending on the station. Our simulations describe a heterotrophic system characterized by a moderate biogeochemical processing and relatively little production in the estuarine section as suggested by previous studies (Garnier et al., 2001). One of the main controls of the biogeochemical dynamics of the Seine river network is the significant anthropic pressure which translates into large nutrients and organic matter point sources, in particular in Achères downstream the WWTP SAV and Rouen as was evidenced by Servais et al. (1991), Romero et al. (2016), and Marescaux et al. (2018). Although the timing of the simulated phytoplankton bloom is late by a few weeks, the amplitude of the nutrient consumption is similar to observation and the decrease in dissolved silica confirms the domination of diatoms within phytoplankton biomass (Morelle et al., 2018; Garnier unpublished).
Because of the advective nature of the riverine environment, a proper simulation of the seasonality of the carbonate cycle in a riverine environment puts a lot of pressure on the accuracy of the most upstream concentrations. It is thus a testament to the robustness of the hydrological modules of both models that proper seasonal signals in most chemical species can be adequately transferred along the riverine gradient and from Riverstrahler to C-GEM in spite of significantly different temporal resolution. While several RTMs including biogeochemical modules have been developed and successfully applied to several rivers and estuaries over the past decades (Regnier et al., 1997, 2002; Regnier and Steefel, 1999; Arndt and Regnier, 2007; Arndt et al., 2009, 2011; Laruelle et al., 2009; Romero et al., 2018), it should be noted that both C-GEM and pyNuts-Riverstrahler are designed to be generic tools relying on parameterizations elaborated with the intend of an ease of deployment to any temperate system (Volta et al., 2014, 2016a,b; Laruelle et al., 2017a; Desmit et al., 2018). Thus, this successful local application opens the door to simulation of entire stretches of coastline of this estuarine/riverine modeling chain following the recent independent regional application of both C-GEM (Laruelle et al., 2017a) and Riverstrahler (Desmit et al., 2018).
A Carbonate Cycle Module in the Land-Ocean Aquatic Continuum
One of the main features of the biogeochemical modules used in this study is the explicit resolution of the carbonate cycle, which is seldom included in riverine and estuarine RTMs. As for nutrients, the values simulated by both models for DIC, TAlk, pH, and pCO2 fall well within the average values observed on the field for these variables throughout the entire length of the system and the seasonality of DIC and TAlk are properly captured. This is also demonstrated for the riverine section of the Seine in Marescaux (2018). However, the complex seasonal dynamics of the carbonate system was not fully captured for pH and pCO2. These variables are very sensitive to minor changes in DIC and TAlk and are thus particularly difficult to simulate with accuracy. Nonetheless, the baseline pH and pCO2 values simulated by C-GEM in the estuarine section of the Seine match observations for most of the year. The discrepancy with observations corresponds to the propagation at the connection between both models of the late phytoplankton bloom, which prevents the model to reproduce a drop in pH observed in the field around day 150. It should also be noted that previous modeling attempts at simulating the carbonate cycle in estuarine environments, however, did not involve a spatial component and only reproduced annually or seasonally averaged conditions (Volta et al., 2016a,b). Overall, our longitudinal profiles for DIC, TAlk, pH, and pCO2 do match average observations with mean annually averaged relative biases between model and observations over 5 stations of 3, 6, 1, and 24% for DIC, TAlk, pH, and pCO2, respectively (Table 3).
This is illustrated by the large changes in pCO2 and pH observed at any given station along the Seine and particularly clear in Poses (Figure 6). Nonetheless, because of the largely oversaturated nature of the Seine in pCO2 throughout the year and the fact that baseline pCO2 values simulated by both C-GEM and Riverstrahler, we are confident that our integrated yearly budget for the CO2 emissions from the river network of the Seine is relatively realistic. Considering that the pCO2 values simulated by our estuarine model match the yearly baseline values, our estimate should be regarded as a lower end estimate. Based on the most downstream pCO2 time series, assuming that the gradient of pCO2 at the air-water interface is underestimated by the estuarine model by a factor of 2 between days 120 and 180, the resulting CO2 emissions would only increase by ∼15%. One of the striking features of these calculations is that with a conservative estimate of outgassing of 101 Gg⋅C⋅yr-1 over the 168 most downstream kilometers of the Estuary (and 51 Gg⋅C⋅yr-1 in the 50 most downstream kilometer), the estuary contributes at least 23% to the global emission of CO2 from the entire river network of the Seine which amounts to 445 Gg⋅C⋅yr-1. This exercise reveals the importance of the estuarine section of the Seine because, in part, of the large increase in available surface area. Such disproportionate contribution of the most downstream part of estuaries was already suggested by Volta et al., 2016a,b for the Scheldt and the Elbe. This not only confirms our hypothesis that estuaries are significant contributors to the aquatic CO2 outgassing but also evidences the importance of including an explicit description of the morphology of estuaries when performing an integrated analysis. The influence of the width of the system on the intensity of the carbon processing partly results from the increase in available surface area for the air-water gas exchange (Regnier et al., 2013a; Volta et al., 2016a) as well as change in water residence time.
Features and Fate of Carbon in LOAC at Regional Scale
Interestingly, the contribution of the estuary to the Seine’s river network matches that derived for the global scale (23%) by comparing the estuarine outgassing of 0.15 Pg⋅C⋅yr-1 calculated by Laruelle et al. (2013) to the riverine outgassing of 0.65 Pg⋅C⋅yr-1 calculated by Lauerwald et al. (2015). Such local and global results further highlight the importance of integrating estuaries into calculations of the carbon removal by the LOAC either at local scale (i.e., such as in this study), regional scale (Laruelle et al., 2015) or global scale (Regnier et al., 2013a). In addition, the outgassing of 101 GgC⋅yr-1 reported to the surface area of the Seine’s estuary (146 km2) yields an average emission rate per surface area of 58 mol⋅C⋅m-2⋅yr-1. While this value sits at the high end of the range of emissions reported for tidal estuaries [estimated at 18.2 mol⋅C⋅m-2⋅yr-1 by Laruelle et al. (2013)], European estuaries under heavy anthropic pressures tend to display higher emission rates ranging from 30 to 70 mol⋅C⋅m-2⋅yr-1 (Frankignoulle et al., 1998).
Throughout its journey along the Seine’s LOAC, the fraction of organic carbon remains below 10% in all sections of the network and goes increasing from below 5% in the tributaries upstream of Paris to ∼10% at the confluence of the Seine and the Oise and decrease again to 4% at the mouth of the estuary. This decreasing trend in the estuarine domain is consistent with that suggested by the global synthesis of Bauer et al. (2013) although that study implies a larger fraction of organic carbon in global riverine waters suggesting that the natural organic load of the Seine is relatively low. The significant increase in the mid-section of the main axis of the river is a direct consequence of the strong anthropogenic pressures existing on the Seine river-network. For instance, large punctual inputs indeed take place, in particular between Paris and Poses where the organic to inorganic carbon ratio exceeds 0.1 as a consequence of the discharge of a large amount of the treated effluents of the 12.5 million inhabitants of the Parisian conurbation on the lower Seine river. Noteworthy, the contribution of the organic load in this Paris-Poses stretch has been much higher in the period 1980–1990 before efficient treatments, especially in the huge SAV WWTP as shown in terms of BOD load in Rocher and Azimi (2017) and oxygenation of the river (Romero et al., 2016). Overall, the organic carbon retention (calculated as 1 minus the ratio of organic carbon exported to the organic carbon inputs) for the entire river network amounts to 54% for the estuarine section.
Although significant, this number is slightly lower than the range of organic retentions calculated for six European estuaries surrounding the North Sea by Volta et al. (2016b). These systems, which include the Scheldt, the Thames, and the Oder were shown to all convert over half of the organic carbon passing through them (76 ± 20%). However, the total carbon retention (i.e., taking into account both DIC and TOC) of the Seine estuary amounts to 9%, which is comparable to the Scheldt (10%), the Elbe (11%) and the Weser (12%) and falls at the low end of the range of 15 ± 7% reported by Volta et al. (2016b).
Conclusion
This study presents an integrated modeling investigation of the carbon and nutrient dynamics along the LOAC of the Seine river network. Our approach relies on the coupling of two transient, spatially resolved models for the estuary (C-GEM) and the river network (pyNuts-Riverstrahler) able to simulate Chl a, nutrients, oxygen and the carbonate cycle. Our simulations performed over year 2010 properly capture the longitudinal profiles and seasonal variations of all variables and reveal a system under strong anthropic pressure with large nutrients and organic matter inputs. Our study thus allows calculating an integrated carbon budget of the Seine river network which evidences the large contribution of the estuary to both CO2 outgassing and TOC degradation. While the spring maximum in pCO2 observed on the field is not reproduced by our models, the baseline pCO2 simulated by the model allows estimating a conservative outgassing of the estuarine section to be 101 Gg⋅C⋅yr-1, which amounts to 23% of the entire river network. The estuary also transforms 65% of the TOC into DIC between Poses and Le Havre, lowering the OC to IC ratio from 0.1 upstream of Poses to 0.04 at the estuarine mouth. Such high filtering intensity confirms the hypothesis that, because of its increasing width and surface area, the most downstream part of the river network disproportionately contributes to the carbon processing of the system. Because of the generic nature of both C-GEM and pyNuts-Riverstrahler, similar applications to other river networks or entire stretches of coastline can be ambitioned in the future. These applications will allow determining how representative the case of the Seine river is amongst rivers with tidal alluvial estuaries and constraining regional scale carbon and nutrient budgets for the LOAC.
Author Contributions
GL designed most of the set-up for the simulations of the estuarine model and drafted the first version of the manuscript. AM carried out riverine model simulations with the help of VT. GL, AM, JG, and VT contributed to early drafts of the manuscript and helped structuring it. VT performed the calculations necessary to the riverine carbon budget. RLG provided marine boundary conditions to the estuarine model. CR provided insight for the discussion. All authors commented on and reviewed the latest versions of the manuscript.
Funding
GL was supported by Labex L-IPSL LP3, which was funded by ANR (Grant #ANR-10-LABX-0018).
Conflict of Interest Statement
The authors declare that the research was conducted in the absence of any commercial or financial relationships that could be construed as a potential conflict of interest.
Footnotes
References
Abril, G., and Borges, A. V. (2004). “Carbon dioxide and methane emissions from estuaries,” in Greenhouse Gases Emissions from Natural Environments and Hydroelectric Reservoirs: Fluxes and Processes, eds A. Tremblay, M. Garneau, L. Varfalvy, and C. Roehm (Berlin: Springer), 187–207. doi: 10.1007/3-540-26643-7_7
Arndt, S., Lacroix, G., Gypens, N., Regnier, P., and Lancelot, C. (2011). Nutrient dynamics and phytoplankton development along an estuary-coastal zone continuum: a model study. J. Mar. Syst. 84, 49–66. doi: 10.1016/j.jmarsys.2010.08.005
Arndt, S., and Regnier, P. (2007). A model for the benthic-pelagic coupling of silica in estuarine ecosystems: sensitivity analysis and system scale simulation. Biogeosciences 4, 331–352. doi: 10.5194/bg-4-331-2007
Arndt, S., Regnier, P., and Vanderborght, J. P. (2009). Seasonally-resolved nutrient export fluxes and filtering capacities in a macrotidal estuary. J. Mar. Syst. 78, 42–58. doi: 10.1016/j.jmarsys.2009.02.008
Attali, J. (2010). Paris et la Mer. La Seine Est Capitale. Paris: Fayard. doi: 10.1016/j.jmarsys.2009.02.008
Battin, T. J., Luyssaert, S., Kaplan, L. A., Aufdenkampe, A. K., Richter, A., and Tranvik, L. J. (2009). The boundless carbon cycle. Nat. Geosci. 2, 598–600. doi: 10.1038/ngeo618
Bauer, J. E., Cai, W., Raymond, P. A., Bianchi, T. S., Hopkinson, C. S., and Regnier, P. A. G. (2013). The changing carbon cycle of the coastal ocean. Nature 504, 61–70. doi: 10.1038/nature12857
Billen, G., Garnier, J., and Hanset, P. (1994). Modelling phytoplankton development in whole drainage networks: the Riverstrahler Model applied to the Seine river system. Hydrobiologia 289, 119–137. doi: 10.1007/BF00007414
Billen, G., Garnier, J., and Silvestre, M. (2015). A simplified algorithm for calculating benthic nutrient fluxes in river systems. Ann. Limnol. Int. J. Limnol. 51, 37–47. doi: 10.1051/limn/2014030
Billen, G., Ramarson, A., Thieu, V., Théry, S., Silvestre, M., Pasquier, C., et al. (2018). Nitrate retention at the river—watershed interface: a new conceptual modeling approach. Biogeochemistry 139, 31–51. doi: 10.1007/s10533-018-0455-9
Borges, A. V. (2005). Do we have enough pieces of the jigsaw to integrate CO2fluxes in the coastal ocean? Estuaries 28, 3–27. doi: 10.1007/BF02732750
Borges, A. V., Delille, B., and Frankignoulle, M. (2005). Budgeting sinks and sources of CO2in the coastal ocean: diversity of ecosystem counts. Geophys. Res. Lett. 32, 1–4. doi: 10.1029/2005GL023053
Broullón, D., Pérez, F. F., Velo, A., Hoppema, M., Olsen, A., Takahashi, T., et al. (2018). A global monthly climatology of total alkalinity: a neural network approach. Earth Syst. Sci. Data 2, 1–31. doi: 10.5194/essd-2018-111
Cai, W. J. (2011). Coastal ocean carbon paradox: CO2 sinks or sites of terrestrial carbon incineration. Ann. Rev. Mar. Sci. 3, 123–145. doi: 10.1146/annurev-marine-120709-142723
Cai, W.-J., and Wang, Y. (1998). The chemistry, fluxes, and sources of carbon dioxide in the estuarine waters of the Satilla and Altamaha Rivers. Georgia. Limnol. Oceanogr. 43, 657–668. doi: 10.4319/lo.1998.43.4.0657
Causse, J., Billen, G., Garnier, J., Henri-des-Tureaux, T., Olasa, X., Thammahacksa, C., et al. (2015). Field and modelling studies of Escherichia coli loads in tropical streams of montane agro-ecosystems. J. Hydro Environ. Res. 9, 496–507. doi: 10.1016/j.jher.2015.03.003
Chen, C. T. A., and Borges, A. V. (2009). Reconciling opposing views on carbon cycling in the coastal ocean: continental shelves as sinks and near-shore ecosystems as sources of atmospheric CO2. Deep. Res. Part II Top. Stud. Oceanogr. 56, 578–590. doi: 10.1016/j.dsr2.2009.01.001
Chen, C. T. A., Huang, T. H., Chen, Y. C., Bai, Y., He, X., and Kang, Y. (2013). Air-sea exchanges of coin the world’s coastal seas. Biogeosciences 10, 6509–6544. doi: 10.5194/bg-10-6509-2013
Cole, J. J., Prairie, Y. T., Caraco, N. F., McDowell, W. H., Tranvik, L. J., Striegl, R. G., et al. (2007). Plumbing the global carbon cycle: integrating inland waters into the terrestrial carbon budget. Ecosystems 10, 172–185. doi: 10.1007/s10021-006-9013-8
Cugier, P., Billen, G., Guillaud, J. F., Garnier, J., and Ménesguen, A. (2005). Modelling the eutrophication of the Seine Bight (France) under historical, present and future riverine nutrient loading. J. Hydrol. 304, 381–396. doi: 10.1016/j.jhydrol.2004.07.049
Culberson, C. H. (1980). Calculation of the in situ pH of seawater. Limnol. Oceanogr. 25, 150–152. doi: 10.4319/lo.1980.25.1.0150
Desmit, X., Thieu, V., Billen, G., Campuzano, F., Dulière, V., Garnier, J., et al. (2018). Reducing marine eutrophication may require a paradigmatic change. Sci. Total Environ. 635, 1444–1466. doi: 10.1016/j.scitotenv.2018.04.181
Dickson, A., Goyet, C., Doe, Dickson, A., and Goyet, C. (1992). Handbook of methods for the analysis of the various parameters of the carbon dioxide system in sea water. DOE Handb. 1994:22.
Emiroglu, O., Cicek, A., Arslan, N., Aksan, S., and Rüzgar, M. (2010). Boron concentration in water, sediment and different organisms around large borate deposits of Turkey. Bull. Environ. Contam. Toxicol. 84, 427–431. doi: 10.1007/s00128-010-9961-8
Follows, M. J., Ito, T., and Dutkiewicz, S. (2006). On the solution of the carbonate chemistry system in ocean biogeochemistry models. Ocean Model. 12, 290–301. doi: 10.1016/j.ocemod.2005.05.004
Frankignoulle, M., Abril, G., Borges, A. V., Bourge, I., Canon, C., Delille, B., et al. (1998). Carbon dioxide emission from european estuaries. Science 282, 434–436. doi: 10.1126/science.282.5388.434
Garnier, J., and Billen, G. (1994). Ecological interactions in a shallow sand-pit lake (Lake Créteil, Parisian Basin, France): a modelling approach. Hydrobiologia 275–276, 97–114. doi: 10.1007/BF00026703
Garnier, J., Billen, G., Even, S., Etcheber, H., and Servais, P. (2008). Organic matter dynamics and budgets in the turbidity maximum zone of the Seine Estuary (France). Estuar. Coast. Shelf Sci. 77, 150–162. doi: 10.1016/j.ecss.2007.09.019
Garnier, J., Billen, G., Hannon, E., Fonbonne, S., Videnina, Y., and Soulie, M. (2002). Modelling the transfer and retention of nutrients in the drainage network of the danube river. Estuar. Coast. Shelf Sci. 54, 285–308. doi: 10.1006/ecss.2000.0648
Garnier, J., Billen, G., Némery, J., and Sebilo, M. (2010). Transformations of nutrients (N, P, Si) in the turbidity maximum zone of the Seine estuary and export to the sea. Estuar. Coast. Shelf Sci. 90, 129–141. doi: 10.1016/j.ecss.2010.07.012
Garnier, J., Billen, G., and Palfner, L. (2000). Understanding the oxygen budget and related ecological processes in the river Mosel: the RIVERSTRAHLER approach. Hydrobiologia 410, 151–166. doi: 10.1007/978-94-017-2163-9_17
Garnier, J., Servais, P., Billen, G., Akopian, M., and Brion, N. (2001). Lower seine river and estuary (France) carbon and oxygen budgets during low flow. Estuaries 24, 964–976. doi: 10.2307/1353010
Grasso, F., Verney, R., Le Hir, P., Thouvenin, B., Schulz, E., Kervella, Y., et al. (2018). Suspended sediment dynamics in the macrotidal Seine Estuary (France): 1. Numerical modeling of turbidity maximum dynamics. J. Geophys. Res. Oceans 123, 558–577. doi: 10.1002/2017JC013185
Laruelle, G. G., Dürr, H. H., Lauerwald, R., Hartmann, J., Slomp, C. P., Goossens, N., et al. (2013). Global multi-scale segmentation of continental and coastal waters from the watersheds to the continental margins. Hydrol. Earth Syst. Sci. 17, 2029–2051. doi: 10.5194/hess-17-2029-2013
Laruelle, G. G., Goossens, N., Arndt, S., Cai, W. J., and Regnier, P. (2017a). Air-water CO2 evasion from US East coast estuaries. Biogeosciences 14, 2441–2468. doi: 10.5194/bg-14-2441-2017
Laruelle, G. G., Landschützer, P., Gruber, N., Ti, J. L., Delille, B., and Regnier, P. (2017b). Global high-resolution monthly pCO2 climatology for the coastal ocean derived from neural network interpolation. Biogeosciences 14, 4545–4561. doi: 10.5194/bg-14-4545-2017
Laruelle, G. G., Lauerwald, R., Rotschi, J., Raymond, P. A., Hartmann, J., and Regnier, P. (2015). Seasonal response of air – water CO 2 exchange along the land – ocean aquatic continuum of the northeast North American coast. Biogeosciences 12, 1447–1458. doi: 10.5194/bg-12-1447-2015
Laruelle, G. G., Regnier, P., Ragueneau, O., Kempa, M., Moriceau, B., Longphuirt, S. N., et al. (2009). Benthic-pelagic coupling and the seasonal silic cycle in the bay of brest (France): new insights from a coupled physical-biological model. Mar. Ecol. Prog. Ser. 385, 15–32. doi: 10.3354/meps07884
Lauerwald, R., Laruelle, G. G., Hartmann, J., Ciais, P., and Regnier, P. A. G. (2015). Spatial patterns in CO2 evasion from the global river network. Glob. Biogeochem. Cycles 29, 534–554. doi: 10.1002/2014GB004941
Le, T. P. Q., Billen, G., Garnier, J., and Chau, V. M. (2014). Long-term biogeochemical functioning of the Red River (Vietnam): past and present situations. Reg. Environ. Chang. 15, 329–339. doi: 10.1007/s10113-014-0646-4
Marescaux, A. (2018). Carbon Cycling Across the Human-Impacted Seine River Basin: From the Modeling of Carbon Dioxide Outgassing to the Assessment of Greenhouse Gas Emissions. Paris: Sorbonne University.
Marescaux, A., Thieu, V., Borges, A. V., and Garnier, J. (2018). Seasonal and spatial variability of the partial pressure of carbon dioxide in the human-impacted Seine River (France). Sci. Rep. 17:13961. doi: 10.1038/s41598-018-32332-2
Morelle, J. (2017). Dynamique Spatiale et Temporelle de la Production Primaire de L’estuaire de la Seine. Normandy: Normandie University.
Morelle, J., Schapira, M., Françoise, S., Courtay, G., Orvain, F., and Claquin, P. (2018). Dynamics of exopolymeric carbon pools in relation with phytoplankton succession along the salinity gradient of a temperate estuary (France). Estuar. Coast. Shelf Sci. 209, 18–29. doi: 10.1016/j.ecss.2018.05.008
Passy, P., Le Gendre, R., Garnier, J., Cugier, P., Callens, J., Paris, F., et al. (2016). Eutrophication modelling chain for improved management strategies to prevent algal blooms in the Bay of Seine. Mar. Ecol. Prog. Ser. 543, 107–125. doi: 10.3354/meps11533
Raimonet, M., Thieu, V., Silvestre, M., Oudin, L., Rabouille, C., Vautard, R., et al. (2018). Landward perspective of coastal eutrophication potential under future climate change: the seine river case (France). Front. Mar. Sci. 5:136. doi: 10.3389/fmars.2018.00136
Raymond, P. A., Hartmann, J., Lauerwald, R., Sobek, S., McDonald, C., Hoover, M., et al. (2013). Global carbon dioxide emissions from inland waters. Nature 503, 355–359. doi: 10.1038/nature12760
Regnier, P., Arndt, S., Goossens, N., Volta, C., Laruelle, G. G., Lauerwald, R., et al. (2013a). Modelling estuarine biogeochemical dynamics: from the local to the global scale. Aquat. Geochem. 19, 591–626. doi: 10.1007/s10498-013-9218-3
Regnier, P., Friedlingstein, P., Ciais, P., Mackenzie, F. T., Gruber, N., Janssens, I. A., et al. (2013b). Anthropogenic perturbation of the carbon fluxes from land to ocean. Nat. Geosci. 6, 597–607. doi: 10.1038/ngeo1830
Regnier, P., Mouchet, A., Wollast, R., and Ronday, F. (1998). A discussion of methods for estimating residual fluxes in strong tidal estuaries. Cont. Shelf Res. 18, 1543–1571. doi: 10.1016/S0278-4343(98)00071-5
Regnier, P., O’Kane, J. P., Steefel, C. I., and Vanderborght, J. P. (2002). Modeling complex multi-component reactive-transport systems: towards a simulation environment based on the concept of a knowledge base. Appl. Math. Model. 26, 913–927. doi: 10.1016/S0307-904X(02)00047-1
Regnier, P., and Steefel, C. I. (1999). A high resolution estimate of the inorganic nitrogen flux from the Scheldt estuary to the coastal North Sea during a nitrogen-limited algal bloom, spring 1995. Geochim. Cosmochim. Acta 63, 1359–1374. doi: 10.1016/S0016-7037(99)00034-4
Regnier, P., Wollast, R., and Steefel, C. I. (1997). Long-term fluxes of reactive species in macrotidal estuaries: estimates from a fully transient, multicomponent reaction-transport model. Mar. Chem. 58, 127–145. doi: 10.1016/S0304-4203(97)00030-3
Resplandy, L., Keeling, R. F., Eddebbar, Y., Brooks, M. K., Wang, R., Bopp, L., et al. (2018). Quantification of ocean heat uptake from changes in atmospheric O2 and CO2 composition. Nature 563, 105–108. doi: 10.1038/s41586-018-0651-8
Rocher, V., and Azimi, S. (2017). Evolution de la Qualité de la Seine en Lien Avec les Progrès de L’assainissement - De 1970 à 2015. Paris: Editions Johanet, 76.
Romero, E., Garnier, J., Billen, G., Ramarson, A., Riou, P., and Le Gendre, R. (2018). Modeling the biogeochemical functioning of the Seine estuary and its coastal zone: export, retention, and transformations. Limnol. Ocean. doi: 10.1002/lno.11082
Romero, E., Le Gendre, R., Garnier, J., Billen, G., Fisson, C., Silvestre, M., et al. (2016). Long-term water quality in the lower Seine: lessons learned over 4 decades of monitoring. Environ. Sci. Policy 58, 141–154. doi: 10.1016/j.envsci.2016.01.016
Savenije, H. H. G. (1992). Lagrangian solution of St. Venant’s equations for alluvial estuary. J. Hydraul. Eng. 118, 1153–1163. doi: 10.1061/(ASCE)0733-94291992118:81153
Savenije, H. H. G. (2012). Salinity and Tides in Alluvial Estuaries, 2nd Edn. doi: 10.1061/(asce)0733-9429 (1992)118%3A8 (1153) (accessed January 16, 2018).
Servais, P., Garnier, J., Billen, G., and Barillier, A. (1991). Dégradation de la Matière Organique et Dynamique des Bactéries Hétérotrophes Dans la Seine. Paris: ULB, 108–111.
Sferratore, A., Billen, G., Garnier, J., Smedberg, E., Humborg, C., and Rahm, L. (2008). Modelling nutrient fluxes from sub-arctic basins: comparison of pristine vs. dammed rivers. J. Mar. Syst. 73, 236–249. doi: 10.1016/j.jmarsys.2007.10.012
Thieu, V., Billen, G., and Garnier, J. (2009). Nutrient transfer in three contrasting NW European watersheds: the Seine, Somme, and Scheldt Rivers. A comparative application of the Seneque/Riverstrahler model. Water Res. 43, 1740–1754. doi: 10.1016/j.watres.2009.01.014
Thieu, V., Silvestre, M., Billen, G., Garnier, J., Passy, P., and Lassaletta, L. (2015). “Nutrient transfer in aquatic continuum and delivery to coastal zone: rising up the challenge of a generic application of the Riverstrahler ecological model to the watershed domain of the European North Atlantic Ocean,” in Proceedings of the 2nd International Conference Integrated Science Sustain Developement, (Lyon: I.S. Rivers International Conference), 22–26.
van Heuven, S., Pierrot, D., Rae, J. W. B., Lewis, E., and Wallace, D. W. R. (2011). MATLAB Program Developed for CO2 System Calculations. ORNL/CDIAC-105b. ORNL/CDIAC-105b. Oak Ridge: Carbon Dioxide Information Analysis Center, doi: 10.1017/CBO9781107415324.004
Vanderborght, J. P., Wollast, R., Loijens, M., and Regnier, P. (2002). Application of a transport-reaction model to the estimation of biogas fluxes in the Scheldt Estuary. Biogeochemistry 59, 207–237. doi: 10.1023/A:1015573131561
Volta, C., Arndt, S., Savenije, H. H. G., Laruelle, G. G., and Regnier, P. (2014). C-GEM (v 1.0): a new, cost-efficient biogeochemical model for estuaries and its application to a funnel-shaped system. Geosci. Model. Dev. 7, 1271–1295. doi: 10.5194/gmd-7-1271-2014
Volta, C., Laruelle, G. G., Arndt, S., and Regnier, P. (2016a). Linking biogeochemistry to hydro-geometrical variability in tidal estuaries: a generic modeling approach. Hydrol. Earth Syst. Sci. 20, 991–1030. doi: 10.5194/hess-20-991-2016
Keywords: dissolved inorganic and organic carbon, carbon dioxide, reactive-transport model, Seine river and estuary, biogeochemical budget
Citation: Laruelle GG, Marescaux A, Le Gendre R, Garnier J, Rabouille C and Thieu V (2019) Carbon Dynamics Along the Seine River Network: Insight From a Coupled Estuarine/River Modeling Approach. Front. Mar. Sci. 6:216. doi: 10.3389/fmars.2019.00216
Received: 29 December 2018; Accepted: 05 April 2019;
Published: 26 April 2019.
Edited by:
Il-Nam Kim, Incheon National University, South KoreaReviewed by:
Carlos Noriega, Federal University of Pernambuco, BrazilJohn Christopher Lehrter, University of South Alabama, United States
Copyright © 2019 Laruelle, Marescaux, Le Gendre, Garnier, Rabouille and Thieu. This is an open-access article distributed under the terms of the Creative Commons Attribution License (CC BY). The use, distribution or reproduction in other forums is permitted, provided the original author(s) and the copyright owner(s) are credited and that the original publication in this journal is cited, in accordance with accepted academic practice. No use, distribution or reproduction is permitted which does not comply with these terms.
*Correspondence: Goulven G. Laruelle, Z291bHZlbi5sYXJ1ZWxsZUB1cG1jLmZy; Z291bHZlbi5naWxkYXMubGFydWVsbGVAdWxiLmFjLmJl