 Alan MacDonald
 Douglas C. Speirs
 Simon P. R. Greenstreet2
 Michael R. Heath
- 1Department of Mathematics and Statistics, University of Strathclyde, Glasgow, United Kingdom
- 2Marine Scotland Science, Marine Laboratory, Aberdeen, United Kingdom
Sandeels Ammodytes marinus are a crucial forage fish species in the North Sea, transferring zooplankton energy to higher trophic levels. However, there has been a sustained decline in sandeel abundance in the northwestern North Sea since 2000. Here we use field data to analyse year-to-year changes in A. marinus growth rate between 1997 and 2009 and assess whether variation in growth rate corresponded with variation in abundance. The signature of the reduction in abundance between 2000 and 2009 was a decline in age 1 sandeels, while no other age class declined. Analysis of age-length data showed that the decline in abundance coincided with a period of low growth. Growth performance indexes were correlated with zooplankton and phytoplankton biomass but not temperature. Further, we observed a significant correlation between larval growth rate and 0-group sandeel length during a period when hatch dates were relatively fixed; suggesting recent changes in length were influenced by food availability.
Introduction
Ammodytes marinus are lipid rich shoaling fish that form a vital part of the link between zooplankton production and higher trophic levels in the North Sea. A. marinus, hereafter sandeels, are essential prey for many birds (Wanless et al., 1998; Furness and Tasker, 2000; Frederiksen et al., 2004; Lahoz-Monfort et al., 2011; MacDonald et al., 2015) and marine mammals (MacLeod et al., 2007). Sandeel dependent seabirds, especially those limited to carrying one fish at a time, are bottom-up limited by abundance (Frederiksen et al., 2007) and highly sensitive to variation in sandeel energy content (Wanless et al., 2005; Rindorf et al., 2016). Length is an indicator of energetic content (Hislop et al., 1991; Wanless et al., 2005), which is influenced by short-term variation in sandeel growth rate (0–2 years) since fish <3 years old dominate the sandeel stock.
No time series on sandeel growth rate exists, although there is evidence of a decline in size; with long-term decreases in the mean lengths of age groups 0, 1, and 2 in the North Sea (Wanless et al., 2004; van Deurs et al., 2014; Howells et al., 2017). Of particular interest to United Kingdom seabird conservationists is the long term decline in 0-group length (Wanless et al., 2004; Howells et al., 2017), as breeding success and survival of many seabird species is sensitive to variation in length and hence energy content of this age class (MacDonald et al., 2015). Changes in 0-group length-at-date decline could be caused by changes in spawning and hatch days, size-dependent larval mortality or larval growth rate (Frederiksen et al., 2011).
A decrease in quality and availability of sandeels’ main prey calanoid copepods could have reduced sandeel growth rate between 2000 and 2009. Furthermore, mean calanoid copepod prey size, an indicator of energy value, has declined in the North Sea since the 1980s (Beaugrand et al., 2003). These changes would have reduced sandeel energy uptake if sandeels were handling time limited (van Deurs et al., 2014). Larval growth and subsequent recruitment is likely sensitive to the temporal match between emergence of first feeding larvae and copepod nauplii abundance (Wright and Bailey, 1996). Calanus finmarchicus and Calanus helgolandicus are the most dominant large copepods in the North Sea, however, it is unclear which of these species has the largest impact on sandeel recruitment success (van Deurs et al., 2009; Régnier et al., 2017). Relationships between sandeel recruitment and the synchrony between sandeel hatch dates and particular copepod species may indicate a prey preference, or simply reflect relative abundance of copepod species.
Sandeel growth is highly seasonal, with the largest increase in size observed between April and June (Winslade, 1974; Bergstad et al., 2002). Growth ceases altogether during winter (Cameron, 1958; Macer, 1966). Marked differences in sandeel growth exist across the North Sea (Boulcott et al., 2007), with fastest growth in Southern United Kingdom waters and off the Norwegian coast (Wright and Bailey, 1993; Bergstad et al., 2002; Boulcott et al., 2007) and slowest growth off Shetland (Warburton, 1982). Many studies have analysed temporal and spatial variation in length at age (Macer, 1966; Baistrocchi, 2003; Boulcott et al., 2007; van Deurs et al., 2014), however, relatively few studies have analysed year-to-year changes in sandeel growth over a lifespan (Bergstad et al., 2002; Rindorf et al., 2016). Significant spatial variation in length-at-age and condition exist (Rindorf et al., 2016), with largest length-at-age positively related to temperature and depth, and asymptotic length and condition positively related to latitude. In the present study we investigate year-to-year changes in sandeel abundance-at-age and length-at age to (1) estimate changes in abundance-at-age in the early 2000s to determine years the stock decreased and what age classes were affected, (2) analyse year-to-year changes in growth rates between 1997 and 2006, (3) assess whether there was a correlation between larval growth rate and 0-group length in June, and (4) assess relationships between growth rates and zooplankton abundances, chlorophyll densities and Sea surface temperature (SST).
Materials and Methods
Sampling Methods
Sampling of juvenile and adult sandeels by pelagic trawl has taken place annually off the Firth of Forth between 1997–2003 and 2005–2009 (56° 00′N and 56° 30′N and longitudes 003° 00′W and 001° 00′W, Figure 1). In each year, trawling was carried out between 0400 and 1800 h GMT between late May and early July. Surveys covered the main sandbanks, the Wee Bankie, Marr Bank, and Berwick’s Bank, prime habitat for sandeels in this area (Proctor et al., 1998; Pedersen et al., 1999). Sampling was undertaken by the FRV Clupea for the majority of the study period (1997–2007), before it was replaced by the FRV Alba Na Mara (2008–2009).
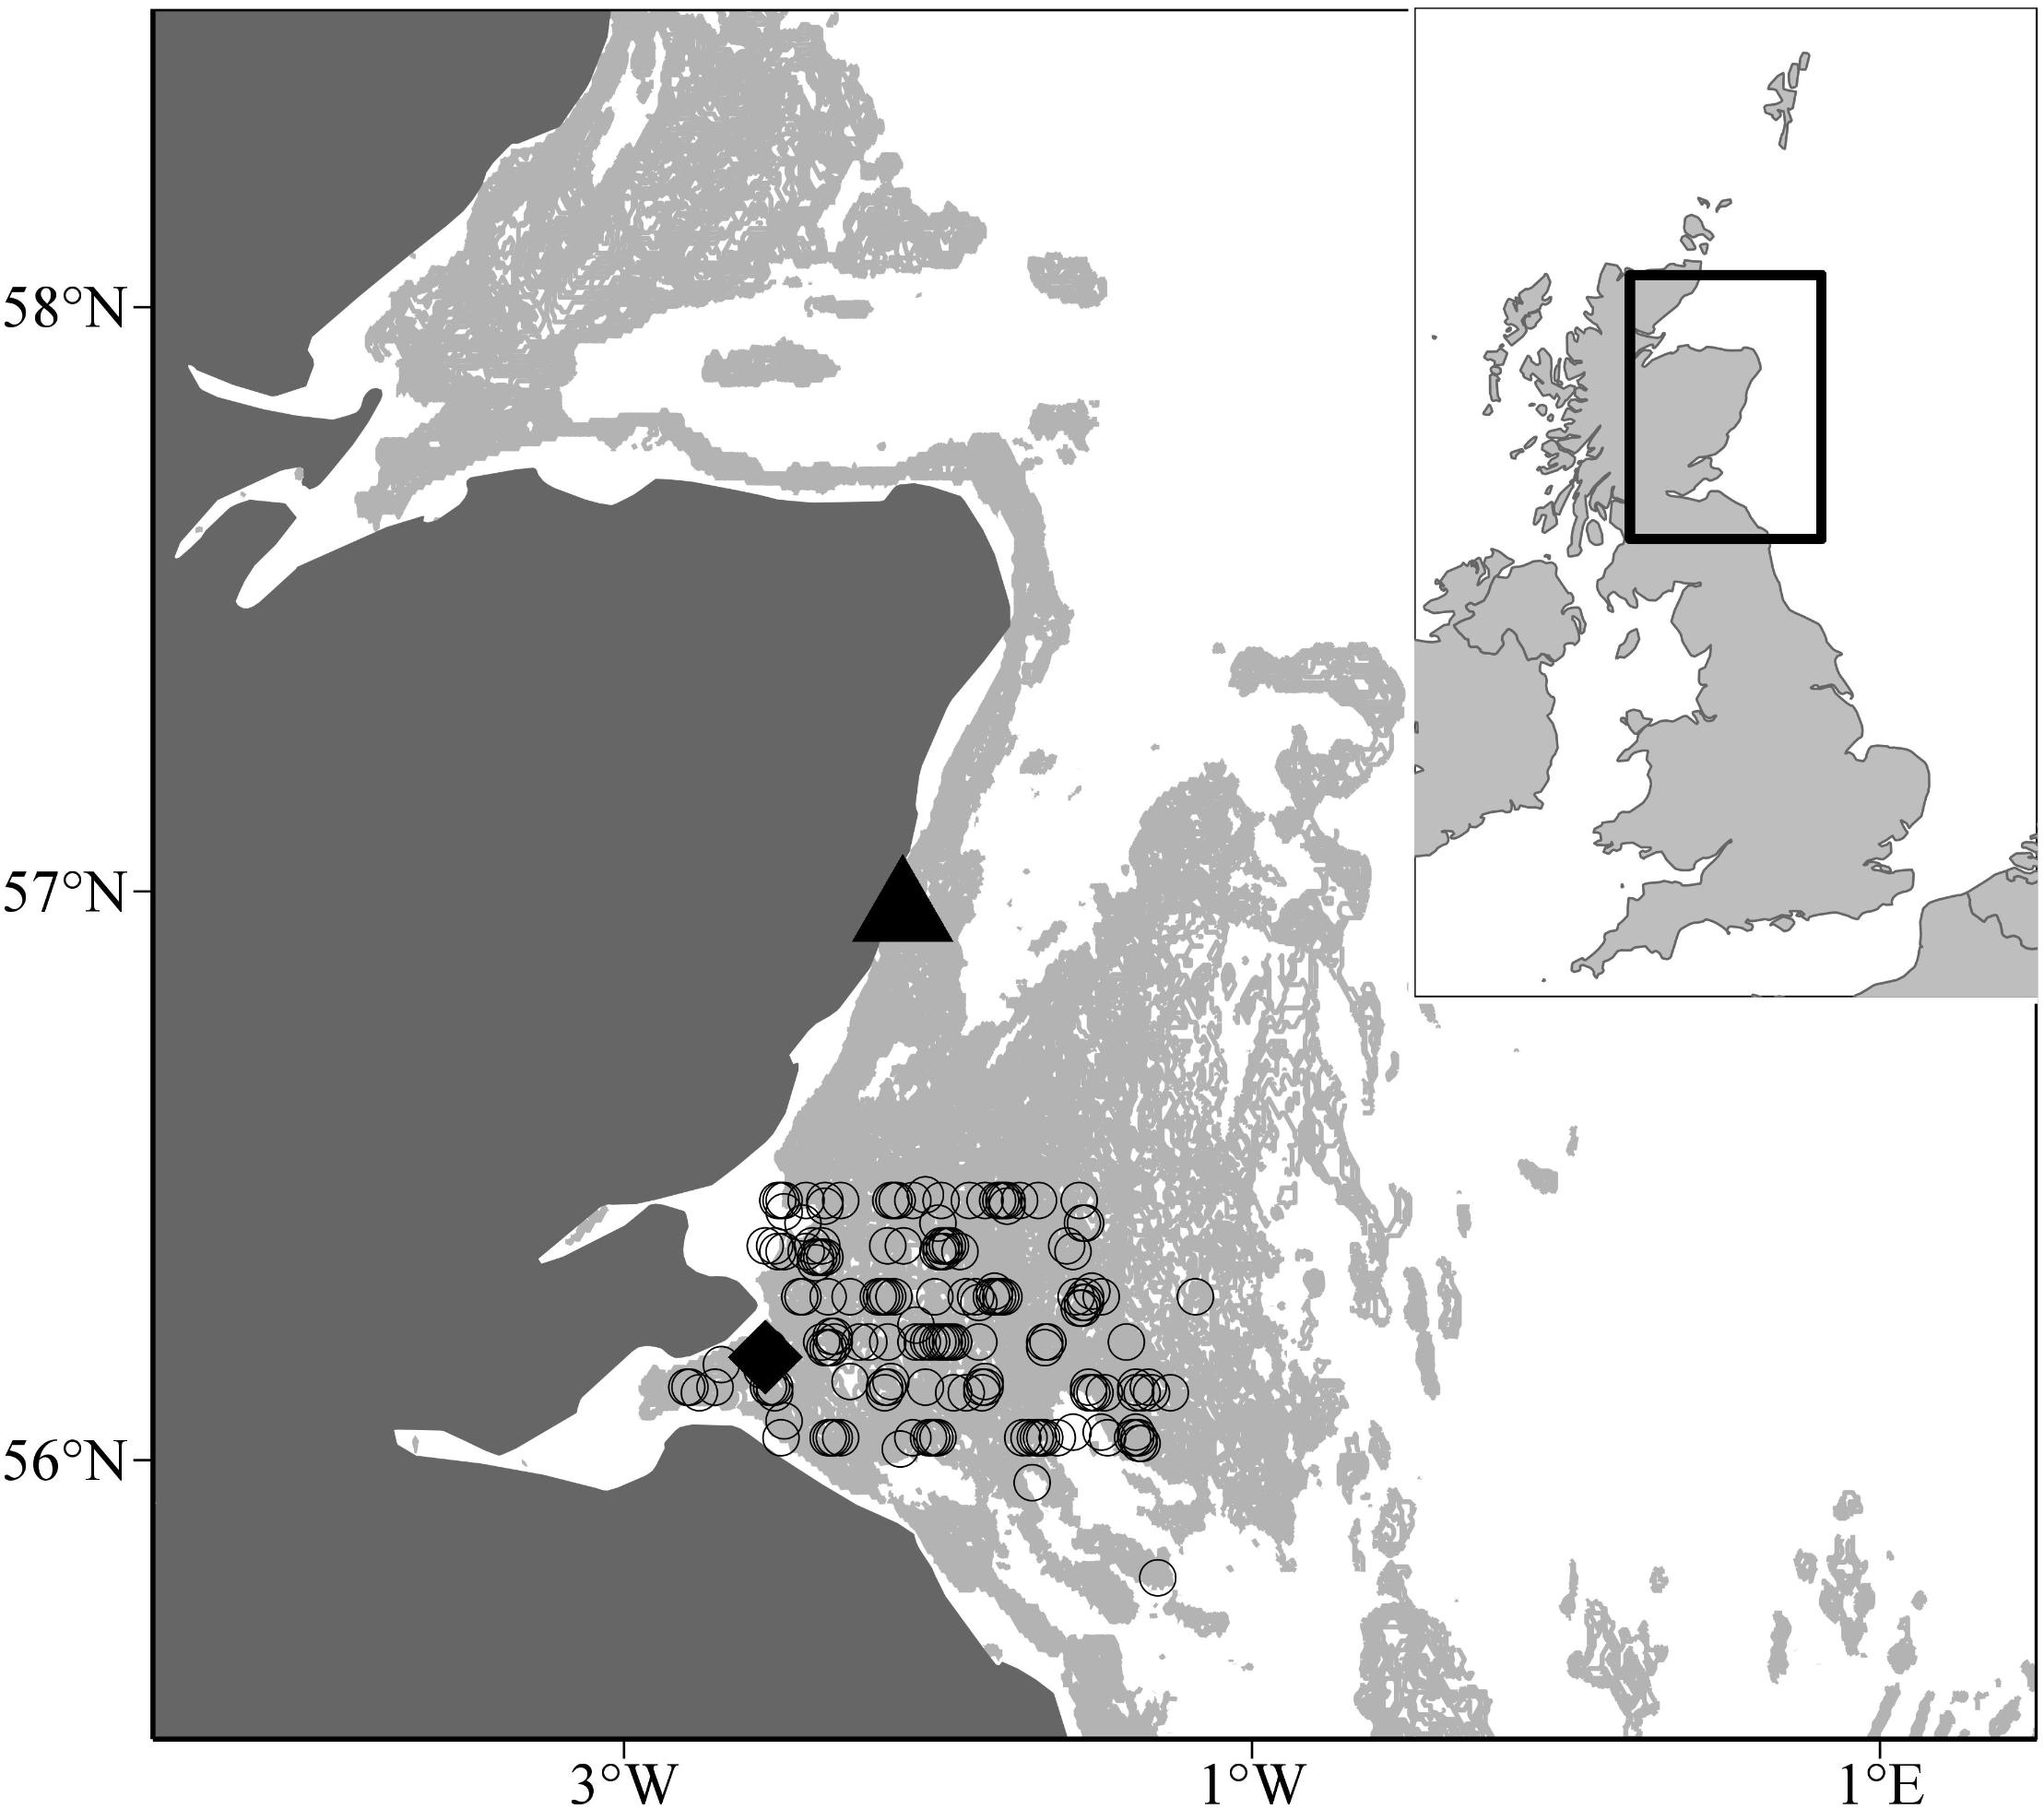
Figure 1. Pelagic trawl locations off the Scottish east coast. Open circles represent pelagic trawl locations. The black diamond and triangle denotes the Isle of May seabird colony and Stonehaven, respectively. The pale grey shaded area indicates water depths between 30 and 70 m, the range of depth sandeels are most commonly found (Wright et al., 2000).
Sandeel larval sampling was conducted off the east coast by pelagic trawl between 2000 and 2002 (Figure 2). Small-scale larval sampling took place at Stonehaven off the northeast coast of Scotland between 2000 and 2001 (56° 57.83′N, 002° 06.74′W, water depth = 45 m). Larvae were sampled with a 100 cm mouth diameter net of 350 m mesh. The net was towed obliquely at a speed of 1 m s-1 to within ∼3 m of the seabed depth (45 m). Upon recovery of the net, the whole catch was washed into the cod-end. All sandeel larvae were removed from the catch and identified to species. A. marinus was distinguished from the other sandeel species present in the samples (H. lanceolatus the Greater Sandeel, and A. tobianus) by the absence of dorsal melanophores.
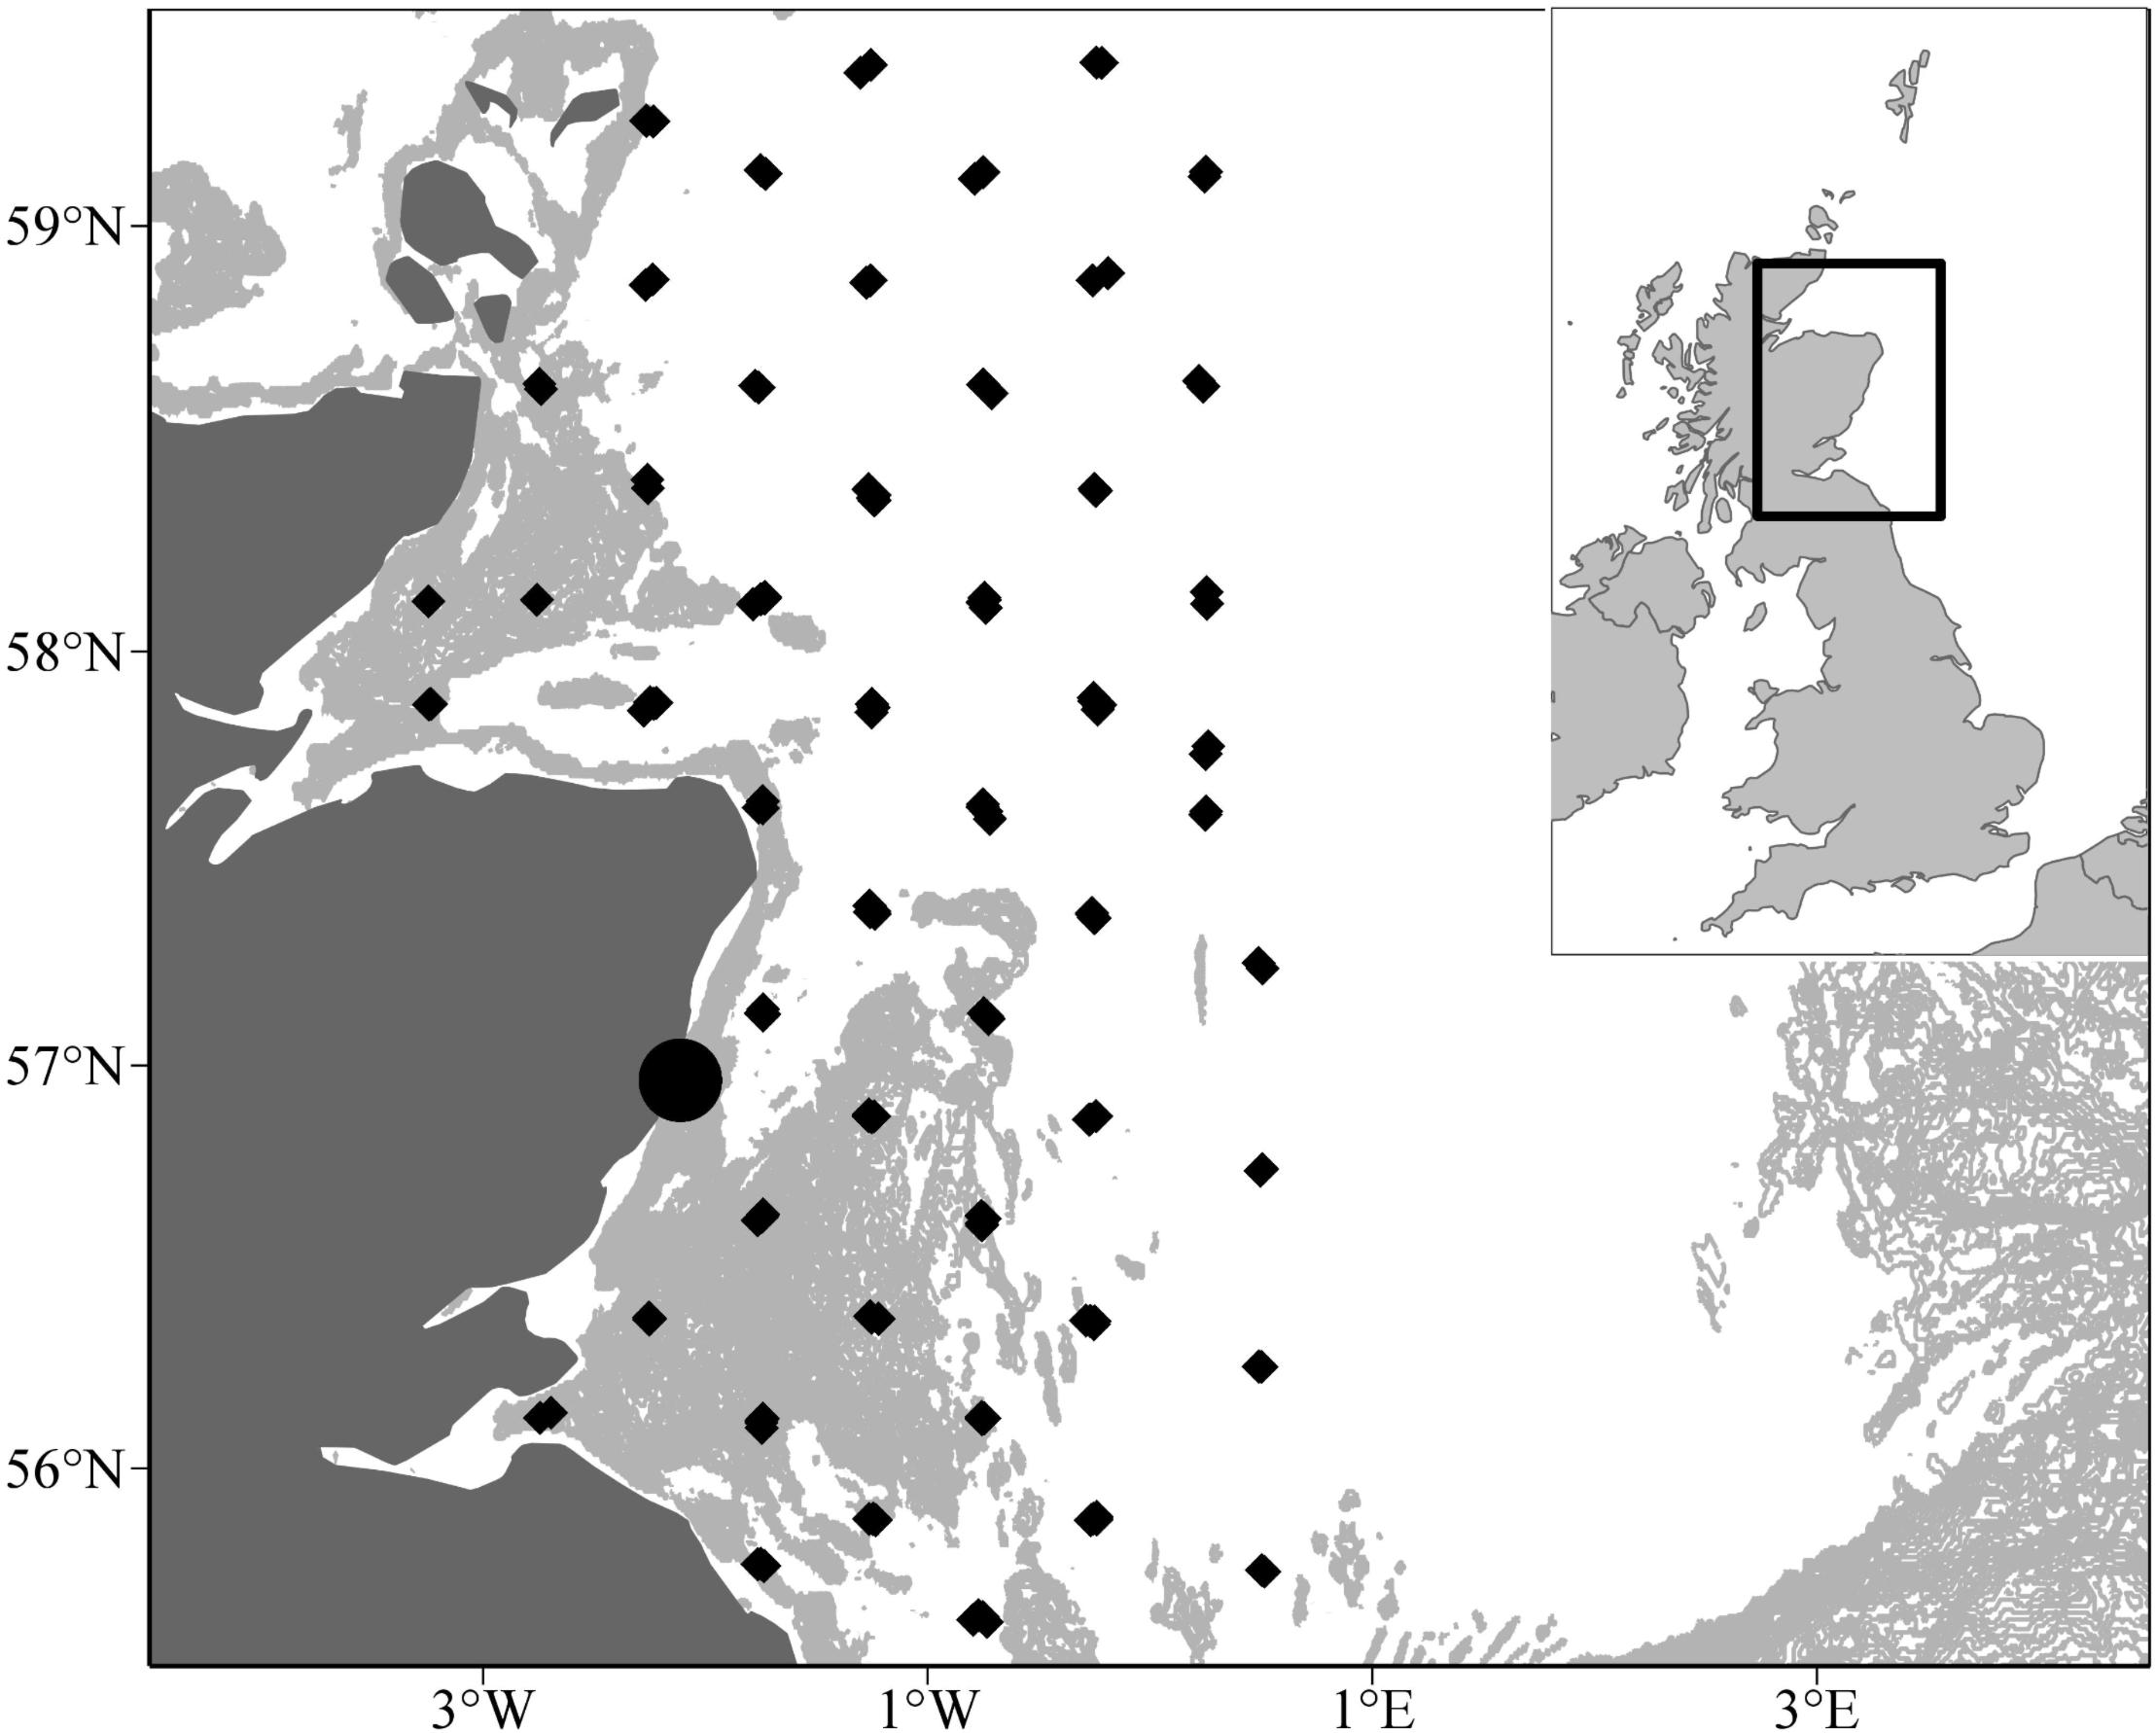
Figure 2. Locations of larval surveys between 2000 and 2002. Larval sampling was conducted at Stonehaven in 2000 and 2001 (circle) and across the northwestern North Sea in 2002 (diamonds).
Large scale sampling of sandeel larvae was undertaken in 2002 across the northwestern North Sea by the FRV Scotia between 9 and 23 April (Figure 2). An ARIES high-speed sampler (Dunn et al., 1993; mouth area 0.1 m2, mesh size 200 m) and opening-closing Methot trawl (mouth area 2.25 m2, mesh size 2 mm) were used to sample small and large sandeel larvae, respectively. All sandeel larvae were extracted from the samples and preserved in 4% formaldehyde. A. marinus larvae were measured to the nearest 0.1 mm in standard (notochord) length. A subset of fish was selected for otolith analysis. Daily increments on larval sagitta otoliths were used to calculate sandeel age (Wright, 1993).
In addition, weekly chlorophyll and zooplankton sampling was carried out at Stonehaven between 1997 and 2008, and 1999 and 2013, respectively (Supplementary Figure S1 and S2). Chlorophyll concentration mg m-3 was determined by collecting a 10 m integrated hose sample from the surface. To ensure natural “clumping” of chlorophyll in the surface layer would not give a misleading estimation of concentration, the water was mixed before being transferred to bottles. Analysis was done using a spectrophotometer. Timing of the spring bloom was defined as the Julian day at which chlorophyll concentration in the surface layer exceeded 2 mg m-3 for five consecutive days (Scott et al., 2006). To determine zooplankton concentration (mg m-3), a 1 m ring net fitted with a 350 μm mesh size net was towed obliquely from a depth within 3 m of the seabed (45 m) to the surface. Plankton were identified to species and dry weight measurements taken. For full details, see Bresnan et al. (2016).
Otolith Analysis
Length-stratified subsamples of juveniles and adults were taken and otoliths were extracted to determine age length keys for each cruise. Total lengths (anterior tip of maxillae to tip of caudal fin) of a random sample of fish were accurately determined to 0.5 cm. A subsample was then removed for age determination. The sequence of annual rings – marked changes in opacity caused by periods of fast and slow growth – formed on sandeel otoliths (ICES, 1995) was used to determine age. These were identified using a microscope under reflected light by experienced readers. Table 1 shows the number of otoliths collected by pelagic trawling between 1997 and 2009 (excluding 2004 and 2007).
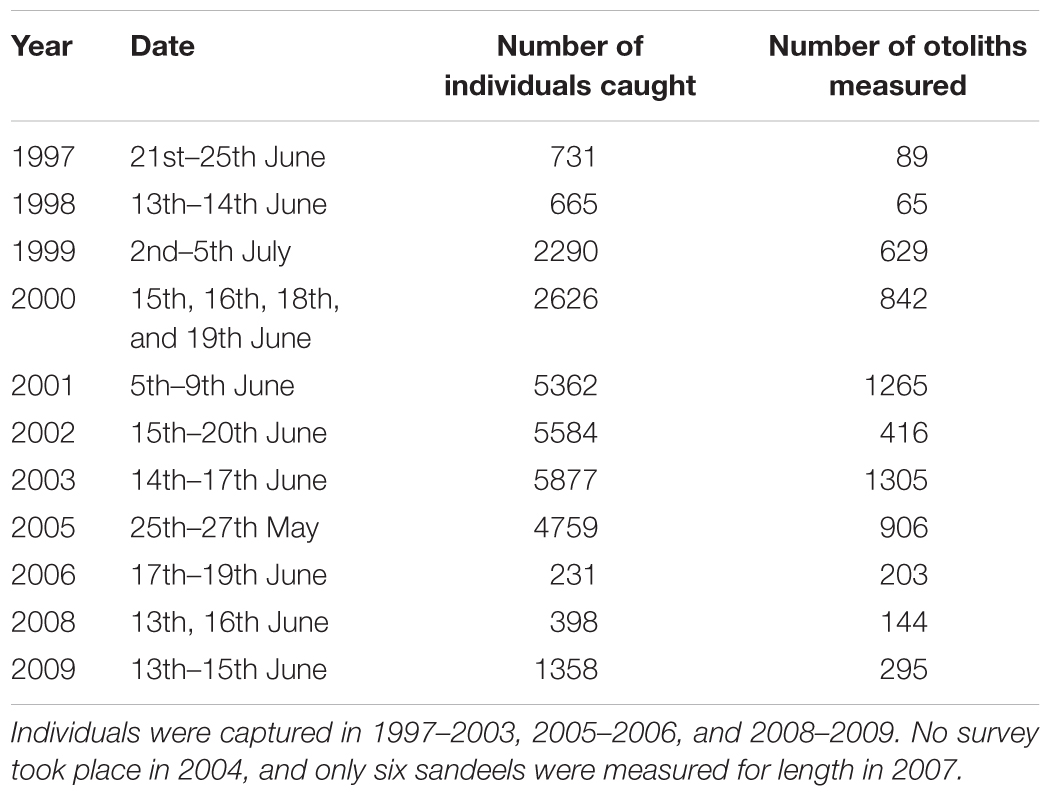
Table 1. The number of sandeels caught and aged from pelagic trawls.
Estimation of Sandeel Abundance
Sandeels are constantly in motion between the sediment and pelagic, and the relative amount in each part is highly variable (Greenstreet et al., 2006, 2010b). This means that the pelagic trawl data cannot be directly used to estimate sandeel abundance. The demersal trawl and acoustic surveys do provide estimates of sandeel biomass in the sediment and water column, respectively (Greenstreet et al., 2006). However, they need to be augmented with pelagic trawl data if one wishes to estimate sandeel length and weight composition. This is because, in contrast to other survey methods, pelagic trawling samples most of the length composition and does not appear to be subject to length-dependent catchability (MacDonald, 2017). Therefore, the estimation of sandeel abundance at a given length, weight, and age requires the integration of demersal, trawl, and acoustic data. Abundance is estimated by first using the sandeel length composition from pelagic trawl data to produce abundance at length, weight and age, then applying correction factors to bring the pelagic trawl biomass-at-age in line with the combined demersal and acoustic estimates of biomass-at-age.
The procedure to estimate sandeel abundance is schematized in Figure 3. First, an age-length key was used to estimate the probability of age-given length. Probability distributions of ages for each 5 mm length class were determined using the continuation-ratio logit method for each survey (Kvist et al., 2000; Rindorf and Lewy, 2001; Stari et al., 2010). Then, changes in distribution of age at a given length, as a function of length, were estimated using Generalised Linear Modelling. Fitting was performed using Maximum Likelihood code (Stari et al., 2010). The resultant probability matrices of age-given-length were multiplied by the length frequency of sandeels caught in all trawls to produce an estimate of the abundance at length and age. Then we applied a year-specific weight at length relationship to the matrix of abundance and age and length. This produced a matrix of abundance at age and weight. From this data, we extracted biomass at age. While these biomass-at-age matrices give accounts of biomass caught by trawling, they are not a measure of biomass at the scale of the Firth of Forth sandbanks (Figure 1). To obtain the true biomass of sandeels in the study area, correction factors must be applied to biomass-at-age-and-length matrices. Greenstreet et al. (2010a) measured the biomass of Firth of Forth 0-group and 1+ group sandeels between 1997 and 2009. Correction factors are derived using these estimates and are estimated in the following way:
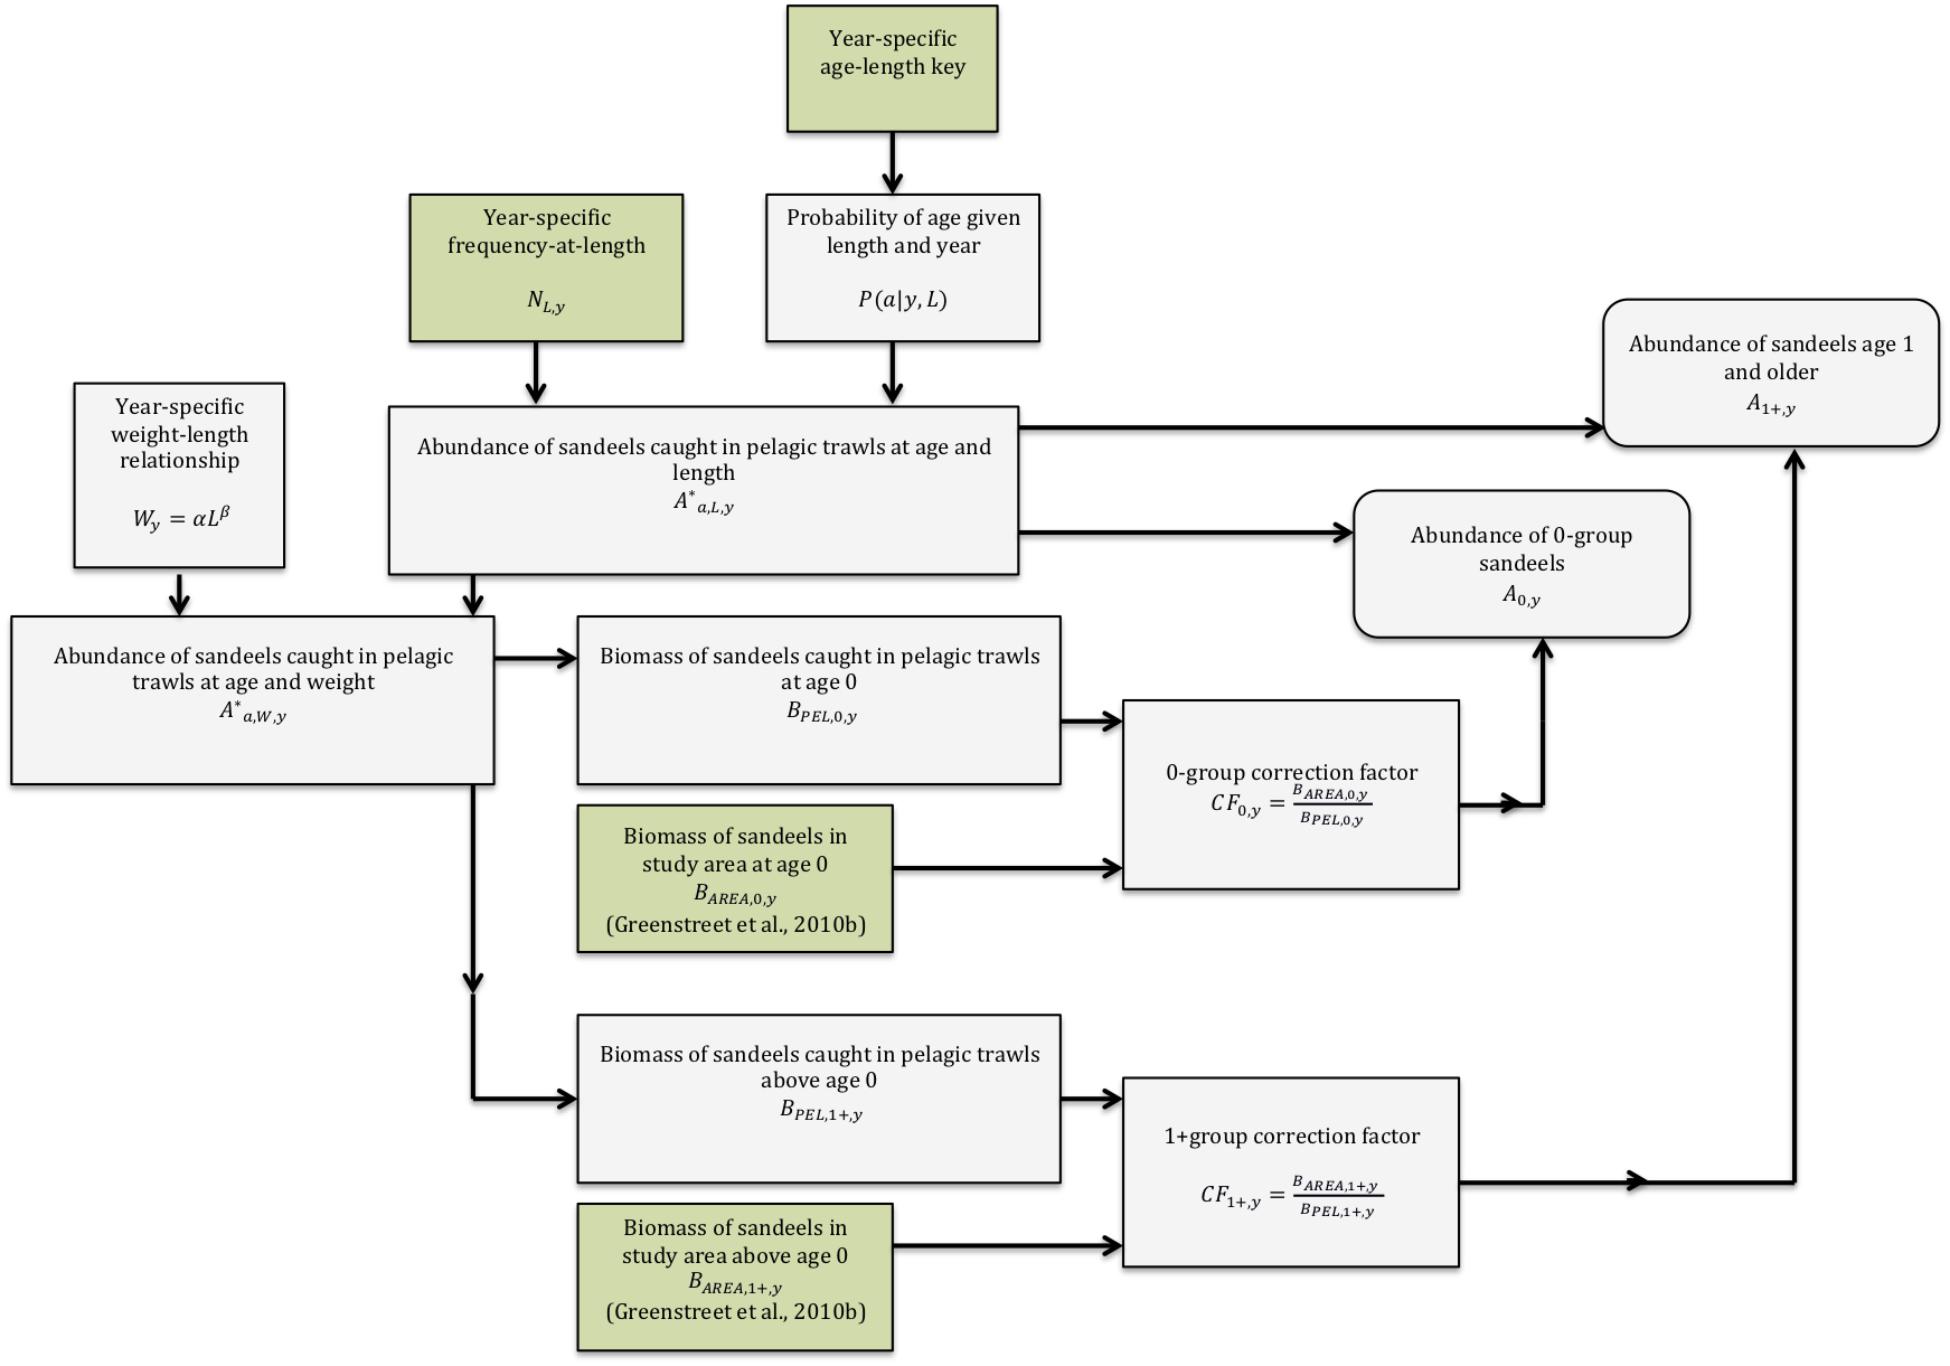
Figure 3. Schematic of the method to estimate sandeel abundance. Input data and modelled data are highlighted in green and grey, respectively.
0-group biomass at year in the pelagic trawl (BPEL,0,y) is related to 0-group biomass at year y in the study area (BAREA,0,y) using a correction factor (CF0,y),
The biomass of 1+ group sandeels in the study area is found in a similar way, using a correction factor for 1+ group sandeels (CF1+,y)
Hence,
Next, abundance-at-length-and-age matrices of sandeels caught by trawling were multiplied by the appropriate correction factors defined above to give abundance-at-age-and-length of sandeels in the study area. From this, mean length-at-age for a cohort was calculated. Trends in length at age over time were estimated using linear and piecewise regression. Further, estimates of annual mortality rates (year-1) were derived for each combination of age and year. Mortality rates were estimated in the following way. First, we divided the abundance of age class a + 1 in year y + 1 by the abundance of age class a in year y, which produced an estimate of annual survival rate. Mortality rate is then given by 1- survival rate.
Estimating Growth Rates From Length-at-Age Data
Fish usually grow according to the von Bertalanffy law (von Bertalanffy, 1938), That is, growth rate decreases with time, eventually becoming zero, Interannual variation in growth rates can be directly attributed to environmental changes. This is because the von Bertalanffy equation is derived from first principles on how food and temperature influences ingestion and metabolism.
The standard von Bertalanffy equation is written as
where L(a) is the length at age (years), L∞ is the asymptotic length (cm), k is the rate at which length reaches the asymptotic length (year-1) and a0, is the age at which length is zero. a0 is usually treated a fitting parameter and usually does not have any biological meaning. The von Bertalanffy law is limited because it assumes a constant environment over an animal’s lifespan. However, due to its simplicity and usefulness in determining animal growth rates over a long time scale, it is widely used in ecology.
Due to the usually negative statistical and biological correlation between k and L∞ (Pilling et al., 2002; Kimura, 2008) it may be unwise to compare differences in growth to changes in k alone. k is a measure of how quickly a population reaches L∞ therefore having a high growth rate k may have limited benefits if the asymptotic length L∞ is low. To account for correlation between k and L∞, we compare differences in cohort growth rates using the growth performance index ϕ′ suggested by Pauly and Munro (1984).
Relationships Between Growth and Trophic/Environmental Variables
Growth performance indexes ϕ′ for all cohorts were compared with SST, chlorophyll abundance and zooplankton abundance. Mean monthly SST for the post-metamorphic sandeel sampling area (56° 00′N and 56° 30′N and longitudes 003° 00′W and 001° 00′W, Figure 1) between 1997 and 2010 was downloaded from the Hadley Centre, United Kingdom Met Office1. Chlorophyll and zooplankton samples were taken in Stonehaven (56° 57.83′N, 002° 06.74′W, Figure 1) between January 1997 and December 2010, and between January 1999 and December 2010, respectively. For full details on sampling methods, see Bresnan et al. (2016). Copepod abundance was grouped by species and stage.
We investigated relationships between ϕ′ and the average chlorophyll concentration (mg m-3) between March and June, the primary sandeel foraging period. This consisted of a linear model that took the form lm(gy ∼ Ct), where gy is cohort growth performance index ϕ′ for sandeels born in year y and Ct is the mean chlorophyll concentration (mg m-3) between year y and year y + t.
Similarly, relationships between ϕ′ and the concentration of zooplankton species between March and June were explored. This consisted of a linear model that took the form lm(gy ∼ Zi,t), where gy is cohort growth performance index ϕ′ for sandeels born in year y and Zi, t is the mean biomass concentration (mg m-3) of zooplankton species i between year y and year y + t. Relationships between ϕ′ and SST were explored using a similar method.
Relationship Between Larval Growth and 0-Group Length
Sandeel larval growth rate in 2000, 2001, and 2002 (sampling locations in Figure 2) was estimated by assuming a linear relationship between age a (days) and length l (mm)
where g is larval growth rate (mm d-1) and l0 is larval length at hatch day.
To assess whether larval growth rate and 0-group sandeel length was correlated during the stock decline g was related to 0-group length in June (L(a) = L(0)). A significant relationship would provide evidence that a long-term decline in 0-group length at date is being driven by a reduction in growth rate.
Probability of Maturation at Age 1
Maturation occurs in July (Boulcott and Wright, 2008) with length being a major determinant (Boulcott et al., 2007). Quantifying the probability of maturation at age 1 is important since few sandeels mature before age 1 and the stock is primarily composed of fish younger than age 2 (Pedersen et al., 1999). This is possible using a published relationship of probability of maturation given length (crosses and dashed line in Figure 2; Boulcott et al., 2007). The probability of maturation, P(m), can be expressed as a logistic equation of the form
m1 determines the shape of the logistic curve and m2 is the length at which 50% of sandeels reach maturity. The model was fitted to maturation-at-length data (crosses in Boulcott et al., 2007), producing parameter estimates of m1 = 1.41 and m2 = 10.66 (R2 = 0.996, n = 12).
Mean lengths at age 1 in June are extracted using equation 3 and the corresponding probability of maturation is found using the relationship in Boulcott et al. (2007).
Results
Length Distributions
A total of 33,412 sandeels were measured for length from pelagic trawls between 1997 and 2009. Due to low levels of sandeel detected acoustically in the water column, only six sandeels were caught by pelagic trawl in 2007. This year was therefore excluded from analysis. Annual length distributions revealed a consistent bimodal pattern through the study period (Figure 4). Although some distributions appear polymodal, all had 2 main peaks, representing 0-group fish and older fish, with the exception of 2008 when no 0-group sandeels were caught (in 2008 no 0-group otoliths were measured and sampled sandeels were >12 cm).
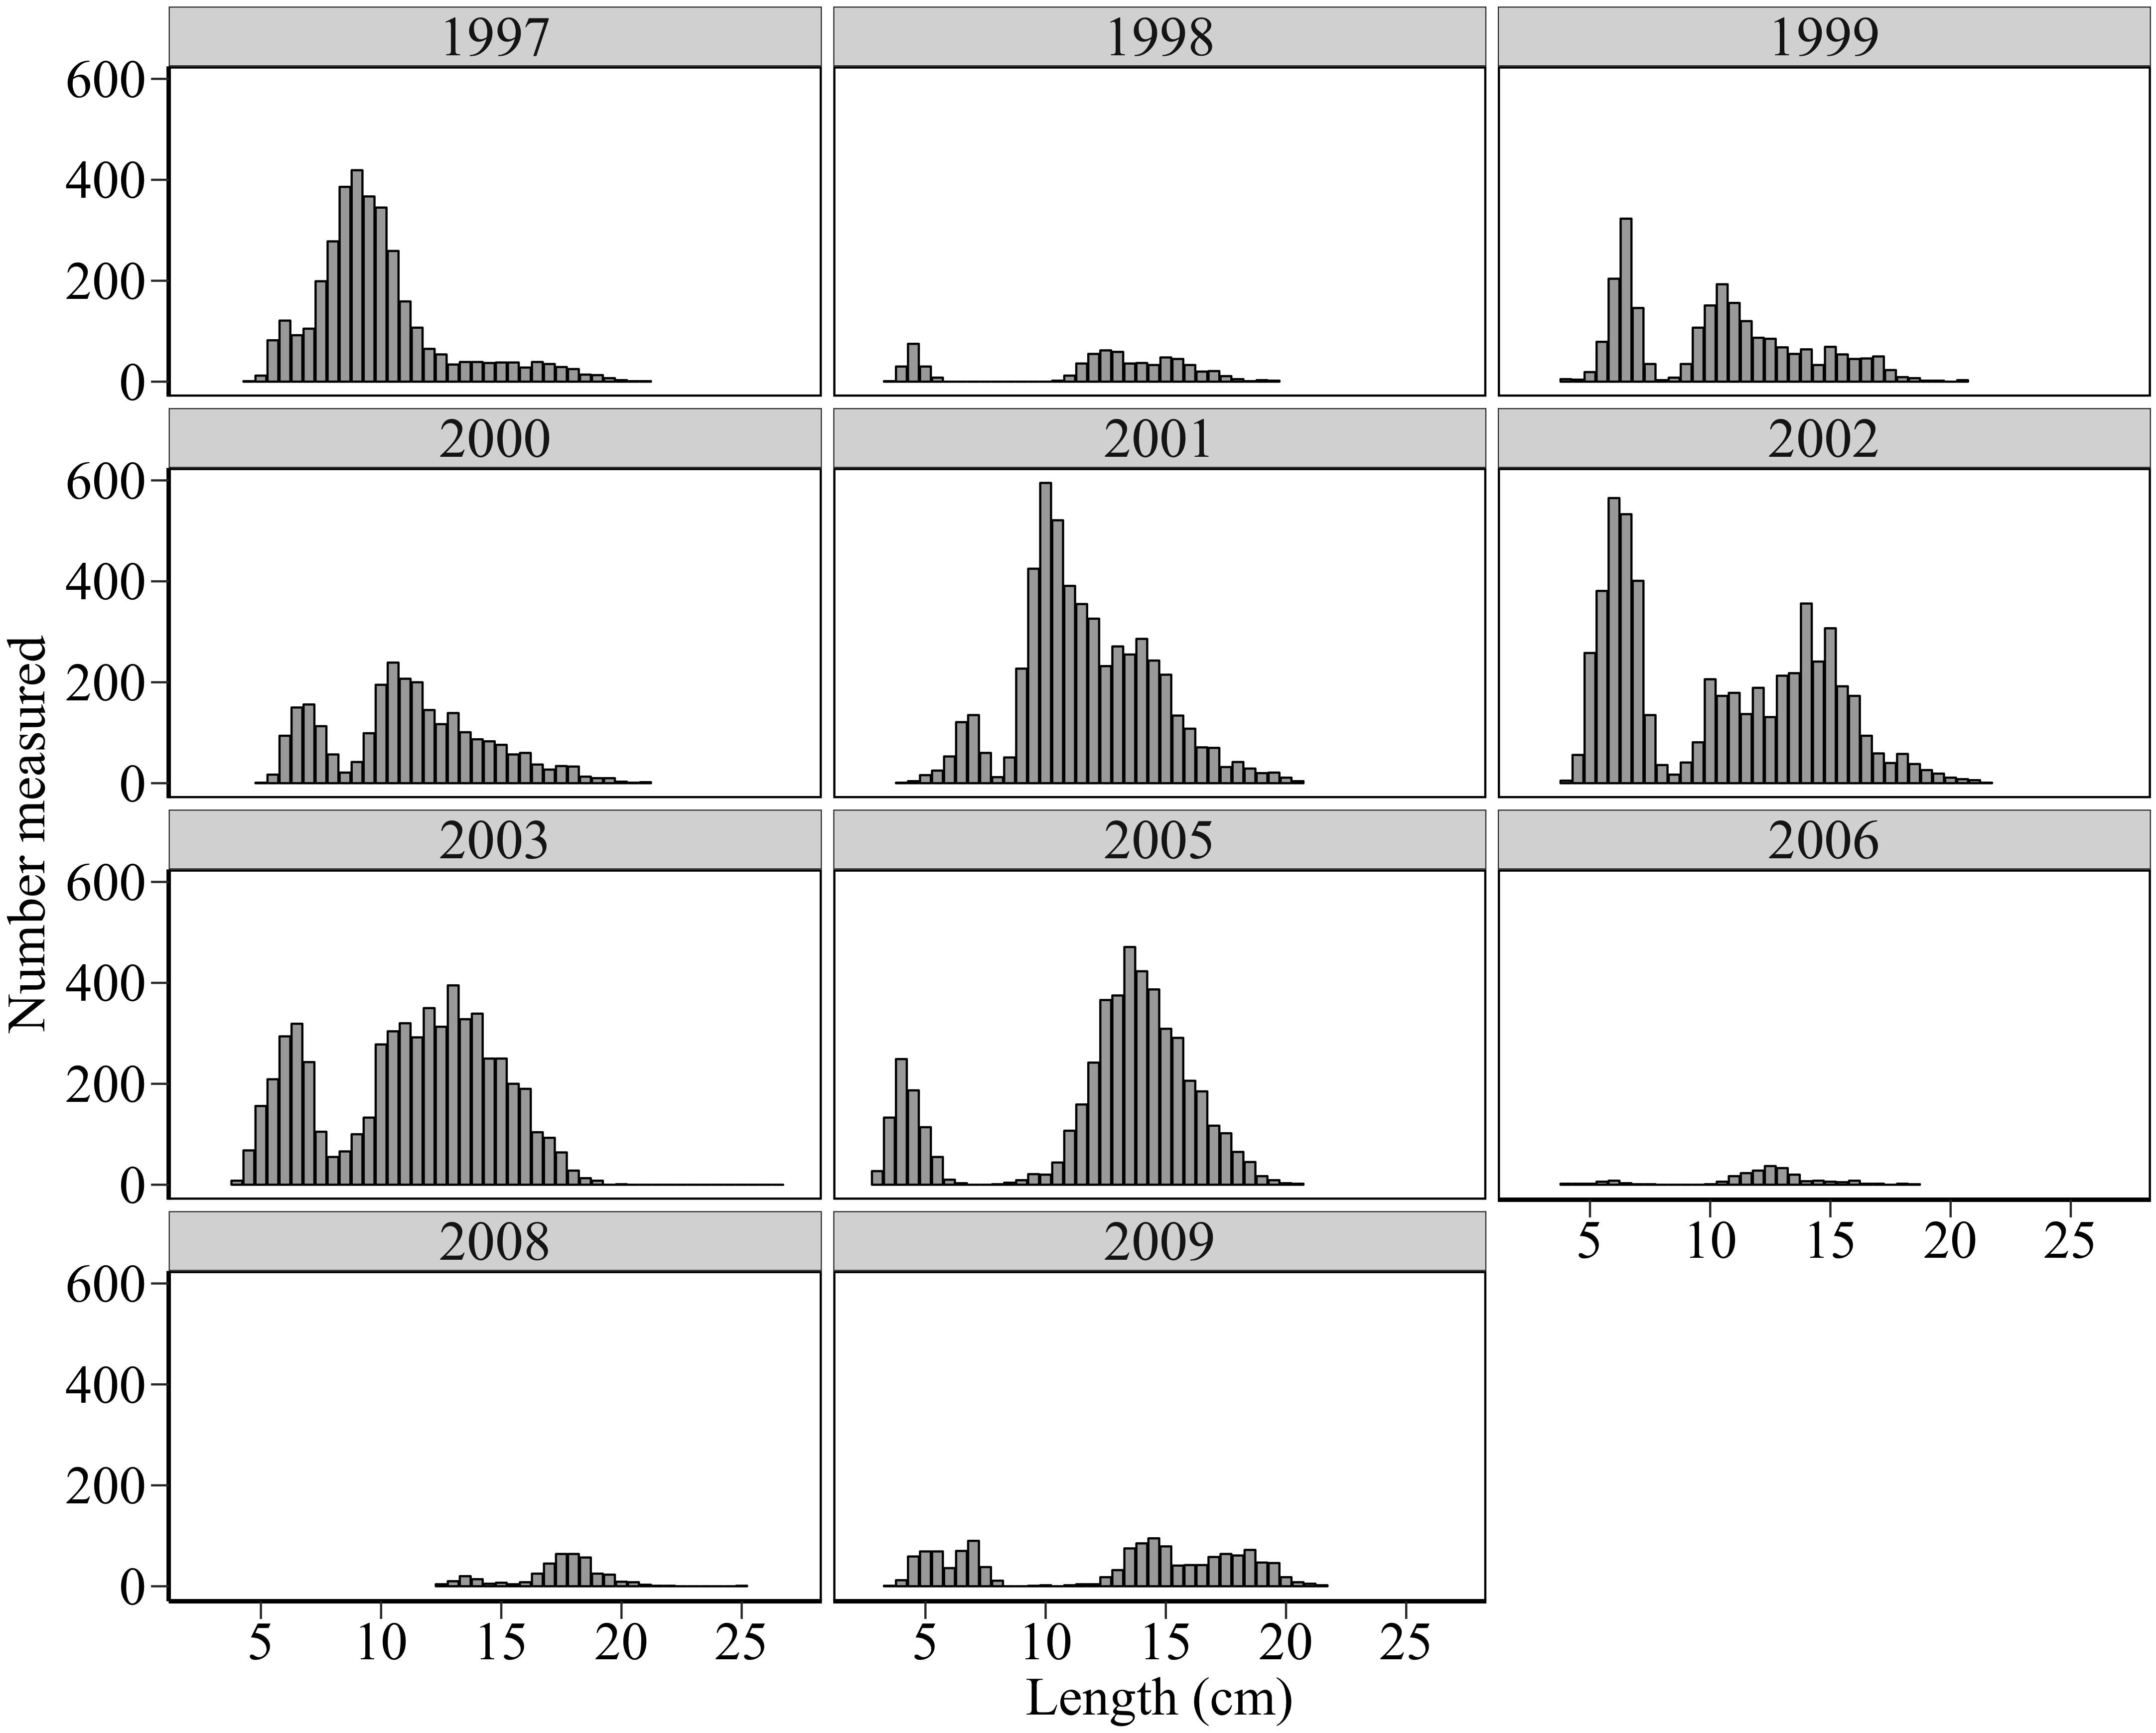
Figure 4. Length frequency distributions (number measured at length) of sandeels in pelagic trawl samples.
Sandeel Abundance
Analysis of stock abundance-at-age revealed a decline in 1+ group numbers between 2000 and 2009 (R2 = 0.7, p < 0.01, n = 8, Table 2). This was caused by a decrease in 1-group abundance (R2 = 0.63, p < 0.02, n = 8). No other age class declined during the study period (p > 0.05). On average, 0-group were eight times more numerous than age 1 fish between 2000–2003 and 2005–2006, with 1-group fish being over three times more abundant than 2-group sandeels. Individuals older than age 2 constituted an average of less than 2% of the stock emphasising the importance of young age classes.
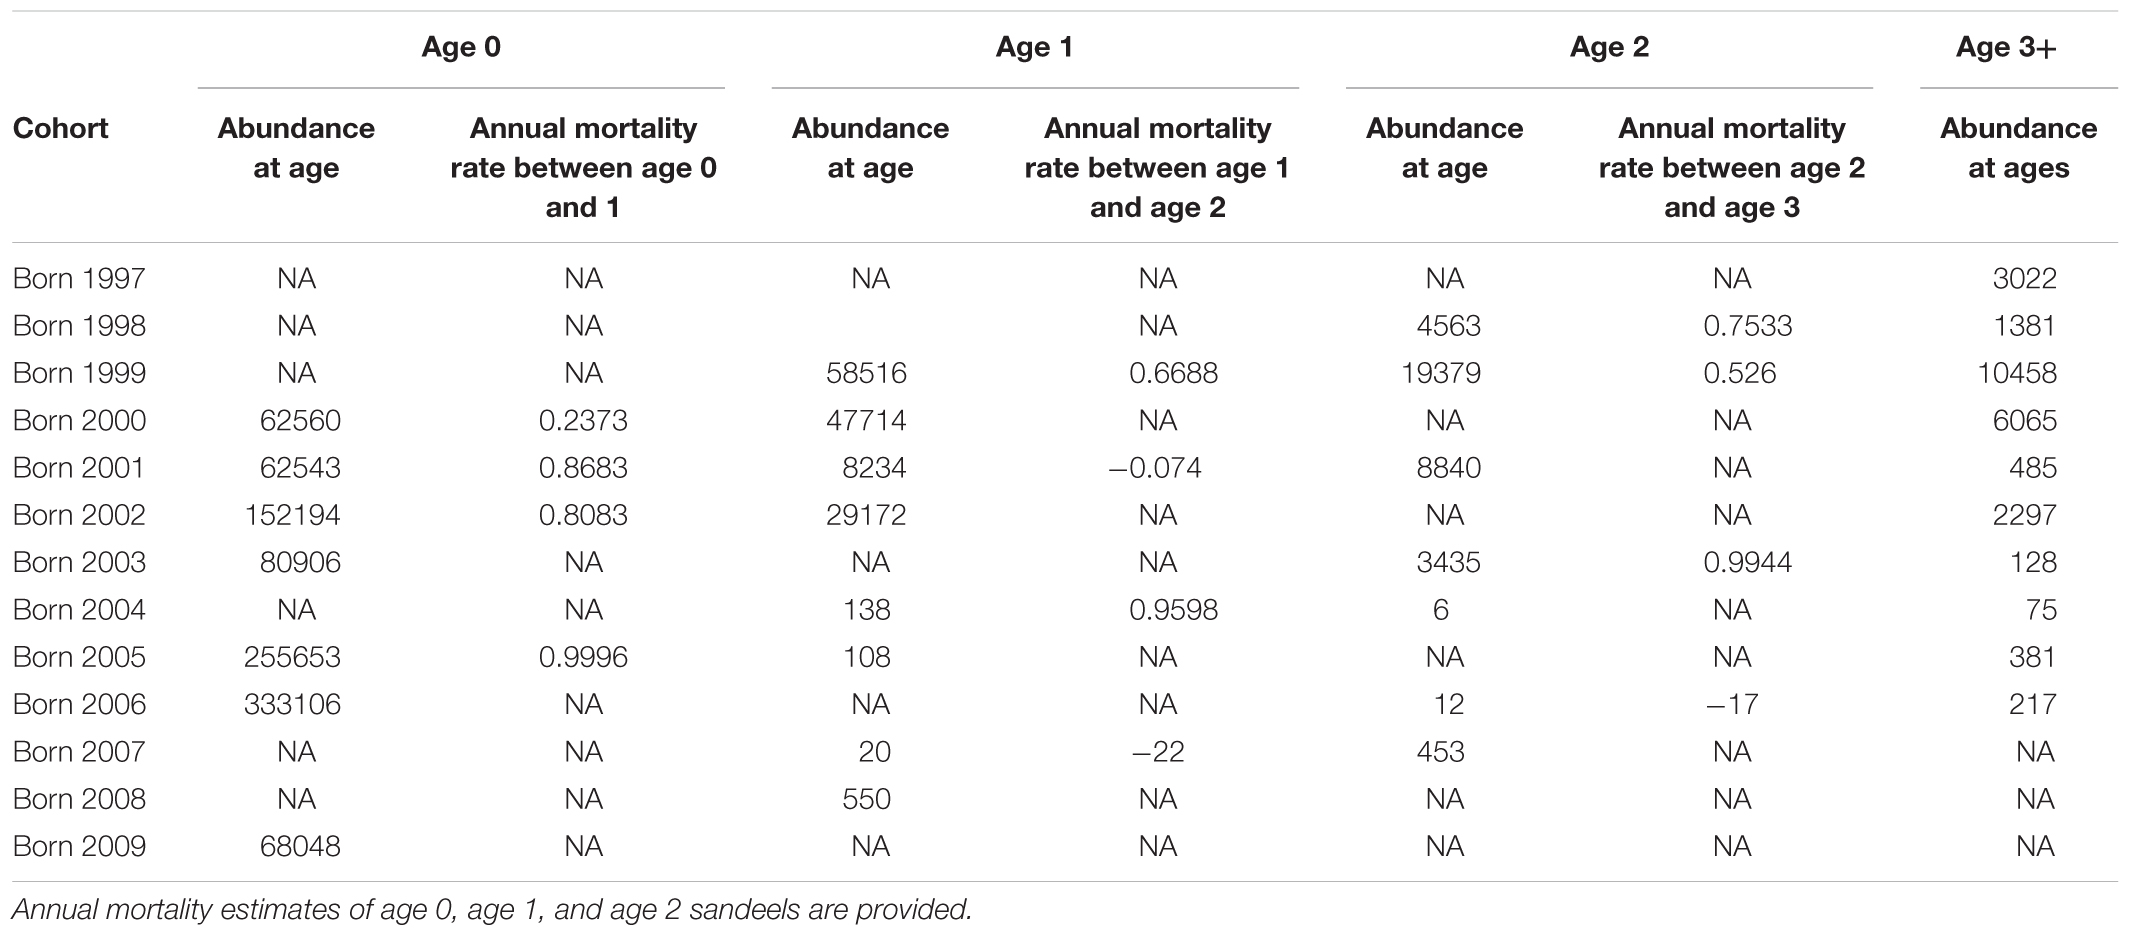
Table 2. Sandeel abundance (millions) and annual mortality rates (year-1) in the study area by age class and birth year.
There was marked variation in cohort mortality-at-age and mortality-at-year (Table 2). For example, between summer 2000 and summer 2001, 0-group and 1-group sandeels suffered annual mortality rates of 24 and 67%, respectively. However, between summer 2005 and the following summer, 0-group and 1-group sandeels suffered much higher annual mortality rates of 99.96% and 95.98%, respectively.
Changes in Growth Rate Between 1997 and 2006
There was a pattern of decreasing length between 1997 and 2005 and increasing length between 2005 and 2009 for most age classes (Figure 5). Piecewise linear regression identified break points for several age classes. Significant break points were found for lengths of age 1, age 2, age 5, and age 6 sandeels in 2002, 2005, 2007, and 2005, respectively.
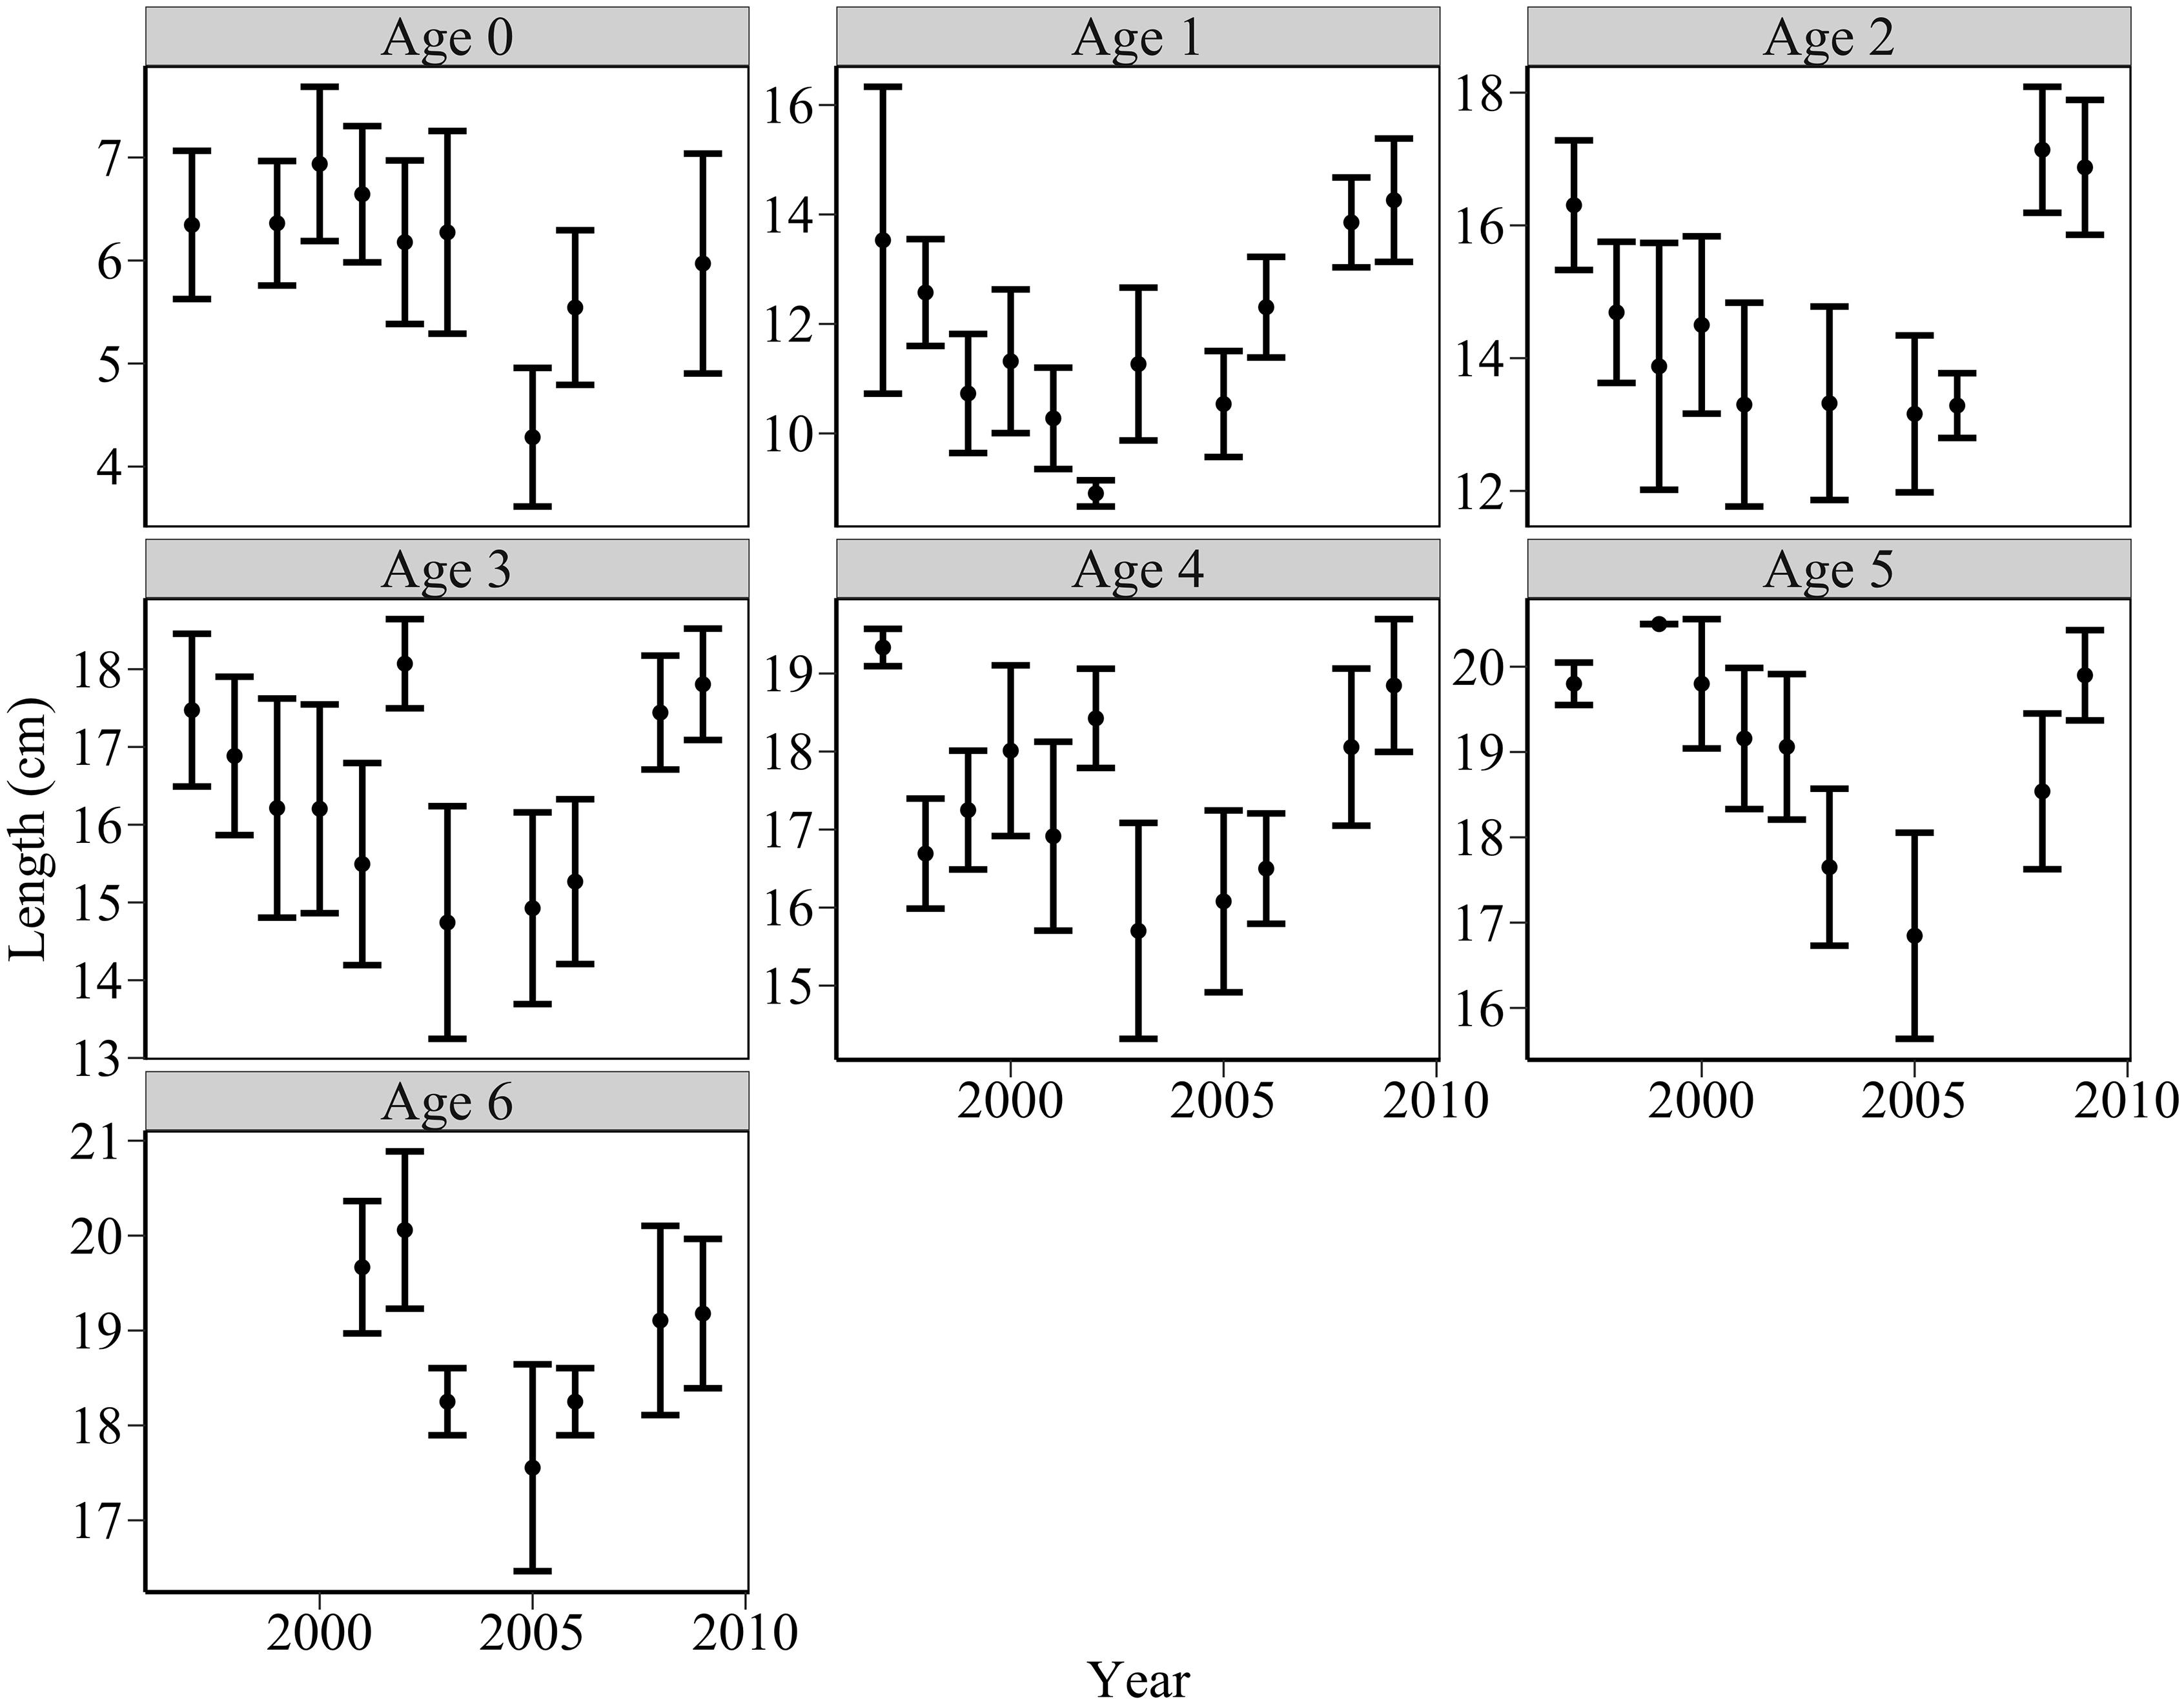
Figure 5. Changes in sandeel mean length at age between 1997 and 2009 off the Firth of Forth (black points), estimated from pelagic trawl data. Error bars indicate ±1 standard deviations. Length at age decreased between 1997 and 2005, and increased between 2005 and 2009.
Figure 6 shows von Bertalanffy fits to mean length data. Marked variation in cohort growth trajectories reflected variation in von Bertalanffy growth parameters L∞ and k (Figure 7). There was marked variation in parameters L∞ and k over the study period. k varied from 0.126 year-1 in 2004 to 1.308 year-1 in 2006. In biological terms, this meant that sandeels born in 2006 approached their maximum asymptotic length at a rate 10 times faster than individuals born in 2004. An outlier test revealed that the growth parameter k for sandeels born in 2006 was statistically different (p < 0.02). The asymptotic length of cohorts (L∞) varied from 17.95 cm in 1999 to 34.25 cm in 2004. Outlier tests revealed that the asymptotic lengths L∞ for sandeels born in 2004 were statistically different (p < 0.0002). There was a significant relationship between log 10k and log 10L∞ meaning fast growing sandeels reached lower maximum lengths than slower growing individuals (Figure 7). The model of growth performance proposed by Pauly and Munro (1984) (equation 4) provided a good explanation of the data (ϕ′ = 2.25 = log 10k + 2log 10L∞,p < 0.05, R2 = 0.63). The growth performance index ϕ′ ranged from 2.07 for individuals born in 2000 to 2.63 for individuals born in 2006.
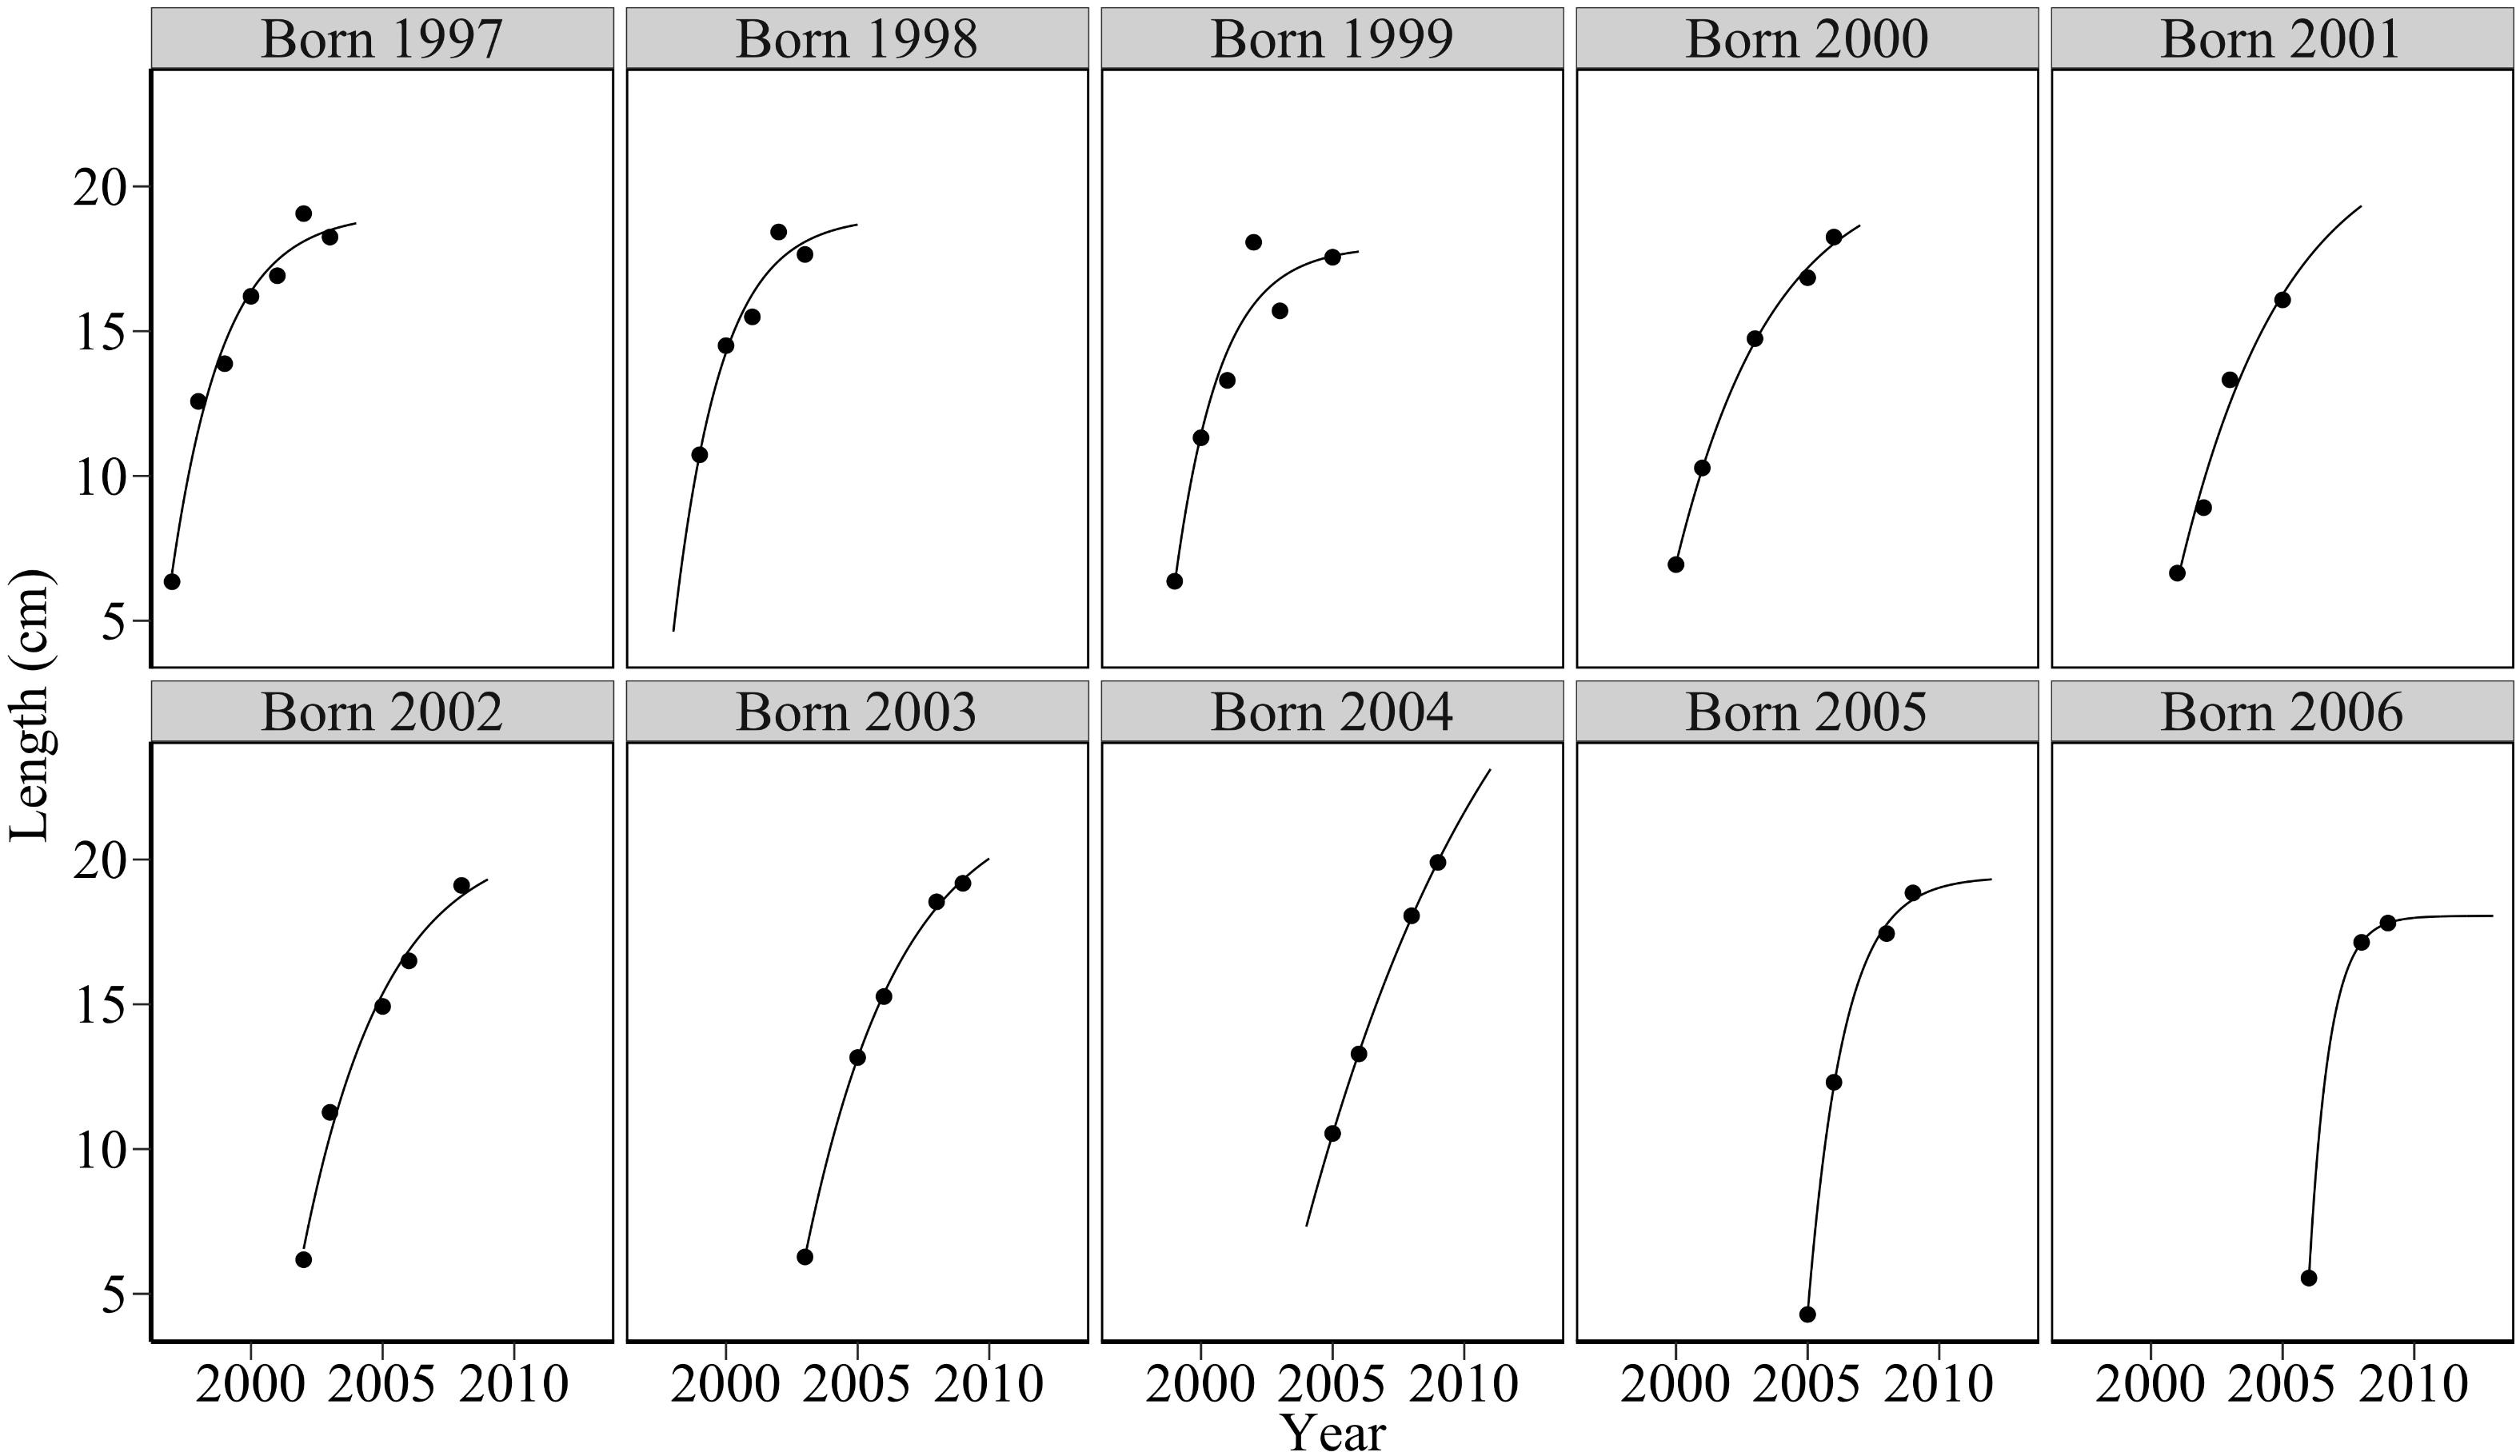
Figure 6. Fitted von Bertalanffy curves for sandeels between 1997 and 2009 off the Firth of Forth. The solid line denotes the von Bertalanffy fit through observed length at age (black points). Marked variation in von Bertalanffy curves indicates corresponding variation in cohort growth parameters k and L∞ throughout the study period.
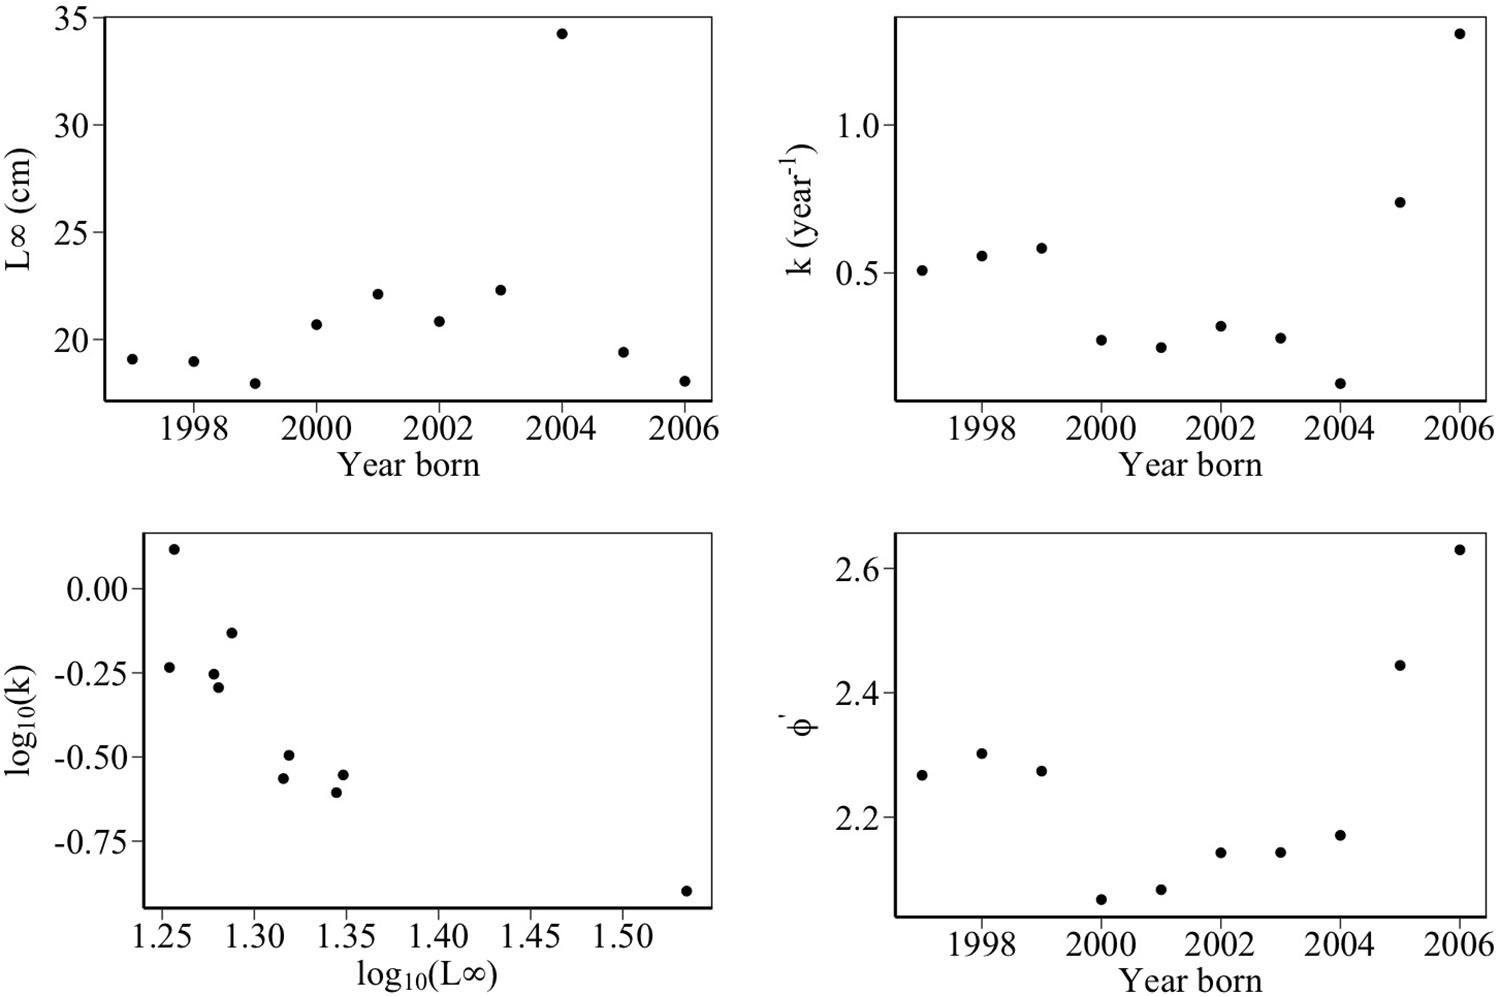
Figure 7. Variation in growth parameters between 1997 and 2009 off the Firth of Forth. The top two panels show changes in growth parameter k and asymptotic length L∞. k was relatively low between 2000 and 2004 but increased rapidly toward the end of the study period. k ranged between 0.13 and 1.31 year-1 over the study period (mean = 0.49 year-1). L∞ ranged between 18 and 34 cm over the study period (mean = 21.4 cm). This large range was due to the year 2004. Excluding this year, L∞ ranged between 18 and 22 cm. The bottom left panel shows a significant negative relationship between log 10(k) and log 10(L∞), suggesting fast growing sandeels reached lower maximum lengths than slower growing individuals. The bottom right panel shows variation in the growth performance index ϕ′, a measure of variation in the growth rates of the different cohorts.
Relationship Between Cohort Growth Rate and Temperature and Plankton Biomass
We tested relationships between the growth performance index ϕ′ and the biomass concentration of various zooplankton species (Supplementary Table S1). Only C. finmarchicus Stages C5–6 and Centropages typicus Stages C1–6 were significantly correlated with ϕ′ for sandeels age 0–2, 0–3, and 0–4 years old (p < 0.05).
Significant relationships were also found for Total Copepod Biomass, Temora longicornis Stages C1–6, C. helgolandicus Stages C5–6, Benthic Larvae, Acartia clausi Stages C1–6, Cnidaria, Oithonidae Stages C1–6, but for only 1 or 2 age groupings of sandeel (Supplementary Table S1). The strongest correlations were found for C. finmarchicus Stages C5–6, C. typicus Stages C1–6, Total Copepod Biomass, T. longicornis Stages C1–6, C. helgolandicus Stages C5–6 and Benthic Larvae (R2 > 0.7).
There was a significant positive relationship between ϕ′ and mean chlorophyll concentration (mg m-3) during the primary sandeel foraging period for sandeels age 0–3 (R2 = 0.35, p < 0.05) and age 0–4 years old (R2 = 0.6, p < 0.01). There was no relationship for sandeels age 0–2 years old (Supplementary Table S2). No statistically significant relationships were found between ϕ′ and annual or spring SST (March–June) in the study area.
Relationship Between Larval Growth and Length of 0-Group Sandeels
Larval length-at-age data revealed marked year-to-year changes in growth rate (Table 3). Between 2000 and 2002, larval growth rate ranged from 0.468 mm day-1 in 2000 to 0.338 mm day-1 in 2002. Metamorphosis dates are estimated by assuming a fixed hatch date and metamorphosis length of 30–55 mm (Cameron, 1958; Macer, 1965; Wright and Bailey, 1996; Jensen, 2001). Tracking forward from median hatch dates between 2000 and 2002 (14th, 17th, and 19th March, respectively), larval growth rates in these 3 years correspond to metamorphosis days of 7th May – 29th June, 19th May – 20th July, and 29th May – 11th August, respectively. Hence, larval phase durations between 2000 and 2002 were 54–107 days, 63–126 days, and 72–145 days, respectively. There was a statistically significant relationship between 0-group length in June (L0) and larval growth rate (g) between 2000 and 2002 (L0 = 4.19 + 5.92g, n = 3, R2 = 0.995, p < 0.04, Figure 8). A 28% reduction in larval growth rate between 2000 and 2002 corresponded to an 11% decrease in mean length in June.
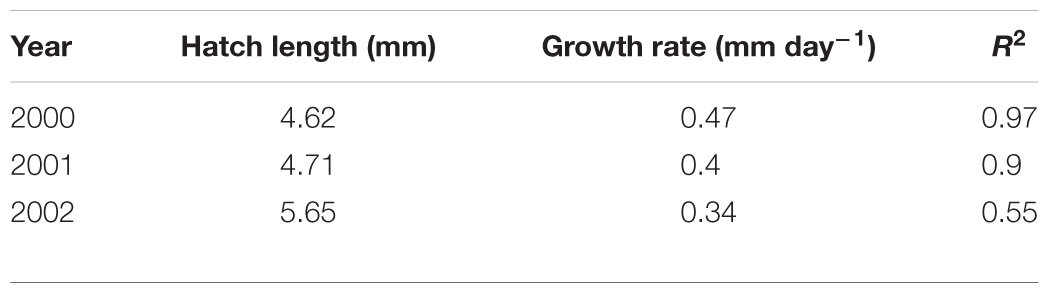
Table 3. Results from linear regressions between age (days) and length (mm) for larval A. marinus (l(a) = l0 + lga). Individuals were caught off the Scottish east coast in 2000, 2001, and 2002.
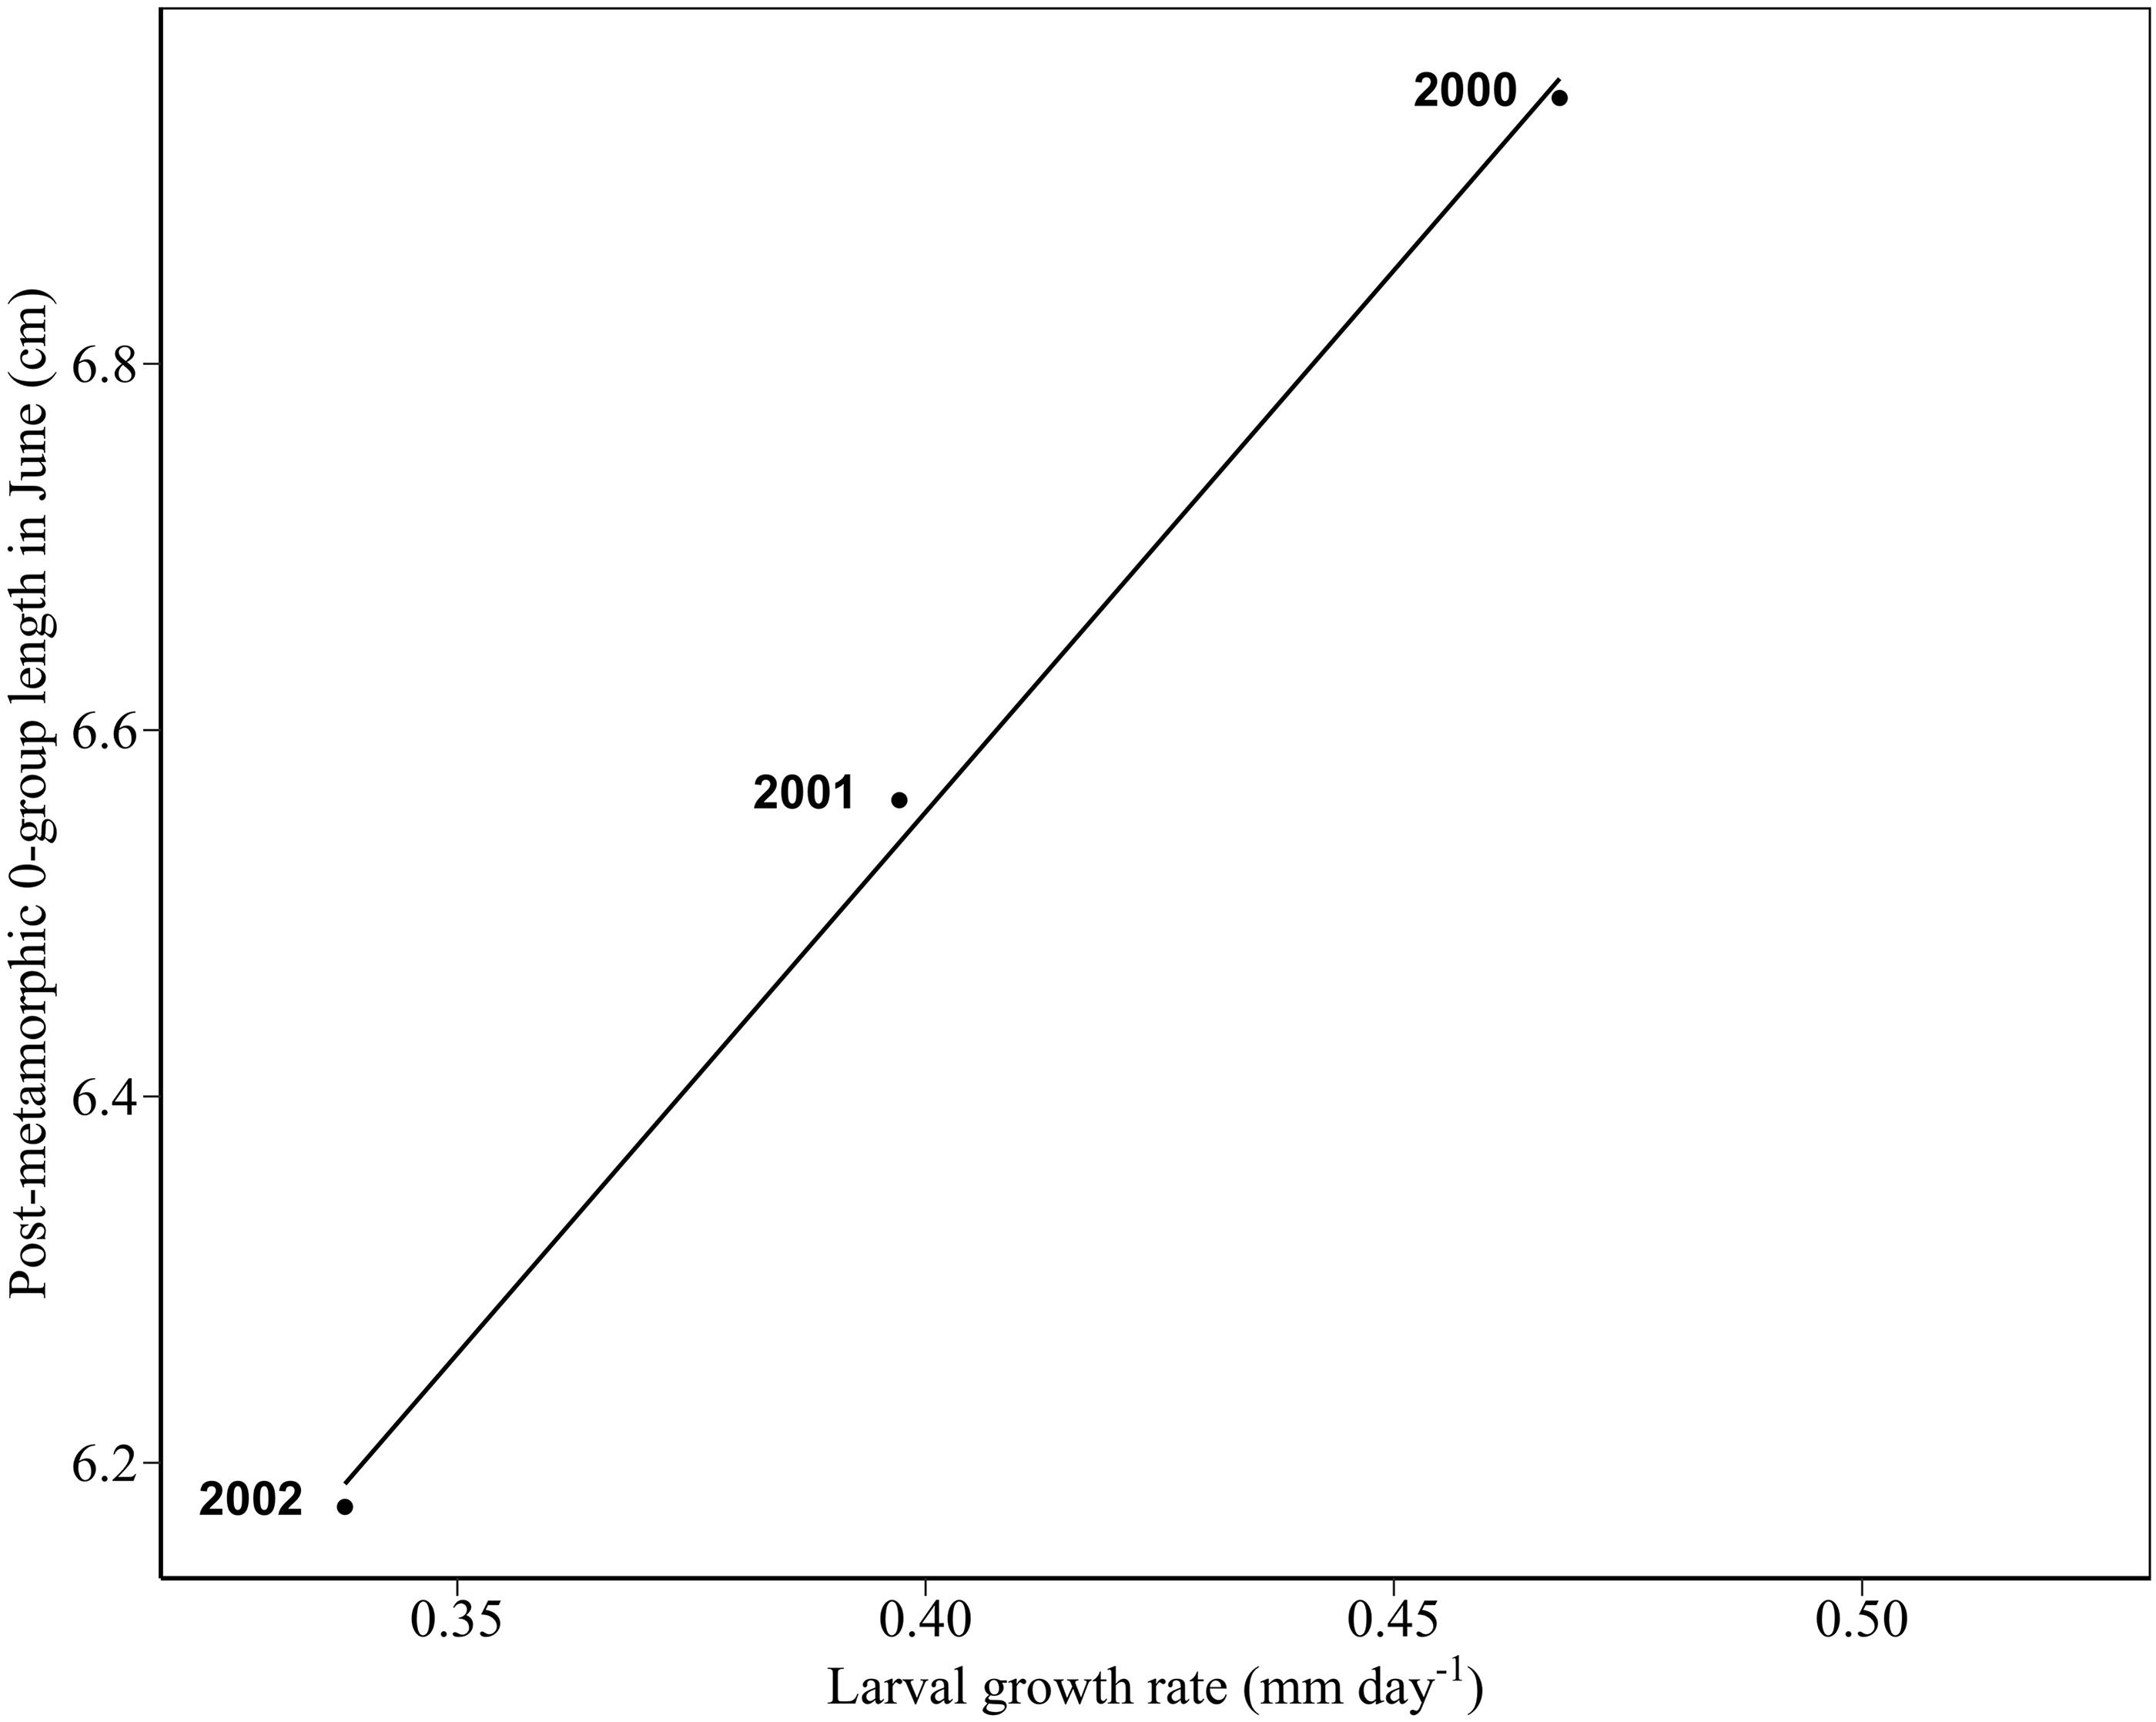
Figure 8. Regression between 0-group length (cm) in June and larval growth rate. The solid line denotes a statistically significant linear relationship through data (black points) (mm d-1) (R2 = 0.995, p < 0.04).
Discussion
Sandeel abundance in the northwestern North Sea has undergone a sustained decline since 2001 despite the absence of a fishery. Recruitment has been maintained while the number of older sandeels has declined (Heath et al., 2012). Two main factors have been proposed as responsible for the decline in sandeel abundance, increases in overwinter and predation mortality of 0-group individuals (MacDonald et al., 2018). Starvation risk decreases with increasing size (van Deurs et al., 2011); therefore, 0-group length prior to overwintering may correlate with overwinter mortality. Indeed, there is evidence that this is true for the stock off the Firth of Forth (Table 4). 0-group length appears to correlate with the cohort mortality rate between the first and second summer (Table 4). On a cautionary note, the low mean length recorded in 2005 may be partly due to early sampling (Table 1). However, evidence contrary to this is that despite mean lengths in 2001 and 2005 differing by 2.35 cm, surveys were carried out less than 2 weeks apart. Sandeels do not feed in winter and survive on stored energy reserves acquired during a short feeding season (Winslade, 1974; Reeves, 1994). There appears to be little scope for extending the feeding season (Wanless et al., 2004; Boulcott et al., 2007), making energy stores dependent on food availability over a few months. The importance of stored energy reserves for the survival of 0-group fish is highlighted in a paired experimental and field study on rainbow trout Oncorhynchus mykiss (Biro et al., 2004). The overwhelming majority of 0-group trout that begin overwintering eventually succumb to starvation, and excluding other forms of mortality, as little as 10% may survive winter (Biro et al., 2004).
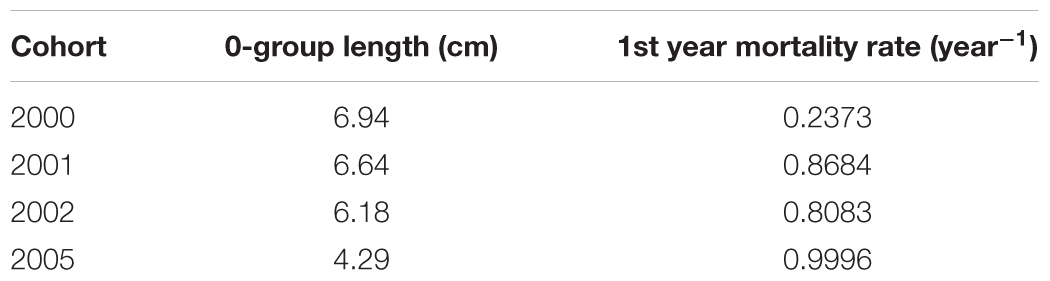
Table 4. Mean length of 0-group sandeels in June and subsequent 1st year annual mortality rate.
In addition to increasing starvation risk, reductions in length are likely to increase predation mortality. Few studies have quantified fish predation on sandeels, even though this is the dominant source of predation mortality (Heath et al., 2009; Reilly et al., 2014). Removals of sandeels and pelagic fish by fish predators are far higher than the combined removals by fisheries and other marine predators (Heath et al., 2009). The fact that sandeel abundance was depressed by the fishery that operated off the Scottish east coast suggests fish predators may have a similar negative effect. Removal of sandeels by haddock alone may in future equate with landings taken at the height of the Danish sandeel fishery, if haddock increase due to stricter stock management (Reilly et al., 2014). Clearly, more work is required to quantify the effect of predation on sandeel population dynamics.
To estimate abundance-at-age in a given year, we estimated age composition using pelagic trawl data, then applied correction factors to bring the pelagic trawl biomass-at-age in line with published estimates of combined dredge (for those in sediment) and acoustic (for those in the pelagic) biomass-at-age. Obtaining credible estimates of sandeel abundance-at-age is extremely challenging as fish are constantly in motion between the sediment and pelagic during summer surveys. Four different survey methods are commonly employed to measure sandeel abundance – acoustic, dredge, trawl, and grab surveys (Greenstreet et al., 2006, 2010a,b). However, it is unclear which method is most efficient. For example, grab catchability may be close to 100%, but the area sample is extremely small (0.0961 m2, Greenstreet et al., 2010b) meaning that, even in prime sandeel habitat, the grab will occasionally catch no sandeels even though individuals may be present in great numbers nearby. An alternative method involves dredging but the dredge is prone to length (MacDonald, 2017) and density dependent catchability (Johnsen and Harbitz, 2013). The pelagic trawl will sometimes fail to capture the largest sandeels because these fish may begin overwintering in the sediment before the survey takes place (Greenstreet et al., 2006). However, the overall degree of length-dependent catchability is considerably weaker in the pelagic trawl than it is in the dredge (MacDonald, 2017).
Sandeel length-at-age declined between 1997 until around 2005, increasing thereafter (Figure 5). This pattern was also evident in changes in the growth performance index ϕ′ (Figure 7). Variation in cohort growth reflected the changes in the abundance of key copepod prey, primarily C. finmarchicus Stages C5–6 and C. typicus Stages C1–6. This is consistent with evidence that sandeel biomass is determined by bottom-up effects of zooplankton and phytoplankton abundance (Frederiksen et al., 2006; Eliasen et al., 2011). Rapid larval growth likely reduces predation and starvation mortality, resulting in strong correlations between sandeel recruitment and abundance of key prey, such as C. finmarchicus (van Deurs et al., 2009; Lindegren et al., 2017). In contrast to food, year-to-year changes in temperature did not have a significant influence on variation in growth. This is consistent with the evidence of the lack of direct physiological effects of temperature rises on sandeel (Buckley et al., 1984; Pitois et al., 2012), and United Kingdom fish species in general (Heath et al., 2012).
Changes in 0-group summer length appeared to be driven by changes in larval growth rates between 2000 and 2002 (Figure 8). This provides further evidence of a decline in larval growth rate post-2000 (Frederiksen et al., 2011). While changes in differential mortality of larvae could drive a decline in 0-group length, this appears unlikely since larval survival and recruitment increased off the Scottish east coast between 2000 and 2009 (Heath et al., 2012). An increase in larval survival could have been caused partly by decreased food competition stemming from a decline in older sandeels (Lindegren et al., 2017).
The hypothesis of food-driven changes in sandeel growth is also supported by the coincidence of low spring chlorophyll concentration and low sandeel energy values in 2004. The spring bloom did not occur in 2004. Sandeels recovered from seabirds in the summer of 2004 had unexpectedly low energy values, which likely caused catastrophic seabird breeding failures (Wanless et al., 2005). In addition, although no measurements of abundance were taken, changes in seabird breeding output indicated low sandeel availability (Wanless et al., 2005). Larval starvation mortality could have increased if prey abundance was insufficient, specifically older larvae around metamorphosis, which is likely an extremely energy demanding process (Brewster, 1987; Gwak et al., 2003). Sandeels born in 2004 approached their asymptotic length at a slower rate than other cohorts (Figure 7), providing evidence of food limitation. Further evidence of bottom-up regulation is that growth rates were lowest for individuals born between 2000 and 2004 (right panels, Figure 7), a period when chlorophyll concentration and diatom cell densities were low (Bresnan et al., 2016).
Fish experiencing poor growth conditions tend to have delayed maturation (Berrigan and Charnov, 1994). Indeed, variation in the growth performance indexes ϕ′ may account for differences in age-at-maturity across the North Sea (Boulcott et al., 2007). The sandeel stock is dominated by fish younger than age 2 (Pedersen et al., 1999, this study) underlining the importance of early maturation. Therefore, successive years of poor growth, as observed between 2000 and 2004, could decrease stock abundance. Evidence is provided from an experimentally derived probability of maturation-at-length relationship (Boulcott et al., 2007). This probability of maturation-at-length relationship implies that less than 50% of age 1 individuals would have matured between 2001 and 2005 (mean = 36%, Supplementary Table S3). In contrast, an average of 80% of individuals matured in other years.
Author Contributions
AM, MH, DS, SG, and PB developed the ideas within the manuscript. AM performed the analysis and wrote most of the manuscript. All authors contributed to the interpretation of results and writing of the manuscript.
Funding
This work received funding from the MASTS pooling initiative (The Marine Alliance for Science and Technology for Scotland) and Marine Scotland Science whose support is gratefully acknowledged. MASTS is funded by the Scottish Funding Council (Grant Reference HR09011) and contributing institutions.
Conflict of Interest Statement
The authors declare that the research was conducted in the absence of any commercial or financial relationships that could be construed as a potential conflict of interest.
Acknowledgments
The long-term commitment to sampling at Stonehaven and off the Firth of Forth was provided by the Scottish Government. We gratefully acknowledge the assistance of the crew members of the survey vessels Shuna and Temora at Stonehaven, and Clupea and Alba Na Mara off the Firth of Forth. We thank the two reviewers for helpful comments and suggestions which greatly improved the manuscript.
Supplementary Material
The Supplementary Material for this article can be found online at: https://www.frontiersin.org/articles/10.3389/fmars.2019.00201/full#supplementary-material
Footnotes
References
Baistrocchi, A. (2003). Modelling the Spatial Dynamics of Sandeels in the Western North Sea. M.Sc. thesis, University of Strathclyde, Glasgow.
Beaugrand, G., Brander, K. M., Lindley, J. A., Souissi, S., and Reid, P. C. (2003). Plankton effect on cod recruitment in the North Sea. Nature 426, 661–664. doi: 10.1038/nature02164
Bergstad, O. A., Høines,ÅS., and Jørgensen, T. (2002). Growth of sandeel, Ammodytes marinus, in the northern North Sea and Norwegian coastal waters. Fish. Res. 56, 9–23. doi: 10.1016/S0165-7836(01)00317-4
Berrigan, D., and Charnov, E. L. (1994). Reaction norms for age and size at maturity in response to temperature: a puzzle for life historians. Oikos 70, 474–478. doi: 10.2307/3545787
Biro, P. A., Morton, A. E., Post, J. R., and Parkinson, E. A. (2004). Over-winter lipid depletion and mortality of age-0 rainbow trout (Oncorhynchus mykiss). Can. J. Fish. Aquat. Sci. 61, 1513–1519. doi: 10.1139/f04-083
Boulcott, P., and Wright, P. J. (2008). Critical timing for reproductive allocation in a capital breeder: evidence from sandeels. Aquat. Biol. 3, 31–40.
Boulcott, P., Wright, P. J., Gibb, F. M., Jensen, H., and Gibb, I. M. (2007). Regional variation in maturation of sandeels in the North Sea. ICES J. Mar. Sci. 64, 369–376. doi: 10.1093/icesjms/fsl033
Bresnan, E., Cook, K., Hindson, J., Hughes, S., Lacaze, J.-P., Walsham, P., et al. (2016). The Scottish coastal observatory 1997-2013. Part 2- description of Scotland’s coastal waters. Scott. Mar. Freshw. Sci. 7, 1–278. doi: 10.7489/1881-1
Brewster, B. (1987). Eye migration and cranial development during flatfish metamorphosis: a reappraisal (Teleostei: Pleuronectiformes). J. Fish Biol. 31, 805–833. doi: 10.1111/j.1095-8649.1987.tb05281.x
Buckley, L. J., Turner, S. I., Halavik, T. A., Smigielski, A. S., Drew, S. M., and Laurence, G. C. (1984). Effects of temperature and food availability on growth, survival, and RNA-DNA ratio of larval sand lance (Ammodytes americanus). Mar. Ecol. Prog. Ser. 15, 91–97.
Cameron, J. (1958). Studies on the Ammodytidae of Isle of Man Waters. Ph.D. thesis, University of Liverpool, Liverpool.
Dunn, J., Hall, C. D., Heath, M. R., Mitchell, R. B., and Ritchie, B. J. (1993). ARIES—a system for concurrent physical, biological and chemical sampling at sea. Deep Sea Res. Part I Oceanogr. Res. Papers 40, 867–878. doi: 10.1016/0967-0637(93)90076-F
Eliasen, K., Reinert, J., Gaard, E., Hansen, B., Jacobsen, J. A., Grønkjær, P., et al. (2011). Sandeel as a link between primary production and higher trophic levels on the Faroe shelf. Mar. Ecol. Prog. Ser. 438, 185–194. doi: 10.3354/meps09301
Frederiksen, M., Edwards, M., Richardson, A. J., Halliday, N. C., and Wanless, S. (2006). From plankton to top predators: bottom-up control of a marine food web across four trophic levels. J. Anim. Ecol. 75, 1259–1268. doi: 10.1111/j.1365-2656.2006.01148.x
Frederiksen, M., Elston, D. A., Edwards, M., Mann, A. D., and Wanless, S. (2011). Mechanisms of long-term decline in size of lesser sandeels in the North Sea explored using a growth and phenology model. Mar. Ecol. Prog. Ser. 432, 137–147. doi: 10.3354/meps09177
Frederiksen, M., Furness, R. W., and Wanless, S. (2007). Regional variation in the role of bottom-up and top-down processes in controlling sandeel abundance in the North Sea. Mar. Ecol. Prog. Ser. 337, 279–286. doi: 10.3354/meps337279
Frederiksen, M., Wanless, S., Harris, M. P., Rothery, P., and Wilson, L. J. (2004). The role of industrial fisheries and oceanographic change in the decline of North Sea black-legged kittiwakes. J. Appl. Ecol. 41, 1129–1139. doi: 10.1111/j.0021-8901.2004.00966.x
Furness, R. W., and Tasker, M. L. (2000). Seabird-fishery interactions: quantifying the sensitivity of seabirds to reductions in sandeel abundance, and identification of key areas for sensitive seabirds in the North Sea. Mar. Ecol. Prog. Ser. 202, 253–264. doi: 10.3354/meps202253
Greenstreet, S. P. R., Armstrong, E., Mosegaard, H., Jensen, H., Gibb, I. M., Fraser, H. M., et al. (2006). Variation in the abundance of sandeels Ammodytes marinus off southeast Scotland: an evaluation of area-closure fisheries management and stock abundance assessment methods. ICES J. Mar. Sci. 63, 1530–1550. doi: 10.1016/j.icesjms.2006.05.009
Greenstreet, S. P. R., Fraser, H., Armstrong, E., and Gibb, I. (2010a). Monitoring the consequences of the northwestern North Sea sandeel fishery closure. Scott. Mar. Freshw. Sci. 1:31.
Greenstreet, S. P. R., Holland, G. J., Guirey, E. J., Armstrong, E., Fraser, H. M., and Gibb, I. M. (2010b). Combining hydroacoustic seabed survey and grab sampling techniques to assess local sandeel population abundance. ICES J. Mar. Sci. 67, 971–984. doi: 10.1093/icesjms/fsp292
Gwak, W. S., Tsusaki, T., and Tanaka, M. (2003). Nutritional condition, as evaluated by RNA/DNA ratios, of hatchery-reared Japanese flounder from hatch to release. Aquaculture 219, 503–514. doi: 10.1016/S0044-8486(02)00651-8
Heath, M. R., Edwards, M., Furness, R., Pinnegar, J., and Wanless, S. (2009). “A view from above: changing seas, seabirds and food sources,” in Marine Climate Change Ecosystem Linkages Report Card 2009, eds J. M. Baxter, P. J. Buckley, and M. T. Frost (Lowestoft: MCCIP), 24.
Heath, M. R., Rasmussen, J., Bailey, M. C., Dunn, J., Fraser, J., Gallego, A., et al. (2012). Larval mortality rates and population dynamics of Lesser Sandeel (Ammodytes marinus) in the northwestern North Sea. J. Mar. Syst. 93, 47–57. doi: 10.1016/j.jmarsys.2011.08.010
Hislop, J. R. G., Harris, M. P., and Smith, J. G. M. (1991). Variation in the calorific value and total energy content of the lesser sandeel (Ammodytes marinus) and other fish preyed on by seabirds. J. Zool. 224, 501–517. doi: 10.1111/j.1469-7998.1991.tb06039.x
Howells, R. J., Burthe, S. J., Green, J. A., Harris, M. P., Newell, M. A., Butler, A., et al. (2017). From days to decades: short-and long-term variation in environmental conditions affect offspring diet composition of a marine top predator. Mar. Ecol. Prog. Ser. 583, 227–242. doi: 10.3354/meps12343
ICES (1995). Report of the ICES Workshop on Sandeel Otolith Analysis: Review of Sandeel Biology. ICES CM 1995/G:4. Copenhagen: ICES.
Jensen, H. (2001). Settlement Dynamics in the Lesser Sandeel Ammodytes marinus in the North Sea. A thesis submitted for the degree of Doctor of Philosophy at the University of Aberdeen.
Johnsen, E., and Harbitz, A. (2013). Small-scale spatial structuring of burrowed sandeels and the catching properties of the dredge. ICES J. Mar. Sci. 70, 379–386. doi: 10.1093/icesjms/fss202
Kimura, D. K. (2008). Extending the von Bertalanffy growth model using explanatory variables. Can. J. Fish. Aquat. Sci. 65, 1879–1891. doi: 10.1139/F08-091
Kvist, T., Gislason, H., and Thyregod, P. (2000). Using continuation-ratio logits to analyze the variation of the age composition of fish catches. J. Appl. Stat. 27, 303–319. doi: 10.1080/02664760021628
Lahoz-Monfort, J. J., Morgan, B. J. T., Harris, M. P., Wanless, S., and Freeman, S. N. (2011). A capture–recapture model for exploring multi-species synchrony in survival. Methods Ecol. Evol. 2, 116–124. doi: 10.1111/j.2041-210X.2010.00050.x
Lindegren, M., Van Deurs, M., MacKenzie, B. R., Worsoe Clausen, L., Christensen, A., and Rindorf, A. (2017). Productivity and recovery of forage fish under climate change and fishing: North Sea sandeel as a case study. Fish. Oceanogr. 27, 212–221. doi: 10.1111/fog.12246
MacDonald, A. (2017). Modelling the Impact of Environmental Change on the Physiology and Ecology of Sandeels. Ph.D. thesis, University of Strathclyde, Glasgow.
MacDonald, A., Heath, M. R., Edwards, M., Furness, R. W., Pinnegar, J. K., Wanless, S., et al. (2015). Climate driven trophic cascades affecting seabirds around the British Isles. Oceanogr. Mar. Biol. Annu. Rev. 53, 55–80. doi: 10.1201/b18733-3
MacDonald, A., Speirs, D. C., Greenstreet, S. P. R., and Heath, M. R. (2018). Exploring the influence of food and temperature on North Sea sandeels using a new dynamic energy budget model. Front. Mar. Sci. 5:339. doi: 10.3389/fmars.2018.00339
Macer, C. T. (1965). The distribution of larval sand eels (Ammodytidae) in the southern North Sea. J. Mar. Biol. Assoc. U.K. 45, 187–207. doi: 10.1017/S0025315400004070
Macer, C. T. (1966). Sandeels (Ammodytidae) in the South-Western North Sea: Their Biology and Fishery, Vol. 24. London: Her Majesty’s Stationery Office, 1–55.
MacLeod, C. D., Santos, M. B., Reid, R. J., Scott, B. E., and Pierce, G. J. (2007). Linking sandeel consumption and the likelihood of starvation in harbour porpoises in the Scottish North Sea: could climate change mean more starving porpoises? Biol. Lett. 3, 185–188. doi: 10.1098/rsbl.2006.0588
Pauly, D. E., and Munro, J. L. (1984). Once more the comparison of growth in fish and invertebrates. ICLARM Fishbyte 2, 21–22.
Pedersen, S. A., Lewy, P., and Wright, P. (1999). Assessments of the lesser sandeel (Ammodytes marinus) in the North Sea based on revised stock divisions. Fish. Res. 41, 221–241. doi: 10.1016/S0165-7836(99)00026-0
Pilling, G. M., Kirkwood, G. P., and Walker, S. G. (2002). An improved method for estimating individual growth variability in fish, and the correlation between von Bertalanffy growth parameters. Can. J. Fish. Aquat. Sci. 59, 424–432. doi: 10.1139/f02-022
Pitois, S. G., Lynam, C. P., Jansen, T., Halliday, N., and Edwards, M. (2012). Bottom-up effects of climate on fish populations: data from the Continuous Plankton Recorder. Mar. Ecol. Prog. Ser. 456, 169–186. doi: 10.3354/meps09710
Proctor, R., Wright, P. J., and Everitt, A. (1998). Modelling the transport of larval sandeels on the north-west European shelf. Fish. Oceanogr. 7, 347–354. doi: 10.1046/j.1365-2419.1998.00077.x
Reeves, S. A. (1994). Seasonal and Annual Variation in Catchability of Sandeels at Shetland. ICES CM. D:19. Copenhagen: ICES.
Régnier, T, Gibb, F. M., and Wright, P. J. (2017). Importance of trophic mismatch in a winter-hatching species: evidence from lesser sandeel. Mar. Ecol. Prog. Ser. 567, 185–197. doi: 10.3354/meps12061
Reilly, T. O. M., Fraser, H. M., Fryer, R. J., Clarke, J., and Greenstreet, S. P. R. (2014). Interpreting variation in fish-based food web indicators: the importance of “bottom-up limitation” and “top-down control” processes. ICES J. Mar. Sci. 71, 406–416.
Rindorf, A., and Lewy, P. (2001). Analyses of length and age distributions using continuation-ratio logits. Can. J. Fish. Aquat. Sci. 58, 1141–1152. doi: 10.1139/f01-062
Rindorf, A., Wright, P. J., Jensen, H., and Maar, M. (2016). Spatial differences in growth of lesser sandeel in the North Sea. J. Exp. Mar. Biol. Ecol. 479, 9–19. doi: 10.1016/j.jembe.2016.02.007
Scott, B. E., Sharples, J., Wanless, S., Ross, O. N., Frederiksen, M., and Daunt, F. (2006). “Use of biologically meaningful oceanographic indices to separate the effects of climate and fisheries on seabird breeding success,” in Top Predators in Marine Ecosystems: Their Role in Monitoring and Management, eds I. Boyd, S. Wanless, and C. J. Camphuysen (Cambridge: Cambridge University Press), 46–62.
Stari, T., Preedy, K. F., McKenzie, E., Gurney, W. S. C., Heath, M. R., Kunzlik, P. A., et al. (2010). Smooth age length keys: observations and implications for data collection on North Sea haddock. Fish. Res. 105, 2–12. doi: 10.1016/j.fishres.2010.02.004
van Deurs, M., Hartvig, M., and Steffensen, J. F. (2011). Critical threshold size for overwintering sandeels (Ammodytes marinus). Mar. Biol. 158, 2755–2764. doi: 10.1007/s00227-011-1774-8
van Deurs, M., Koski, M., and Rindorf, A. (2014). Does copepod size determine food consumption of particulate feeding fish? ICES J. Mar. Sci. 71, 35–43. doi: 10.1093/icesjms/fst090
van Deurs, M., van Hal, R., Tomczak, M. T., Jónasdóttir, S. H., and Dolmer, P. (2009). Recruitment of lesser sandeel Ammodytes marinus in relation to density dependence and zooplankton composition. Mar. Ecol. Prog. Ser. 381, 249–258. doi: 10.3354/meps07960
von Bertalanffy, L. (1938). A quantitative theory of organic growth (inquiries on growth laws. II). Hum. Biol. 10, 181–213.
Wanless, S., Harris, M. P., and Greenstreet, S. P. R. (1998). Summer sandeel consumption by seabirds breeding in the Firth of Forth, south-east Scotland. ICES J. Mar. Sci. 55, 1141–1151. doi: 10.1006/jmsc.1998.0372
Wanless, S., Harris, M. P., Redman, P., and Speakman, J. R. (2005). Low energy values of fish as a probable cause of a major seabird breeding failure in the North Sea. Mar. Ecol. Prog. Ser. 294, 1–8. doi: 10.3354/meps294001
Wanless, S., Wright, P. J., Harris, M. P., and Elston, D. A. (2004). Evidence for decrease in size of lesser sandeels Ammodytes marinus in a North Sea aggregation over a 30-yr period. Mar. Ecol. Prog. Ser. 279, 237–246. doi: 10.3354/meps279237
Winslade, P. (1974). Behavioural studies on the lesser sandeel Ammodytes marinus (Raitt) III. The effect of temperature on activity and the environmental control of the annual cycle of activity. J. Fish Biol. 6, 587–599. doi: 10.1111/j.1095-8649.1974.tb05102.x
Wright, P. J. (1993). Otolith microstructure of the lesser sandeel, Ammodytes marinus. J. Mar. Biol. Assoc. U.K. 73, 245–248. doi: 10.1017/S0025315400032793
Wright, P. J., and Bailey, M. C. (1993). Biology of Sandeels in the Vicinity of Seabird Colonies at Shetland. Technical Report Fisheries Research Services Report No. 15/93. Aberdeen: Scottish Office Agriculture and Fisheries Department Marine Laboratory, 1–64.
Wright, P. J., and Bailey, M. C. (1996). Timing of hatching in Ammodytes marinus from Shetland waters and its significance to early growth and survivorship. Mar. Biol. 126, 143–152. doi: 10.1007/BF00571386
Keywords: growth rate, length, Ammodytes marinus, mortality, fish, abundance
Citation: MacDonald A, Speirs DC, Greenstreet SPR, Boulcott P and Heath MR (2019) Trends in Sandeel Growth and Abundance off the East Coast of Scotland. Front. Mar. Sci. 6:201. doi: 10.3389/fmars.2019.00201
Received: 04 July 2018; Accepted: 01 April 2019;
Published: 26 April 2019.
Edited by:
Lyne Morissette, M – Expertise Marine, CanadaReviewed by:
Fabio Fiorentino, Istituto per le Risorse Biologiche e le Biotecnologie Marine (IRBIM), ItalyDimitrios K. Moutopoulos, Technological Educational Institute of Western Greece, Greece
Copyright © 2019 MacDonald, Speirs, Greenstreet, Boulcott and Heath. This is an open-access article distributed under the terms of the Creative Commons Attribution License (CC BY). The use, distribution or reproduction in other forums is permitted, provided the original author(s) and the copyright owner(s) are credited and that the original publication in this journal is cited, in accordance with accepted academic practice. No use, distribution or reproduction is permitted which does not comply with these terms.
*Correspondence: Alan MacDonald, YWxhbi5tYWNkb25hbGRAc3RyYXRoLmFjLnVr