 Nathan Robert Geraldi
 G. T. Kellison
 Nathan M. Bacheler
95% of researchers rate our articles as excellent or good
Learn more about the work of our research integrity team to safeguard the quality of each article we publish.
Find out more
ORIGINAL RESEARCH article
Front. Mar. Sci. , 07 February 2019
Sec. Marine Ecosystem Ecology
Volume 6 - 2019 | https://doi.org/10.3389/fmars.2019.00030
Determining what abiotic and biotic factors affect the diversity and abundance of species through time and space is a basic goal of ecology and an integral step in predicting current and future distributions. Given the pervasive effect of humans worldwide, including anthropogenic factors when quantifying community dynamics is needed to understand discrete and emergent effects of humans on marine ecosystems, especially systems with economically important species. However, there are limited studies that combine a large-scale ecological survey with multiple natural and anthropogenic factors to determine the drivers of community dynamics of temperate reef systems. We combined data from a 24-year fish survey on temperate reefs along the Southeast United States coast with information on recreational and commercial fisheries landings, surface and bottom temperature, habitat characteristics, and climate indices to determine what factors may alter the community structure of fishes within this large marine ecosystem. We found that both abundance and richness of temperate reef fishes declined from 1990 to 2013. Climate indices and local temperature explained the greatest variation, and recreational fishing explained slightly more variation compared to commercial fishing in the temperate reef fish community over a multi-decadal scale. When including habitat characteristics in a 3 year analysis, depth, and local temperature explained the greatest variation in fish assemblage, while the influence of habitat was comparatively minimal. Finally, the interaction between predictor variables and fish traits indicated that bigger and longer-lived fishes were positively correlated with depth and winter temperature. Our findings suggest that lesser-studied anthropogenic impacts, such as recreational fishing, may influence communities throughout large ecosystems as much as other well-studied impacts such as climate change and commercial fishing. In addition, climate indices should be considered when assessing changes, natural or anthropogenic, to fish communities.
Understanding and predicting the distribution and abundance of organisms is a fundamental component of ecology (Legendre and Fortin, 1989). However, identifying the abiotic and biotic factors that alter species distribution and abundance is challenging because those factors change over space and time. Anthropogenic impacts also affect the abundance and distribution of species (Jackson et al., 2001; Halpern et al., 2008). In marine ecosystems, overfishing can cause substantial reductions of target and by-catch species (Worm et al., 2006), while global warming can alter the community assemblage of fishes (Fodrie et al., 2010). However, our ability to quantify and predict the effect of humans on ecosystems is limited because multiple impacts often occur simultaneously and at different scales (Crain et al., 2008). In addition, environmental variables may interact with anthropogenic stressors. For example, natural climate cycles may mitigate or exacerbate global warming (Nye et al., 2014). Thus, studies must collect information on the focal community and relevant natural and anthropogenic factors over a meaningful scale, which often means multiple decades and 100 s of kilometers, to quantify the separate and emergent effects of humans on community dynamics.
Our understanding of the relative influence of natural and anthropogenic factors on communities is often limited by the scale of data collection. This is particularly evident for marine temperate reefs, despite supporting many economically important species throughout the world (Coleman et al., 2000; Moore et al., 2011). Temperate reef (or hard bottom) communities include habitat characteristics that range from flat hard substrate with dispersed sessile organisms to highly rugose ledges and overhangs. Temperate reef habitats are patchy and often support much greater fish abundance than surrounding unstructured substrate (Fujita et al., 1996). Depth and habitat characteristics influence temperate reef fish communities (Moore et al., 2010; Whitfield et al., 2014). Studies of the effectiveness of protected areas on tropical reef fishes have found that habitat characteristics are as, if not more, important than fishing for the fish community (Wilson et al., 2010; Claudet et al., 2011). The relative influence of habitat and fishing are likely dependent on whether the fishes are targeted by fishers (Russ et al., 2015). However, the effect and importance of fishing and habitat relative to other variables (e.g., broad-scale environmental forcing variables), are relatively unknown over broad spatio-temporal scales. Improved understanding of the natural and anthropogenic factors that structure marine communities would facilitate the prediction of how those communities will respond to a changing environment and provide information to improve conservation and management efforts.
We used fishery-independent survey data collected over broad spatial (>50,000 km2) and temporal (24 years) scales to determine what variables affect the community structure of temperate reef-associated fishes along the Southeast United States coast. These temperate reefs support active commercial and recreational fisheries that target snapper and grouper species primarily using hook and line (Coleman et al., 1999). Recreational fishing in the early 2000’s along the Southeast United States harvested about 29,000 metric tons of fish per year (Figueira and Coleman, 2010), which was approximately 38% of the total catch with commercial composing 62% (Coleman et al., 2004). This study quantified the degree to which a suite of factors (e.g., depth, temperature, climate indices, and fishing) explained variability of fishes collected in a standardized trap survey. Habitat characteristics were included in an additional analysis for a subset of years in which those data were available (2011–2013). Finally, we quantified if specific fish traits were associated with changes in predictor variables. Results from this study provide a rare and valuable assessment of natural and anthropogenic factors that affect community structure over broad spatial and temporal scales.
To determine which variables were related to change in the fish community structure, we used data collected from 1990 through 2013 by the Southeast Reef Fish Survey (SERFS) as a measure of the fish community. SERFS utilizes chevron traps and video cameras to survey reef fish in continental shelf and shelf-break waters from North Carolina to Florida (Figure 1; Ballenger et al., 2011; Bacheler et al., 2014). We also separately analyzed SERFS data from 2011 through 2013 (when video-derived habitat data were available) to determine which variables, including habitat variables, were related to change in fish community structure. All trap data is publicly available1.
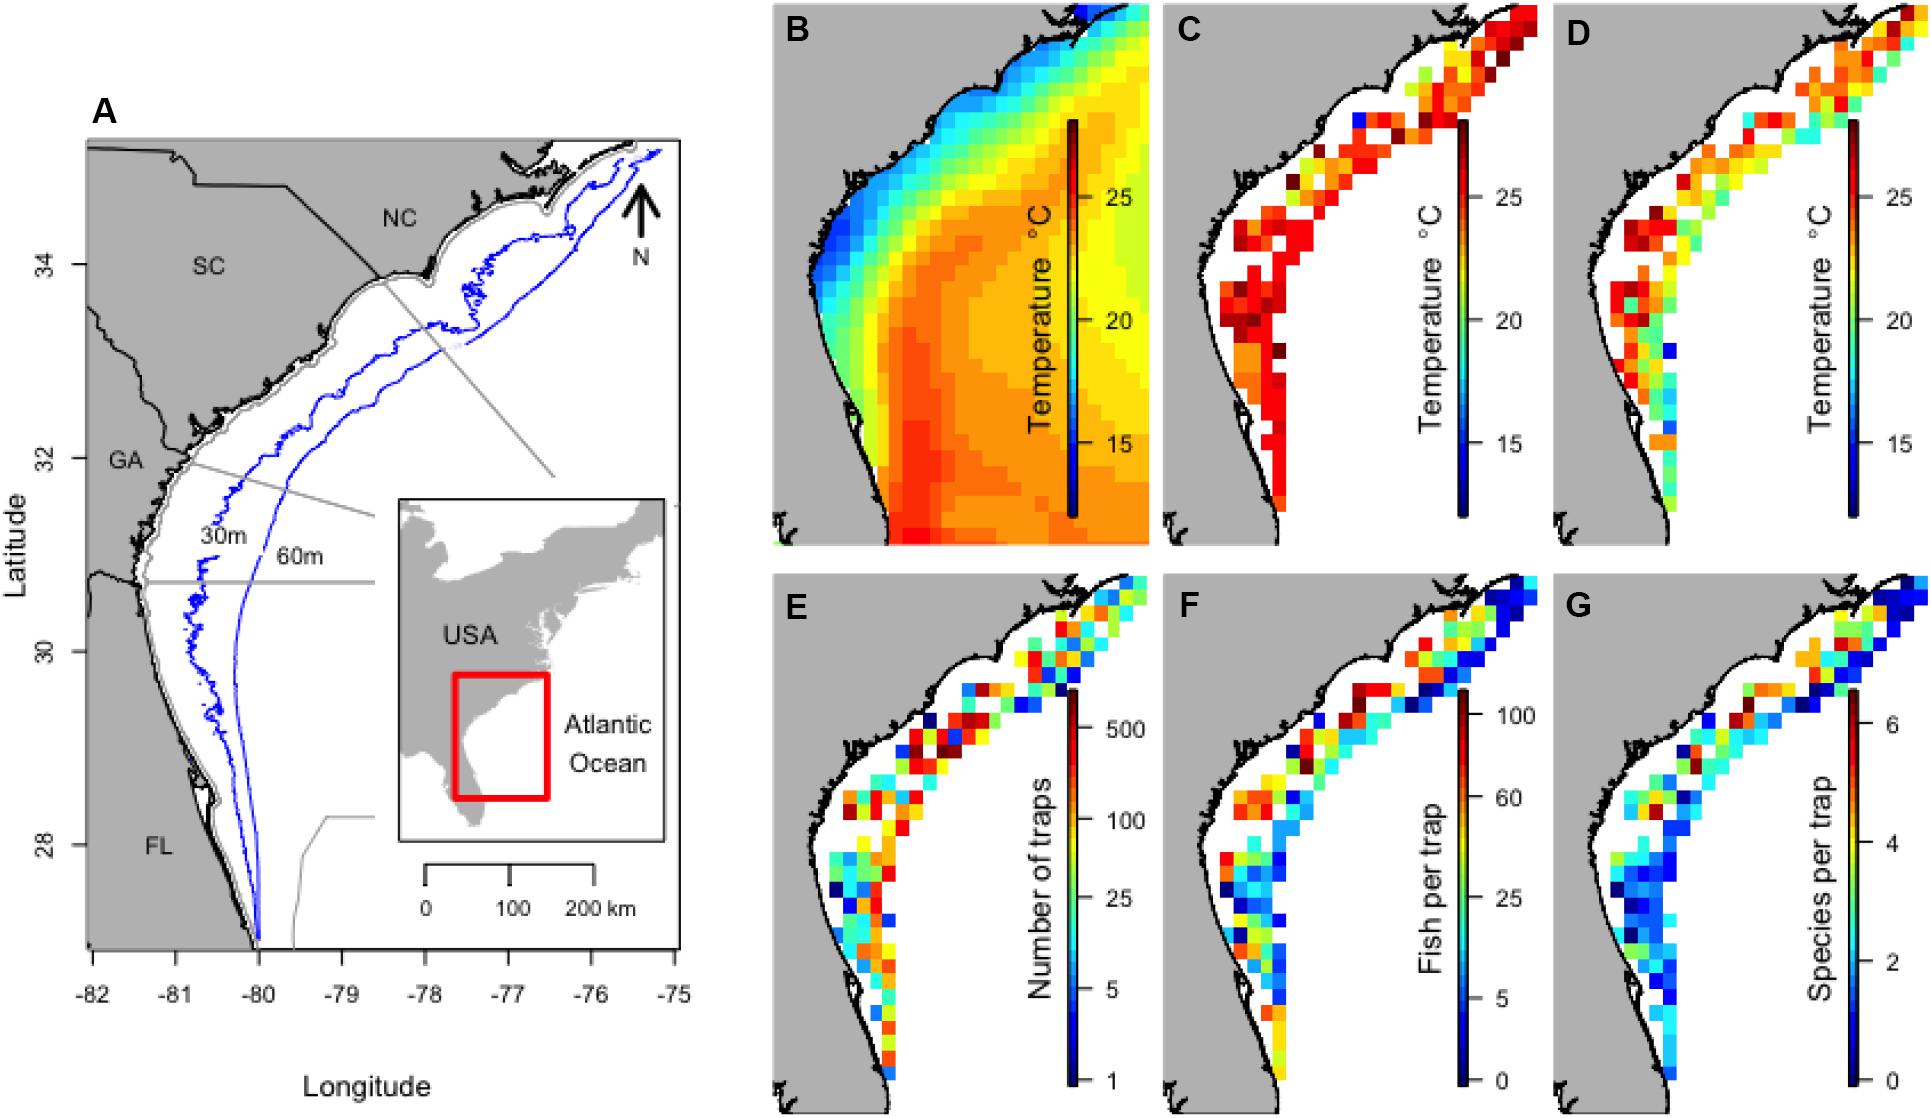
Figure 1. Location of the study along the Southeast United States coast with depth contours and maritime state boundaries (A), and the mean winter SST (B), mean surface temperature 30 days before trap sets (C), mean bottom temperature (D), total number of traps set (E), mean number of fish per trap (F), and mean number of species per trap (G) within 0.25 by 0.25° areas from 1990 to 2013. NOAA High Resolution SST data provided by the NOAA/OAR/ESRL PSD, Boulder, CO, United States.
The number and distribution of trap sets varied annually, dependent on available funding and logistical constraints. Sampling locations were selected from positions known to have hard bottom habitat (Ballenger et al., 2011; Bacheler et al., 2014). Each year, sample locations were randomly chosen from many locations (approximately 4000 locations in recent years). Temporal pseudo-replication (a lack of independence among traps set in the same location during different years), was likely minimal considering that only a fraction of locations were randomly selected for sampling each year and that reef fish assemblage changes within spatial scales (Karnauskas and Babcock, 2012) similar to the inherent error when setting a trap off the back of a ship in water deeper than 30 m (>50 m difference). Chevron traps used for the survey were constructed from plastic-coated wire (3.4-cm2 mesh) and shaped like an arrowhead that measured 1.7 m × 1.5 m × 0.6 m (Collins, 1990). Traps were usually set in groups of 6, referred to as an event, and traps were deployed during the day more than 200 m from any other trap in a given year. Traps were baited with 24 menhaden Brevoortia sp. Trap sampling duration was approximately 90 min and sampling occurred from April to October each year in depths ranging from 15 to 94 m. All fish were identified to the lowest possible taxon (mostly to species) and counted. For each trap the following information was recorded: depth, sample duration, location (latitude and longitude) and date. During each event, profiles of water temperature were taken using a Sea-Bird CTD. The average measurement for temperature within the deepest recorded meter was used as the bottom temperature for each trap within an event.
Beginning in 2011, video cameras were attached to each trap (Bacheler et al., 2014) to quantify the surrounding habitat and as a second fish survey gear (see Supplementary Appendix S1 for detailed methods). Habitat was quantified using four different measures based on visual observations of the video and included: percent hard substrate, substrate relief (low, moderate, or high), percent biota (percent of benthos covered by erect biota), and biota height (low or high).
To quantify the influence of longer-term water temperature, broad-scale climate patterns, and commercial and recreational fisheries landings on the fish community, we obtained sea surface temperature (SST), the Atlantic Multidecadal Oscillation (AMO) and the North Atlantic Oscillation (NAO) indices, and landings data from the NOAA website (see Supplementary Appendix S1 for detailed methods). For each trap, we determined the preceding 30-day mean SST; winter SST (the mean SST from January to March of the previous year); 1- to 3-year lag for AMO and NAO; and the mean, state-specific commercial and recreational fishing landings for the preceding 5 years. AMO and NAO indices with 1- to 3-year lags were run because large-scale climactic events not only affect temperature but also ocean masses and circulation that affect plankton and zooplankton (Nye et al., 2009, 2014). These indices have disproportionate effects on the early life stages of fishes because of alterations in food sources and temperature (Nye et al., 2009, 2014) and other studies of adult fishes have found delayed effects of these indices (Karnauskas et al., 2015). The 5 year running mean in landings was used to minimize the effect of noise in annual calculations, and yearly mismatch between harvest and survey (Figure 1; Supplementary Appendixes S1, S2). Local water temperature (bottom temperature and SST) were included because they affect the fish community through species thermal tolerance and migration (Marshall and Elliott, 1998), as well as trap capture (Bacheler et al., 2014).
To elucidate the long-term trends (from 1990 to 2013) in water temperature and trap catch, linear regressions were run with year as the independent variable. Three different temperature measures were used as dependent variables: SST of the 0.25 × 0.25° cell in which the trap was set (daily mean of previous 30 days), winter surface temperature of the 0.25 × 0.25° cell in which the trap was set (daily mean from the preceding January to March), and bottom temperature when the trap was set. The number of individuals and species per trap were also analyzed as dependent variables. To determine if the study design influenced differences among years because the same locations were not sampled each year, regressions were run using all data and only data from 0.25 × 0.25° cells that included trap samples every year of the survey (6 of 119 cells).
To quantify what factors were related to large-scale trends in abundance and richness of the fish community, we performed two sets of multivariate analyses. The first set of analyses focused on SERFS trap data collected from 1990 to 2013. The second set of analyses focused on SERFS data from 2011 to 2013, and included habitat information. The purpose of both sets of analyses was to assess the importance of abiotic, biotic, and anthropogenic factors in explaining variation in trap catches. In all cases the response variable was the abundance of each taxa caught in individual traps.
For each multivariate dataset, we measured the amount of variation in the fishes caught in traps explained by the predictor variables using multivariate generalized linear modeling (MGLM; Warton et al., 2015). This model-based approach to multivariate data is more statistically explicit than a distance-based analysis (PERMANOVA) and the distribution of the data can be specified to account for mean-variance relationships and the model fit can be assessed by evaluating residual and fitted values (Hui et al., 2015; Warton et al., 2015). MGLMs were run using the “manyglm” function in the mvabund package (Wang et al., 2012) in R version 2.15.0 (R Development Core Team, 2012). A negative binomial distribution with a log link was used, which resulted in models with a negligible pattern among residuals and samples or taxa, and the normal quantile plot was linear (Wang et al., 2012). Significance of variables was calculated using the Wald statistic with 1000 permutations and correlation among variables was included in the analysis (ANOVA function, cor.type = R; Warton et al., 2015). Species-specific p-values were adjusted for multiple tests using a step-down resampling procedure. The test statistic for each predictor variable indicates the overall influence of that variable on the assemblage and the test statistic for each taxon signifies which taxa were driving the overall significance for each predictor variable. This is analogous to a SIMPER analysis that utilizes distance-based metrics (Clarke and Gorley, 2006), but is less biased by mean-variance relationships (Warton et al., 2012).
For all analyses, location (latitude and longitude) data were transformed into UTM x and y coordinates for a more accurate calculation of distances between traps. To reduce computational demand, taxa that were caught in fewer than five traps throughout the study were not included in the analyses. Analyses only included data from traps that caught fish (samples without individuals are undefined in multivariate analysis) and for which all predictor variables were recorded. No fish were caught in 1827 traps (17% of the traps). Multi-collinearity was tested using the variance inflation factor (VIF) with a cut-off value of 3 (Zuur et al., 2013).
For the long-term analysis (from 1990 to 2013), we included 10 predictor variables (depth, bottom temperature, winter surface temperature, surface temperature, AMO, NAO, commercial catch, recreational catch, month, and x). The MGLM was rerun until variables were ordered from greatest to least explanatory ability (from highest to lowest test statistic). Three-year lags for both climate indices were used because they had the highest marginal test statistic. Latitude had a VIF of 12.4 and was not included in the MGLM.
To elucidate whether certain species traits were associated with changes in individual predictor variables and assist in understanding if changes in individual species could be explained and generalized by functional traits, we ran fourth-corner correlation analysis (Legendre et al., 1997; Dray and Legendre, 2008). This analysis used a Pearson correlation to measure the relationship between species traits and predictor variables and determines significance by a permutation procedure. For example, fourth-corner analysis could indicate if fishing pressure is associated with changes in larger, slower growing fishes. The fourth-corner analysis was conducted using the fourth corner function in the ade4 package (Dray and Dufour, 2007), with 50,000 permutations and permuted values of sites and species. Although a similar analysis is available within MGLM, the forth-corner analysis is much less computational intensive and has similar results without inflated Type I error compared to the MGLM method (Ter Braak et al., 2017). Trophic level and vulnerability were included as traits. Vulnerability is a metric used by FishBase (Froese and Pauly, 2017) to estimate the vulnerability of species to fishing. Greater vulnerability is positively related to larger size, slow growth, late maturity and long-life span of species. These traits were chosen because they are distinct and ecologically relevant traits that are widely available for most fishes. Trait data were obtained from FishBase using the rfishbase package in R (Boettiger et al., 2012). If trait data for a specific species was not available the mean of other species within the same genus was used. For taxa not assigned to species, we used the species that composed the majority of the trap catch. Predictor variables that had a p-value of ≤0.001 in the MGLM were included in the fourth-corner analysis to enhance parsimony and reduce the number of statistical tests. Multi-collinearity was tested and VIG was <3 for the variables. The adjusted p-value was calculated with the FDR method which controls for type II error and focuses on the power of the test.
For the long-term analysis (from 1990 to 2013), the ability of predictor variables (depth, bottom temperature, winter surface temperature, surface temperature, AMO, NAO, commercial catch, recreational catch, month, x and y) to account for variation in fish community structure were analyzed in a MGLM. The MGLM was rerun until variables were ordered from greatest to least explanatory ability (from highest to lowest test statistic). Three-year lags for both climate indices were used because they had the highest marginal test statistic. Latitude had a VIF of 12.4 and was not included in the MGLM.
The influence of the Gulf Stream was evident on mean winter SST, for which temperature increased with increasing distance from the coast (Figure 1B). Bottom temperature and SST during sampling was similar except for deeper sites (Figures 1C,D). The long-term data (1990–2013) included 9,645 trap samples, with an average of 402 trap samples per year (range of 201–1196). Sampling effort was slightly higher in the middle of the survey area (Figure 1E). The mean number of individuals caught in traps tended to be higher in shallow water (Figure 1F) and the number of species caught in a trap was often higher in shallow coastal waters in the northern region of the survey (Figure 1G).
The AMO was primarily in a positive phase since 1995, while the NAO changed from positive to negative multiple times during the study (Figures 2A,B). The SST through the 24 years of the study had a slightly negative trend, indicated by the slope, for the entire survey area and within the six 0.25 × 0.25° cells that were sampled every year (Table 1 and Figure 2C). The linear trend in winter SST and bottom temperature over the 24 years of the study was not different from zero over the entire study area and for the six cells sampled every year, except for winter SST, which had a negative trend for the six cells sampled every year (Table 1 and Figures 1D,E). The slope over 24 years for the number of individuals caught in a trap was not different from zero for the six areas sampled every year, but did decrease when all trap data were included (Table 1 and Figure 2F). The number of species caught per trap decreased over the 24 years of the study (Table 1 and Figure 2G). The regression analysis did not account for potential temporal autocorrelation of traps among years, which may have resulted in biased p-values and results with p-values near 0.05 should be interpreted with caution. Seventy-one of the 119 fish taxa (most identified to species level) collected were caught in more than five traps and were included in the multivariate analyses (Supplementary Appendix S5). Trap catch was primarily composed of three taxa, Centropristis striata, Haemulon aurolineatum, and Stenotomus spp.
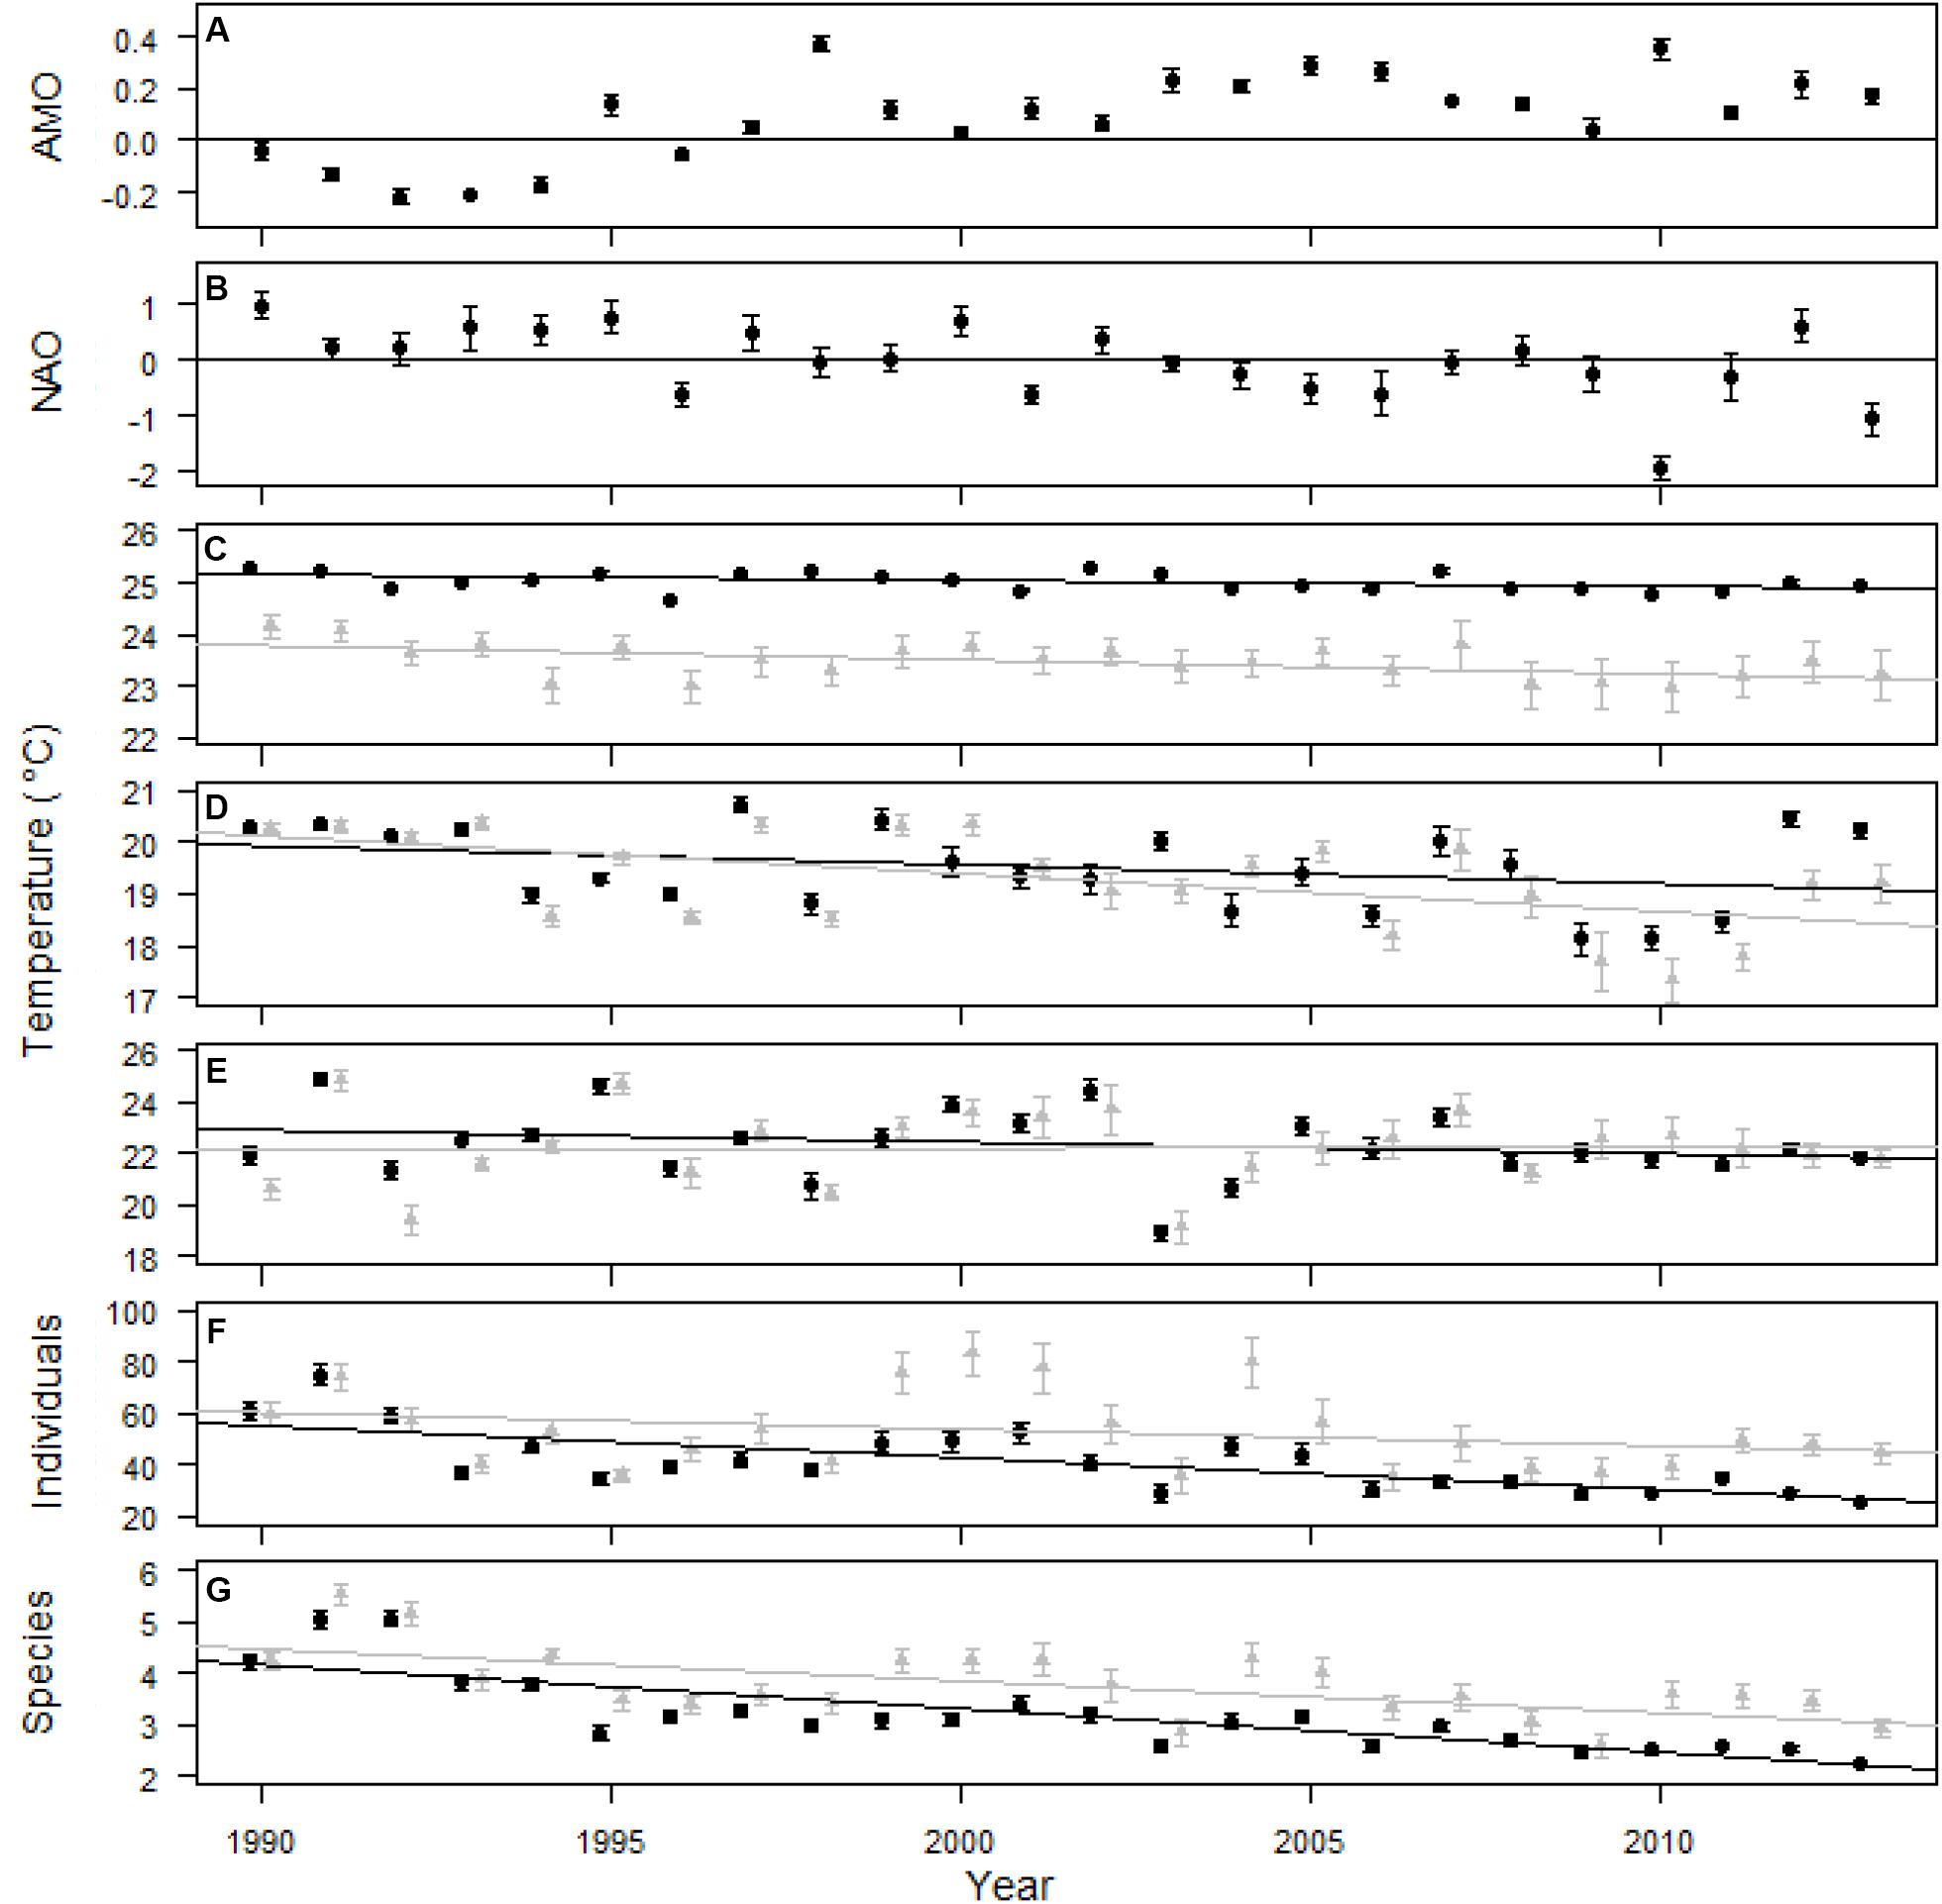
Figure 2. AMO (A), NAO (B), SST (C), winter SST (D), bottom temperature (E), individuals per trap (F), and species per trap (G) over the 24 years of the study. Standard error for climate indices was calculated from monthly measures and the line at 0 divides positive and negative phases of the indices (A,B). Temperature and trap data was included for all 0.25 × 0.25° areas that were sampled (black circles and trend line) and only data within 6–0.25 × 0.25° areas that were sampled every year (gray triangles and trend line; C–G). Standard error was calculated from the mean temperature within each 0.25 by 0.25° cell for each year and from each trap for individuals and species per trap (C–G). Surface temperature was measured daily while bottom temperature was measured during trap sampling. Climate indices and high resolution SST data provided by the NOAA/OAR/ESRL PSD, Boulder, CO, United States.
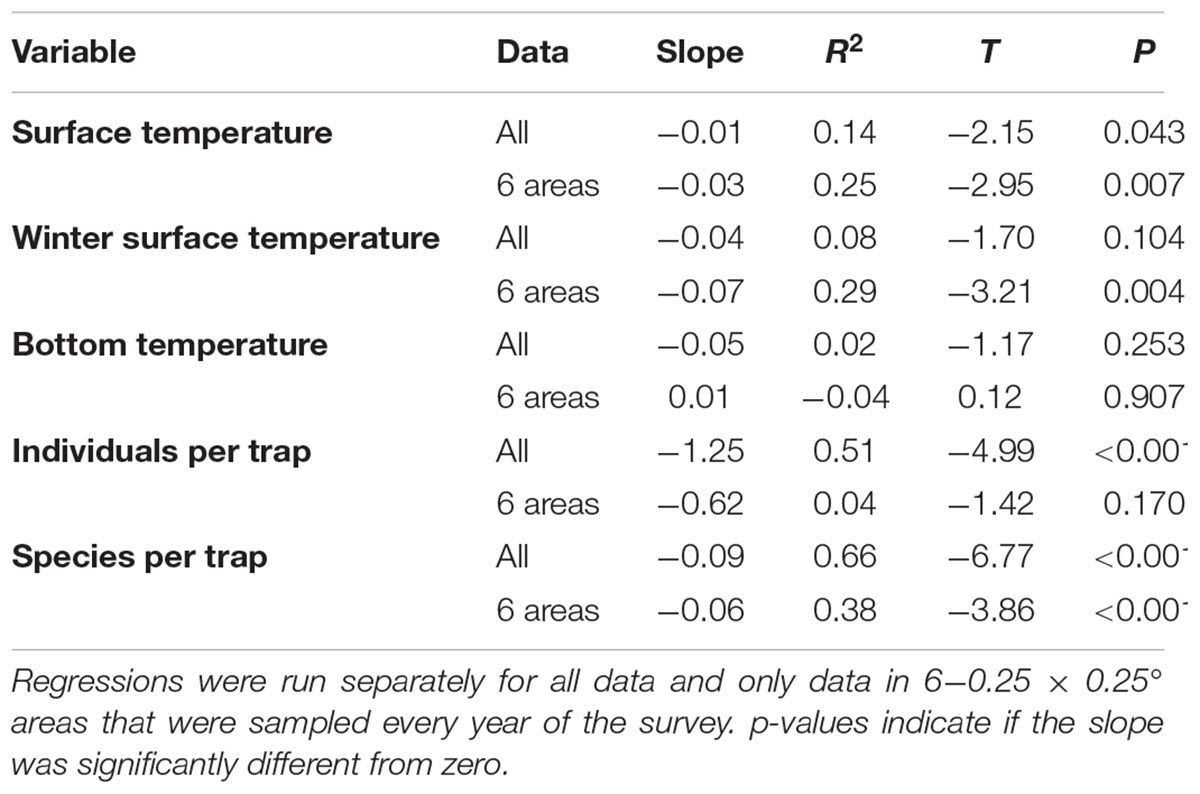
Table 1. The change from 1990 to 2013 for temperature and trap catch response variables.
Atlantic Multidecadal Oscillation, bottom temperature, NAO, and winter SST explained the most variation in community structure based on the test statistic (Table 2). Recreational harvest of fishes explained slightly more variation in the assemblage than commercial harvest of fishes (Table 2). Depth, month, and SST were significant predictor variables, but explained less variation than other predictor variables included in the long-term dataset.
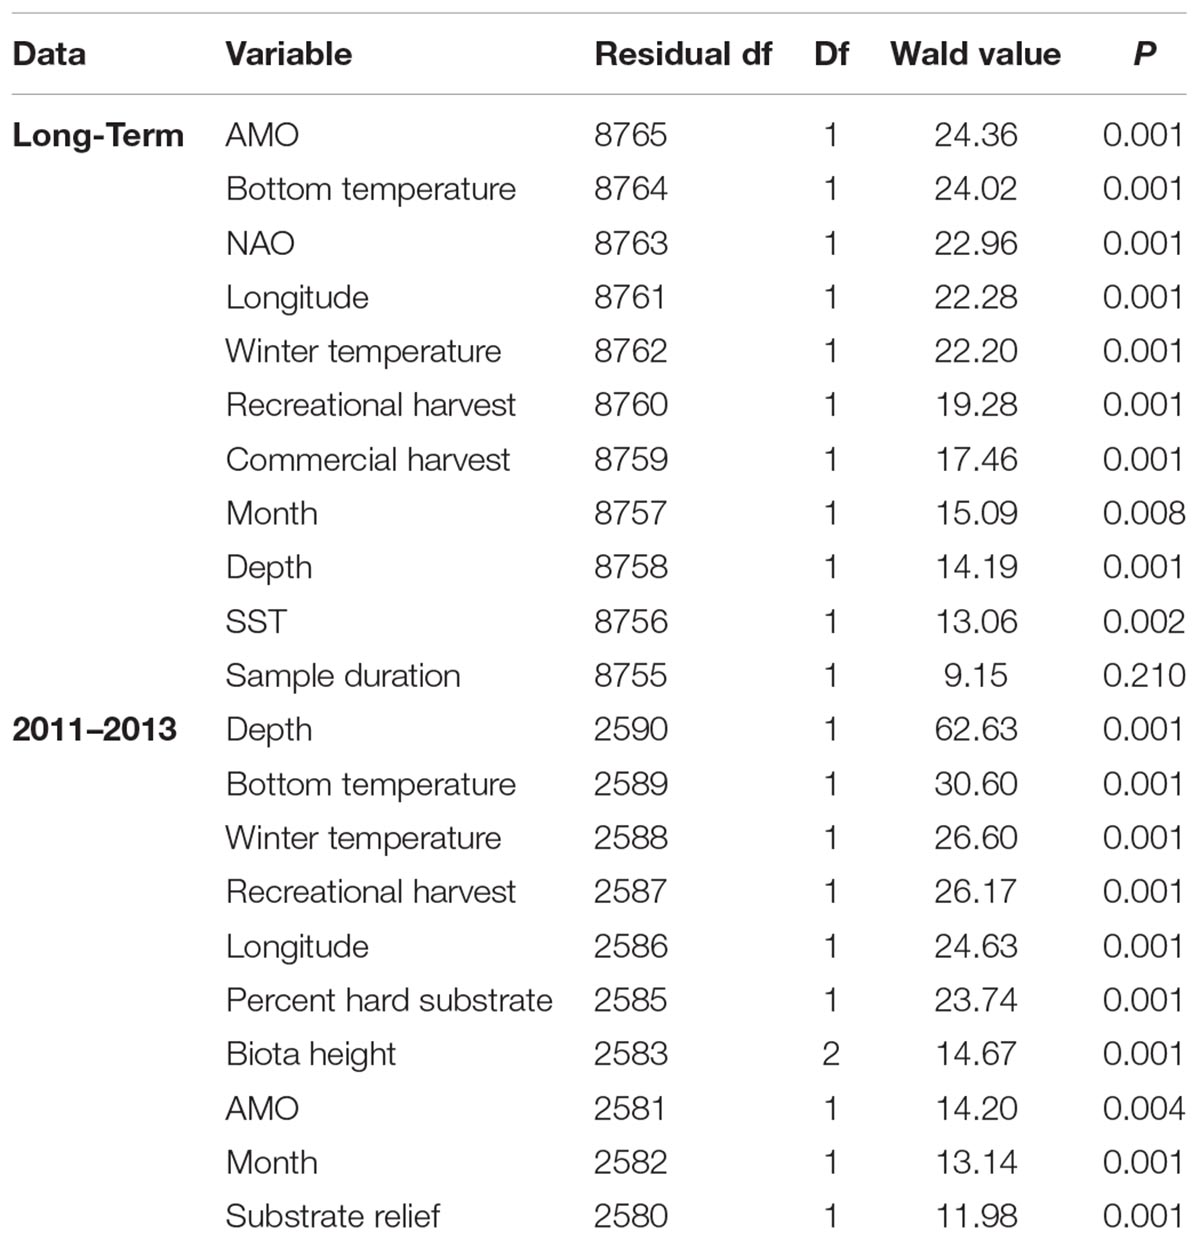
Table 2. Summary of the multivariate general linear models assessing the fish assemblage from the long-term and 3 year (2011–2013) trap data sets.
The species driving the overall significance of the predictor variables were elucidated by examining taxa-specific generalized linear models (Figure 3). Clustering the species, which had at least one significant variable, by the test statistic of each predictor variable was done to ease interpretation (Figure 3). Three species, Balistes capriscus, H. aurolineatum, and Rhomboplites aurorubens (schooling species), had positive relationships with climate indices and winter temperatures (Figure 3). Gymnothorax saxicola and Stephanolepis hispida (a moray eel and filefish, respectively) had strong negative associations with bottom temperature and the NAO. Mycteroperca phenax, Stenotomus spp., and Calamus nodosus (a grouper and two porgy taxa) had a negative relationship with recreational catch but a positive relationship with commercial catch. In addition, M. phenax and C. nodosus had commercial harvest that was greater than recreational harvest, while Stenotomus spp. are not recorded in either of the landings data (Supplementary Appendix S3). Multiple species had a positive association with recreational harvest including Haemulon plumierii (grunt), C. striata (sea bass), S. hispida (filefish), Gymnothorax vicinus (moray eel), Diplodus holbrookii (pinfish), and Centropristis ocyurus (sea bass), while Opsanus sp. (toadfish) and Gymnothorax moringa (moray eel) had negative associations. The majority of these species were not recorded in recreational harvest, except H. plumierii and C. striata, which had relatively large annual landings. Commercial catch had a positive association with C. ocyurus, R. aurorubens, and B. capriscus. The test statistics were greatest for C. ocyurus and B. capriscus, which have no recorded and relatively low commercial catch, respectively (Supplementary Appendix S4). Depth had a negative relationship with C. striata and Diplectrum formosum, but a positive association with Lutjanus vivanus. Finally, SST was positively associated with H. plumierii and Lutjanus campechanus, but negatively associated with Stenotomus spp. There were no significant relationships between the predictor variables and trophic level or vulnerability based on adjusted p-values (Table 3). However, depth and recreational fishing had significant and marginally significant relationships with vulnerability based on non-adjusted p-values.
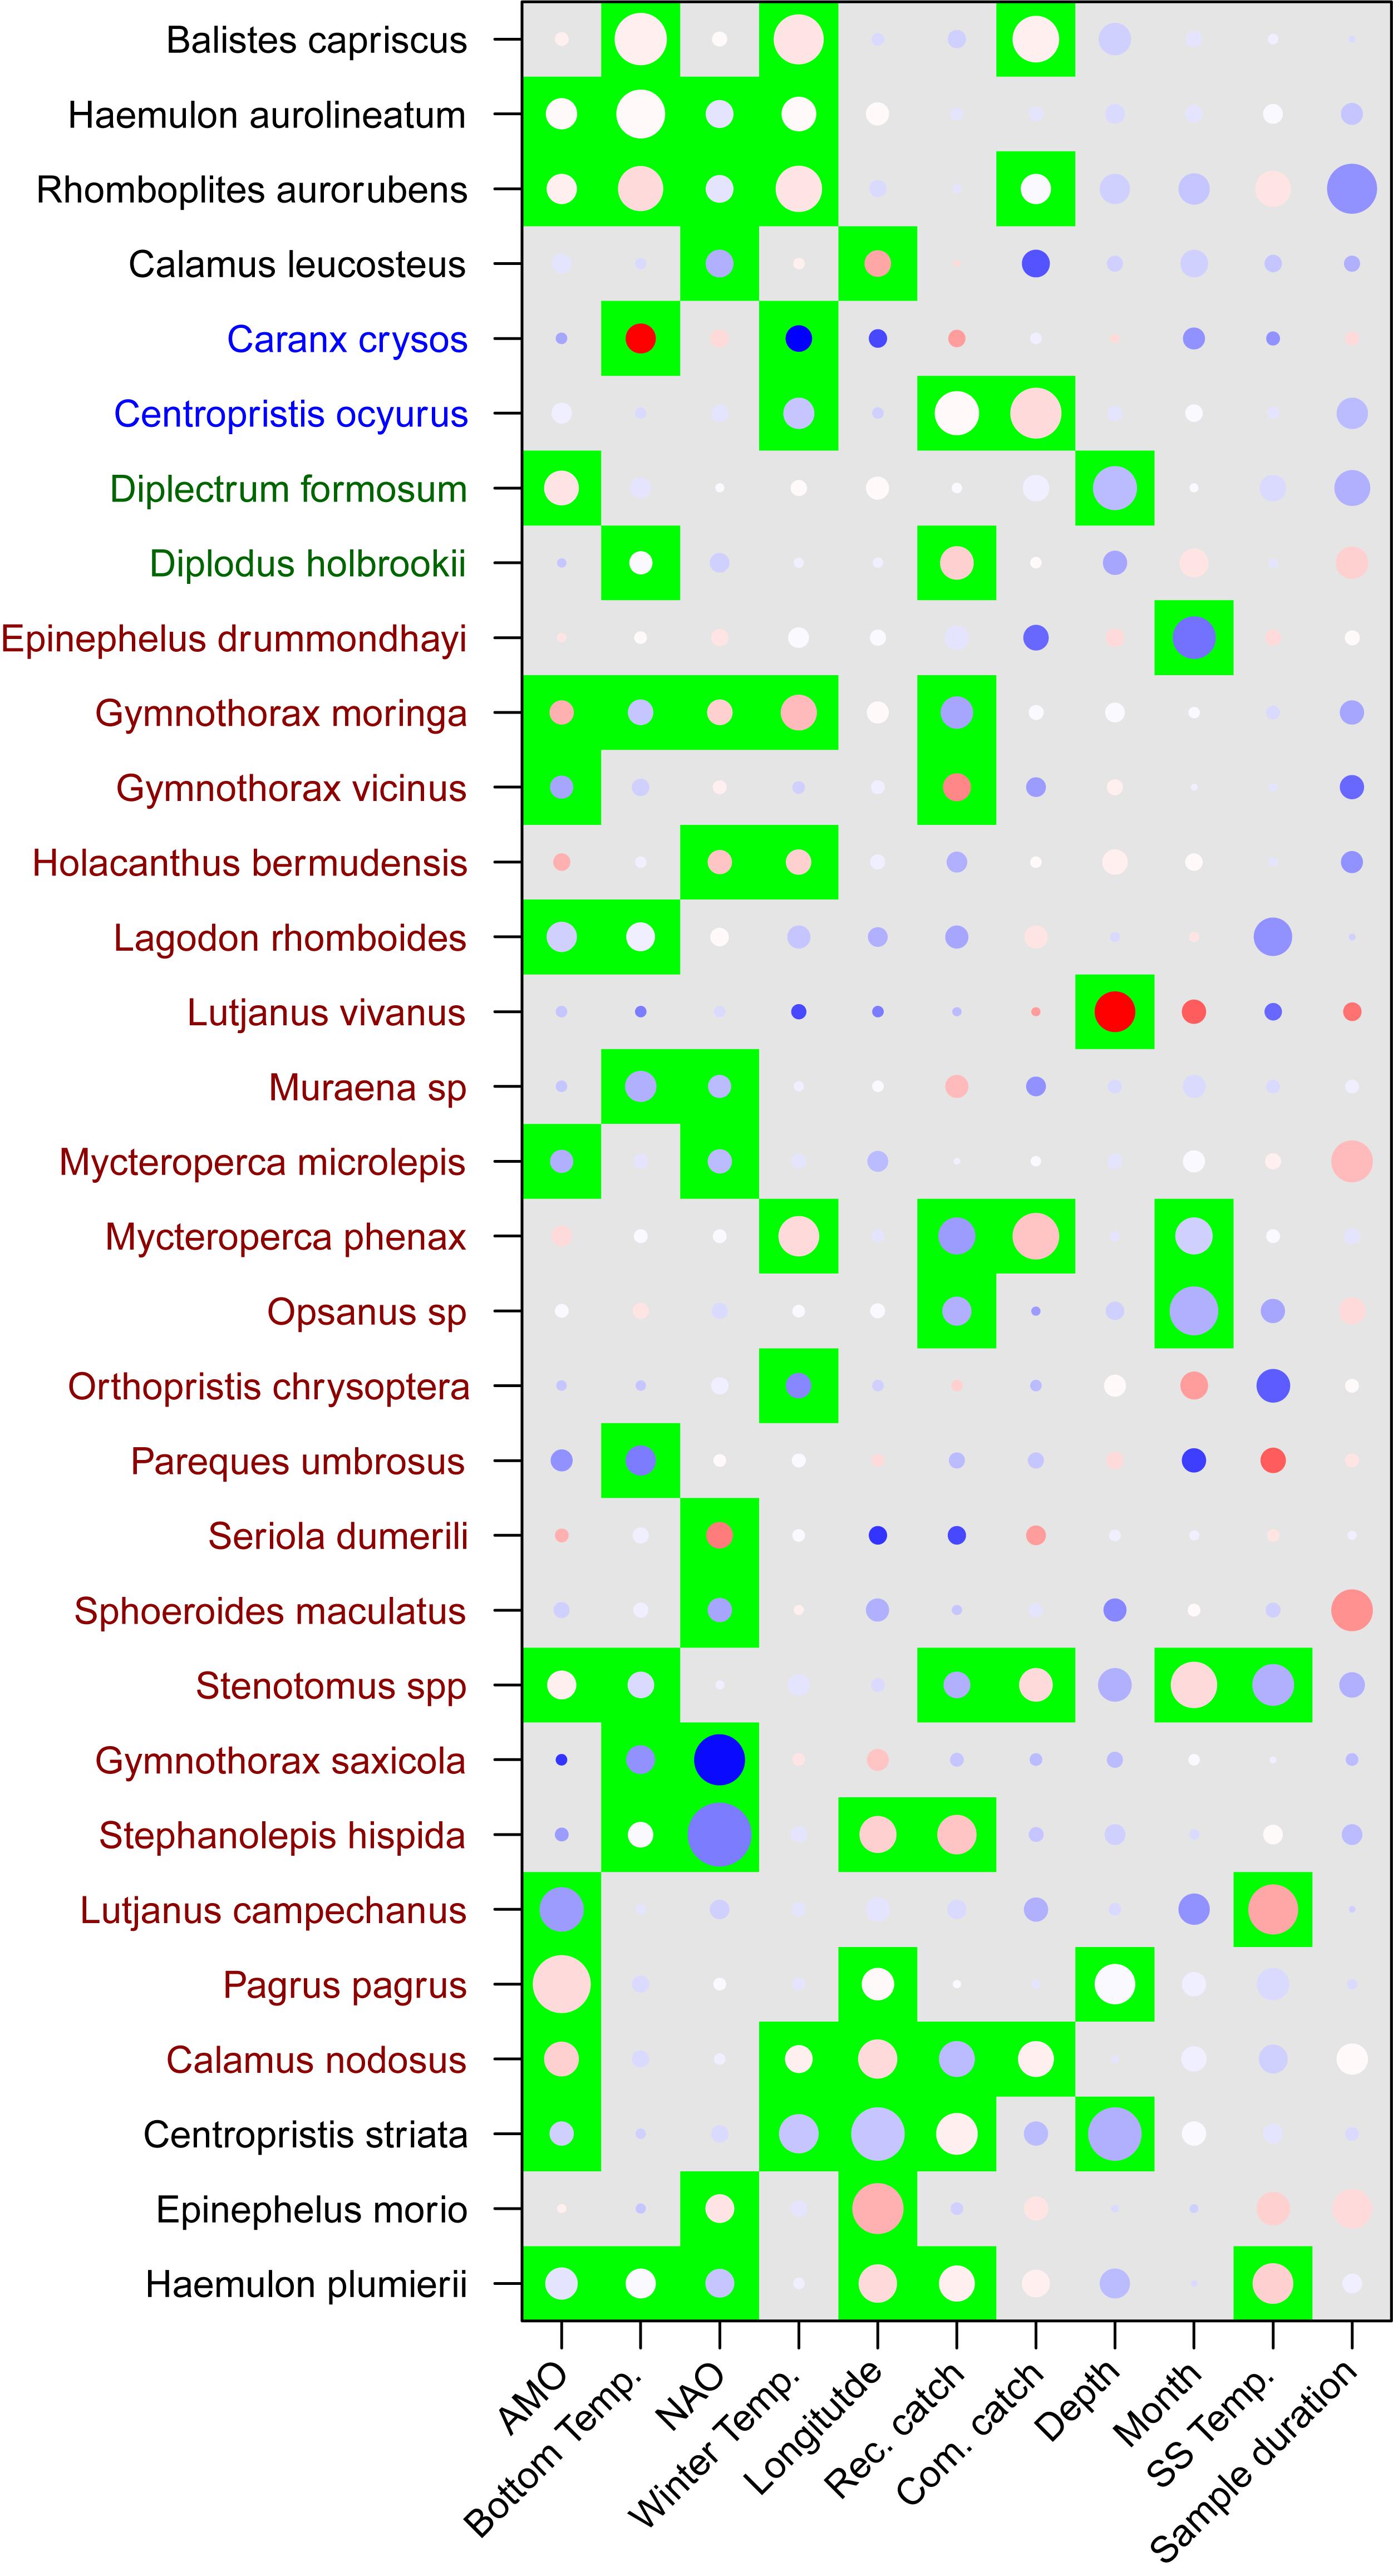
Figure 3. Results of the multivariate general linear models for fish assemblages assessed by the long-term trap survey. Species order and color along the y-axis indicate clusters based on the test statistics of independent variables. Significant variables (p < 0.05) are indicated by a green background and were adjusted for multiple tests. Magnitude of the test statistic is shown by the size of circles and the relationship between species and variables (coefficient) were shown by the color of the circle (red-positive, white-neutral, blue-negative). The test statistic and coefficient were centered and scaled within each variable.
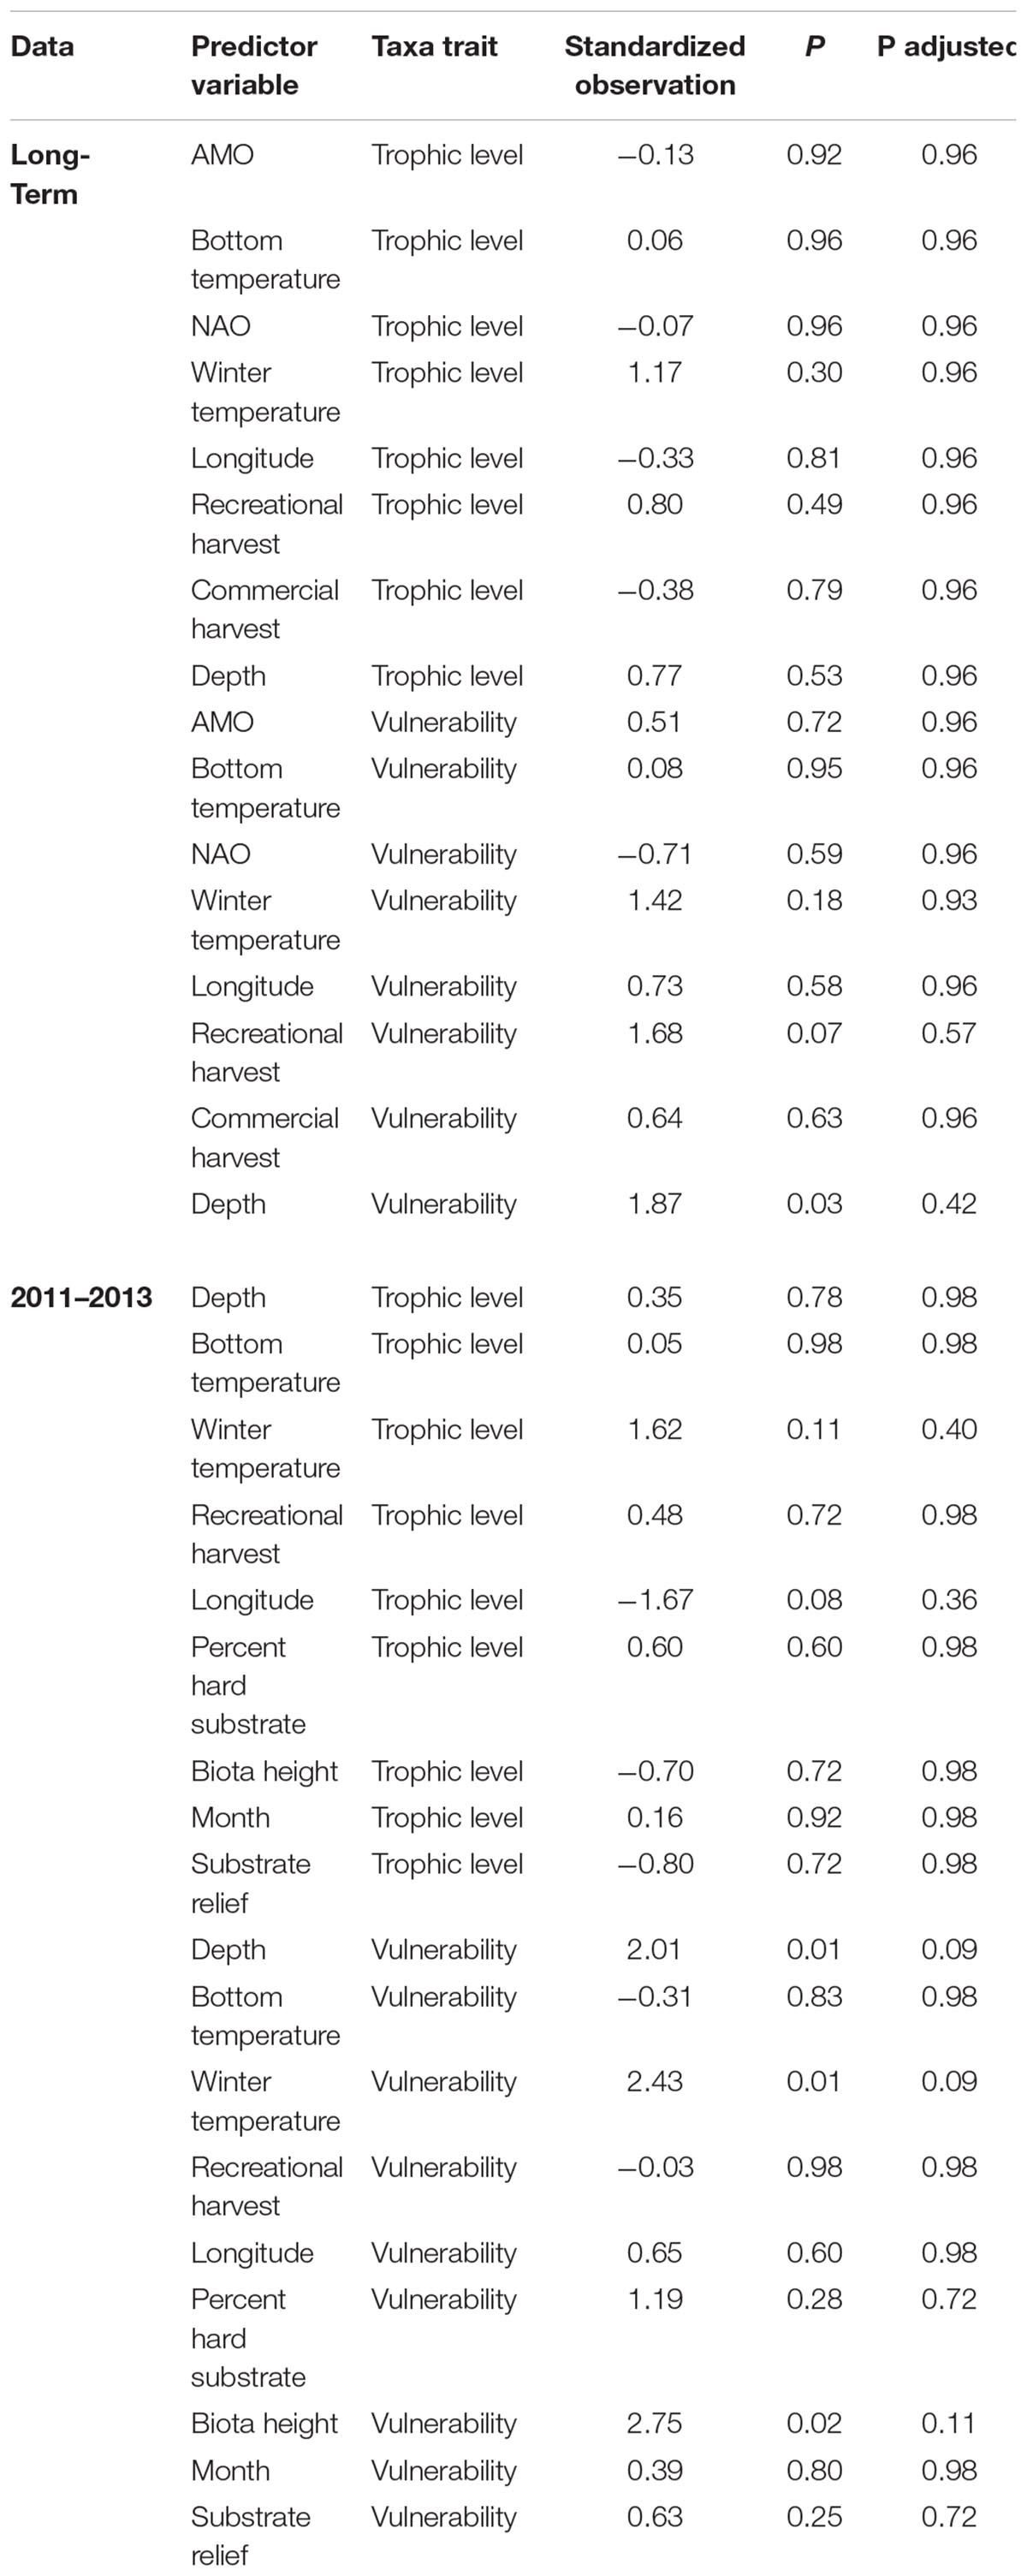
Table 3. Results of the fourth-corner analysis to determine if fish traits (trophic level and vulnerability) are related with predictor variables.
Unlike the long-term dataset, the 3-year dataset that included habitat characteristics indicated that depth was the most important predictor variable. Depth had a test statistic that was twice as large as any other predictor variable (Table 2). Similar to the long-term analysis, the 3-year dataset indicated that bottom temperature, winter temperature, and recreational harvest were the 2nd, 3rd, and 4th most important predictor variables, respectively, when ranked by test statistic. All three habitat characteristics (percent hard substrate, biota height, and substrate relief) were significant but had lower test statistics than many of the other predictor variables. The overall influence of depth was driven by a negative association with C. striata, while bottom temperature was driven by a positive association with H. aurolineatum, H. plumierii, and B. capriscus (Figure 4). Winter temperature had a negative relationship with C. ocyurus and, similar to the long-term data, recreational catch was negatively associated with C. nodosus. The percent hard substrate and biota height had primarily positive associations with several species, including H. aurolineatum, H. plumierii, Balistes capriscus, and Holocentrus adscensionis. However, substrate relief had primarily negative associations with multiple species, including Stenotomus spp. and C. ocyurus (Figure 4). Fish vulnerability was related with depth and winter temperature, although the adjusted p-value was marginally significant (Table 3; p-value <0.10). Fish trophic level had no relationship with predictor variables.
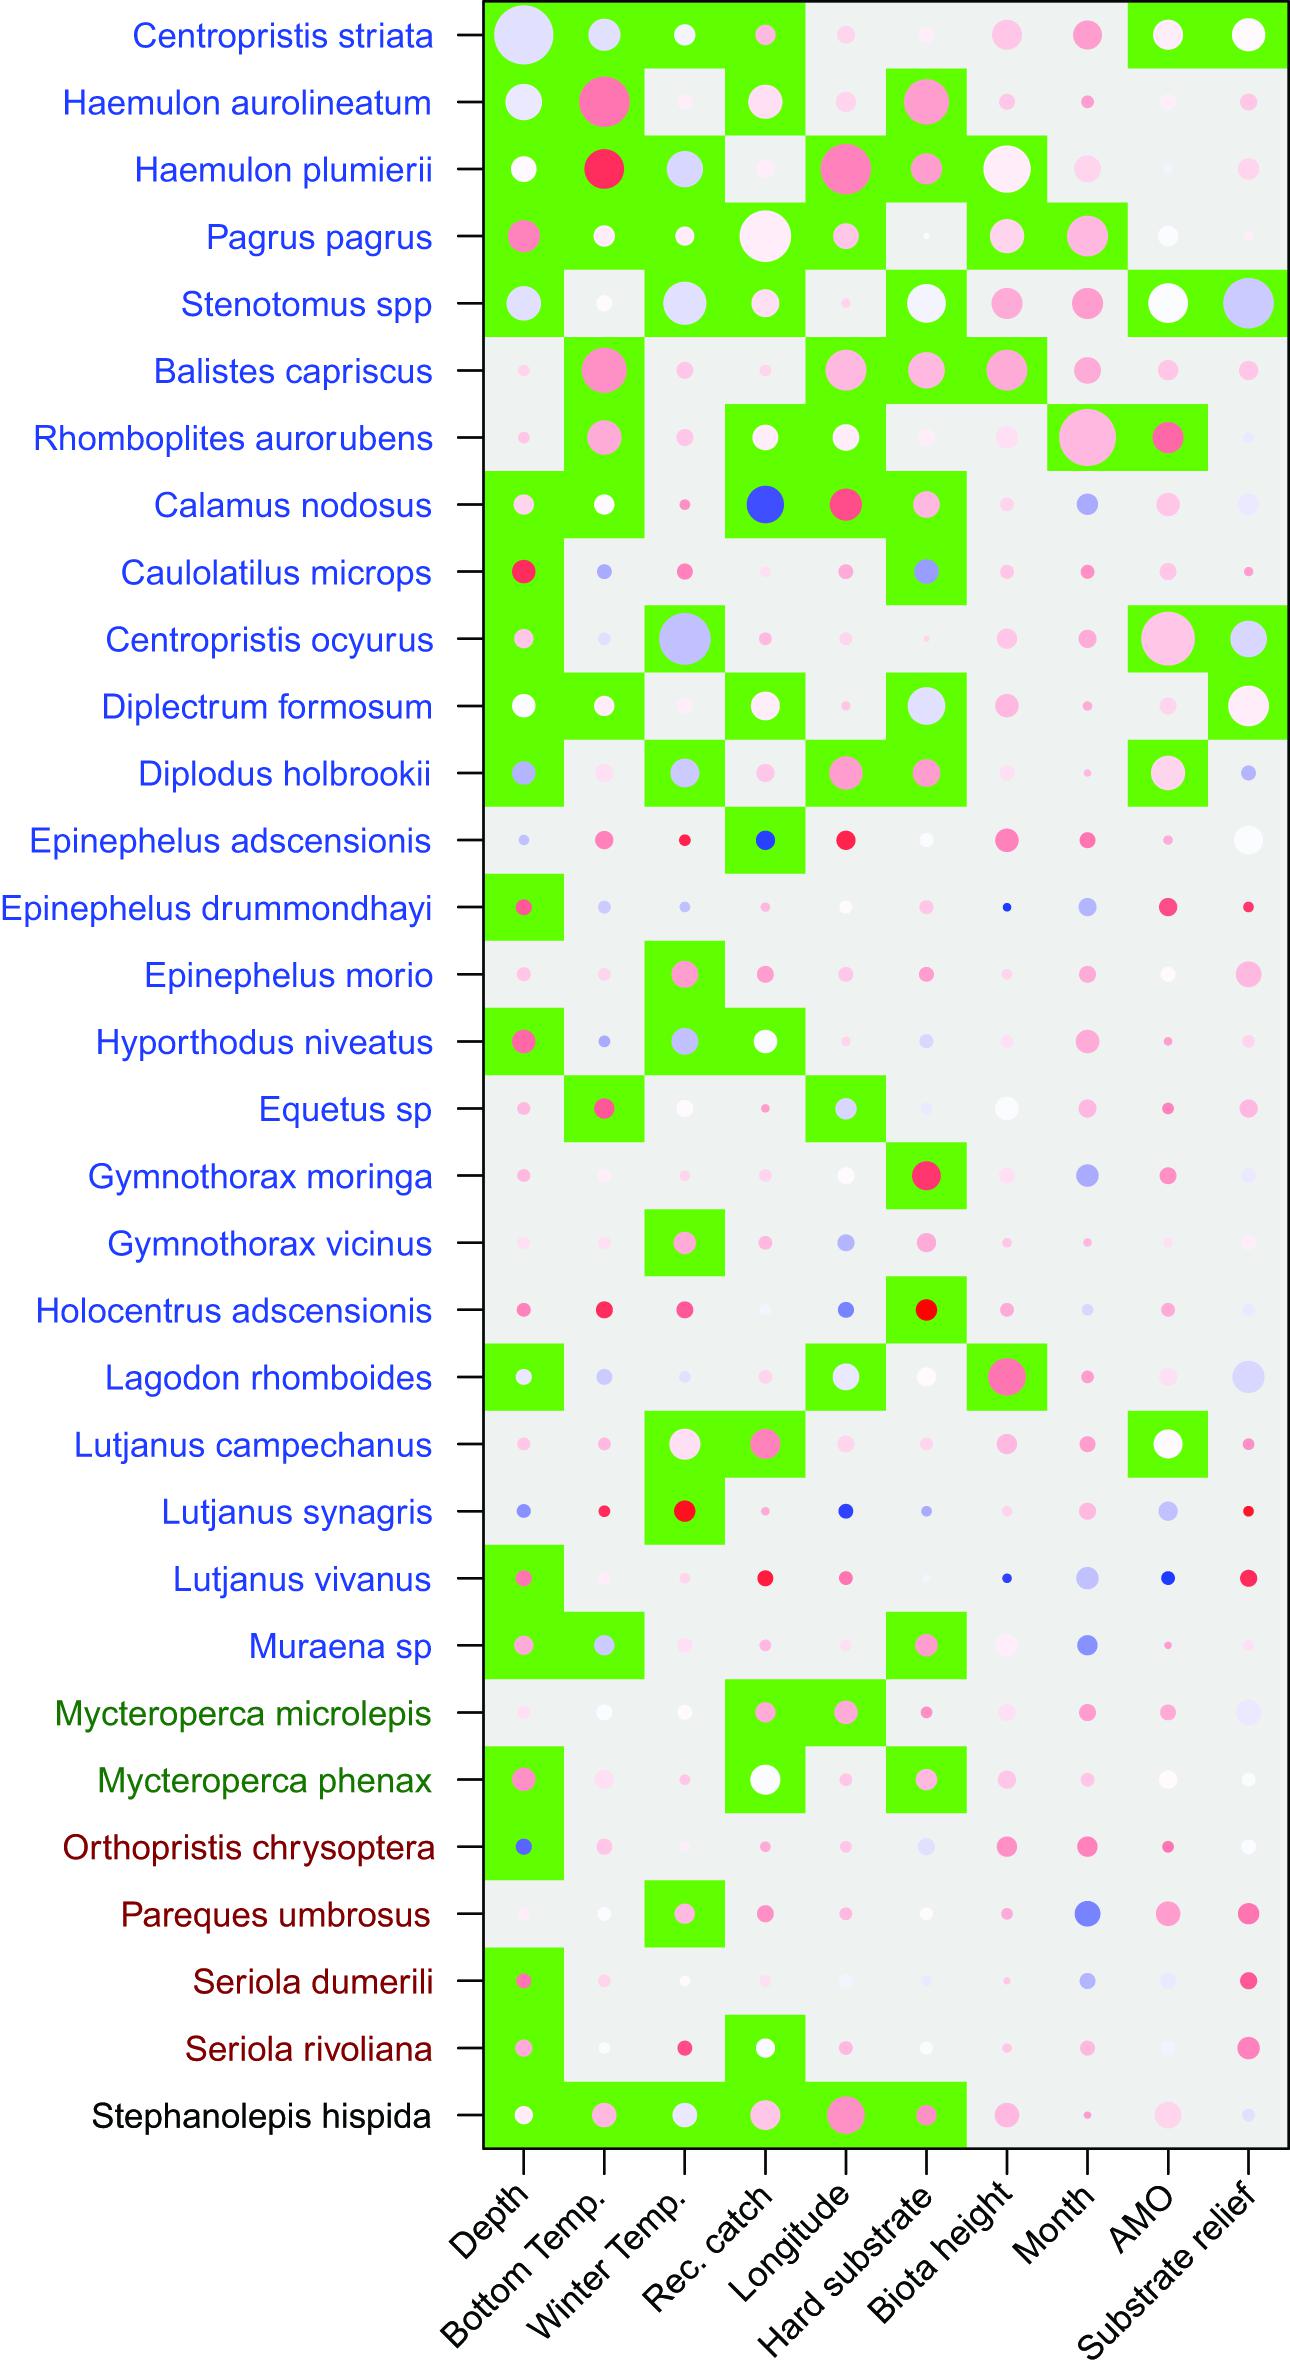
Figure 4. Results of the multivariate general linear models for fish assemblages assessed by the 3 year trap study which included habitat characteristics. Species order and color along the y-axis indicate clusters based on the test statistics of independent variables. Significant variables (p < 0.05) are indicated by a green background and were adjusted for multiple tests. Magnitude of the test statistic is shown by the size of circles and the relationship between species and variables (coefficient) were shown by the color of the circle (red-positive, white-neutral, blue-negative). The test statistic and coefficient were centered and scaled within each variable.
We found that the number of individuals and species of fish caught in the traps decreased over the past 2 decades. These results, consistent with the findings of Bacheler and Smart (2016), suggest regional-scale declines in the abundance and diversity of fishes within the surveyed region. An increase in temperature, resulting from global warming, has been suggested as a potential driver of fish community change within this large marine ecosystem (Shertzer et al., 2009; Whitfield et al., 2014). However, we found no indication that annual water temperature has increased along the Southeast United States coast over the 24 years of the study. To assess what may be causing the potential observed declines, we conducted multivariate analyses on the fish community with relevant natural and anthropogenic predictor variables. Climate indices (AMO and NAO) and bottom and winter temperature explained the greatest amount of variation in the fish community structure, followed by longitude, recreational landings and commercial landings. These findings indicate the long-term changes in the fish assemblage are driven by local temperature and large-scale climate regimes. The degree of correlation between the fish community structure and recreational harvest suggests that recreational fishing may be affecting or tracking changes in the fish community of this large marine ecosystem as much as or more than other human-related impacts that are often cited as causing ecosystem degradation, such as commercial fishing (Worm et al., 2006; Shelton and Mangel, 2011).
Changes in large-scale climate patterns from both anthropogenic warming and natural cycles can affect marine communities. Global warming-driven temperature changes can cause shifts in the latitude, longitude, and depth of fish populations (Perry et al., 2005; Fodrie et al., 2010; Pinsky et al., 2013) and has altered community structure of ecosystems within a similar time period as this study (Hiddink and Ter Hofstede, 2008; Stuart-Smith et al., 2010). Our findings suggest that water temperature in the study region did not increase from 1990 to 2013, which is in agreement with global predictions of warming for this region (Burrows et al., 2011) and unlike other global warming studies that have found increased temperature over a similar time period, such as by ∼0.5°C on temperate reefs around Tasmania (Stuart-Smith et al., 2010) and by ∼1.9°C in the North Sea (Hiddink and Ter Hofstede, 2008). Climate indices such as the AMO are natural cycles that affect regional-scale temperatures and abiotic and biotic factors. For example, the AMO was a leading cause of changes in fish communities in the Gulf of Mexico (Karnauskas et al., 2015). The AMO shifted to a positive phase in the mid-1990s and has a cycle that lasts 65–70 years (Nye et al., 2014). Fish abundance and richness were in decline 5 years prior to the switch in the AMO, and the AMO explained the most variation in the fish assemblage of all the predictor variables included the long-term analysis. This result suggests that the observed fish community declines could be a result of decadal changes in climate oscillations which affect mixing and vertical gradients, as well as large scale circulation such as the Gulf stream (Frajka-Williams et al., 2017). Climate indices explained the most variation in the fish assemblage with a 3 year lag, which agrees with existing studies that climate indices alter growth and survival of early life stages, and these affects are not quantified until the fishes are large enough to be caught (Nye et al., 2009, 2014; Karnauskas et al., 2015). For the Southeast United States Atlantic coast, we did not find evidence that fish have experienced changes in water temperature as would be expected from global warming, but we did find that climate indices and temperature (bottom and winter surface) measures had the greatest influence on the fish assemblage. Winter SST was positively related to fish vulnerability, suggesting that larger, longer-lived taxa are more abundant during periods with warmer winters. Thus, changes in climate indices and temperature from both natural and anthropogenic drivers will significantly affect temperate reef fishes.
In contrast to the long-term analysis, changes in the short-term (3 years) fish assemblage was driven by depth. Previous research performed over smaller scales (over 1 year and approximately 10–1000 km2) found a comparable influence of depth in shaping fish communities (Moore et al., 2010, 2011; Fitzpatrick et al., 2012). Depth-related changes in reef fish community structure could be driven by biotic factors, including changes in predation (Jordan et al., 2012) or abundance of prey availability with depth, and abiotic factors including changes in depth-specific seasonal temperature (Whitfield et al., 2014). Depth was positively related with fish vulnerability, although marginally significant, suggesting that larger, longer-lived taxa are more abundant in deeper waters. The diminished influence of depth in the long-term analysis indicated that depth plays a secondary role compared to climactic- and temperature-related variables in affecting decadal-scale changes in the fish assemblage.
To gain a holistic understanding of the factors that effect the fish assemblage on temperate reefs we have included variables that have different spatial and temporal scales. For example, climate indices only changed through time (the same for all traps each year), while other variables such as depth and bottom temperature changed through both time and space. Although our results could be affected by these differences, our conclusions are likely robust regardless of the scale of the variable for the following reasons. First, the multivariate analysis bases significance on permutations that randomly shuffle samples to determine if the variable explains more variation than would be expected by chance. Second, the variables that explained the most variation were measured at both fine and broad scale (bottom temperature and NAO), suggesting that results were not dependent or inflated by scale alone. Third, variables that only changed through time explained minimal variation in the short-term analysis, which is expected given that there was little difference in these variables over 3 years. It is also worth noting that there are other variables that were not included which likely effect variation in fish community structure including but not limited to primary production, turbidity (Floeter et al., 2001; Karnauskas et al., 2015), and landscape mosaics (Moore et al., 2011).
The relatively limited amount of variance in reef fish community structure explained by habitat characteristics was surprising given that habitat characteristics are often related to abundance and diversity of reef fish (Lindberg et al., 2006; Schobernd and Sedberry, 2009). In the present study, the three habitat variables (percent hard substrate, substrate relief, and biota height) each explained less variance than most other variables. The minimal variance explained by habitat variables in this study may have resulted from a scale mismatch (Kendall et al., 2011), with fish responding to habitat characteristics over a broader spatial scale (e.g., hundreds of m2) than the scale at which habitat characteristics were assessed from the video data (tens of m2). However, other studies indicate that habitat characteristics play a minimal role in shaping the temperate, reef fish assemblage (Paxton et al., 2017).
Many studies have found that anthropogenic impacts, particularly commercial fishing, can alter marine food webs and cause regime shifts over similar time spans as this survey (Mollmann et al., 2009; Link et al., 2010). For instance, Link et al. (2010) found that commercial fishing had a greater impact than climatic indices on soft bottom and pelagic marine ecosystems within the Northern Hemisphere. Our findings indicate the opposite, with climate indices being more related to changes in fish community structure than fishery landings, and with recreational landings being slightly more correlated with community change than commercial landings. In general, the contribution of recreational fishing to stock declines and ecosystem alterations has been underappreciated compared to commercial fishing (Post et al., 2002; Cooke and Cowx, 2006), especially in the marine environment (Lewin et al., 2006). This is surprising given that recreational fishing can alter ecosystems in similar ways as commercial fishing, which includes altering age and size structure, habitat modifications, and trophic interactions (Cooke and Cowx, 2006; Lewin et al., 2006; Altieri et al., 2012). In addition, recreational landings exceed commercial landings on temperature reefs in areas around the globe, including the Gulf of Mexico (Coleman et al., 2004), the California coast (Schroeder and Love, 2002), and Australia (McPhee et al., 2002). To our knowledge this is the first large-scale marine study that combined both recreational and commercial landings with an ecological survey to compare the relative association of these two fisheries on fish community structure.
Our analysis was based on correlation and given the dynamic nature of fisheries (altering targets, effort and location to maximize catch) it cannot determine causation, but discussing potential mechanisms can facilitate future research. For the years covered in this study, total annual commercial landings were greater than recreational landings, but recreational landings were greater for a majority of the individual species (13 of the 21 species quantified in both fisheries; Supplementary Appendix S3). It is important to understand that our analysis only considered total annual catch of the individual fisheries and not the catch of individual species which was included in the analysis for the trap survey. Although two species caught by commercial fishers, M. phenax and C. nodosus, did have a negative relationship with this fishery there were fewer species with negative relationships with commercial compared to recreational harvest probably because the commercial fishery primarily targets snapper and grouper (Supplementary Appendix S3; Coleman et al., 1999) and these commercially target fishes do not make up a large percentage of the trap catch, with the exception of R. aurorubens. In addition, the greater correlation between recreational landings and changes in the fish community could result from recreational fishing targeting a broader range of species than the commercial fishery because commercial fishers have more incentive to target species with the greatest economic return. Finally, species caught in the survey had more positive relationships with recreational harvest compared to commercial harvest and the majority of these are not targeted by fishers. These species were primarily smaller species and omnivores who could benefit both from the reduced predation and competition of species that are targeted by harvesters. The findings of the multivariate analysis on fisheries likely result from the following coexistent factors, harvest reduces fish abundance (direct negative relationship), harvest is greatest in areas of highest fish abundance (direct positive relationship), and release of non-target fishes from predation and competition (indirect positive relationship). Although not significant, recreational harvest had the second greatest relationship with fish vulnerability. This may suggest that recreational fishing affects larger, longer-lived fish taxa that are trapped in the survey. Our findings highlight that overall fishery landings summed across all species may not strongly correlate with changes in communities (Arlinghaus and Cooke, 2005) and that recreational fishing could be affecting communities as much as commercial fishing, given that associations between commercial fishing and fishes has altered marine ecosystems (Mollmann et al., 2009; Link et al., 2010).
Data generated from large-scale, long-term ecological surveys can be particularly useful for elucidating which factors affect community structure, and the relative importance of those factors (Hughes et al., 2005). Our study provides the first quantification of the factors, both natural and anthropogenic, that affect the community structure of temperate reef fish over broad spatial and temporal scales. We found that long-term fish community structure in this large marine ecosystem is primarily driven by climate indices, temperature, and fishing. The importance of climate indices highlights the need for long-term data and inclusion of these variables when assessing changes in communities.
The study was conducted following NOAA NMFS animal use protocols.
NG, GK, and NB conceived the study. NG compiled and analyzed the data. NG wrote the initial draft. GK and NB had substantial input in editing the manuscript.
NG was supported by a National Research Council Fellowship.
The authors declare that the research was conducted in the absence of any commercial or financial relationships that could be construed as a potential conflict of interest.
We thank SERFS staff (particularly MARMAP personnel) for data collection and management, as well as numerous volunteers for field work. We also thank the captains and crews of the R/V Palmetto, R/V Savannah, and the NOAA Ships Nancy Foster and Pisces for their assistance and A. Anton and J. Hare for comments on earlier versions of the manuscript.
The Supplementary Material for this article can be found online at: https://www.frontiersin.org/articles/10.3389/fmars.2019.00030/full#supplementary-material
APPENDIX S1 | Detailed methods for quantifying habitat characteristics, lionfish, SST, Climate indices, and fishery landings.
APPENDIX S2 | Species included in the trap survey analysis from 1990 to 2013.
APPENDIX S3 | Species included in the commercial and recreational landings.
APPENDIX S4 | Commercial and recreational fisheries landings through time in each state.
APPENDIX S5 | Relationship between the dissimilarity of fish community structure and distance among traps for 2011–2013.
Altieri, A. H., Bertness, M. D., Coverdale, T. C., Herrmann, N. C., and Angelini, C. (2012). A trophic cascade triggers collapse of a salt-marsh ecosystem with intensive recreational fishing. Ecology 93, 1402–1410. doi: 10.1890/11-1314.1
Arlinghaus, R., and Cooke, S. J. (2005). Global impact of recreational fisheries. Science 307, 1561–1563. doi: 10.1126/science.307.5715.1561
Bacheler, N. M., Berrane, D. J., Mitchell, W. A., Schobernd, C. M., Schobernd, Z. H., Teer, B. Z., et al. (2014). Environmental conditions and habitat characteristics influence trap and video detection probabilities for reef fish species. Mar. Ecol. Prog. Ser. 517, 1–14. doi: 10.3354/meps11094
Bacheler, N. M., and Smart, T. I. (2016). Multi-decadal decline in reef fish abundance and species richness in the southeast USA assessed by standardized trap catches. Mar. Biol. 163:26. doi: 10.1007/s00227-015-2774-x
Ballenger, J. C., Smart, T. I., and Reichert, M. J. M. (2011). Trends in Relative Abundance of Reef Fishes in Waters Off the SE US Based on Fishery-Independent Surveys. MARMAP Technical Report No. 2012–2018. Charleston, SC South Carolina Department of Natural Resources.
Boettiger, C., Lang, D. T., and Wainwright, P. C. (2012). rfishbase: exploring, manipulating and visualizing FishBase data from R. J. Fish Biol. 81, 2030–2039. doi: 10.1111/j.1095-8649.2012.03464.x
Burrows, M. T., Schoeman, D. S., Buckley, L. B., Moore, P., Poloczanska, E. S., Brander, K. M., et al. (2011). The pace of shifting climate in marine and terrestrial ecosystems. Science 334, 652–655. doi: 10.1126/science.1210288
Claudet, J., García-Charton, J. A., and Lenfant, P. (2011). Combined effects of levels of protection and environmental variables at different spatial resolutions on fish assemblages in a marine protected area. Conserv. Biol. 25, 105–114. doi: 10.1111/j.1523-1739.2010.01586.x
Coleman, F., Koenig, C., Eklund, A., and Grimes, C. (1999). Management and conservation of temperate reef fishes in the grouper-snapper complex of the southeastern United States. Life Slow Lane – Ecol. Conserv. Long Lived Mar. 23, 233–242.
Coleman, F., Koenig, C., Huntsman, G., Musick, J., Eklund, A., McGovern, J., et al. (2000). Long-lived reef fishes: the grouper-snapper complex. Fisheries 25, 14–21. doi: 10.1577/1548-8446(2000)025<0014:LRF>2.0.CO;2
Coleman, F. C., Figueira, W. F., Ueland, J. S., and Crowder, L. B. (2004). The impact of United States recreational fisheries on marine fish populations. Science 305, 1958–1960. doi: 10.1126/science.1100397
Collins, M. (1990). A comparison of three fish trap designs. Fish. Res. 9, 325–332. doi: 10.1016/0165-7836(90)90051-V
Cooke, S. J., and Cowx, I. G. (2006). Contrasting recreational and commercial fishing: searching for common issues to promote unified conservation of fisheries resources and aquatic environments. Biol. Conserv. 128, 93–108. doi: 10.1016/j.biocon.2005.09.019
Crain, C. M., Kroeker, K., and Halpern, B. S. (2008). Interactive and cumulative effects of multiple human stressors in marine systems. Ecol. Lett. 11, 1304–1315. doi: 10.1111/j.1461-0248.2008.01253.x
Dray, S., and Dufour, A. B. (2007). The ade4 package: implementing the duality diagram for ecologists. J. Stat. Softw. 22, 1–20. doi: 10.18637/jss.v022.i04
Dray, S., and Legendre, P. (2008). Testing the species traits–environment relationships: the fourth-corner problem revisited. Ecology 89, 3400–3412. doi: 10.1890/08-0349.1
Figueira, W. F., and Coleman, F. C. (2010). Comparing landings of united states recreational fishery sectors. Bull. Mar. Sci. 86, 499–514.
Fitzpatrick, B. M., Harvey, E. S., Heyward, A. J., Twiggs, E. J., and Colquhoun, J. (2012). Habitat specialization in tropical continental shelf demersal fish assemblages. PLoS One 7:e39634. doi: 10.1371/journal.pone.0039634
Floeter, S. R., Guimarães, R. Z. P., Rocha, L. A., Ferreira, C. E. L., Rangel, C. A., and Gasparini, J. L. (2001). Geographic variation in reef-fish assemblages along the Brazilian coast. Glob. Ecol. Biogeogr. 10, 423–431. doi: 10.1046/j.1466-822X.2001.00245.x
Fodrie, F. J., Heck, K. L., Powers, S. P., Graham, W. M., and Robinson, K. L. (2010). Climate-related, decadal-scale assemblage changes of seagrass-associated fishes in the northern Gulf of Mexico. Glob. Change Biol. 16, 48–59. doi: 10.1111/j.1365-2486.2009.01889.x
Frajka-Williams, E., Beaulieu, C., and Duchez, A. (2017). Emerging negative atlantic multidecadal oscillation index in spite of warm subtropics. Sci. Rep. 7:11224. doi: 10.1038/s41598-017-11046-x
Froese, R., and Pauly, D. (2017). FishBase. World Wide Web Electronic Publication. Available at: www.fishbase.org
Fujita, T., Kitagawa, D., Okuyama, Y., Jin, Y., Ishito, Y., and Inada, T. (1996). Comparison of fish assemblages among an artificial reef, a natural reef and a sandy-mud bottom site on the shelf off Iwate, northern Japan. Environ. Biol. Fishes 46, 351–364. doi: 10.1007/BF00005013
Halpern, B. S., Walbridge, S., Selkoe, K. A., Kappel, C. V., Micheli, F., D’Agrosa, C., et al. (2008). A global map of human impact on marine ecosystems. Science 319, 948–952. doi: 10.1126/science.1149345
Hiddink, J. G., and Ter Hofstede, R. (2008). Climate induced increases in species richness of marine fishes. Glob. Change Biol. 14, 453–460. doi: 10.1111/j.1365-2486.2007.01518.x
Hughes, T. P., Bellwood, D. R., Folke, C., Steneck, R. S., and Wilson, J. (2005). New paradigms for supporting the resilience of marine ecosystems. Trends Ecol. Evol. 20, 380–386. doi: 10.1016/j.tree.2005.03.022
Hui, F. K. C., Taskinen, S., Pledger, S., Foster, S. D., and Warton, D. I. (2015). Model-based approaches to unconstrained ordination. Methods Ecol. Evol. 6, 399–411. doi: 10.1111/2041-210X.12236
Jackson, J. B. C., Kirby, M. X., Berger, W. H., Bjorndal, K. A., Botsford, L. W., Bourque, B. J., et al. (2001). Historical overfishing and the recent collapse of coastal ecosystems. Science 293, 629–637. doi: 10.1126/science.1059199
Jordan, L. K. B., Lindeman, K. C., and Spieler, R. E. (2012). Depth-variable settlement patterns and predation influence on newly settled reef fishes (Haemulon spp. Haemulidae). PLoS One 7:e50897. doi: 10.1371/journal.pone.0050897
Karnauskas, M., and Babcock, E. A. (2012). Comparisons between abundance estimates from underwater visual census and catch-per-unit-effort in a patch reef system. Mar. Ecol. Prog. Ser. 468, 217–230. doi: 10.3354/meps10007
Karnauskas, M., Schirripa, M. J., Craig, J. K., Cook, G. S., Kelble, C. R., Agar, J. J., et al. (2015). Evidence of climate-driven ecosystem reorganization in the Gulf of Mexico. Glob. Change Biol. 21, 2554–2568. doi: 10.1111/gcb.12894
Kendall, M. S., Miller, T. J., and Pittman, S. J. (2011). Patterns of scale-dependency and the influence of map resolution on the seascape ecology of reef fish. Mar. Ecol. Prog. Ser. 427, 259–274. doi: 10.3354/meps08945
Legendre, P., and Fortin, M. (1989). Spatial pattern and ecological analysis. Vegetatio 80, 107–138. doi: 10.1007/BF00048036
Legendre, P., Galzin, R., and Harmelin-Vivien, M. L. (1997). Relating behavior to habitat: solutions to thefourth-corner problem. Ecology 78, 547–562. doi: 10.1890/0012-9658(1997)078[0547:RBTHST]2.0.CO;2
Lewin, W.-C., Arlinghaus, R., and Mehner, T. (2006). Documented and potential biological impacts of recreational fishing: insights for management and conservation. Rev. Fish. Sci. 14, 305–367. doi: 10.1080/10641260600886455
Lindberg, W., Frazer, T., Portier, K., Vose, F., Loftin, J., Murie, D., et al. (2006). Density-dependent habitat selection and performance by a large mobile reef fish. Ecol. Appl. 16, 731–746. doi: 10.1890/1051-0761(2006)016[0731:DHSAPB]2.0.CO;2
Link, J. S., Yemane, D., Shannon, L. J., Coll, M., Shin, Y.-J., Hill, L., et al. (2010). Relating marine ecosystem indicators to fishing and environmental drivers: an elucidation of contrasting responses. ICES J. Mar. Sci. J. Cons. 67, 787–795. doi: 10.1093/icesjms/fsp258
Marshall, S., and Elliott, M. (1998). Environmental influences on the fish assemblage of the Humber estuary. U.K. Estuar. Coast. Shelf Sci. 46, 175–184. doi: 10.1006/ecss.1997.0268
McPhee, D. P., Leadbitter, D., and Skilleter, G. (2002). Swallowing the bait: is recreational fishing in Australia ecologically sustainable? Pac. Conserv. Biol. 8, 40–51. doi: 10.1071/PC020040
Mollmann, C., Diekmann, R., Müller-Karulis, B., Kornilovs, G., Plikshs, M., and Axe, P. (2009). Reorganization of a large marine ecosystem due to atmospheric and anthropogenic pressure: a discontinuous regime shift in the Central Baltic Sea. Glob. Change Biol. 15, 1377–1393. doi: 10.1111/j.1365-2486.2008.01814.x
Moore, C. H., Harvey, E. S., and Niel, K. V. (2010). The application of predicted habitat models to investigate the spatial ecology of demersal fish assemblages. Mar. Biol. 157, 2717–2729. doi: 10.1007/s00227-010-1531-4
Moore, C. H., Van Niel, K., and Harvey, E. S. (2011). The effect of landscape composition and configuration on the spatial distribution of temperate demersal fish. Ecography 34, 425–435. doi: 10.1111/j.1600-0587.2010.06436.x
Nye, J. A., Baker, M. R., Bell, R., Kenny, A., Kilbourne, K. H., Friedland, K. D., et al. (2014). Ecosystem effects of the Atlantic Multidecadal Oscillation. J. Mar. Syst. 133, 103–116. doi: 10.1016/j.jmarsys.2013.02.006
Nye, J. A., Link, J. S., Hare, J. A., and Overholtz, W. J. (2009). Changing spatial distribution of fish stocks in relation to climate and population size on the Northeast United States continental shelf. Mar. Ecol. Prog. Ser. 393, 111–129. doi: 10.3354/meps08220
Paxton, A. B., Pickering, E. A., Adler, A. M., Taylor, J. C., and Peterson, C. H. (2017). Flat and complex temperate reefs provide similar support for fish: evidence for a unimodal species-habitat relationship. PLoS One 12:e0183906. doi: 10.1371/journal.pone.0183906
Perry, A. L., Low, P. J., Ellis, J. R., and Reynolds, J. D. (2005). Climate change and distribution shifts in marine fishes. Science 308, 1912–1915. doi: 10.1126/science.1111322
Pinsky, M. L., Worm, B., Fogarty, M. J., Sarmiento, J. L., and Levin, S. A. (2013). Marine taxa track local climate velocities. Science 341, 1239–1242. doi: 10.1126/science.1239352
Post, J. R., Sullivan, M., Cox, S., Lester, N. P., Walters, C. J., Parkinson, E. A., et al. (2002). Canada’s recreational fisheries: the invisible collapse? Fisheries 27, 6–17. doi: 10.1577/1548-8446(2002)027<0006:CRF>2.0.CO;2
R Development Core Team (2012). R: A Language and Environment for Statistical Computing. Vienna: R Foundation for Statistical Computing.
Russ, G. R., Miller, K. I., Rizzari, J. R., and Alcala, A. C. (2015). Long-term no-take marine reserve and benthic habitat effects on coral reef fishes. Mar. Ecol. Prog. Ser. 529, 233–248. doi: 10.3354/meps11246
Schobernd, C. M., and Sedberry, G. R. (2009). Shelf-edge and upper-slope reef fish assemblages in the South Atlantic Bight: habitat characteristics, spatial variation, and reproductive behavior. Bull. Mar. Sci. 84, 67–92.
Schroeder, D. M., and Love, M. (2002). Recreational fishing and marine fish populations in California. Calif. Cooperat. Ocean. Fish. Investig. Rep. 43, 182–190.
Shelton, A. O., and Mangel, M. (2011). Fluctuations of fish populations and the magnifying effects of fishing. Proc. Natl. Acad. Sci. U.S.A. 108, 7075–7080. doi: 10.1073/pnas.1100334108
Shertzer, K. W., Williams, E. H., and Taylor, J. C. (2009). Spatial structure and temporal patterns in a large marine ecosystem: exploited reef fishes of the southeast United States. Fish. Res. 100, 126–133. doi: 10.1016/j.fishres.2009.06.017
Stuart-Smith, R. D., Barrett, N. S., Stevenson, D. G., and Edgar, G. J. (2010). Stability in temperate reef communities over a decadal time scale despite concurrent ocean warming. Glob. Change Biol. 16, 122–134. doi: 10.1111/j.1365-2486.2009.01955.x
Ter Braak, C. J., Peres-Neto, P., and Dray, S. (2017). A critical issue in model-based inference for studying trait-based community assembly and a solution. PeerJ 5:e2885. doi: 10.7717/peerj.2885
Wang, Y., Naumann, U., Wright, S. T., and Warton, D. I. (2012). mvabund– an R package for model-based analysis of multivariate abundance data. Methods Ecol. Evol. 3, 471–474. doi: 10.1111/j.2041-210X.2012.00190.x
Warton, D. I., Blanchet, F. G., O’Hara, R. B., Ovaskainen, O., Taskinen, S., Walker, S. C., et al. (2015). So many variables: joint modeling in community ecology. Trends Ecol. Evol. 30, 766–779. doi: 10.1016/j.tree.2015.09.007
Warton, D. I., Wright, S. T., and Wang, Y. (2012). Distance-based multivariate analyses confound location and dispersion effects. Methods Ecol. Evol. 3, 89–101. doi: 10.1111/j.2041-210X.2011.00127.x
Whitfield, P. E., Muoz, R. C., Buckel, C. A., Degan, B. P., Freshwater, D. W., and Hare, J. A. (2014). Native fish community structure and Indo-Pacific lionfish Pterois volitans densities along a depth-temperature gradient in Onslow Bay, North Carolina, USA. Mar. Ecol. Prog. Ser. 509, 241–254. doi: 10.3354/meps10882
Wilson, S. K., Fisher, R., Pratchett, M. S., Graham, N. A., Dulvy, N. K., Turner, R. A., et al. (2010). Habitat degradation and fishing effects on the size structure of coral reef fish communities. Ecol. Appl. 20, 442–451. doi: 10.1890/08-2205.1
Keywords: anthropogenic impacts, community assemblage, habitat, marine ecosystems, recreational fishing, temperate reef
Citation: Geraldi NR, Kellison GT and Bacheler NM (2019) Climate Indices, Water Temperature, and Fishing Predict Broad Scale Variation in Fishes on Temperate Reefs. Front. Mar. Sci. 6:30. doi: 10.3389/fmars.2019.00030
Received: 02 July 2018; Accepted: 21 January 2019;
Published: 07 February 2019.
Edited by:
Lene Buhl-Mortensen, Norwegian Institute of Marine Research (IMR), NorwayReviewed by:
Michele Casini, Swedish University of Agricultural Sciences, SwedenCopyright © 2019 Geraldi, Kellison and Bacheler. This is an open-access article distributed under the terms of the Creative Commons Attribution License (CC BY). The use, distribution or reproduction in other forums is permitted, provided the original author(s) and the copyright owner(s) are credited and that the original publication in this journal is cited, in accordance with accepted academic practice. No use, distribution or reproduction is permitted which does not comply with these terms.
*Correspondence: Nathan Robert Geraldi, bmF0aGFuLnIuZ2VyYWxkaUBnbWFpbC5jb20=; bmF0aGFuLmdlcmFsZGlAa2F1c3QuZWR1LnNh
†Present address: Nathan Robert Geraldi, Red Sea Research Center, King Abdullah University of Science and Technology, Thuwal, Saudi Arabia
Disclaimer: All claims expressed in this article are solely those of the authors and do not necessarily represent those of their affiliated organizations, or those of the publisher, the editors and the reviewers. Any product that may be evaluated in this article or claim that may be made by its manufacturer is not guaranteed or endorsed by the publisher.
Research integrity at Frontiers
Learn more about the work of our research integrity team to safeguard the quality of each article we publish.