- 1Reef Biology Research Group, Department of Marine Science, Faculty of Science, Chulalongkorn University, Bangkok, Thailand
- 2Genome Technology Research Unit, National Center for Genetic Engineering and Biotechnology, Pathum Thani, Thailand
- 3Ph.D. Program in Bioinformatics and Computational Biology, Faculty of Science, Chulalongkorn University, Bangkok, Thailand
- 4Department of Microbiology, Faculty of Science, Chulalongkorn University, Bangkok, Thailand
Reefs at Ko Samae San (S), Khao Ma Cho (K), and Ko Tao Mo (T), in the Gulf of Thailand (GoT) represent a biodiversity hotspot, and bacteria play significant roles in maintaining the health of these coral reefs and their biogeochemical cycles. Therefore, this study analyzed bacterial communities (microbiota) from healthy corals and nearby seawater and sediment, using B-RISA and 16S rRNA gene sequencing. Sampling was done in one dry and one wet season to provide an initial assessment of variation with environmental conditions. The most prevalent coral species were Porites lutea, Platygyra sinensis, Acropora humilis, and Acropora millepora. The B-RISA and the sequencing results were correlated, which increased confidence the results. The microbiota varied among corals, seawater, and sediment and between the wet and dry seasons. Percentages of bacteria with known functions varied among sample types and seasons, and their relative abundances supported previously reported essential functions, such as prevention of disease (e.g., Pseudoalteromonas, Psychrobacter, and Cobetia were more abundant on corals in the dry season). Pearson's correlations and multiple factor regressions identified dissolved oxygen (DO), temperature, salinity, and density as significant influences on the microbiota. The equations estimated the relative abundance of a community comprising 147 bacterial genera, as well as the relative abundance of Pseudomonas, Clostridium, Verrucomicrobium, and Epulopiscium (R2 ≥ 0.721). These results represent the first descriptions of microbiota from corals, and surrounding seawater and sediments in the upper GoT.
Introduction
Recently, an advance in next generation sequencing has allowed metagenomics to identify the bacteria diversity (or microbiota) in a manner that yields improved characterization of assemblages because it eliminates any bias associated with culturing (Riesenfeld et al., 2004; Khitmoh et al., 2017). Microorganisms, particularly bacteria, are abundant and play major roles in the metabolic functioning of almost every biological system, including highly productive systems like coral reefs (Webster and Reusch, 2017; Kelly et al., 2018). Bacteria live independently or associated with corals, and have roles that include obtaining and recycling resources, such as carbon and nitrogen. Vibrionales, Pseudomonadales, Oceanospirillales, and Oscillatoriales are examples of bacterial orders reported to be coral holobionts because their symbiotic relationships support the persistence of the coral reefs (Rohwer et al., 2002; Reshef et al., 2006; Rosenberg et al., 2007). Corals provide habitat while bacteria photosynthesize, acquire, and decompose organic and inorganic nutrients, and produce antibiotics and antioxidants to boost immunity for corals and promote resistance against invasions by pathogens and environmental stress (e.g., global warming). Moreover, commensal bacteria compete with pathogens for space and nutrients (Lesser et al., 2004; Rosenberg and Loya, 2004; Rosenberg et al., 2007; Lema et al., 2012; Rädecker et al., 2015; Webster et al., 2016). Coral holobionts have been reported to be specific to sites and coral species (Rohwer et al., 2002; Koren and Rosenberg, 2006; Chen et al., 2011; Carlos et al., 2013). The presence of key bacterial symbionts also has been reported in the surrounding seawater and sediment (Austen et al., 2002; Rusch and Gaidos, 2013). This study utilized bacterial-ribosomal intergenic spacer analysis (B-RISA) and the 16S rRNA gene sequencing to characterize the symbiotic microbiota of healthy corals from sites in the upper Gulf of Thailand (GoT). The study sites are considered a global hotspot for marine animal biodiversity (Phongsuwan et al., 2013; Ramírez et al., 2017).
The coastline along the GoT is nearly 1,600 km long, spanning ~100 islands along the east and 150 islands along the west. Fringing reefs are found throughout this region, and the prevalent coral species are Acropora, Platygyra, and Porites (Phongsuwan et al., 2013; Latypov, 2015). Unfortunately, due to global warming, many coral populations in Thailand have suffered periodic coral bleaching (Baker et al., 2008; Chavanich et al., 2009; Hoeksema and Matthews, 2011; Phongsuwan and Chansang, 2012). This problem increases the importance of a database documenting the microbiota of corals that may help them cope with stresses. This study included characterization of microbiota for four dominant species, Porites lutea, Platygyra sinensis, Acropora humilis, and Acropora millepora, and it also compared their microbial communities with those in the surrounding seawater and sediment during one dry and one wet season.
B-RISA is an established method that uses electrophoresis to classify bacterial diversity based on characteristic intergenic DNA lengths between the 16S and 23S rRNA genes of bacterial species. Different species (or families) have different B-RISA lengths. B-RISA is simple and inexpensive, and it serves as cross-validation for estimates of species richness derived from 16S rRNA gene sequencing, but it does not identify individual taxa (Danovaro et al., 2006; Grillevet et al., 2009; Sikaroodi and Gillevet, 2012; Gobet et al., 2014; Jami et al., 2014; Dehingia et al., 2015).
In contrast, data on 16S rRNA gene sequences can be used to identify operational taxonomic units (OTUs), which supports estimates of alpha and beta diversity, correlations with environmental factors (such as temperature and salinity), regressions to predict relative abundances in different environmental conditions, and evaluation of microbial metabolic functions. Because the metabolic functions of bacterial taxa were available, the metabolic potential of the bacterial community can be estimated from its composition. Knowledge of the microbiota can be considered crucial to sustaining and rehabilitating coral reefs.
Materials and Methods
Sampling
Samples were collected at S, K, and T during one dry (April–May) and one wet (September–October) seas The authors also thanked P. Sodsai and W. Poomipak for sequencing advice. on in 2014 (Figure 1A). The coral reefs at S, K, and T appeared healthy in both seasons. In each season, 3–10 replicate samples of seawater, sediments, and the prevalent coral species (P. lutea, P. sinensis, A. humilis, and A. millepora) were collected. Corals that were 5 cm in diameter were collected, along with 5 L each of seawater directly above each colony within 1 m and 50 g each of sediment directly below each colony within 1 m. All samples were placed on ice immediately, and genetic analyses were performed upon samples arrival within 7–14 days. The environment at each site was characterized by measuring the temperature, pH, salinity, density, and concentration of dissolved oxygen (DO) in the seawater.
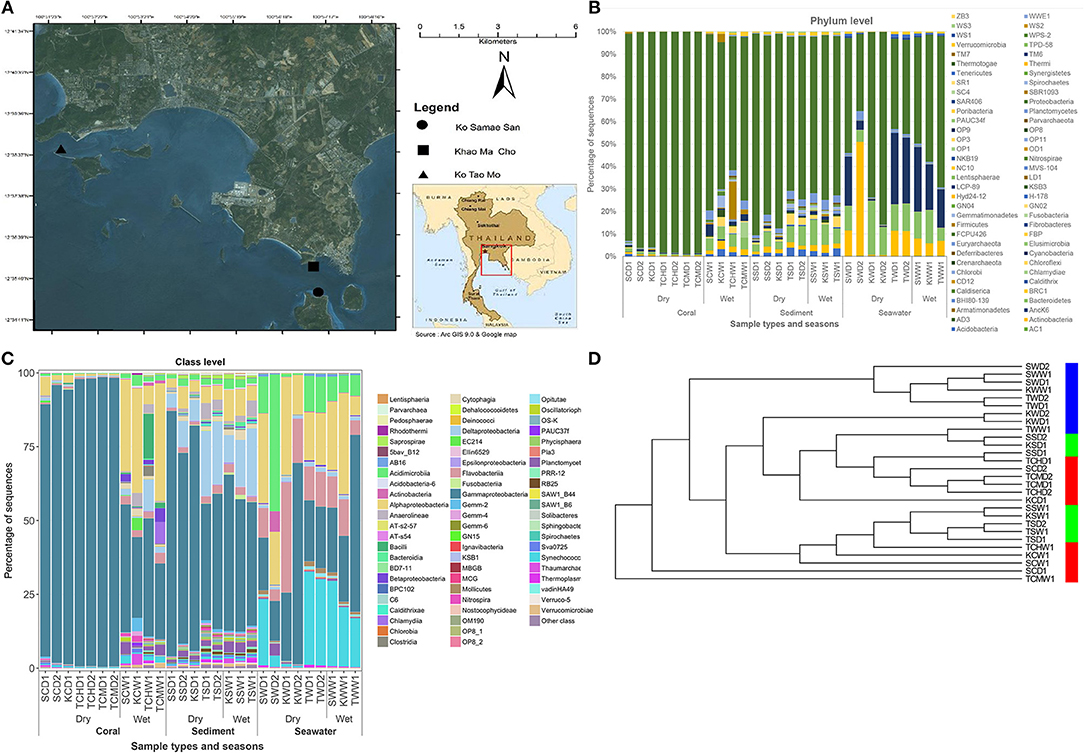
Figure 1. Oceanography map (A), along the prokaryotic community compositions at phylum (B) and class (C) levels, and the UPGMA cluster analysis (D), of corals, sediment, and seawater communities, at Ko Samae San, Khao Ma Cho, and Ko Tao Mo fringing reef sites. In panel (C), other class represents the OTU classes of <10%.
Metagenomic Extraction
Metagenomic DNA was isolated using Power Water DNA Isolation Kit (for seawater samples) and Power Soil DNA Isolation Kit (coral and sediment samples) (MoBio, Carlsbad, CA, USA), following the manufacturer's instructions. Microbiota in seawater were captured by filtering 2.5 L using a sterile 0.22-μ vacuum filtration system (Merck Millipore, Massachusetts, USA). For coral and sediment samples, 1 g of coral was homogenized by grinding and 1 g of sediment were used. Metagenomic template in each replicate was extracted and checked for the quality and quantity of DNA by agarose gel electrophoresis and nanodrop spectrophotometry, respectively.
B-RISA to Identify Subgroups in Independent Sampling Replicates
B-RISA was performed according to established protocols, using universal primers 16S-1392F (5′-GYACACACCGCCCGT−3′) and 23S-125R (5′-GGGTTBCCCCATTCRG−3′) (Hewson and Fuhrman, 2004; Danovaro et al., 2006; Gobet et al., 2014; Jami et al., 2014). To prevent PCR bias, two independently PCR reactions were performed and pooled for each sample. Each 12.5 μl PCR comprised 1 × EmeraldAmp? GT PCR Master Mix (TaKaRa, Shiga, Japan), 0.3 μM forward primer, 0.3 μM reverse primer, and 50 ng of template. The thermocycling conditions were 95°C for 4 min, followed by 30–35 cycles of 94°C for 1 min, 55°C for 1 min, and 72°C for 2 min, and ended with 72°C for 10 min. Subgroups were identified by banding patterns following agarose gel electrophoresis. Each band was quantified as a percentage of the sum of all bands using ImageJ.
16S rRNA Gene Library Preparation and Next Generation Sequencing
Libraries of 16S rRNA genes were constructed following Caporaso et al. (2012), using universal prokaryotic primers 515F (5′-GTGCCAGCMGCCGCGGTAA−3′) and 806R (5′-GGACTACHVGGGTWTCTAAT−3′), appended with 5′ Illumina adapter and 3′ Golay barcode sequences. Each 25-μl PCR reaction comprised 1 × EmeraldAmp® GT PCR Master Mix (TaKaRa), 0.2 μM of each primer, and 75 ng of the metagenomic DNA. The thermocycling conditions were 94°C for 3 min, and 28–30 cycles of 94°C for 45 s, 50°C for 60 s, and 72°C for 90 s, followed by 72°C for 10 min. Triplicate PCRs were performed and pooled for each sample to prevent stochastic bias. The amplicons were agarose gel purified using GenepHlowTM Gel Extraction Kit (Geneaid Biotech Ltd., New Taipei City, Taiwan), quantified with Picogreen (Invitrogen, Eugene, Oregon, USA), and 240 ng of each sample (or subgroup) was pooled for sequencing by Miseq300 platform (Illumina, San Diego, CA, USA), along with the sequencing primers and index sequence (Caporaso et al., 2012). Sequencing was performed at Chulalongkorn Medical Research Center, Chulalongkorn University (Bangkok, Thailand).
Quality Screening, Taxon Classifications, and Community Comparison
Raw sequences were processed according to Mothur's standard operating procedures for MiSeq (Schloss et al., 2009). Quality screening included removal of sequences that have (i) ambiguous bases, (ii) >1 mismatch base in the primer region, (iii) ≥1 mismatch base in the barcode, (iv) >10 homopolymers, (v) a minimum sequencing quality score of <35 over a 50-bp window, (vi) a read length of <350 bases, and (vii) chimera sequences (Huse et al., 2010; Edgar et al., 2011). Sequences were aligned against Greengenes (McDonald et al., 2012) to remove contaminated sequences, such as mitochondria and chloroplast sequences that also contain 16S rRNA gene. Operational taxonomic units (OTUs) were assigned based on a naïve Bayesian method (Wang et al., 2007), with a score threshold of 80% (default parameter). Samples were normalized to an equal sampling depth corresponding to the sample size of the fewest number of sequences (42,655). Good's coverage to estimate a coverage index, rarefaction curve, alpha diversity (Chao1 richness, Shannon diversity, and inverse Simpson index), beta diversity [thetayc dissimilarity coefficient and principal coordinates analysis (PCoA)], and unweighted pair group with arithmetic mean (UPGMA) clustering were conducted using Mothur (Schloss et al., 2009). A complete linkage clustering analysis was computed using R. Similarity profile analysis (SIMPROF) using Bray Curtis dissimilarity indices was also performed as an additional test of the significance of groupings (p < 0.05) (p < 0.05). For sample where two independent sequencings were performed based on B-RISA subgrouping, a student's t-test was computed to if the composition of the subgroups differed significantly (p < 0.01), and the subgroups were merged if p > 0.01.
Multiple Factor Regression
The relative abundances of all microbiota were correlated with measures of environmental conditions by calculating Pearson's correlation coefficients in Mothur (Schloss et al., 2009), and the results were visualized with XLSTAT-Ecology software (www.xlstat.com/en/solutions/ecology). Regression equations were derived as described elsewhere (Pal and Bhattacharya, 2013; Teng et al., 2015; French and Finch, 2016; Jia et al., 2016). Assuming the bacterial community is a dependent variable changing upon the independent environmental variables, the relative abundance of bacteria can be predicted by the environmental variables. Significant environmental factors were extracted from the correlation matrix and combined using a principal component analysis (PCA) and the Varimax Factor Rotation, which yielded the eigenvalues and scores. Relevant eigenvalues and scores were selected using default thresholds (Pal and Bhattacharya, 2013; French and Finch, 2016; Jia et al., 2016). The significant factors and their scores were combined in regression equation to estimate the dependent variable Y (represent the bacterial abundance) from the independent variables X1 to Xi (each of water physical variables) and ß0 to ßi as coefficient constants, as follow.
For each equation, an Ordinary Least Square analysis yielded an R-squared (R2) value, which represents its goodness of fit (a percent that Y can be explained by the Xi equation). R2 of >0.7, or the closer to 1, is considered acceptable, meaning that ≥70% that Y can be explained by the Xi equation. Similarly, the relative abundances of common bacterial genera were correlated with environmental parameters, and the results were used to generate regression equations.
Potential Metabolic Functions
The potential metabolic function of the community was predicted following the established protocols (Langille et al., 2013). The functional profiles of the communities were predicted from 16S rDNA sequences using PICRUSt (Langille et al., 2013). The metabolic functions were categorized by KEGG (Kyoto Encyclopedia of genes and genomes) pathways, given level 1 representing pathways and level 2 representing categories of genes (COGs).
Availability of Supporting Data
Nucleic acid sequences in this study were deposited in an NCBI open access Sequence Read Archive database, accession number SRP095762.
Results
Sampling Sites, Environmental Conditions, and Metagenomic DNA
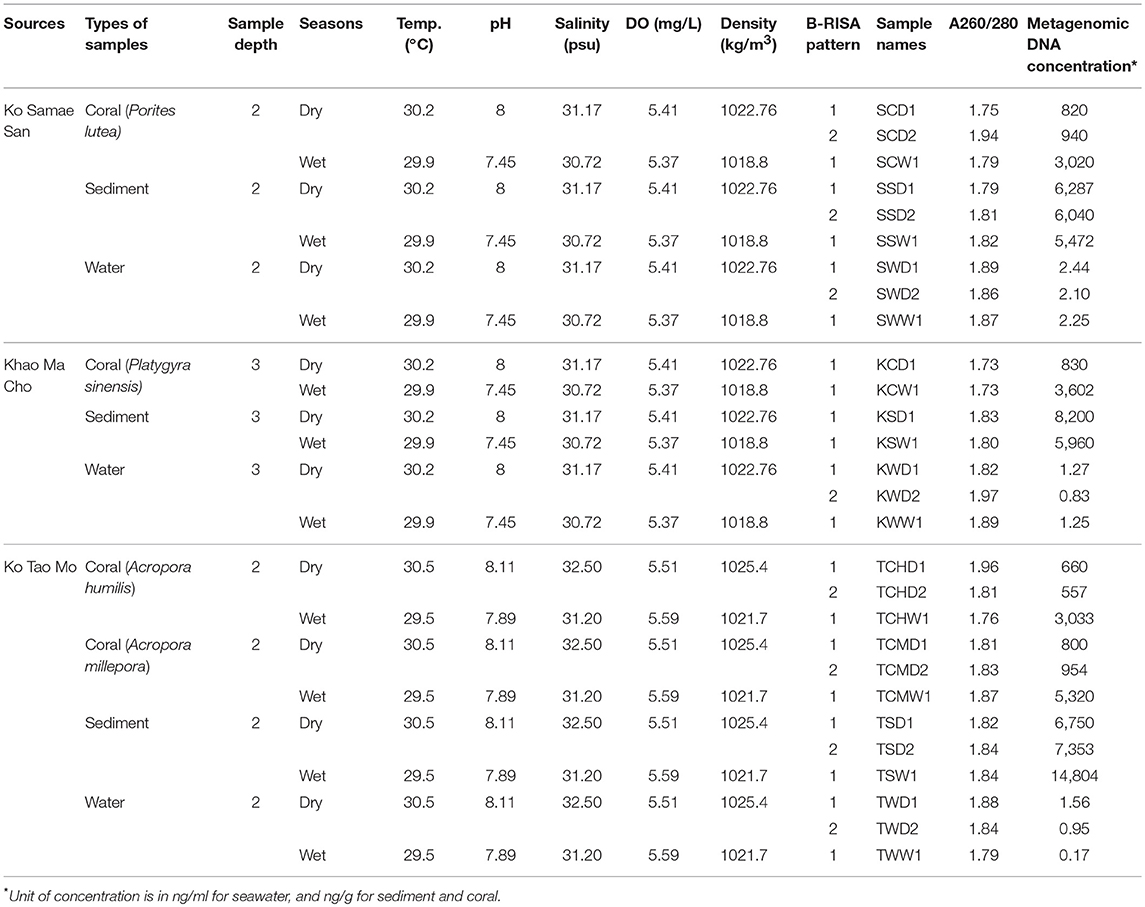
Differences in environmental conditions among sites (temperature, pH, salinity, DO, and density) were small. Larger differences were recorded between the two seasons for pH, salinity and density (Table 1).
The average concentration of microbial metagenomic DNA was higher in the sediments, followed by corals. For corals, the wet season yielded about three times more metagenomic DNA than the dry season (Table 1). From Table 1 and so on, sample names are abbreviated by: the first letter represents site (S, K, T); the middle is sample types (Coral, Sediment, seaWater), and for site with two coral species the next letter denotes the species of the corals; and last letter is wet (W) or dry (D) seasons; followed by a number 1 only, or 1 and 2, depending on the number of B-RISA subgroups.
B-RISA to Identify Subgroups in Independent Sampling Replicates
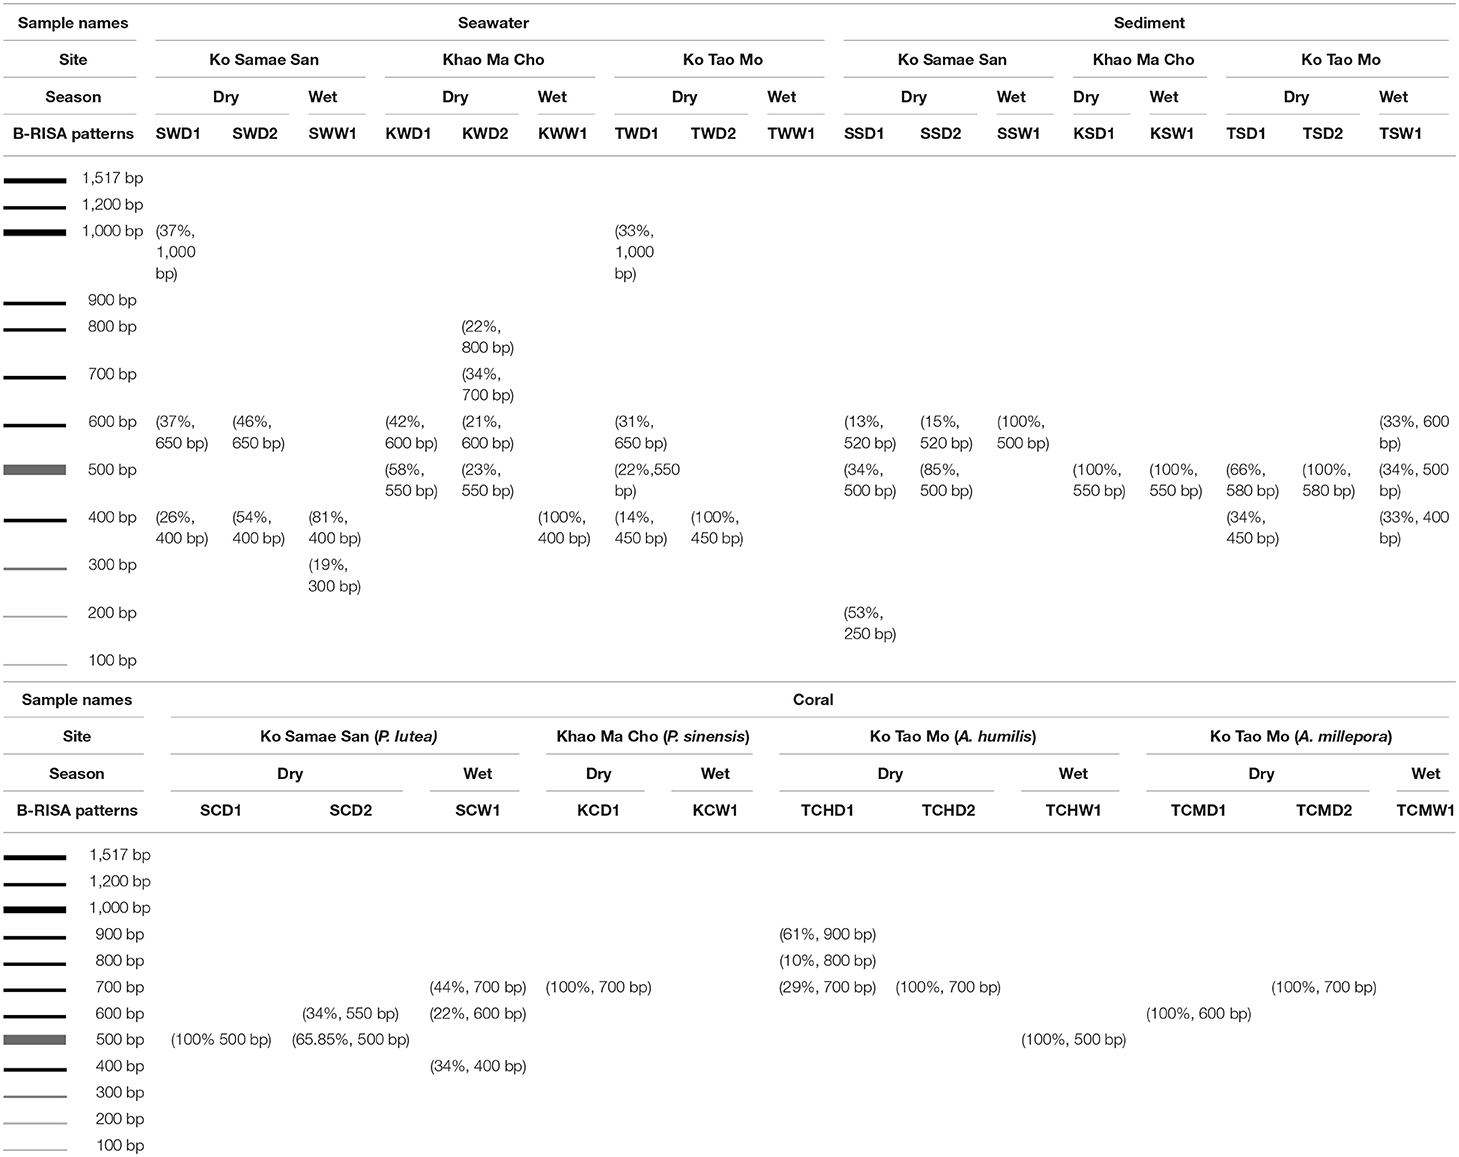
Replicate samples of coral, sediment, and seawater fell into 1–2 B-RISA subgroups per sample (e.g., SCD1 and SCD2 for 2 B-RISA subgroups, and SCW1 for 1 B-RISA subgroup). The B-RISA patterns shared among the same sample types were similar (Table 2).
16S rRNA Gene Sequences
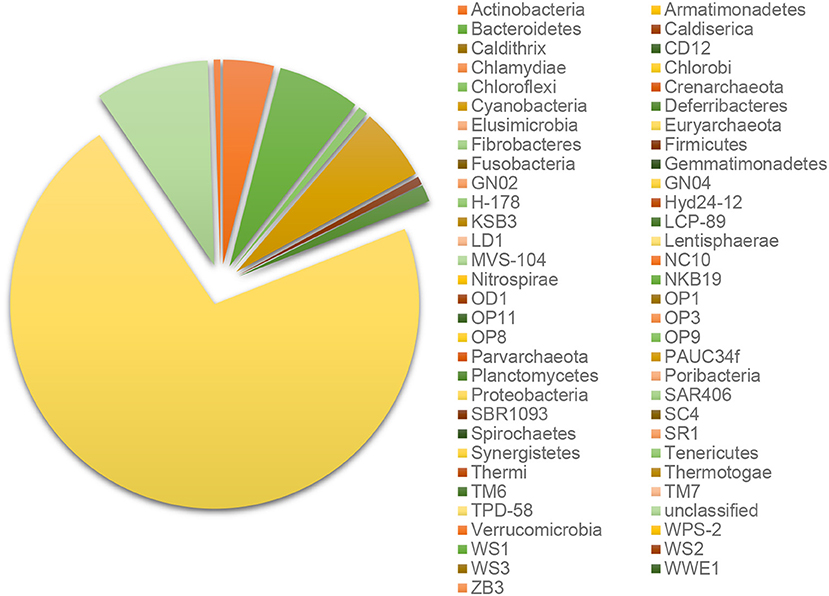
Every B-RISA subgroup was successfully 16S rRNA gene library constructed and sequenced, according to the number of quality reads (avg. 199,107 reads per subgroup), which yielded statistically sufficient coverage of averagely 99.99 and 99.90% of the community diversity at the phylum and genus levels, respectively (Table S1: Good's coverage indices). Further evidence of a sufficient sequencing depth was provided by the OTU richness curves, which reached plateau (Figure S1). Comparing across sample types, sediments and seawater had higher species diversity than corals (Table S1: Shannon diversity indices), and bacteria were found to be dominant in all samples (>98% of all OTUs), whereas archaea were absent or rare (Figure S2). Bacteria in phylum Proteobacteria were the most numerous, followed by Cyanobacteria, Bacteroidetes, Actinobacteria, and Firmicutes (Figure 2).
As Figures 1B,C illustrated the similarity between microbiotic communities in the replicate subgroups, student's t-tests were computed based on the abundances of OTUs at the genus level between pairs of B-RISA subgroups, when available. A cutoff of p ≤ 0.01 was used because p ≤ 0.001 might be too stringent. Most pairs were found to be similar (p > 0.1), except TSD1 and TSD2 yielded a value near the cutoff (p = 0.019). In addition, SWD1 and SWD2 subgroups that correspond to water from Ko Samae San in the dry season replicates were found to contain dissimilar communities (p = 0.005) (Table 3).
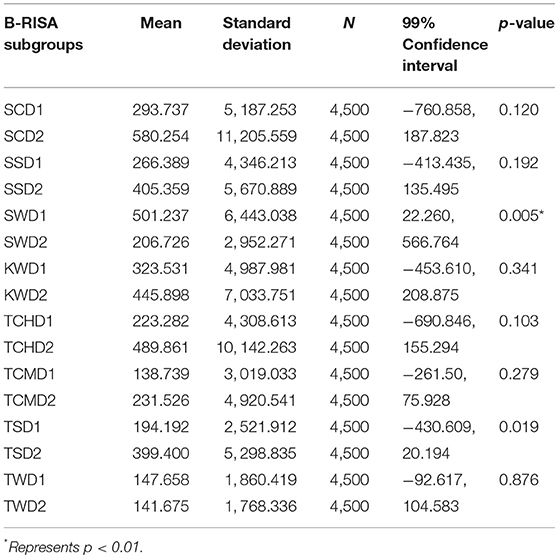
Table 3. Determination of significant differences between B-RISA subgroups by student's t-test for prokaryotic communities.
Community Similarity by Sample Type
Figures 1B,C illustrated that the microbiota in seawater were different from those in other types of samples across sites and seasons, and that the microbiota of corals differed between seasons but not sites. These findings remained valid when the B-RISA subgroups were merged (Figure 3). To further prove that the communities clustered by sample types, the results of UPGMA clustering grouped the seawater communities, separate from the coral communities that seemed to be subdivided between the dry and wet seasons (Figure 1D), with similar results confirmed by complete linkage clustering (p < 0.001). The complete linkage clustering demonstrated three major clusters belonging mainly to the seawater communities (Figure S3: right branch), the dry-season coral communities (middle branch), and the wet-season coral communities (left branch). The p statistic when clustering by sample type was statistically robust (p < 0.001), whereas clustering by seasons was less consistent (p = 0.076) and clustering by sites was not significant (p = 0.352). The smaller the p-value corresponds to the cluster separation with significance. As additional confirmation, SIMPROF documented the same clusters (Figure S4). Next, how each community is related in two-dimension plot was illustrated by PCoA, given several samples of the same type were overlapped in the position (Figure 4A). The PCoA showed similar results regardless of whether the subgroups were separated (Figure 4A) or merged (Figure 4B).
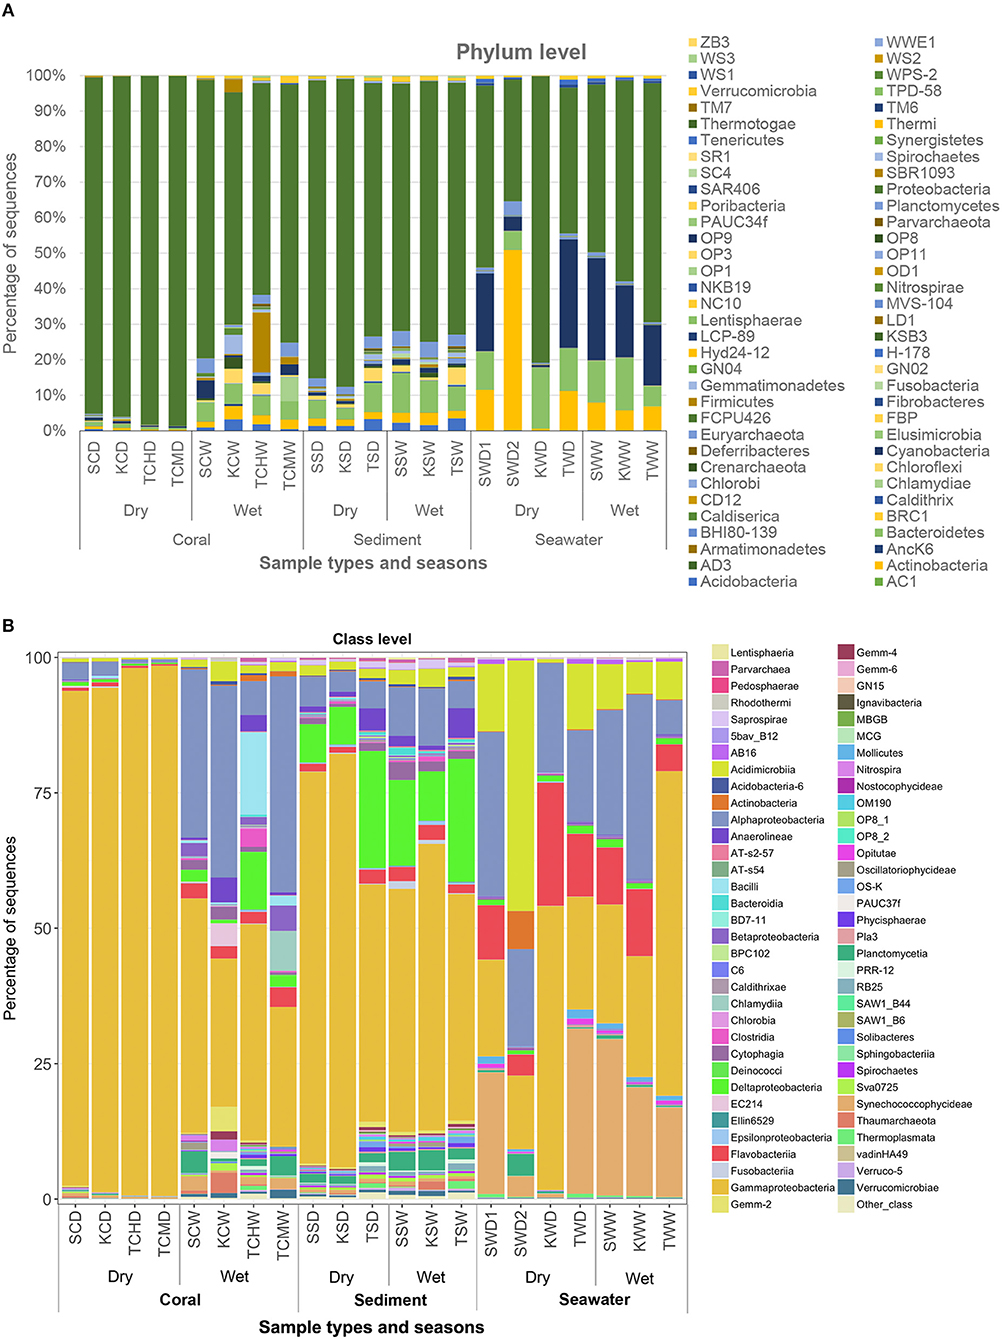
Figure 3. Prokaryote community compositions at levels of phylum (A) and class (B), of merged B-RISA subgroups with p > 0.01. Other class represents the OTU classes of <10%.
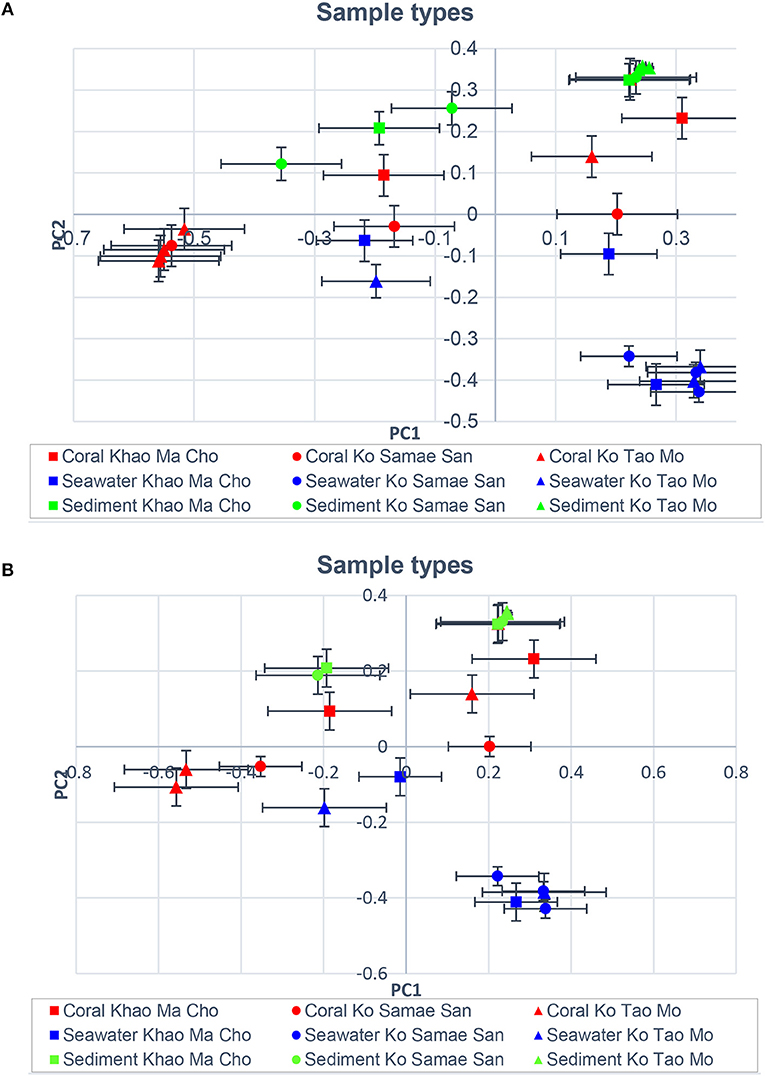
Figure 4. Principal coordinates analysis showing community relatedness for the same sample types, displaying (A) all B-RISA subgroups, and (B) merged subgroups with p > 0.01.
Correlation With Environmental Variables
Pearson's correlation coefficients indicated that communities varied with differences in temperature, DO, density, salinity, and pH (p < 0.01; Figure 5). The communities were not significantly correlated with the total numbers of OTU or depth of the water, which highlighted the reliability of the analysis because numbers of OTUs should not affect the assemblage composition when sequencing depths were sufficient. Furthermore, all samples were collected in 2–3 m of water, so this study did not have sufficient scope to evaluate the influence of depth.
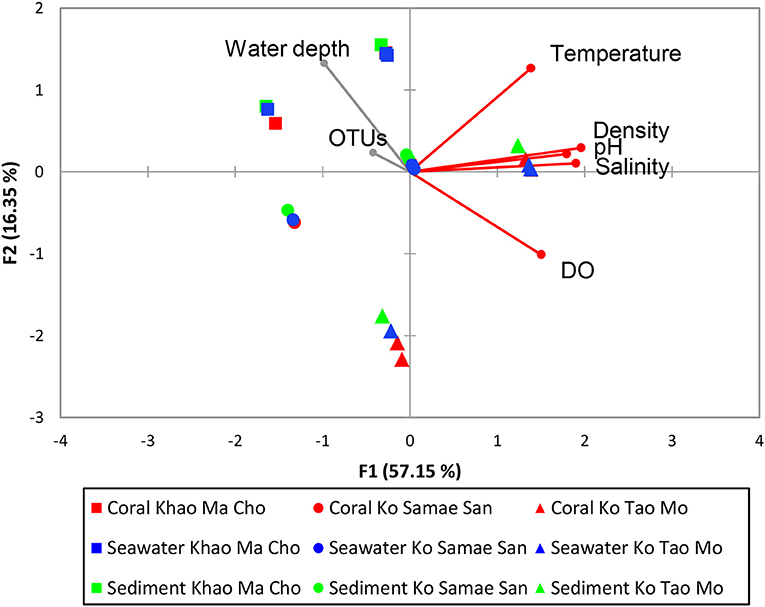
Figure 5. Pearson's correlation of water physical variables on prokaryotic community structures. The vector direction and length represents the direction and strength of that variable factor. The vector color red represents significant correlation (p < 0.01), and gray represents non-significant correlation (p ≥ 0.01). Pearson's correlation of water physical properties on the merged subgroups with p > 0.01 are identical in results and thus not shown.
Multiple Regression Analysis for Predictive Community and Individual Bacterial Genus Abundances from Environmental Variables
The following equation that predicts the total relative abundance of 147 OTUs (Y147; Table S2) yielded an R2 of 0.999.
by X1 is sample depth (unit m),
X2 is seawater temperature (unit °C),
X3 is salinity (unit psu),
X4 is DO (unit mgL−1),
X5 is density (unit kgm−3).
All 146 of 147 OTUs in the Y147 were found for the TCHW1 community, and thus the 146 bacterial OTUs of this community could be reliably predicted.
The following equations (Table S2) also yielded R2 ≥ 0.7, and they predicted the relative abundance of Pseudomonas (YPseu.), Clostridium (YClos.), Verrucomicrobium (YVerr.), and Epulopiscium (YEpul.).
by X1 is sample depth (unit m),
X2 is seawater temperature (unit °C),
X3 is salinity (unit psu),
X4 is DO (unit mgL−1),
X5 is density (unit kgm−3).
Distributions Across Sample Types
Figure 6 illustrated the frequencies of bacterial orders previously reported as important for corals: Vibrionales, Pseudomonadales, Oceanospirillales, Flavobacteriales, Acidimicrobiales, Synechococcales, Desulfobacterales, and Oscillatoriales. These groups dominated in samples of corals and sediments. Vibrionales (mostly members of genus Pseudoalteromonas accounted 96.3% of Vibronales), Pseudomonadales (Psychrobacter 91.26%), and Oceanospirillales (Cobetia 75.86% and Endozoicomonas 0.01%) were abundant on corals (55–75%) and in the sediments (12–19%) during the dry season. In contrast, in the wet season, sediments contained 86% Oscillatoriales (cyanobacteria in the genus Lyngbya) and 79% Desulfobacterales (sulfate-reducing bacteria), which contrasted with their 49 and 36% contributions to abundances in the dry season (Figure 6).
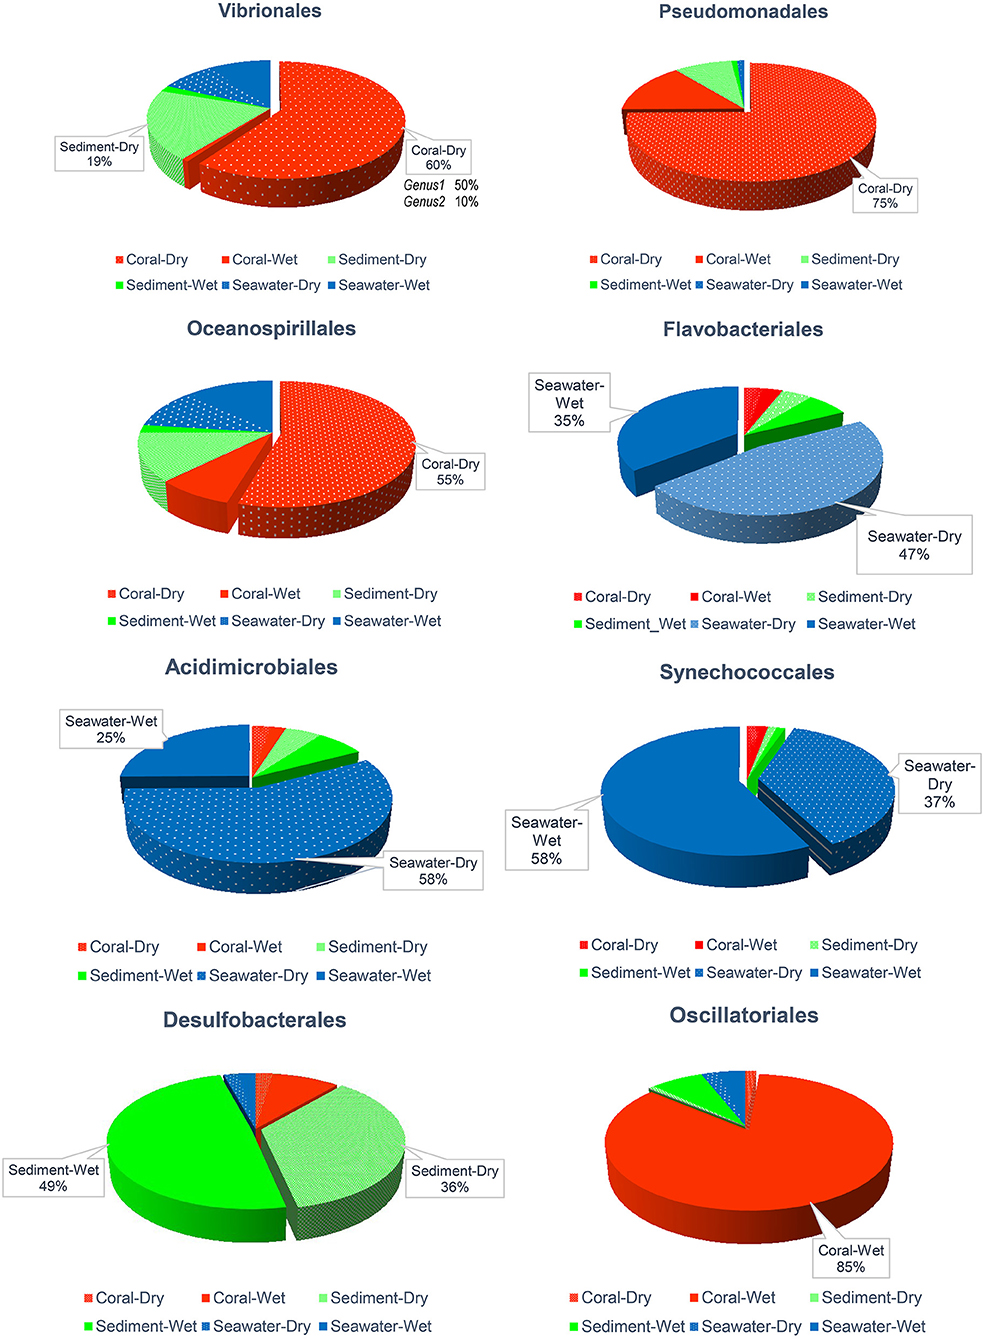
Figure 6. Comparative abundance of Vibrionales, Pseudomonadales, Oceanospirillales, Flavobacteriales, Acidimicrobiales, Synechococcales, Desulfobacterales, and Oscillatoriales orders across sample types and seasons. Samples with ≤18% were omitted written percentages.
In seawater, Flavobacteriales, Acidimicrobiales, and Synechococcales were prevalent. The prior two genera were more abundant in the dry season (47–58%) than during the wet season (25–35%), while Synechococcales showed the opposite trend (dry season 37% vs. wet season 58%; Figure 6).
Diversity of Metabolic Function Potentials
The metabolic potentials predicted from the community compositions indicated the KEGG pathway of “metabolism” (avg. 49.42%) was the most abundant, followed by “genetic information processing” (16.3%), “unclassified” (14.47%), and “environmental information processing” (13.75%; Figure 7A). The functional classification from the KEGG pathways into the COGs (Figure 7B) indicated a prevalence of “membrane transport” (i.e., transports large molecules such as polysaccharides, proteins, and siderophores; 11.43%), “amino acid metabolism” (10.47%), and “carbohydrate metabolism” (i.e., sugar alcohols and central carbohydrates; 9.8%) (Figure 7B). These functions are related to important processes in coral reefs, including metabolism of carbohydrates, amino acids, and lipids (Tout et al., 2014). Functions such as DNA replication and repair, transcription, translation, energy metabolism, or the incorporation of key cofactors and vitamins are also important for coping with abiotic pressures, such as parasites, heavy metal contamination, ultraviolet radiation, exposure to reactive oxygen, etc. (Tout et al., 2014; Ainsworth et al., 2015; Badhai et al., 2016). COGs involved in cellular processes and signaling (i.e., chemotaxis, two-component system response), membrane transport, signal transduction, and cell motility (Figure 7B), might facilitate cellular interactions and metabolic exchanges between the bacterial community and the coral host (Tout et al., 2014; Ainsworth et al., 2015).
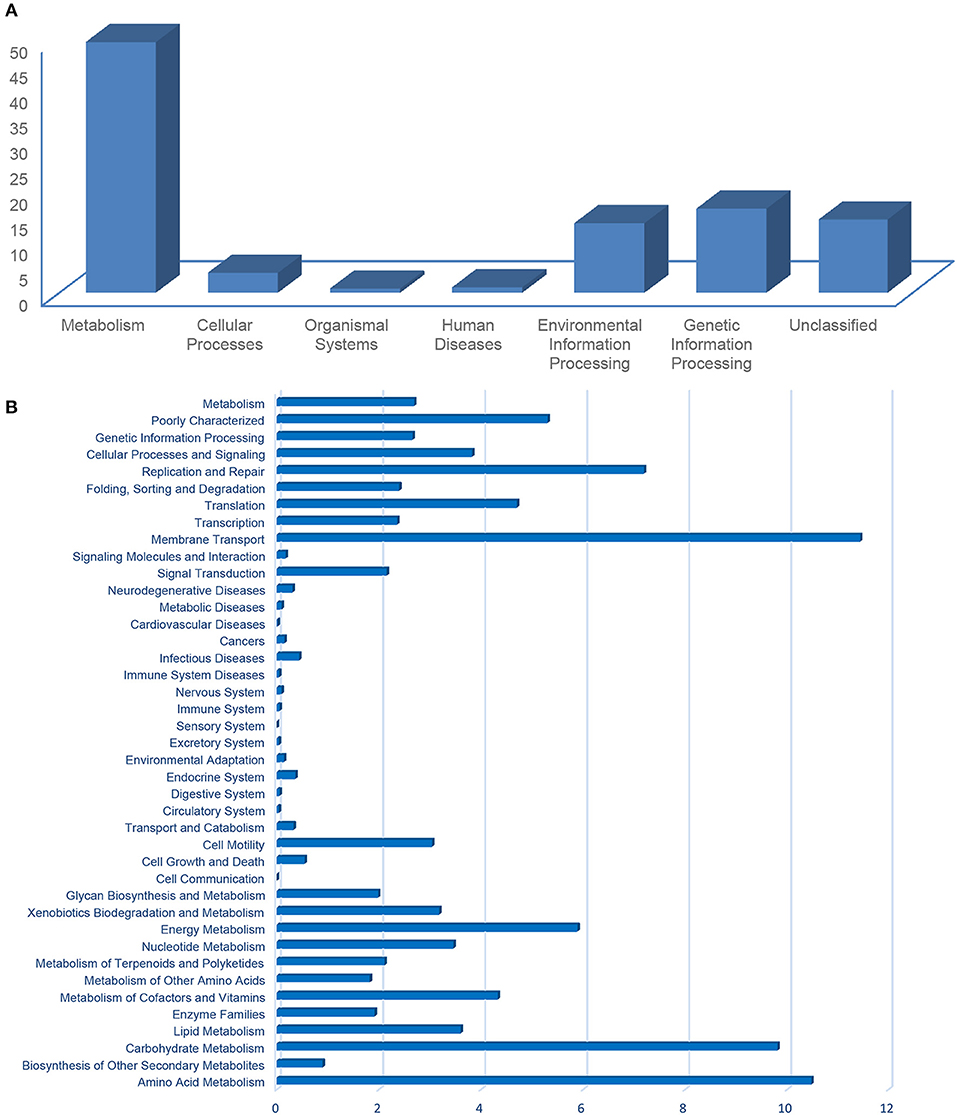
Figure 7. Prokaryote functional prediction into KEGG pathways (A) and categories of genes (B), using PICRUSt.
Discussion
Coral reefs, also known as the tropical rainforest of the sea, are a crucial source of the Earth's food supplies (bioproductivity) and biodiversity. Coral microbiota plays a critical role in the preservation of healthy corals and coral reefs. While reefs in the GoT are hotspots of diversity (Ramírez et al., 2017), knowledge, and data for their microbiota are lacking. This study represented the first culture-independent microbiota databases of the upper GoT coral sites, that characterized differences in assemblages from corals, seawater and sediment in one wet and one dry season.
Comparisons of microbial metagenomes among coral, seawater, and sediment identified seawater as having the lowest concentration of metagenomic material, which is consistent with the dilute and pristine nature of the seawater. For corals, higher metagenomic concentrations were documented during the wet season, suggesting higher microbial abundance and activity during this season. Overall, bacteria dominated the prokaryotic communities, with <1% archaea. This result supports previous reports of 0–1% of archaea in healthy coral systems (Wegley et al., 2007; Biers et al., 2009; Gilbert et al., 2012; Somboonna et al., 2014). Archaea were reported in polluted environments, such as those contaminated by heavy metals and oil (Biers et al., 2009; Somboonna et al., 2012). Analyzing the community diversity among the different samples, seasons, and sites showed that the communities in seawater clustered together, the communities in sediments showed some similarity with the coral communities, and the communities on corals separated according to season. This ecotype-specific microbiota underlie the coral-associated community. The similar communities among the three sites, which share similar environmental condition and healthy corals, indicates the generality of these bacterial associations.
Vibrionales, members of genus Vibrio spp., can be pathogenic and cause disease in dry seasons; however, the dominant members at our study sites, particularly on the coral A. humilis, were Pseudoalteromonas spp. Pseudoalteromonas spp. are not pathogenic, and they were reported to have antibacterial activity on A. millepora and Fungia granulose (Kooperman et al., 2007; Littman et al., 2009). This finding suggests an increasing antibacterial activity during the dry season, when outbreaks of bacterial disease occur most often. Similarly, the predominant orders Pseudomonadales (genus Psychrobacter) and Oceanospiralles (Cobetia and Endozoicomonas) likely benefit the corals. Psychrobacter supports the metabolism of complex carbohydrates, amino acids, and lipids, and were reported in abundance in the mucus of Acropora and Porites (McKew et al., 2012; Badhai et al., 2016). For members of Oceanospiralles, interactions with corals remain unclear, although they have been reported as relatively abundant in tropical reefs. Some studies suggested their function might involve sulfur and nitrogen cycling, as well as produce hydrolytic enzymes to assist the corals in acquiring nutrients (Goffredi et al., 2005; Robertson et al., 2016). On the other hand, some studies have suggested their associations with coral diseases such as white plaque disease (Cárdenas et al., 2012). In the wet season, the microbiota of corals was dominated by Lyngbya and Trichodesmium of Oscillatoriales. Lyngbya is a benthic cyanobacteria that plays an important role as a producer of nutrients and bioactive compounds (Paul et al., 2005; Cruz-Rivera and Paul, 2006, 2007; Sharp et al., 2009). Trichodesmium is fundamental for nitrogen fixation and was reported to play a significant role in the food chain of the Belizean barrier reef and elsewhere (Villareal, 1995), including the GoT (Cheevaporn and Menasveta, 2003). Finding Desulfobacteraceae in the sediment was expected, as these bacteria are known to recycle organic sulfates (Gobet et al., 2012). For seawater, Flavobacteriales (phylum Bacteroidetes) and Acidimicrobiles (phylum Actinobacteria) that were reported as common at our sites had also been reported elsewhere (Lauro et al., 2009; Mizuno et al., 2015). These bacteria can scavenge organic debris for carbon and energy sources, supporting their growth and survival under nutrient limiting conditions in seawater. These species are believed to support cycling of the food network (Kelly et al., 2014). In total, the species denoted as coral microbiota from sites in the upper GoT include many potentially beneficial bacteria that have been reported as essential previously.
Pearson's correlations determined that temperature, DO, density, salinity, and pH impact the structure of bacterial communities. Multiple regressions with the acceptable R2-values allowed the prediction of the combined relative abundance of 147 OTUs, and also the relative abundances of Pseudomonas, Clostridium, Verrucomicrobium, and Epulopiscium, from the environmental conditions. The ability to predict the spatial and temporal variability of microbial communities of coral reefs and their associations with key ecological processes can provide substantial benefits, in particular predicting responses to global warming and anthropogenic pollution. Indeed, our equations were validated by replacing the environmental parameters (Xi) from the TCHW1 data in Table 1, and the microbial abundance between the predicted equation vs. the sequencing result were compared: Y147 yielded 4.95% (the sequencing yielded 5.10%), YPseu. yielded 2.53% (the sequencing yielded 2.36%), and YClos. yielded 1.14% (the sequencing yielded 0.70%), for examples. Although the difference between the sequencing and the prediction was small, the predictive equations are limited to certain species and sites. More intense sampling at more sites with more diverse environments, may allow a more complete characterization of reef microbiota.
In conclusion, these findings represent the first culture-independent characterization of microbiota on corals, in seawater and in sediments in the upper GoT. The database serves as a reference for other sites with similar characteristics. Bioinformatics has contributed to the understanding of the spatial and seasonal variability of reef microbiota, and its association with coral species, and different environmental characteristics. The multiple factor regression analysis provided is an example of the benefits of the microbiota databases. Additional studies of microbiota that sample multiple times in different seasons and at more sites with corals in various states of health are ongoing, and the results should help us decipher the core microbiota that are indispensable for maintaining the health of corals.
Author Contributions
DB conducted molecular biology experiments and performed data analysis. AW and PK helped in analysing the data. VV conceived the study. SC provided samples and conceived the study. NS conceived the study, coordinated the experiments, analysed the data, and wrote the manuscript. All authors read and approved the final manuscript.
Funding
This research was supported by the 90th Anniversary of Chulalongkorn University Fund, and Chulalongkorn Academic Advancement into Its second Century Project, Thailand Research Fund (RSA 6080087), and EU-Horizon 2020 Project TASCMAR (634674).
Conflict of Interest Statement
The authors declare that the research was conducted in the absence of any commercial or financial relationships that could be construed as a potential conflict of interest.
Acknowledgments
The authors acknowledged the Plant Genetic Conservation Project under the Royal Initiative of Her Royal Highness Princess Maha Chakri Sirindhorn, and the Naval Special Warfare Command, Royal Thai Navy for their assistance in the field; and the National Center for Genetic Engineering and Biotechnology (BIOTEC), and the National Science and Technology Development Agency (NSTDA) for allowing us to compute the data on the server. We also thank P. Sodsai and W. Poomipak for sequencing advice.
Supplementary Material
The Supplementary Material for this article can be found online at: https://www.frontiersin.org/articles/10.3389/fmars.2018.00441/full#supplementary-material
Figure S1. Estimated taxonomic richness (rarefaction curve) at levels of phylum (A), class (B), order (C), family (D), and genus (E) of prokaryotic communities.
Figure S2. Percent relative abundance of prokaryotes categorized into bacteria and archaea.
Figure S3. Complete linkage cluster analysis of corals, sediment and seawater communities, at Ko Samae San, Khao Ma Cho, and Ko Tao Mo fringing reef sites.
Figure S4. A test of significance for profiles clustering by SIMPROF. (A) All B-RISA subgroups and (B) merged subgroups with p > 0.01. Significant clustering (p < 0.05) is indicated with shared color branches.
Table S1. Estimates of sample coverage and alpha diversity indices at phylum and genus levels of 16S rDNA profiles.
Table S2. List of 147 genus level OTUs predicted by Y147 = 338.907 + 0.018 X1 + 10.572 X2 − 5.781 X3 + 66.6 X4 − 0.82 X5.
References
Ainsworth, T. D., Krause, L., Bridge, T., Torda, G., Raina, J.-B., Zakrzewski, M., et al. (2015). The coral core microbiome identifies rare bacterial taxa as ubiquitous endosymbionts. ISME J. 9, 2261–2274. doi: 10.1038/ismej.2015.39
Austen, M. C., Lambshead, P. J. D., Hutchings, P. A., Boucher, G., Snelgrove, P. V. R., Heip, C., et al. (2002). Biodiversity links above and below the marine sediment-water interface that may influence community stability. Biodivers. Conserv. 11, 113–136. doi: 10.1023/A:1014098917535
Badhai, J., Ghosh, T. S., and Das, S. K. (2016). Composition and functional characterization of microbiome associated with mucus of the coral Fungia echinata collected from Andaman Sea. Front. Microbiol. 7:936. doi: 10.3389/fmicb.2016.00936
Baker, A. C., Glynn, P. W., and Riegl, B. (2008). Climate change and coral reef bleaching: an ecological assessment of long-term impacts, recovery trends and future outlook. Estuar. Coast. Shelf Sci. 80, 435–471. doi: 10.1016/j.ecss.2008.09.003
Biers, E. J., Sun, S., and Howard, E. C. (2009). Prokaryotic genomes and diversity in surface ocean waters: interrogating the global ocean sampling metagenome. Appl. Environ. Microbiol. 75, 2221–2229. doi: 10.1128/AEM.02118-08
Caporaso, J. G., Lauber, C. L., Walters, W. A., Berg-Lyons, D., Huntley, J., Fierer, N., et al. (2012). Ultra-high-throughput microbial community analysis on the Illumina HiSeq and MiSeq platforms. ISME J. 6, 1621–1624. doi: 10.1038/ismej.2012.8
Cárdenas, A., Rodriguez, R. L. M., Pizarro, V., Cadavid, L. F., and Arévalo-Ferro, C. (2012). Shifts in bacterial communities of two caribbean reef-building coral species affected by white plaque disease. ISME J. 6, 502–512. doi: 10.1038/ismej.2011.123
Carlos, C., Torres, T. T., and Ottoboni, L. M. (2013). Bacterial communities and species-specific associations with the mucus of Brazilian coral species. Sci. Rep. 3:1624. doi: 10.1038/srep01624
Chavanich, S., Viyakarn, V., Loyjiw, T., Pattaratamrong, P., and Chankong, A. (2009). Mass bleaching of soft coral, Sarcophyton spp. in Thailand and the role of temperature and salinity stress. ICES J. Mar. Sci. 66, 1515–1519. doi: 10.1093/icesjms/fsp048
Cheevaporn, V., and Menasveta, P. (2003). Water pollution and habitat degradation in the Gulf of Thailand. Mar. Pollut. Bull. 47, 43–51. doi: 10.1016/S0025-326X(03)00101-2
Chen, C. P., Tseng, C. H., Chen, C. A., and Tang, S. L. (2011). The dynamics of microbial partnerships in the coral Isopora palifera. ISME J. 5, 728–740. doi: 10.1038/ismej.2010.151
Cruz-Rivera, E., and Paul, V. J. (2006). Feeding by coral reef mesograzers: algae or cyanobacteria? Coral Reefs 25, 617–627. doi: 10.1007/s00338-006-0134-5
Cruz-Rivera, E., and Paul, V. J. (2007). Chemical deterrence of a cyanobacterial metabolite against generalized and specialized grazers. J. Chem. Ecol. 33, 213–217. doi: 10.1007/s10886-006-9212-y
Danovaro, R., Luna, G. M., Dell'anno, A., and Pietrangeli, B. (2006). Comparison of two fingerprinting techniques, terminal restriction fragment length polymorphism and automated ribosomal intergenic spacer analysis, for determination of bacterial diversity in aquatic environments. Appl. Environ. Microbiol. 72, 5982–5989. doi: 10.1128/AEM.01361-06
Dehingia, M., Thangjam devi, K., Talukdar, N. C., Talukdar, R., Reddy, N., Mande, S. S., et al. (2015). Gut bacterial diversity of the tribes of India and comparison with the worldwide data. Sci. Rep. 5:18563. doi: 10.1038/srep18563
Edgar, R. C., Haas, B. J., Clemente, J. C., Quince, C., and Knight, R. (2011). UCHIME improves sensitivity and speed of chimera detection. Bioinformatics 27, 2194–2200. doi: 10.1093/bioinformatics/btr381
French, B. F., and Finch, H. (2016). Factorial invariance testing under different levels of partial loading invariance within a multiple group confirmatory factor analysis model. J. Mod. App. Stat. Meth. 15, 511–538. doi: 10.22237/jmasm/1462076700
Gilbert, J. A., Steele, J. A., Caporaso, J. G., Steinbruck, L., Reeder, J., Temperton, B., et al. (2012). Defining seasonal marine microbial community dynamics. ISME J. 6, 298–308. doi: 10.1038/ismej.2011.107
Gobet, A., Böer, S. I., Huse, S. M., van Beusekom, J. E., Quince, C., Sogin, M. L., et al. (2012). Diversity and dynamics of rare and of resident bacterial populations in coastal sands. ISME J. 6, 542–553. doi: 10.1038/ismej.2011.132
Gobet, A., Boetius, A., and Ramette, A. (2014). Ecological coherence of diversity patterns derived from classical fingerprinting and next generation sequencing techniques. Environ. Microbiol. 16, 2672–2681. doi: 10.1111/1462-2920.12308
Goffredi, S. K., Orphan, V. J., Rouse, G. W., Jahnke, L., Embaye, T., Turk, K., et al. (2005). Evolutionary innovation: a bone-eating marine symbiosis. Environ. Microbiol. 7, 1369–1378. doi: 10.1111/j.1462-2920.2005.00824.x
Grillevet, P. M., Sikaroodi, M., and Torzilli, A. P. (2009). Analyzing salt-marsh fungal diversity: comparing ARISA fingerprinting with clone sequencing and pyrosequencing. Fungal Ecol. 2, 160–167. doi: 10.1016/j.funeco.2009.04.001
Hewson, I., and Fuhrman, J. A. (2004). Richness and diversity of bacterioplankton species along an estuarine gradient in Moreton Bay, Australia. Appl. Environ. Microbiol. 70, 3425–3433. doi: 10.1128/AEM.70.6.3425-3433.2004
Hoeksema, B. W., and Matthews, J. L. (2011). Contrasting bleaching patterns in mushroom coral assemblages at Koh Tao, Gulf of Thailand. Coral Reefs 30:95. doi: 10.1007/s00338-010-0675-5
Huse, S. M., Welch, D. M., Morrison, H. G., and Sogin, M. L. (2010). Ironing out the wrinkles in the rare biosphere through improved OTU clustering. Environ. Microbiol. 12, 1889–1898. doi: 10.1111/j.1462-2920.2010.02193.x
Jami, E., Shterzer, N., and Mizrahi, I. (2014). Evaluation of automated ribosomal intergenic spacer analysis for bacterial fingerprinting of rumen microbiome compared to pyrosequencing technology. Pathogens 3, 109–120. doi: 10.3390/pathogens3010109
Jia, R., Fang, S., Tu, W., and Sun, Z. (2016). Driven factors analysis of China's irrigation water use efficiency by stepwise regression and principal component analysis. Discrete Dyn. Nat. Soc. 2016:8957530. doi: 10.115/2016/8957530
Kelly, L. E., Haas, A. F., and Nelson, C. E. (2018). Ecosystem microbiology of coral reefs: linking genomic, metabolomics and biogeochemical dynamics from animal symbioses to reefscape processes. mSystems 3:e00162–17. doi: 10.1128/mSystems.00162-17
Kelly, L. W., Williams, G. J., Barott, K. L., Carlson, C. A., Dinsdale, E. A., Edwards, R. A., et al. (2014). Local genomic adaptation of coral reef-associated microbiomes to gradients of natural variability and anthropogenic stressors. Proc. Natl. Acad. Sci. U.S.A. 111, 10227–10232. doi: 10.1073/pnas.1403319111
Khitmoh, K., Wilantho, A., Wongsawaeng, D., Tongsima, S., and Somboonna, N. (2017). 16S rRNA gene sequencing assessment of the prokaryotic communities in the southeast Andaman Sea, Thailand and potential environmental alerts. Chiang Mai J. Sci. 44, 15–28.
Kooperman, N., Ben-Dov, E., Kramarsky-Winter, E., Barak, Z., and Kushmaro, A. (2007). Coral mucus-associated bacterial communities from natural and aquarium environments. FEMS Microbiol. Lett. 276, 106–113. doi: 10.1111/j.1574-6968.2007.00921.x
Koren, O., and Rosenberg, E. (2006). Bacteria associated with mucus and tissues of the coral oculina patagonica in summer and winter. Appl. Environ. Microbiol. 72, 5254–5259. doi: 10.1128/AEM.00554-06
Langille, M. G., Zaneveld, J., Caporaso, J. G., McDonald, D., Knights, D., Reyes, J. A., et al. (2013). Predictive functional profiling of microbial communities using 16S rRNA marker gene sequences. Nat. Biotechnol. 31, 814–821. doi: 10.1038/nbt.2676
Latypov, Y. Y. (2015). Particular qualities of forming of reefs and coral communities in the Gulf of Thailand. Nat. Rev. Microbiol. 5, 1–8. doi: 10.5923/j.ije.20150501.01
Lauro, F. M., McDougald, D., Thomas, T., Williams, T. J., Egan, S., Rice, S., et al. (2009). The genomic basis of trophic strategy in marine bacteria. Proc. Natl. Acad. Sci. U.S.A. 106, 15527–15533. doi: 10.1073/pnas.0903507106
Lema, K. A., Willis, B. L., and Bourne, D. G. (2012). Corals form characteristic associations with symbiotic nitrogen-fixing bacteria. Appl. Environ. Microbiol. 78, 3136–3144. doi: 10.1128/AEM.07800-11
Lesser, M. P., Mazel, C. H., Gorbunov, M. Y., and Falkowski, P. G. (2004). Discovery of symbiotic nitrogen-fixing cyanobacteria in corals. Science 305, 997–1000. doi: 10.1126/science.1099128
Littman, R. A., Willis, B. L., Pfeffer, C., and Bourne, D. G. (2009). Diversities of coral-associated bacteria differ with location, but not species, for three acroporid corals on the Great Barrier Reef. FEMS Microbiol. Ecol. 68, 152–163. doi: 10.1111/j.1574-6941.2009.00666.x
McDonald, D., Price, M. N., Goodrich, J., Nawrocki, E. P., DeSantis, T. Z., Probst, A., et al. (2012). An improved Greengenes taxonomy with explicit ranks for ecological and evolutionary analyses of bacteria and archaea. ISME J. 6, 610–618. doi: 10.1038/ismej.2011.139
McKew, B. A., Dumbrell, A. J., Daud, S. D., Hepburn, L., Thorpe, E., Mogensen, L., et al. (2012). Characterization of geographically distinct bacterial communities associated with coral mucus produced by Acropora spp. and Porites spp. Appl. Environ. Microbiol. 78, 5229–52237. doi: 10.1128/AEM.07764-11
Mizuno, C. M., Rodriguez-Valera, F., and Ghai, R. (2015). Genomes of planktonic Acidimicrobiales: widening horizons for marine Actinobacteria by metagenomics. mBio 6:e02083–14. doi: 10.1128/mBio.02083-14
Pal, S., and Bhattacharya, M. (2013). An empirical study on the financial health of the main steel producing segment in India: application of factor analysis and multiple regression analysis. Decision 40, 47–55. doi: 10.1007/s40622-013-0009-x
Paul, V. J., Thacker, R. W., Banks, K., and Golubic, S. (2005). Benthic cyanobacterial bloom impacts the reefs of South Florida (Broward County, USA). Coral Reefs 24, 693–697. doi: 10.1007/s00338-005-0061-x
Phongsuwan, N., Chankong, A., Yamarunpatthana, C., Chansang, H., Boonprakob, R., Petchkumnerd, P., et al. (2013). Status and changing patterns on coral reefs in Thailand during the last two decades. Deep Sea Res. II Top. Stud. Oceanogr. 96, 19–24. doi: 10.1016/j.dsr2.2013.02.015
Phongsuwan, N., and Chansang, H. (2012). Repeated coral bleaching in the Andaman Sea, Thailand, during the last two decades. Phuket Mar. Biol. Center Res. Bull. 71, 19–41. Available online at: https://www.dmcr.go.th/dmcr/fckupload/upload/44/image/FullpaperPMBC/2012%20Vol.71%20Phongsuwan%2019%2041.pdf
Rädecker, N., Pogoreutz, C., Voolstra, C. R., Wiedenmann, J., and Wild, C. (2015). Nitrogen cycling in corals: the key to understanding holobiont functioning? Trends. Microbiol. 23, 490–497. doi: 10.1016/j.tim.2015.03.008
Ramírez, F., Afán, I., Davis, L. S., and Chiaradia, A. (2017). Climate impacts on global hot spots of marine biodiversity. Sci. Adv. 3:e1601198. doi: 10.1126/sciadv.1601198
Reshef, L., Koren, O., Loya, Y., Zilber-Rosenberg, I., and Rosenberg, E. (2006). The coral probiotic hypothesis. Environ. Microbiol. 8, 2068–2073. doi: 10.1111/j.1462-2920.2006.01148.x
Riesenfeld, C. S., Schloss, P. D., and Handelsman, J. (2004). Metagenomics: genomic analysis of microbial communities. Ann. Rev. Genet. 38, 525–552. doi: 10.1146/annurev.genet.38.072902.091216
Robertson, V., Haltli, B., McCauley, E. P., Overy, D. P., and Kerr, R. G. (2016). Highly variable bacterial communities associated with the octocoral Antillogorgia elisabethae. Microorganisms 4:23. doi: 10.3390/microorganisms4030023
Rohwer, F., Seguritan, V., Azam, F., and Knowlton, N. (2002). Diversity and distribution of coral-associated bacteria. Mar. Ecol. Prog. Ser. 243, 1–10. doi: 10.3354/meps243001
Rosenberg, E., Koren, O., Reshef, L., Efrony, R., and Zilber-Rosenberg, I. (2007). The role of microorganisms in coral health, disease and evolution. Nat. Rev. Microbiol. 5, 355–362. doi: 10.1038/nrmicro1635
Rosenberg, E., and Loya, Y. (2004). Coral Health and Disease. Berlin; Heidelberg: Springer. doi: 10.1007/978-3-662-06414-6
Rusch, A., and Gaidos, E. (2013). Nitrogen-cycling bacteria and archaea in the carbonate sediment of a coral reef. Geobiology 11, 472–484. doi: 10.1111/gbi.12048
Schloss, P. D., Westcott, S. L., Ryabin, T., Hall, J. R., Hartmann, M., Hollister, E. B., et al. (2009). Introducing mothur: open-source, platform-independent, community-supported software for describing and comparing microbial communities. Appl. Environ. Microbiol. 75, 7537–7541. doi: 10.1128/AEM.01541-09
Sharp, K., Arthur, K. E., Gu, L., Ross, C., Harrison, G., Gunasekera, S. P., et al. (2009). Phylogenetic and chemical diversity of three chemotypes of bloom-forming lyngbya species (Cyanobacteria: Oscillatoriales) from reefs of southeastern Florida. Appl. Environ. Microbiol. 75, 2879–2888. doi: 10.1128/AEM.02656-08
Sikaroodi, M., and Gillevet, P. M. (2012). Quality control in multi-tag pyrosequencing of microbial communities. BioTechniques 53, 381–383.
Somboonna, N., Assawamakin, A., Wilantho, A., Tangphatsornruang, S., and Tongsima, S. (2012). Metagenomic profiles of free-living archaea, bacteria and small eukaryotes in coastal areas of Sichang island, Thailand. BMC Genomics 13:S29. doi: 10.1186/1471-2164-13-S7-S29
Somboonna, N., Wilantho, A., Assawamakin, A., Monanunsap, S., Sangsrakru, D., Tangphatsornruang, S., et al. (2014). Structural and functional diversity of free-living microorganisms in reef surface, Kra island, Thailand. BMC Genomics 15:607. doi: 10.1186/1471-2164-15-607
Teng, F., Yang, F., Huang, S., Bo, C., Xu, Z. Z., Amir, A., et al. (2015). Prediction of early childhood carries via spatial-temporal variations of oral microbiota. Cell Host Microbe 18, 296–306. doi: 10.1016/j.chom.2015.08.005
Tout, J., Jeffries, T. C., Webster, N. S., Stocker, R., Ralph, P. J., and Seymour, J. R. (2014). Variability in microbial community composition and function between different niches within a coral reef. Microb. Ecol. 67, 540–552. doi: 10.1007/s00248-013-0362-5
Villareal, T. A. (1995). Abundance and photosynthetic characteristics of Trichodesmium spp. along the Atlantic Barrier Reef at Carrie Bow Cay, Belize. Mar. Ecol. 16, 259–271. doi: 10.1111/j.1439-0485.1995.tb00410.x
Wang, Q., Garrity, G. M., Tiedje, J. M., and Cole, J. R. (2007). Naive Bayesian classifier for rapid assignment of rRNA sequences into the new bacterial taxonomy. Appl. Environ. Microbiol. 73, 5261–5267. doi: 10.1128/AEM.00062-07
Webster, N. S., Negri, A. P., Botté, E. S., Laffy, P. W., Flores, F., Noonan, S., et al. (2016). Host-associated coral reef microbes respond to the cumulative pressures of ocean warming and ocean acidification. Sci. Rep. 6:19324. doi: 10.1038/srep19324
Webster, N. S., and Reusch, T. B. H. (2017). Microbial contributions to the persistence of coral reefs. ISME J. 11, 2167–2174. doi: 10.1038/ismej.2017.66
Keywords: diversity, microbiota, microbiome, reef, coral
Citation: Bulan DE, Wilantho A, Krainara P, Viyakarn V, Chavanich S and Somboonna N (2018) Spatial and Seasonal Variability of Reef Bacterial Communities in the Upper Gulf of Thailand. Front. Mar. Sci. 5:441. doi: 10.3389/fmars.2018.00441
Received: 13 March 2018; Accepted: 02 November 2018;
Published: 29 November 2018.
Edited by:
Jamal Ouazzani, Centre National de la Recherche Scientifique (CNRS), FranceReviewed by:
Susana Enríquez, Universidad Nacional Autónoma de México, MexicoCharles Alan Jacoby, St. Johns River Water Management District, United States
Copyright © 2018 Bulan, Wilantho, Krainara, Viyakarn, Chavanich and Somboonna. This is an open-access article distributed under the terms of the Creative Commons Attribution License (CC BY). The use, distribution or reproduction in other forums is permitted, provided the original author(s) and the copyright owner(s) are credited and that the original publication in this journal is cited, in accordance with accepted academic practice. No use, distribution or reproduction is permitted which does not comply with these terms.
*Correspondence: Naraporn Somboonna, bmFyYXBvcm4uc0BjaHVsYS5hYy50aA==
Suchana Chavanich, c3VjaGFuYS5jQGNodWxhLmFjLnRo
 Dewi Embong Bulan
 Alisa Wilantho
 Patcharaporn Krainara3
 Voranop Viyakarn
 Naraporn Somboonna