- Department of Environmental Sciences, University of Virginia, Charlottesville, VA, United States
Local effects of flow interaction with seagrass structure modify meadow scale hydrodynamics, resulting in lower current velocities and wave heights within a seagrass meadow. This attenuation promotes the deposition of suspended sediment, increasing the light available locally to benthic organisms. To elucidate the relationship between small-scale hydrodynamics that occur at the sea floor and the meadow scale effects of seagrass, high resolution velocity profiles were recorded adjacent to the sediment-water interface within a Zostera marina seagrass meadow in South Bay, Virginia. Additionally, instrumentation was deployed across the meadow to seasonally monitor corresponding changes in wave height across the seagrass meadow. Results show that wave height was reduced by 25–49% compared to an adjacent bare site, and by 13–38% compared to an analytical model of wave attenuation over an unvegetated seafloor with the same bathymetry. The greatest attenuation of wave height occurred during the spring and summer when seagrass biomass was greatest, while the lowest attenuation occurred in winter, corresponding to periods of minimal seagrass biomass. Significant wave height attenuation coefficients, αw, calculated for the meadow ranged from αw = 0.49 in spring to 0.19 during winter, but were highly dependent on wave conditions, with greater αw for larger wave heights and longer period waves. Within the seagrass meadow during summer, the highest measured bed shear stress was τbed = 0.034 ± 0.022 Pa, which occurred during peak wave conditions. This suggests that during high biomass conditions, the bed shear stress rarely exceeds the critical bed shear, τcrit = 0.04 Pa necessary to initiate sediment resuspension. This is in contrast to the bare site which showed elevated values of τbed above the critical threshold across all seasons. These findings suggest the seagrass meadow does exert significant control over both wave heights and the hydrodynamic conditions at the sediment-water interface, and this control is due to the attenuation of wave motion by drag induced from the seagrass over the expanse of the meadow.
Introduction
Coastal waters in which seagrasses exist often experience complex hydrodynamics containing both wind-driven wave motions and tide-driven currents. Seagrass beds have been shown to attenuate both oscillatory flows (Fonseca and Cahalan, 1992; Luhar et al., 2017) and current velocities (Koch and Gust, 1999; Lacy and Wyllie-Echeverria, 2011), impacting the flow structure above and within the canopy. Seagrasses are typically light limited, so their range and productivity is restricted by both the depth and clarity of the water column (Carr et al., 2016). Seagrasses reduce suspension of sediment due to the stabilizing effect of root structure and flow modification caused by the plant structure (Gacia and Duarte, 2001; Hansen and Reidenbach, 2013), creating a positive feedback loop that increases the light available at the sea floor and promotes primary productivity (Carr et al., 2010). Therefore, understanding flow within a combined wave-current boundary layer is critical to estimating local bed shear stress, which influences sediment suspension and light attenuation, which ultimately alters seagrass productivity and the ecosystem services provided by a healthy seagrass meadow.
Flow conditions adjacent to the sediment-water interface have the greatest implication for sediment suspension. Sediment grains are mobilized when the bed shear stress acting on a grain surpasses the critical shear stress necessary to initiate the grain's motion. Shear stress is a tangential force imparted to the sea floor by velocity gradients found in the boundary layer of the overlying water. As a result, the bottom boundary layer in shallow coastal waters is a combination of a thin wave boundary layer superimposed over a well-developed current boundary layer that may be orders of magnitude thicker (Grant and Madsen, 1979). This interaction between waves and currents is nonlinear, and the shear stresses created at the seafloor can be dramatically different than those expected under either condition independently (Jing and Ridd, 1996). For waves generated within fetch-limited shallow coastal bays, the magnitude of wave orbital motions decrease with depth and the amount of wave energy that reaches the seafloor depends on the wave height, wave period, and water depth (Chen et al., 2007; Fagherazzi and Wiberg, 2009) as well as the structure and density of vegetation (Zeller et al., 2014; Weitzman et al., 2015; Hansen and Reidenbach, 2017).
Drag is fundamentally a process of removing energy from a flow. The bulk drag coefficient (CD) is a dimensionless measure of the resistance of an object to mean flow (Denny, 1988). This drag coefficient can be calculated in pure current environments (Rippeth et al., 2002) as well as in environments with waves and currents (Bricker et al., 2005), however is defined as a measure of momentum attenuation, and is not a measure of wave height reduction. In coastal environments, CD is often estimated as the amount of energy dissipation caused by flow interaction with the seafloor, and historically has been computed from estimates of the bed shear velocity, u*, through quantification of the mean velocity profile, turbulent Reynolds stresses, or rate of turbulent kinetic energy dissipation (e.g., Reidenbach et al., 2006). Due to the presence of vegetation, this drag can be due to interactions with the seafloor or with the seagrass blades themselves, therefore integrated drag through the water column must be taken in to account (Nepf, 1999). The relative magnitude of CD can be impacted by the incident wave and current forcing, the characteristics of the seagrass canopy, and morphology and flexibility of the individual blades (Houser et al., 2015). CD for a given canopy can range up to an order of magnitude or more due to variations in Reynolds number of the mean flow and Keuglan-Carpenter number of the oscillatory flow (Bradley and Houser, 2009; Zeller et al., 2014).
Although CD is an important measure of the integrated drag by the canopy of the flow, often it is advantageous to determine canopy effects solely on the wave climate through a separate wave attenuation parameter. Wave attenuation, αw, is typically calculated using the change in wave height or wave velocities measured at two or more locations along the direction of wave propagation. This method was first explored using wave height decay by Bretschneider (1954) and revised by Bretschneider (1958) for wind waves in shallow water with impermeable sediment, and has been applied to a variety of settings (Mazda et al., 1997; Quartel et al., 2007). Lowe et al. (2007) also calculated wave attenuation by comparing wave velocity spectra above and within a canopy. Using a similar method, Paul and Amos (2011) determined wave attenuation by comparing differences in wave spectra horizontally across a meadow. These methods are different in that the Bretschneider (1954) approach only considers energy dissipation across the mean of the highest 1/3 of the waves (the significant wave height), whereas Lowe et al. (2007) calculates the total energy dissipation across the entire wave spectra. However, it is the largest waves that are often most relevant to coastal erosion, so although only calculating energy loss at the significant wave frequency is a less complete measurement of attenuation, it may be a more practical metric for use in numerical models and to understand the dominant physical processes causing sediment resuspension, etc.
Over the past few decades, numerous field and laboratory studies have been performed to determine the effects of vegetation on wave attenuation. In a field study in a Florida bay, Bradley and Houser (2009) measured changes in wave height across a seagrass meadow using a linear array of pressure sensors. Wave height decayed at an exponential rate once within the meadow, with a total decrease of 30% across the 39 m transect. Dissipation was not uniform across all frequencies of wave motion; seagrasses acted as a low-pass filter for wave attenuation by selectively removing high frequency motions due to the slower oscillations of the seagrass blades. In flume studies, Fonseca and Cahalan (1992) compared attenuation of wave energy by four different seagrass species including Zostera marina over a 1 m section in a flume, and found an average wave energy reduction of 40% per meter of seagrass when the blade length was approximately equal to the water depth. The relation between leaf length and water depth was found to be the most important parameter for all four species studied. In another flume study, Paul et al. (2012) determined that seagrasses were less effective at attenuating wave energy in combined wave-current environments compared to environments with waves alone. Paul et al. (2012) suggest that the reduction in attenuation in wave-current environments is a combination of decreased frontal area as seagrass blades are flattened by the current and a reduction in the amount of wave energy transferred to blade motion as individual blade are prevented from swaying with wave orbital motion in the presence of a strong current.
Within a shallow coastal bay in Virginia United States, Hansen and Reidenbach (2012) compared flow between vegetated sites of varying density at points above and below the seagrass canopy to assess the effect of seagrass on wave orbital motion, turbulence and sediment suspension. The seagrass canopy was found to reduce flow velocity, turbulence, and wave orbital velocities compared to measurements above the canopy. Significant wave heights were also observed to be lower compared to an adjacent unvegetated site. Hansen and Reidenbach (2013) continued this work with a seasonal comparison of hydrodynamics between a bare and vegetated site, and found that wave heights were reduced at the vegetated site in all seasons; however, wave orbital motions were still able to penetrate vertically through the canopy and induce bottom shear stress. However, no direct measurements of wave-current interactions within the fluid layer adjacent to the seafloor have yet been made within a seagrass meadow.
To determine the effects of a seagrass meadow on wave attenuation and wave-current interactions at the sediment-water interface, the same Z. marina meadow in South Bay, Virginia, was monitored seasonally across a 20-month time period. The two specific questions that are addressed are:
1. How does seagrass modify wave characteristics, including wave height and period, as waves propagate across a meadow?
2. How does seagrass alter wave-current boundary layer development and bed shear stress compared to an unvegetated (bare) site?
Materials and Methods
Study Area
Research was conducted in South Bay, a shallow coastal lagoon located within the Virginia Coast Reserve Long Term Ecological Research site (VCR LTER) on the Delmarva Peninsula, Virginia (Figure 1). The VCR LTER consists of a system of barrier islands, lagoons, and salt marshes which are strongly influenced by semidiurnal tidal variations. Mean water depth in South Bay is 1.0 m, with an average tidal amplitude of 0.6 m, with winds primarily from the SSE-SSW and N-NE (Fagherazzi and Wiberg, 2009). Waves in the bay are primarily wind driven, as the barrier island system blocks larger ocean swell from propagating further inland.
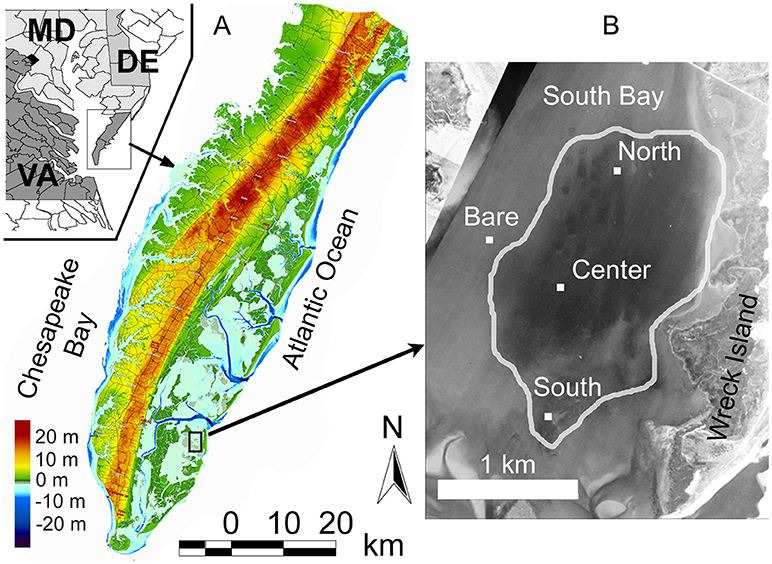
Figure 1. (A) Location of study area off-shore of the Delmarva Peninsula, Virginia. Seagrass study site is in South Bay, indicated in the black box. Color-map shows the land elevation and bathymetry of the Delmarva Peninsula relative to the North American Vertical Datum of 1988 (NAVD88). (B) Site locations within South Bay, superimposed on an aerial photograph modified from Orth et al. (2012). The extent of the seagrass meadow as of 2010 is indicated by the area within the white line.
The dominant vegetation in South Bay is the seagrass (eelgrass) Z. marina. Seagrasses, once a dominant feature in the coastal bays of the Delmarva Peninsula, disappeared in the 1930's due to a combination of a pandemic wasting disease and the 1933 Chesapeake-Potomac hurricane. South Bay was a site of eelgrass restoration that was reseeded with Z. marina from 2001–2005. As of summer 2010, the reseeded patches in South Bay had coalesced and grown to a meadow encompassing >6 km2 (Orth et al., 2012). Three sites were chosen for the study within the restored seagrass meadow, named North, Center, and South sites, which were in an array spaced approximately 1 km apart (Figure 1). The fourth site was in a bare (unvegetated) portion of the bay adjacent to the meadow, approximately 0.5 km west of the Center site. Mean water depths at the four sites were North (1.21 m), Center (1.00 m), South (1.16 m), and bare (0.94 m). The fetch length at each site varied depending on wind angle due to the location of the marsh and barrier island system. South Bay is long and narrow, oriented with the long axis in a north to south direction, where the north and south fetch lengths were the longest (7.5 km), while east and west fetch lengths were typically between 1 and 2 km.
Data Collection
Hydrodynamics were measured at the four sites (North, Center, South, and bare) and a seasonal sampling regime was implemented between October 2011 and July 2013 to assess the impact of morphological changes of the seagrass on the meadow scale hydrodynamics. Wave motions were recorded simultaneously at each site using wave gauges (Richard Branker Research© TWR-1050), which were programmed to measure pressure in bursts of 1024 samples at 4 Hz every 10 min. These 1,024 samples were averaged to compute mean tidal height every 10 min. Significant wave height, the mean wave height of the highest third of waves, was determined from pressure data using spectral analysis (Wiberg and Sherwood, 2008). Wave gauge pressure data was corrected for atmospheric pressure fluctuations using measurements recorded at the nearby Wachapreague National Oceanographic and Atmospheric Administration (NOAA) meteorological station. Meteorological and wave data collected for this study is publicly available on the Virginia Coast Reserve, Long Term Ecological Research Data Repository (Thomas and Reidenbach, 2015; Porter et al., 2018).
Adjacent to the sediment-water interface, high resolution velocity profiles were recorded using a Nortek© Vectrino II acoustic Doppler profiler. Data were collected during July 2012 and July 2013 at the center seagrass site, and during July 2012, October 2012, and July 2013 at the bare site. The Vectrino profiler recorded velocity data over a 30 mm profile at 1 mm resolution at a rate of 20 Hz. Doppler pulses are emitted from a center transmitter and received by four passive transducers angled 30° toward the center, resulting in a sample volume 40–70 mm from the center transmitter. This high spatial and temporal resolution allowed for the resolution of wave and turbulence motions. The Vectrino profiler was positioned to record velocity measurements directly adjacent to the sediment-water interface to capture water motions associated with wave-current boundary layer development. To ensure measurements adjacent to the sediment were included in the data set, several bins were positioned below the interface, and the signal to noise ratio (SNR) was used to indicate the location of the bottom. If necessary, seagrass was removed from directly beneath the probe at the vegetated site to prevent blade interference. Velocity profiles were first rotated into the direction of the mean flow, using an average of the rotation required for the top three points. Each raw data record was then analyzed to see if the SNR and percent correlation averaged across the 10-min record exceeded 20 dB and 80%, respectively, the recommended limits for velocity measurements. If these conditions were met, the raw data were used to compute velocity, wave, and turbulence statistics. In general, velocity data within approximately 5 mm from the seafloor did not meet these conditions, and therefore were not used in the analysis.
Seagrass Morphology and Biomass
Physical characteristics of the Z. marina bed (shoot density, blade length and width) were measured during each deployment at the Center site, which was considered representative of the established meadow area (Table 1). Density was determined in situ via 0.25 m2 shoot counts, and shoots were brought to the laboratory to measure length and width. Lengths and widths were recorded for the longest three blades per shoot. The meadow was most dense with the longest and widest blades during the summer for both years sampled, with values that peaked during July 2013 with a density of 411 ± 33 shoots m−2 and were lowest during January 2012 at 100 ± 36 shoots m−2. Summertime aboveground seagrass biomass has been measured in the South Bay seagrass meadow annually since 2009 (McGlathery, 2017), and was 107 ± 19 g m−2 in 2012 and 173 ± 52 g m−2 in 2013.
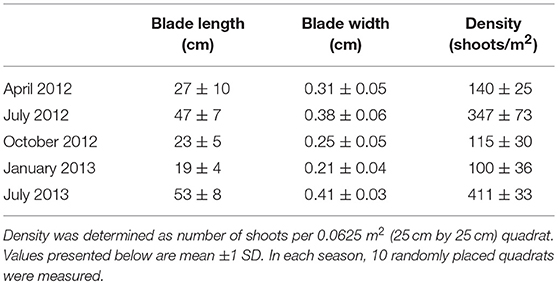
Table 1. Seasonal morphometric data summarizing characteristics of Z. marina meadow in South Bay, Virginia across five sampling periods from April 2012 through July 2013.
Wave Attenuation
The effects of the seagrass meadow on wave development were made in three different ways. The first was by directly comparing the significant wave height at the Center site within the seagrass meadow to significant wave height measured simultaneously at the bare site. The second was through calculation of a wave attenuation coefficient (αw) for attenuation of significant wave heights as waves propagated across the meadow, while the third was comparisons of wave heights at specific locations within the seagrass meadow to predicted wave heights using the commonly applied Young and Verhagen (1996) wave height model.
Wave data were first filtered to include only sampling periods during which the wind direction was nearly parallel to a line between the sites and significant wave heights were >3 cm. Because waves in South Bay are wind driven, wind direction can be used as an approximation for the direction of wave propagation. A range of 45° (22.5° to either side of the direction between two sites) was used in the filter to provide adequate data for analysis of attenuation. After preliminary analysis, significantly lower wave heights were measured at the South site compared to the other two sites during periods when winds were blowing from the south. The South site has limited fetch for south winds with a distance of approximately 1 to 1.5 km. As a result of these short fetch lengths, waves are not fully developed when they reach the South site, and the processes of wave growth due to wind energy and decay due to seagrass induced drag compete in a way that cannot be easily predicted. Due to this limitation, only data for time periods of north winds (blowing north to south) was used in the computation of wave attenuation.
A wave attenuation coefficient, αw, was calculated using the formulation from Bretschneider (1954) for waves propagating across an impermeable bottom with constant depth and no refraction:
where H1 and H2 are the initial and final wave heights, f is the friction factor, Δx is the horizontal distance the wave traversed, T is the wave period, Ks is the shoaling factor, and ϕfis the bottom friction dissipation function [s4 m−2], defined as:
where L is the wavelength and h is the water depth. Bretschneider (1954) describe f as a dimensionless “calibrated friction factor” which describes the reduction in wave height caused by bottom characteristics. This friction factor, f, can be rewritten as a measure of wave induced drag (Mazda et al., 1997), αw, where Equation 1 then becomes:
This method estimates flow resistance across the entire height of the plant structure as bottom friction. Equation 3 can be simplified for South Bay by setting the shoaling factor (Ks) equal to 1 because South Bay is roughly a constant depth (with mean water depths ranging between 1.0 and 1.2 m) and does not typically induce wave shoaling. Solving for αw:
Mazda et al. (1997) called this αw parameter a coefficient of drag (CD), however in mixed wave-current dominated systems, it is not a true measure of integrated drag on the flow, but only the effects of the frictional resistance on waves. We therefore use αw to indicate this parameter is solely a function of wave activity.
A wave height model, created by Young and Verhagen (1996), was applied to predict wave heights within South Bay assuming no seagrass is present. The Young and Verhagen (1996) model (abbreviated as YV) uses semi-empirical relationships that relate fetch length, wind velocity, and water depth to significant wave height and peak wave period. This commonly applied fetch-limited, finite-depth model was calibrated for fine-grained, cohesive mud within a 1–2 m depth shallow lake, and therefore is a good approximation for the sediment and physical conditions in South Bay in the absence of vegetation. In addition, this model has been previously validated for use in the coastal bay system of the VCR (Mariotti and Fagherazzi, 2013b; Mcloughlin et al., 2015). The significant wave Hs and peak wave period Tp were computed as:
with , , , and , where h is the depth, χ is the fetch, and Uwind is the reference wind speed. Fetch was determined from aerial photographs of the VCR LTER bays, wind velocity and direction were determined from the Wachapreague NOAA meteorological station, and water depth was determined from the wave gages following the atmospheric pressure correction. The model output, assuming no seagrass was present, was then compared to field data collected within the seagrass site to determine the effects of the seagrass meadow on wave attenuation. Model output was also compared to measured wave heights at the bare site.
Observed waves with significant wave heights below 3 cm were filtered from the data set to reduce contamination from small turbulent fluctuations that could artificially skew attenuation values. Small values below this cutoff may be the result of random non-wave motion, and are unlikely to be influenced by bottom drag (Wiberg and Sherwood, 2008). Model outputs were compared to observations collected in South Bay, and the percent difference between the modeled and measured values was calculated as follows:
Positive values indicate that the modeled wave heights predicted over an unvegetated seafloor were greater than the in situ observations of wave heights measured in the presence of seagrass. Modeled data was also computed and compared to observed wave heights measured at the bare site. In addition, Equation 7 was used to quantify the percent difference in observed wave heights measured simultaneously at the seagrass and bare sites to determine in situ values of wave height reduction.
Bed Shear and Friction Velocity
High resolution velocity measurements using a Nortek© Vectrino II acoustic Doppler profiler were used to quantify bed shear and friction velocities at the bare and seagrass sites. In combined wave-current flow, both waves and currents can induce shear at the sediment-water interface. Bed shear is often estimated in current-dominated regimes by the magnitude of turbulent energy within the overlying boundary layer or through quantification of the logarithmic profile of the mean flow (Reidenbach et al., 2006). However, the presence of vegetation often disrupts the development of a logarithmic profile within the mean flow and alters the shear at the sediment-water interface (Hansen and Reidenbach 2013). In addition, wave orbitals induce large variances in the horizontal and vertical velocity components, which mask velocity variances due to turbulence, making it necessary to separate the wave and turbulence parts of the signal. For wave-current flows, the components of the total instantaneous velocity u (as well as for v and w, not shown) can be separated via Reynolds decomposition according to:
where is the mean current velocity, ũ is the instantaneous wave orbital velocity, and u′ is the instantaneous turbulent velocity. Current, wave and turbulence perturbations were separated using a spectral decomposition technique called the Phase method (Bricker and Monismith, 2007), which converts the temporal velocity record into frequency space via Fourier transformation and isolates the wave stress using the phase lag between horizontal and vertical components of the velocity signal. Further details of the Phase method can be found in Bricker and Monismith (2007) and Stocking et al. (2016).
Bed shear stress τbed was calculated using the formulation of Wiberg and Smith (1983), defined as:
where τc is bed shear due only to currents and τw is bed shear due only to wave orbital motions. The current-induced bed shear stress is estimated using near-bed turbulent kinetic energy (TKE) outside the wave boundary layer, according to Soulsby and Dyer (1981):
where ρ is the density of seawater and:
The wave-induced contribution is parameterized using the near-bottom wave orbital velocity, uorb, computed by quantifying motions only within the wave band of the velocity spectra measured at z = 0.02 m above the seafloor, and a wave friction factor fw (Jonsson, 1967):
where ρ is the fluid density, and kb is the characteristic roughness length (Fagherazzi and Wiberg, 2009). Lawson et al. (2007) estimated kb as 3D84, where D84 is the sediment grain diameter (D) at which 84% of the sample is finer than D. D84 measured at the seagrass site ranged between 151 ± 1 μm and 158 ± 3 μm, while the unvegetated site ranged from 152 ± 4 μm to 162 ± 2 μm.
Results
Wind speed for each deployment is shown in Figure 2A. Seasonal averages ranged from 2.1 m s−1 in July 2012 to 4.8 m s−1 in July 2013; however, the deployments captured enough variation that all seasonal means were within one standard deviation. The maximum 10-min averaged wind speed was 27.8 m s−1. No seasonal trends were apparent in the data; although the second and third highest averages both occurred in April, possibly indicating stormier weather and the potential for larger wave development in the spring.
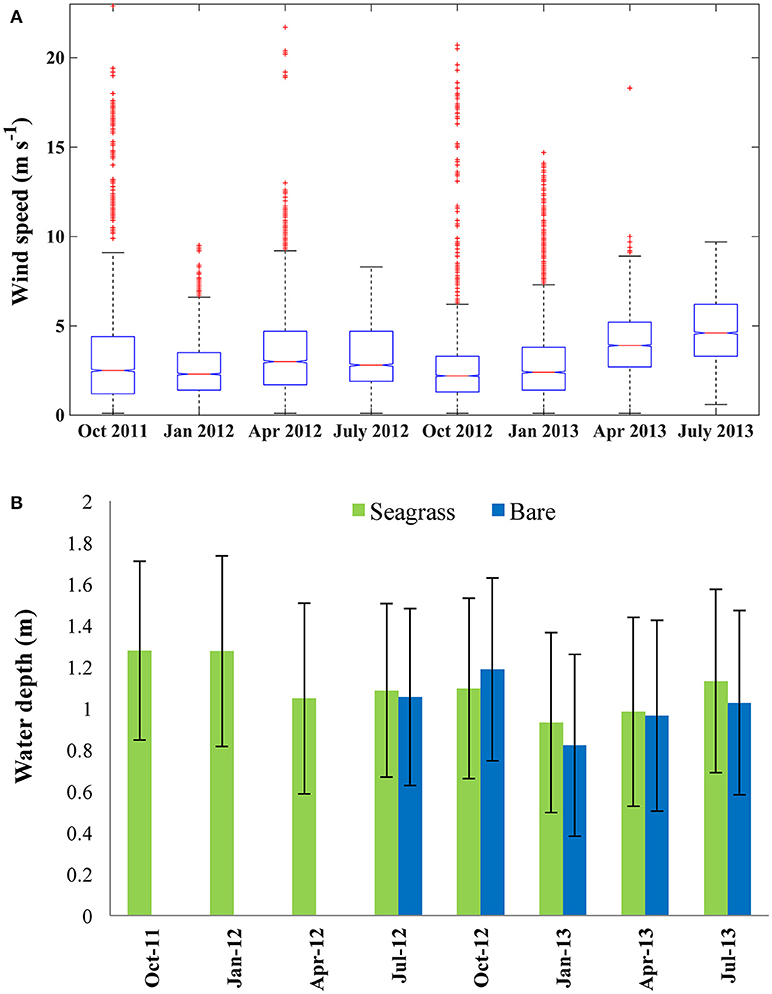
Figure 2. (A) Wind speed measured at the Wachapreague NOAA Meteorological station for each sampling period. Horizontal red line within the box indicates median wind speed, lower and upper edges of the box represent the 25th and 75th percentiles respectively. Red crosses represent outliers. (B) Water depth at the bare (blue) and center seagrass (green) sites averaged across each sampling period. Error bars indicate ±1 SD.
The seasonal average depth, measured at the Center site ranged between 0.93 m in January 2013 and 1.28 m in October 2011, with a standard deviation of 0.46 and 0.42 m, respectively (Figure 2B). A semi-diurnal tide drives the variation in water depth in South Bay, so the standard deviation is affected by the tidal range. At the bare site, the mean depth ranged from 0.82 m in January 2013 to 1.19 m in October 2012. The mean depths at the bare and seagrass sites were within one standard deviation for all seasons, with a maximum difference of 0.11 m in the mean seasonal values. Seasonal differences in mean water depth are a result of weather systems; including wind or barometric pressure variations which may force more water toward or away from the shoreline. Seasonally averaged mean water velocities ranged from 3.5 to 7.1 cm s−1 at the seagrass site, with significantly higher mean seasonal velocities (ANOVA, p < 0.01) at the bare site of 11.9–25.9 cm s−1.
Wave Characteristics
Waves in South Bay are primarily wind driven, with seasonally averaged significant wave heights ranging from 0.02 m within the seagrass bed to 0.09 m at the bare site (Figure 3A). Seasonally averaged significant wave periods were between 1.6 and 2.4 s (Figure 3B). The distribution of significant wave height was highly skewed, with intermittent, large waves occurring during storm events. Consequently, the maximum 10-min significant wave heights for each season were much higher than the average value, with the largest Hs across all deployments reaching 0.55 m. In addition, significant wave height varied considerably as a function of wind direction due to altered fetch lengths.
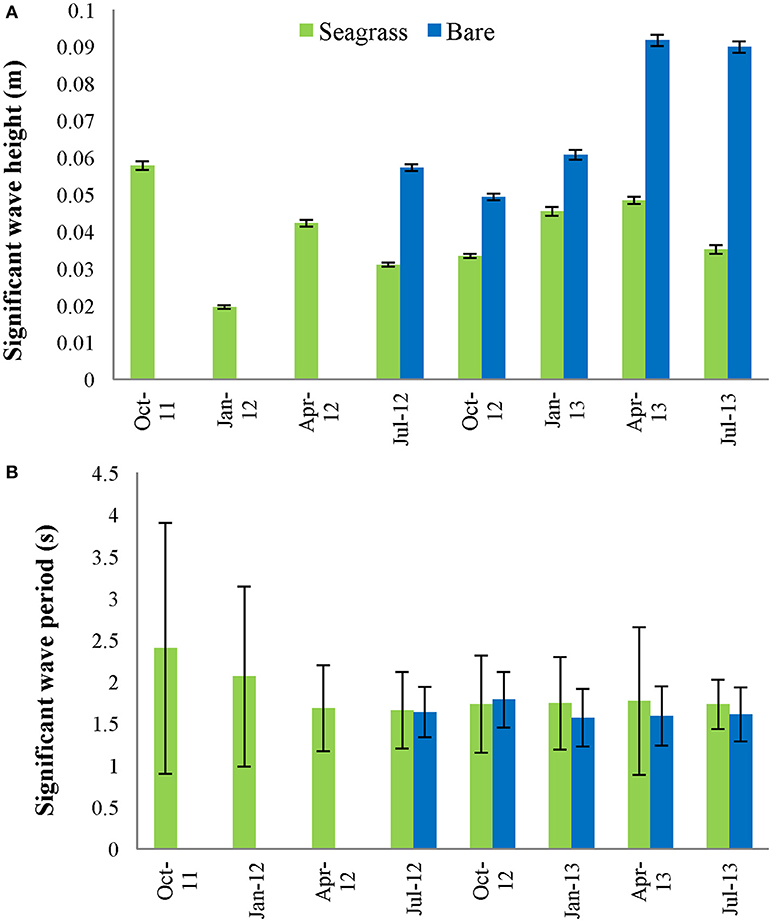
Figure 3. (A) Average significant wave height (±1 SE) and (B) average significant wave period (±1 SD) for the center vegetated site and nearby bare site, across 8 seasonal deployments (ranging from 14 to 19 days). Bare data is missing for October 2011–April 2012.
Average Hs was statistically lower within the seagrass meadow compared to the bare site during all seasons (ANOVA, p < 0.01). As predicted by the seasonal mean wind values, the high wind speeds in April 2013 and July 2013 correspond to the largest mean significant wave heights at the bare site, however the mean significant wave height at the vegetated site follows a trend more aligned with the seasonal shoot density distribution, with maximum values when densities were low. Average significant wave period, Ts, was slightly higher at the vegetated site across all seasons except during October 2012, although the difference was not statistically significant. Controls on significant wave height include; fetch length, wind speed, water depth, and wave attenuation, which varies as a property of meadow structure. The fetch length, wind speed, and water depth were all statistically similar at the bare and seagrass sites, and therefore the difference in apparent wave properties is primarily due to the presence of seagrass.
Wave Attenuation
Plots of significant wave height at the bare vs. vegetated site are displayed across four consecutive seasons (Figure 4). Data points that fall below the 1:1 line indicate wave attenuation at the seagrass site, and the slope of the regression line represents the degree to which wave height is attenuated by the seagrass bed (adapted from Koch 2006). Overall, significant wave height at the seagrass site was 51% of significant wave height at the bare site in the summer, 59% in the fall, 75% in the winter, and 53% in the spring. Mean water depths for these time periods are shown in Figure 2B, which range from 0.82 to 1.18 m across seasons. Although there is seasonal variability in the mean depths due to variability in tidal and atmospheric forcings, within each season mean water depths at the seagrass and bare sites are very similar. Data from the summer and fall 2012 show greater variation and therefore lower R2-values (R2 = 0.50 and 0.60, respectively), compared to winter and spring 2013 (R2 = 0.75 and 0.70, respectively). This may be a result of the changes in seagrass cover during the sampling period due to growth or senescence of the seagrass. In the winter, the bed topography of the less dense meadow matches more uniformly with the surrounding unvegetated region, causing a line of best fit that better matches the 1:1 line of no attenuation (R2 = 0.75, slope = 0.75).
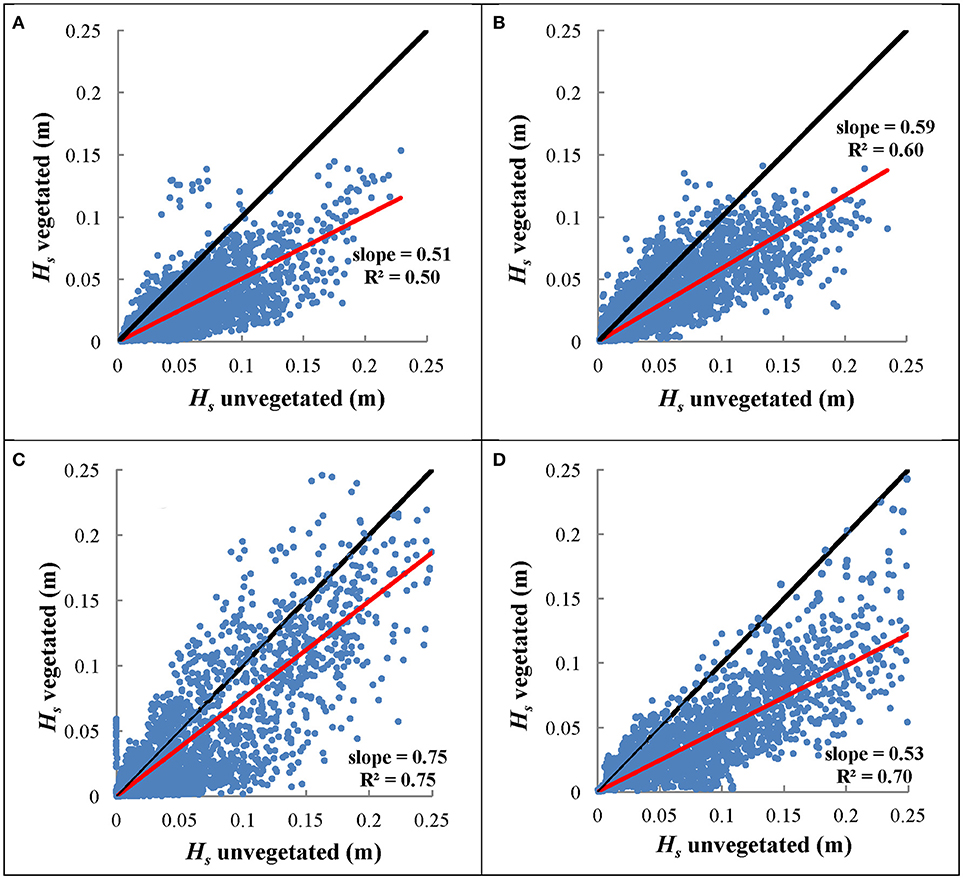
Figure 4. Significant wave height at the center vegetated site compared to significant wave height at the nearby bare site over four seasons (A) summer 2012, (B) fall 2012, (C) winter 2013, and (D) spring 2013. The slope of the regression line represents the degree of wave height attenuation between these two sites, with shallower slopes indicating greater attenuation. The regression line was fit to pass through the origin. Black line represents 1:1 slope line, indicating a case with no attenuation between the bare and vegetated sites.
Wave Attenuation Coefficients
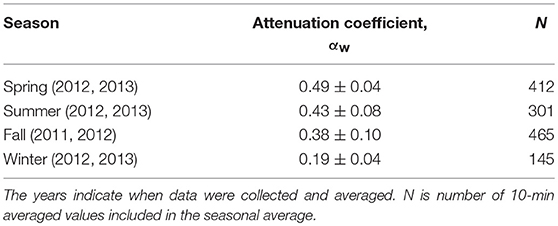
Attenuation coefficients for South Bay averaged across seasonal deployments varied from αw = 0.19 to 0.49 (Table 2). The largest seasonally averaged wave attenuation coefficients occurred in spring, while the smallest occurred in winter when seagrass density was lowest. However, there is large variability in attenuation coefficients that are dependent upon the wave environment. Plots of wave frequency vs. αw show a trend of higher attenuation coefficients for lower frequency waves during each season (Figures 5A,B shown for summer 2012 and winter 2013, respectively). Linear wave theory suggests that waves will attenuate prior to reaching the sea floor when the wave frequency (f) is greater than (Wiberg and Sherwood, 2008). For the water depths typical in South Bay (1–2 m), this relationship suggests that waves with a frequency >0.63–0.88 s−1, depending on the tidal conditions, will not interact with the seafloor. This is consistent with the decrease in attenuation coefficients observed as wave frequencies increase, approaching αw = 0 as frequencies surpass 0.75 s−1 (Figures 5A,B). Negative αw values for large wave frequencies, indicate waves that were likely not interacting with the seafloor, and therefore represent waves that were still increasing in wave height due to wind energy input. Since winds are continually adding energy to the waves as they propagate across the shallow bay system, the actual wave energy dissipated by the seafloor and seagrass canopy is likely greater than these wave attenuation coefficients suggest.
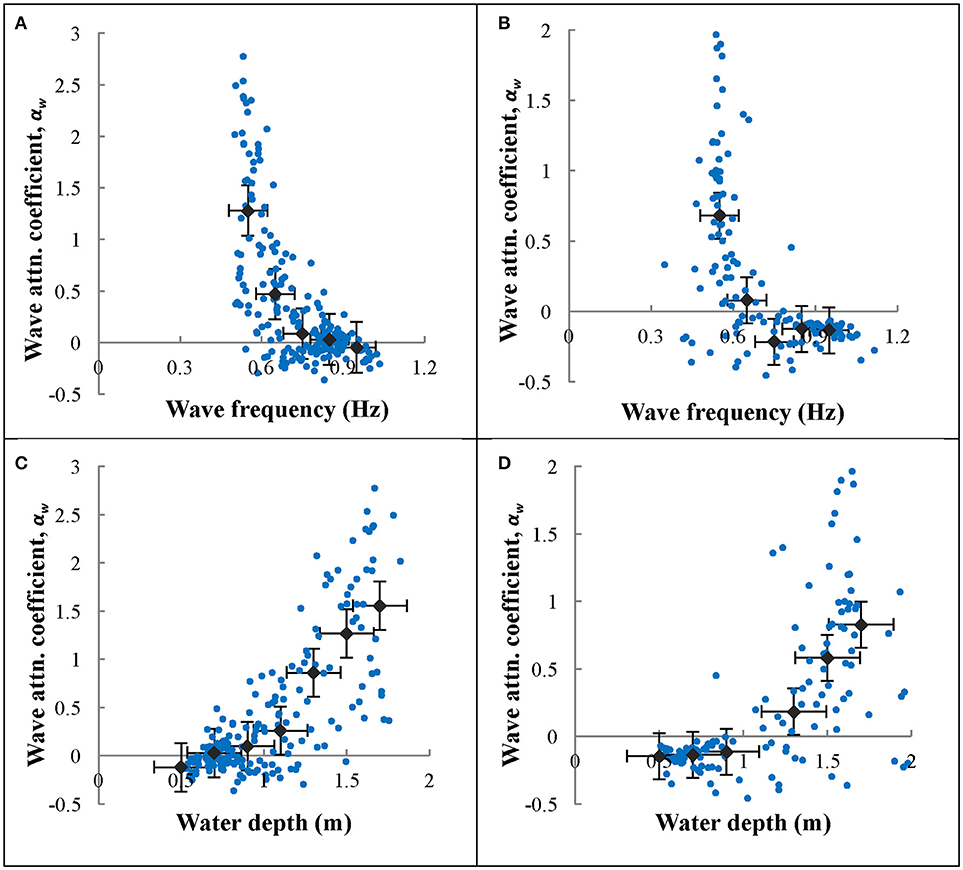
Figure 5. Wave frequency vs. wave attenuation coefficient (αw) for north winds during (A) summer 2012 and (B) winter 2013. Raw data are presented in green points. Data were averaged in 0.1 Hz bins and averages were plotted along with the raw data as gray diamonds. Water depth vs. wave attenuation coefficient (αw) for north winds during (C) summer 2012 and (D) winter 2013. Raw data are presented as purple points. Depth data were averaged in 0.01 m bins and plotted along with the raw data as gray diamonds. Means that had fewer than 10 data points in a bin were excluded from the plots. Error bars on the averaged data show standard error.
Wave attenuation increased with water depth (Figures 5C,D for summer 2012 and winter 2013, respectively), which was consistent across all seasons. Negative αw values for small wave heights, similar to described above for small frequency waves, were likely not interacting with the bottom, and therefore represent waves that were still growing in wave height. Larger significant wave heights generally resulted in increased wave attenuation coefficients (Figure 6), however the scatter in these data were greater than those of wave frequency vs. αw. Overall, there is a strong correlation between wave period and water depth in the seagrass meadow, as well as significant wave height and water depth (Figure 7). In general, these findings suggest that larger waves with longer wave periods can form when the water is deeper, and because of this wave orbitals penetrate deeper in to the water column and interact with the seagrass and seafloor to a greater extent. Although not directly computed, the wavelength, L, can be calculated according to linear wave theory for intermediate waves as: , where . This relationship suggests that with increases in wave period, waves with longer wavelengths also form in South Bay, and therefore increased wave attenuation occurs with larger wavelengths.
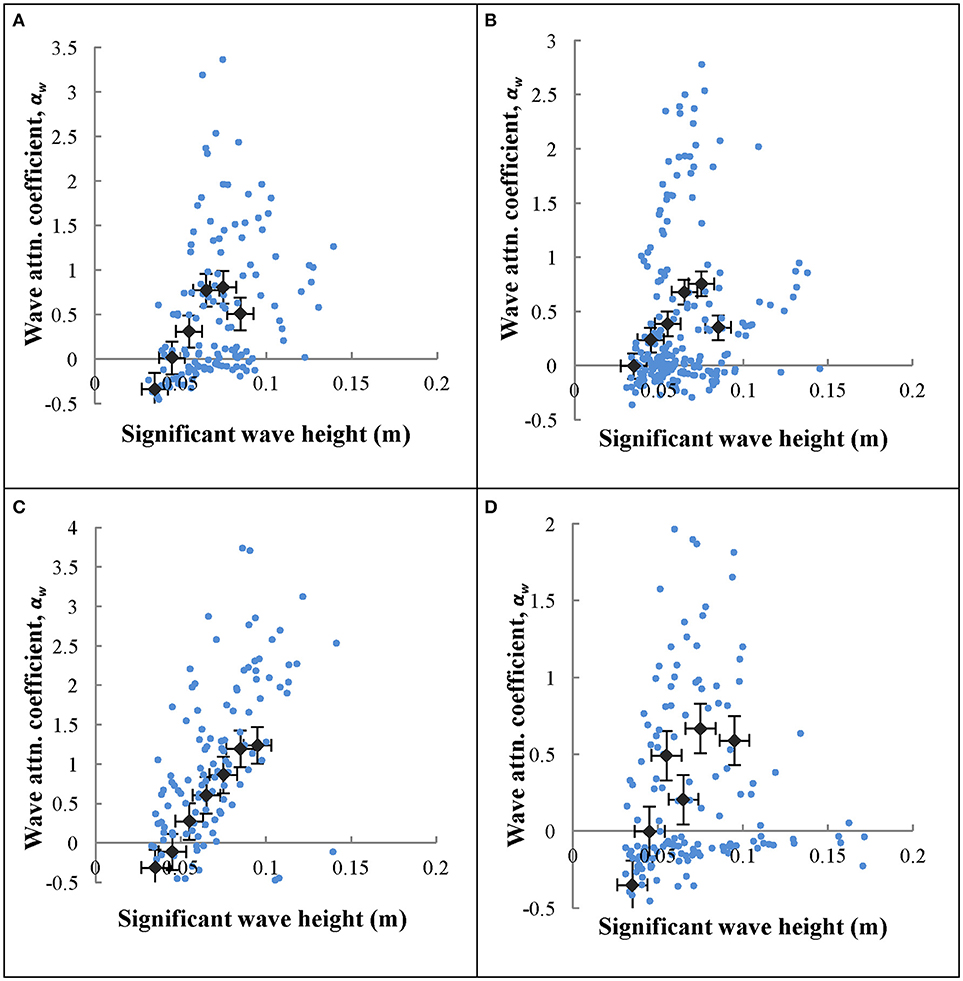
Figure 6. Significant wave height (Hs) vs. wave attenuation coefficient (αw) for north winds across (A) April 2012, (B) July 2012, (C) October 2012, (D) January 2013. Wave height data were averaged in 0.01 m bins and plotted along with the raw data as gray diamonds. Bins that had fewer than 10 data points were excluded. Error bars indicate standard error.
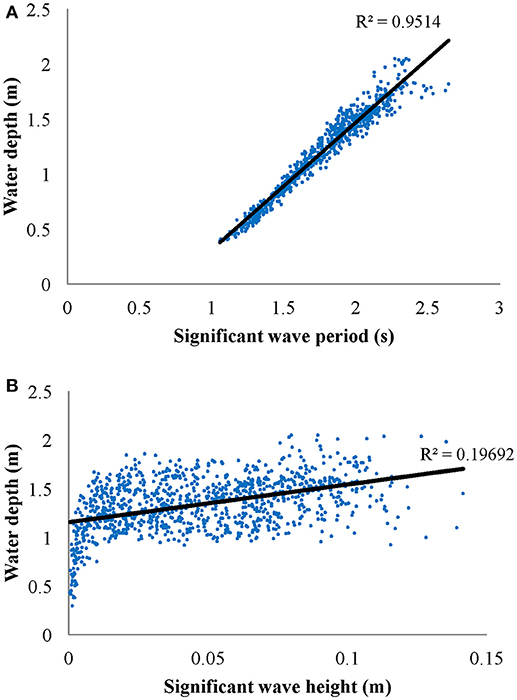
Figure 7. (A) Significant wave period (s) vs. water depth (m) for waves with significant wave height >5 cm and (B) significant wave height (m) vs. water depth (m) for significant wave period <5 s. Data is from October 2012 recorded at the Center site.
Comparison to Young and Verhagen Wave Height Model
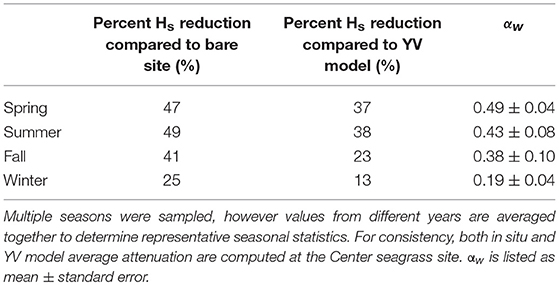
An empirical model developed by Young and Verhagen (1996) was utilized to predict significant wave height in South Bay as a function of wind speed, water depth, and fetch length, assuming an unvegetated seafloor composed of fine-grained sediments. Model accuracy was verified by comparing model output values of wave height to the measured values at the bare site. Although there is inherent variability in model performance over short timescales when comparing modeled vs. observed wave heights at the bare site (Figures 8A,B), when seasonally averaged the model both over- and under- predicted wave heights within ±15% of observed values (Table 3). This suggests reasonably good agreement and calibration of the model to wave dynamics in South Bay given uncertainty in water depth and bathymetry across the bare site, changes in wind direction that impact fetch length, and the likely presence of some small amounts vegetation at the bare site. Young and Verhagen (1996) do not report a grain size for the sediment used to calibrate their model, but describe the bottom as “relatively fine grained but cohesive mud” in which “the bed is not mobile and ripples do not develop.” This description is consistent with the fine-grained sediment in South Bay. Utilizing the same wind speed, water depth, and fetch length as that measured in South Bay, the difference between the model output and the recorded significant wave height was considered to represent the wave height attenuation caused by seagrass compared to a theoretical unvegetated site at the same physical location (Figures 8C,D). This comparison showed wave height attenuation caused by the seagrass of up to 44.8% at the Center site during summer, with minimum wave height attenuation of 12.3% during winter (Table 3). Seasonally averaged attenuation estimates from in situ measurements, model comparisons, and attenuation coefficients are summarized in Table 4.
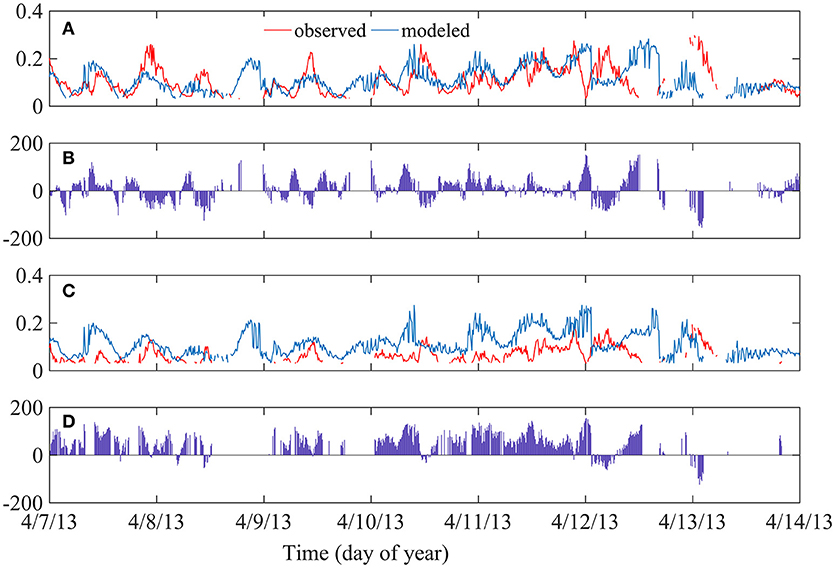
Figure 8. (A) Significant wave height comparison between Young and Verhagen model output (blue) and in situ observation values (red) at the unvegetated site during April 2013. (B) Time series of percent attenuation (difference) between measured and modeled wave height at the unvegetated site. Positive attenuation signifies modeled wave heights were greater than observed wave heights. (C) Wave height comparison between model output (blue) and observed values (red) at the Center seagrass site during April 2013. (D) Time series of percent attenuation between measured and modeled wave height at the seagrass site.

Table 3. Percent difference between observed significant wave heights and significant wave heights predicted by the Young and Verhagen (1996) model at each site for southward blowing winds, averaged across each season.
Bed Shear and Friction Velocity
Near bed velocity profiles were collected over a range of flow conditions in nine separate deployments at the bare and center seagrass site. Measurements within the seagrass bed were performed during summer 2012 and 2013 months when the meadow was near peak biomass, with blade densities of 347 ± 73 shoots/m2 and 411 ± 33 shoots/m2, respectively. Bare site measurements were conducted during fall 2012 and summer 2013. Significant wave height averages at the bare site ranged from 0 to 0.11 m, and Hs values between 0 m and 0.08 m at the seagrass site. These wave heights were relatively small, but encompassed the average Hs range of 0.02 to 0.09 m observed during seasonal deployments in South Bay. Within each deployment, data was collected over approximately 3–4 h. However, to determine the effects of hydrodynamics on near bed boundary layer flows, the deployments with greatest and least measured bed shear stress were selected from both the bare and vegetated site for further analysis (Table 5).

Table 5. Wave properties and environmental conditions for Vectrino profiler deployments with lowest and highest wave activity at the bare and vegetated site.
At the bare site, the time period with the lowest bed shear stress, τbed = 0.019 ± 0.008 Pa, was recorded in fall 2012. This time period coincided with essentially no wave activity, with mean velocities across the 1 h deployment of 3.9 cm s−1 at 0.5 cm above the bed and 4.8 cm s−1 at 2.5 cm above the bed. The time period of highest τbed = 0.07 ± 0.034 Pa occurred at peak wave conditions with Hs = 0.11 m. The critical shear stress for sediment resuspension in South Bay was previously found to be τcrit = 0.04 Pa with a D50 ≈ 63 μm and sorting coefficient (Lawson et al., 2007; Fagherazzi and Wiberg, 2009), suggesting that sediment resuspension was actively occurring during higher wave conditions. In contrast, at the seagrass site, the lowest measured τbed = 0.004 ± 0.003 Pa, while the highest was τbed = 0.034 ± 0.022 Pa which occurred during peak wave conditions of Hs = 0.08 m, suggesting that at no time during these summertime velocity measurements did the bed shear stress exceed τcrit to initiate sediment resuspension. These findings suggest the seagrass meadow does exert significant control over the hydrodynamic conditions at the sediment-water interface, and this control is due to the attenuation of wave motion by drag induced from the seagrass over the expanse of the meadow.
Discussion
This work presents several estimations of wave attenuation induced by a temperate Z. marina meadow across a range of seagrass density and morphologic variations. Wave height attenuation, both comparing a vegetated site to a bare site and comparing measured values to model predictions, showed large seasonal variations with the largest reduction occurring during spring and summer when the meadow was near peak density, and the lowest reduction during the winter (Table 4). Direct comparisons of wave heights showed reductions between 25 and 49% in the seagrass bed compared to an adjacent bare site. Results using the Young and Verhagen (1996) model showed similar seasonal trends, although model output consistently estimated less attenuation within the seagrass bed than direct in situ measurements would suggest. Seasonal estimates of wave heights predicted over the bare site using the YV model ranged between 12.7% lower and 14.7% greater than in situ wave heights (Table 3), with modeled significant wave heights being on average 5% greater than those measured in situ when averaged over annual timescales.
As expected, large variability in wave height attenuation was found within the seagrass canopy due to the seasonal variation in seagrass biomass, changes in water depth due to tidal fluctuations, and high variability in fetch length in response to changes in wind direction. Seagrass morphology varied from a minimum blade length of 19 ± 4 cm, blade width of 0.21 ± 0.04 cm, and shoot density of 100 ± 36 blades m−2 in winter, to peak blade length of 53 ± 8 cm, blade width of 0.41 ± 0.03 cm, and shoot density of 411 ± 33 blades m−2 in summer. Increased seagrass blade size and shoot density correlated directly with increased wave attenuation across the seagrass meadow.
The distance to the top of the seagrass bed, where waves will begin to feel drag, also decreases in the summer when the canopy is established with longer blades. For both the unvegetated and seagrass sites, wave theory predicts that waves with a wave frequency, will be attenuated before reaching the bottom (Wiberg and Sherwood, 2008). For the range of depths found within the seagrass meadow and bare site, oscillatory motion will generally not reach the seafloor for wave frequencies ≥1 Hz. Although high frequency waves may interact with the vegetation, and experience drag even when the wave motions are too small to reach the sea floor, our results (Figure 5) suggest that wave attenuation when wave frequencies ≥1 Hz is minor. The maximum αw value occurs at a wave frequency of approximately 0.55 Hz for every season, corresponding to a wave period of 1.8 s. The averaged αw value for this wave period is as high as 1.3 during summer, and drops to 0.7 during winter. This suggests that variability in the seagrass biomass with season is a dominant contributor to wave attenuation. Unlike wavelength and wave period, which provides a length- and time-scale of a wave and results in a clear relationship for when waves will interact with the sea floor, there is no theoretical relationship between wave height and when a wave of a certain height will experience bottom drag. However, there are theoretical limits to wave steepness, which define a maximum wave height for any given wave period (Dean and Dalrymple, 1991).
The relationship between water depth and wave attenuation coefficient first appears counterintuitive, showing an increase in αw at greater depths (Figure 5). Since waves in South Bay are locally generated, wave development is controlled by a combination of water depth, wind speed, and fetch length (Young and Verhagen, 1996). The shallow water depth essentially limits the development of large waves, causing overall smaller significant wave heights and wave periods at low tides, with relatively larger waves formed during high tide or during storm events when storm surge increases water depths. During these periods of increased water depths, longer period waves are formed which can then interact with the seafloor and seagrass, causing greater attenuation coefficients. Although attenuation coefficients were estimated only for significant wave height and period, there is a range of wave heights and frequencies formed at any given time within coastal bay system. Results of Bradley and Houser (2009) found that seagrasses serve as a low-pass filter, where higher frequencies in the spectra tend to be more attenuated. Their results suggest that the rate of energy dissipation is not uniform over a range of wave frequencies, and waves at higher frequencies are attenuated, but waves at lower frequencies are less affected by the seagrass.
Velocity measurements adjacent to the sediment-water interface showed substantial reduction in bed shear stresses within the seagrass meadow compared to the bare site. Within the bare site, τbed ranged from 0.019 to 0.07, while in the seagrass bed τbed ranged from 0.004 to 0.034 Pa. The critical stress threshold to initiate sediment resuspension was found to be τbed = 0.04 Pa (Lawson et al., 2007), suggesting that during summer, the seagrass canopy limits sediment from being suspended, although these measurements occurred over a limited time frame. The relative reduction of wave orbital motion caused by the canopy can be estimated using the ratio of wave orbital excursion length (A) to blade spacing (S), where A = uorb/ω, ω = 2π/T, and S as the characteristic spacing between shoots (Lowe et al., 2005). For A/S >1 orbital attenuation within the canopy is expected to be significant. Utilizing blade density and average blade width, blade spacing of the seagrass bed ranges from S = 8.2 cm in winter to 4.5 cm in summer, giving approximate estimates of A/S = 0.1 in winter to 0.2 in summer, assuming wave periods of T = 1.5 s and uorb = 2.9 cm s−1 (Table 5). This indicates that orbital motions are not significantly altered due to direct interaction with the seagrass blades and oscillatory water motion is able to effectively penetrate the seagrass canopy, even though tidally-driven flows may be damped. This finding is similar to laboratory measurements within a model Z. marina meadow (Luhar et al., 2010), where it was found that unidirectional flows were reduced within the meadow but in-canopy orbital velocities were not significantly altered.
Complex bathymetry within the coastal bay and barrier island system provided a wide variety of fetch lengths to consider. Due to this variability, only north winds within a 45° wind range around true north were analyzed. The Young and Verhagen (1996) model predicted wave heights greater than those measured within the seagrass meadow during all seasons, indicating that actual wave heights were reduced compared to estimates of wave heights that would occur across an unvegetated South Bay. Although of comparable magnitude, direct in situ measurements of reductions in significant wave heights compared to the bare site were greater than wave height reductions compared to estimates from YV model predictions (Table 3). This deviation between in situ and modeled wave heights was consistent across seasons. Wave heights measured within the seagrass bed during winter were closest to YV model results, with an average reduction of 13%. This also corresponded with the lowest measured meadow density was lowest.
Overall, the YV model predicted wave heights that were within ±15% of those directly measured at the bare site in South Bay. Variations in model output compared to direct in situ measurements of wave height could be the result of multiple influences, including the coarseness of fetch distances input to the model, discrepancies in the magnitude of winds that occurred over South Bay from measured winds, or due to variations in sediment properties. Mariotti and Fagherazzi (2013a) found that the Young and Verhagen (1996) model under-predicted wave heights in a study in Willapa Bay, Washington. They attributed this to an underestimation of fetch-limited wave growth to the smooth mud substrate in the bay, which they hypothesize induced less drag on the flow than the sediment used in the formulation of the YV model. They found that a low friction coefficient for the sediment was necessary to match the observed wave dynamics. This highlights the importance of drag on wave attenuation, as even small differences in sediment characteristics can have a measurable effect on wave height, even in the absence of vegetation. Young and Verhagen (1996) do not report a grain size for the sediment used to calibrate the model, but describe the bottom as fine grained but cohesive mud. While the sediment in South Bay is fine-grained (Hansen and Reidenbach, 2012), it may not be as cohesive, as it was easily resuspended. This discrepancy could result in higher bottom friction in South Bay, and would explain wave height over-prediction by the model.
Conclusion
A seagrass canopy within a shallow coastal bay was found to have a large impact on wave development, which varied seasonally in response to seagrass morphology and density. Although the largest wave attenuation compared to an adjacent bare site occurred in summer when seagrass biomass was greatest, the largest wave attenuation coefficient, measured as wave decay as waves propagated across the seagrass canopy, occurred in spring, with αw = 0.49. This discrepancy is likely due to the large impact that physical conditions, including water depth and wind magnitude, has on wave development and attenuation and signifies that a single mean attenuation coefficient should be used with caution. αw is highly variable with respect to water depth, wind speed, and seagrass biomass. During summer, Hansen and Reidenbach (2012) found a 45–70% reduction in wave height between a seagrass meadow and an unvegetated region in South Bay, with sites ranging from a seagrass density of 150 ± 80 shoots m−2 to 570 ± 70 shoots m−2. The average reduction in wave height compared to a bare site of ~50% for this study falls into this range, with summer densities of 347 ± 73 and 411 ± 33 shoots m−2. Comparing a wide range of wave conditions, bed shear stresses measured at the sediment water interface were statistically lower at the vegetated compared to the unvegetated site, even though scaling of wave motions in the presence of seagrass suggest that wave orbitals should be locally unaffected by the seagrass blades, with waves being able to penetrate through the canopy. Since substantial net attenuation of wave energy as waves propagate across the meadow was found, this suggests that the integrated meadow-scale fluid drag controls the apparent decrease in bed shear within seagrass meadows compared to an unvegetated seafloor.
Author Contributions
MR conceptualized the study. ET performed the experiments. MR and ET analyzed the data and wrote the manuscript.
Conflict of Interest Statement
The authors declare that the research was conducted in the absence of any commercial or financial relationships that could be construed as a potential conflict of interest.
Acknowledgments
We thank A. Schwarzschild, C. Buck, and D. Boyd for field assistance. This research was funded by the National Science Foundation (NSF-DEB 1237733) to the Virginia Coast Reserve Long Term Ecological Research program and by NSF-OCE 1151314 to MR.
References
Bradley, K., and Houser, C. (2009). Relative velocity of seagrass blades: implications for wave attenuation in low-energy environments. J. Geophys. Res. Earth Surf. 114, 1–13. doi: 10.1029/2007JF000951
Bretschneider, C. L. (1954). “Generation of wind waves over a shallow bottom,” in Beach Erosion Board Technical Memorandum No. 51, (U. S. Corps of Engineers), 1–24. doi: 10.21236/AD0046517
Bretschneider, C. L. (1958). “Revisions in wave forecasting: deep and shallow water,” in Proceedings of the 6th International Conference on Coastal Engineering, American Society of Civil Engineers (Fort Belvoir, VA), 30–67.
Bricker, J. D., Inagaki, S., and Monismith, S. G. (2005). Bed drag coefficient variability under wind waves in a tidal estuary. J. Hydraulic Eng. 131, 497–508. doi: 10.1061/(ASCE)0733-9429(2005)131:6(497)
Bricker, J. D., and Monismith, S. G. (2007). Spectral wave-turbulence decomposition. J. Atmos. Ocean Technol. 24, 1479–1487. doi: 10.1175/JTECH2066.1
Carr, J., D'odorico, P., Mcglathery, K., and Wiberg, P. (2010). Stability and bistability of seagrass ecosystems in shallow coastal lagoons: role of feedbacks with sediment resuspension and light attenuation. J. Geophys. Res. Biogeosci. 115:G03011. doi: 10.1029/2009JG001103
Carr, J. A., D'odorico, P., Mcglathery, K. J., and Wiberg, P. L. (2016). Spatially explicit feedbacks between seagrass meadow structure, sediment and light: habitat suitability for seagrass growth. Adv. Water Resour. 93, 315–325. doi: 10.1016/j.advwatres.2015.09.001
Chen, S. N., Sanford, L. P., Koch, E., Shi, F., and North, E. W. (2007). A nearshore model to investigate the effects of seagrass bed geometry on wave attenuation and suspended sediment transort. Estuar. Coasts 30, 296–310. doi: 10.1007/BF02700172
Dean, R. G., and Dalrymple, R. A. (1991). Water Wave Mechanics for Engineers and Scientists. Singapore: World Scientific. doi: 10.1142/1232
Denny, M. W. (1988). Biology and the Mechanics of the Wave-Swept Environment. Princeton, NJ: Princeton University Press.
Fagherazzi, S., and Wiberg, P. (2009). Importance of wind conditions, fetch, and water levels on wave-generated shear stresses in shallow intertidal basins. J. Geophys. Res. 114:F03022. doi: 10.1029/2008JF001139
Fonseca, M. S., and Cahalan, J. A. (1992). A preliminary evaluation of wave attenuation by four species of seagrass. Estuar. Coast. Shelf Sci. 35, 565–576. doi: 10.1016/S0272-7714(05)80039-3
Gacia, E., and Duarte, C. M. (2001). Sediment retention by a Mediteranean Posidonia oceanica meadow: the balance between deposition and resuspension. Estuar. Coast. Shelf Sci. 52, 505–514. doi: 10.1006/ecss.2000.0753
Grant, W. D., and Madsen, O. S. (1979). Combined wave and current interaction with a rough bottom. J. Geophys. Res. 84, 1797–1808. doi: 10.1029/JC084iC04p01797
Hansen, J. C., and Reidenbach, M. A. (2013). Seasonal growth and senescence of a Zostera marina seagrass meadow alters wave-dominated flow and sediment suspension within a coastal bay. Estuar. Coasts 36, 1099–1114. doi: 10.1007/s12237-013-9620-5
Hansen, J. C., and Reidenbach, M. A. (2017). Turbulent mixing and fluid transport within Florida Bay seagrass meadows. Adv. Water Resour. 108, 205–215. doi: 10.1016/j.advwatres.2017.08.001
Hansen, J. C. R., and Reidenbach, M. A. (2012). Wave and tidally driven flows in eelgrass beds and their effect on sediment suspension. Mar. Ecol. Prog. Ser. 448, 271–287. doi: 10.3354/meps09225
Houser, C., Trimble, S., and Morales, B. (2015). Influence of blade flexibility on the drag coefficient of aquatic vegetation. Estuar. Coasts 38, 569–577. doi: 10.1007/s12237-014-9840-3
Jing, L., and Ridd, P. V. (1996). Wave-current bottom shear stresses and sediment resuspension in Cleveland Bay, Australia. Coast. Eng. 29, 169–186. doi: 10.1016/S0378-3839(96)00023-3
Jonsson, I. G. (1967). “Wave boundary layers and friction factors,” in Proceedings of the 10th Annual Coastal Engineering Conference (New York, NY), 127–148.
Koch, E., and Gust, G. (1999). Water flow in tide- and wave-dominated beds of the seagrass Thalassia testudinum. Mar. Ecol. Prog. Ser. 184, 63–72. doi: 10.3354/meps184063
Lacy, J. R., and Wyllie-Echeverria, S. (2011). The influence of current speed and vegetation density on flow structure in two macrotidal eelgrass canopies. Limnol. Oceanogr. Fluids Environ. 1, 38–55. doi: 10.1215/21573698-1152489
Lawson, S. E., Wiberg, P. L., Mcglatherty, K. J., and Fugate, D. C. (2007). Wind-driven sediment suspension controls light availability in a shallow coastal lagoon. Estuar. Coasts 30, 102–112. doi: 10.1007/BF02782971
Lowe, R. J., Falter, J. L., Bandet, M. D., Pawlak, G., Atkinson, M. J., Monismith, S. G., et al. (2005). Spectral wave dissipation over a barrier coral reef. J. Geophys. Res. Oceans 110, 5–20. doi: 10.1029/2004JC002711
Lowe, R. J., Falter, J. L., Koseff, J. R., Monismith, S. G., and Atkinson, M. J. (2007). Spectral wave flow attenuation within submerged canopies: Implications for wave energy dissipation. J. Geophys. Res. 112:C05018. doi: 10.1029/2006JC003605
Luhar, M., Coutu, S., Infantes, E., Fox, S., and Nepf, H. (2010). Wave-induced velocities inside a model seagrass bed. J. Geophys. Res. Oceans 115:C12005. doi: 10.1029/2010JC006345
Luhar, M., Infantes, E., and Nepf, H. (2017). Seagrass blade motion under waves and its impact on wave decay. J. Geophys. Res. Oceans 122, 3736–3752. doi: 10.1002/2017JC012731
Mariotti, G., and Fagherazzi, S. (2013a). Wind waves on a mudflat: the influence of fetch and depth on bed shear stresses. Cont. Shelf Res. 60, S99–S110. doi: 10.1016/j.csr.2012.03.001
Mariotti, G., and Fagherazzi, S. (2013b). Critical width of tidal flats triggers marsh collapse in the absence of sea-level rise. Proc. Natl. Acad. Sci. U.S.A. 110, 5353–5356. doi: 10.1073/pnas.1219600110
Mazda, Y., Magi, M., Kogo, M., and Hong, P. N. (1997). Mangroves as a coastal protection from waves in the Tong King delta, Vietnam. Mangroves Salt Marsh. 1, 127–135. doi: 10.1023/A:1009928003700
McGlathery, K. (2017). “Above- and below-ground biomass and canopy height of seagrass in Hog Island Bay and South Bay, VA 2007–2017,” in Virginia Coast Reserve Long-Term Ecological Research Project Data Publication knb-lter-vcr.183.17 (Oyster, VA). doi: 10.6073/pasta/09a0ce35bb3fc72113b5a16ad5b0d6bd
Mcloughlin, S. M., Wiberg, P. L., Safak, I., and Mcglathery, K. J. (2015). Rates and forcing of marsh edge erosion in a shallow coastal bay. Estuar. Coasts 38, 620–638. doi: 10.1007/s12237-014-9841-2
Nepf, H. M. (1999). Drag, turbulence, and diffusion in flow through emergent vegetation. Water Resour. Res. 35, 479–489. doi: 10.1029/1998WR900069
Orth, R., Moore, K., Marion, S., Wilcox, D., and Parrish, D. (2012). Seed addition facilitates eelgrass recovery in a coastal bay system. Mar. Ecol. Prog. Ser. 448, 177–195. doi: 10.3354/meps09522
Paul, M., and Amos, C. (2011). Spatial and seasonal variation in wave attenuation over Zostera noltii. J. Geophys. Res. Oceans 116:C08019. doi: 10.1029/2010JC006797
Paul, M., Bouma, T. J., and Amos, C. L. (2012). Wave attenuation by submerged vegetation: combining the effect of organism traits and tidal current. Mar. Ecol. Prog. Ser. 444, 31–41. doi: 10.3354/meps09489
Porter, J., Krovetz, D., Nuttle, W., and Spitler, J. (2018). “Hourly Meteorological Data for the Virginia Coast Reserve LTER 1989-present,” in Virginia Coast Reserve Long-Term Ecological Research Project Data Publication knb-lter-vcr.25.37 (Oyster, VA). doi: 10.6073/pasta/c87febba463a3ac63a64bdb484a197ce
Quartel, S., Kroon, A., Augustinus, P., Van Santen, P., and Tri, N. (2007). Wave attenuation in coastal mangroves in the Red River Delta, Vietnam. J. Asian Earth Sci. 29, 576–584. doi: 10.1016/j.jseaes.2006.05.008
Reidenbach, M. A., Monismith, S. G., Koseff, J. R., Yahel, G., and Genin, A. (2006). Boundary layer turbulence and flow structure over a fringing coral reef. Limnol. Oceanogr. 51, 1956–1968. doi: 10.4319/lo.2006.51.5.1956
Rippeth, T. P., Williams, E., and Simpson, J. H. (2002). Reynolds stress and turbulent energy production in a tidal channel. J. Phys. Oceanogr. 32, 1242–1251. doi: 10.1175/1520-0485(2002)032<1242:RSATEP>2.0.CO;2
Soulsby, R. L., and Dyer, K. R. (1981). The form of the near-bed velocity profile in a tidally accelerating flow. J. Geophys. Res. 81, 8067–8073. doi: 10.1029/JC086iC09p08067
Stocking, J. B., Rippe, J. P., and Reidenbach, M. A. (2016). Structure and dynamics of turbulent boundary layer flow over healthy and algae-covered corals. Coral Reefs 35, 1047–1059. doi: 10.1007/s00338-016-1446-8
Thomas, E., and Reidenbach, M. A. (2015). “Wave height and period in South Bay, VA 2011-2013,” in Virginia Coast Reserve Long-Term Ecological Research Project Data Publication knb-lter-vcr.235.3 (Oyster, VA). doi: 10.6073/pasta/8c1ce06a10283e3eb444111970674075
Weitzman, J. S., Zeller, R. B., Thomas, F. I., and Koseff, J. R. (2015). The attenuation of current-and wave-driven flow within submerged multispecific vegetative canopies. Limnol. Oceanogr. 60, 1855–1874. doi: 10.1002/lno.10121
Wiberg, P., and Smith, J. D. (1983). A comparison of field data and theoretical models for wave current interactions at the bed on the continental shelf. Cont. Shelf Res. 2, 147–162. doi: 10.1016/0278-4343(83)90013-4
Wiberg, P. L., and Sherwood, C. R. (2008). Calculating wave-generated bottom orbital velocities from surface-wave parameters. Comput. Geosci. 34, 1243–1262. doi: 10.1016/j.cageo.2008.02.010
Young, I., and Verhagen, L. (1996). The growth of fetch limited waves in water of finite depth. Part 1. Total energy and peak frequency. Coast. Eng. 29, 47–78. doi: 10.1016/S0378-3839(96)00006-3
Keywords: seagrass, waves, attenuation, turbulence, shear, canopy flow
Citation: Reidenbach MA and Thomas EL (2018) Influence of the Seagrass, Zostera marina, on Wave Attenuation and Bed Shear Stress Within a Shallow Coastal Bay. Front. Mar. Sci. 5:397. doi: 10.3389/fmars.2018.00397
Received: 29 March 2018; Accepted: 09 October 2018;
Published: 26 October 2018.
Edited by:
François G. Schmitt, Laboratoire d'Océanologie et de Géosciences-UMR 8187 LOG, Centre National de la Recherche Scientifique (CNRS), FranceReviewed by:
Alejandro Orfila, Instituto Mediterráneo de Estudios Avanzados (IMEDEA), SpainIan Townend, University of Southampton, United Kingdom
Copyright © 2018 Reidenbach and Thomas. This is an open-access article distributed under the terms of the Creative Commons Attribution License (CC BY). The use, distribution or reproduction in other forums is permitted, provided the original author(s) and the copyright owner(s) are credited and that the original publication in this journal is cited, in accordance with accepted academic practice. No use, distribution or reproduction is permitted which does not comply with these terms.
*Correspondence: Matthew A. Reidenbach, cmVpZGVuYmFjaEB2aXJnaW5pYS5lZHU=
 Matthew A. Reidenbach
 Emily L. Thomas