
94% of researchers rate our articles as excellent or good
Learn more about the work of our research integrity team to safeguard the quality of each article we publish.
Find out more
ORIGINAL RESEARCH article
Front. Mar. Sci. , 10 July 2018
Sec. Marine Biogeochemistry
Volume 5 - 2018 | https://doi.org/10.3389/fmars.2018.00235
This article is part of the Research Topic Phosphorus Along the Soil-Freshwater-Ocean Continuum View all 13 articles
Temporal variability in dissolved inorganic, organic phosphate (Pi, DOP) and particulate phosphorus (PPO4) concentrations, and microbial utilization of Pi and dissolved adenosine-5′-triphosphate (DATP) was studied at Station ALOHA (22.75°N, 158°W) in the North Pacific Subtropical Gyre (NPSG) over a multi-year period. Spatial variability of the same properties was investigated along two transects, to and from Hawaii, that traversed the NPSG boundaries to the east (2014) and north (2016). Radiotracer techniques were employed to measure the turnover time of Pi and DATP pools to calculate Pi uptake rates and the Pi hydrolysis rates of DATP. Pi concentrations were more variable, both in time and space, than DOP, ranging two orders of magnitude compared to a factor of two for DOP. The DATP pool, while constituting on average <0.15% of the total DOP-P, was as dynamic as Pi (~1–200 pmol l−1), with lowest concentrations coinciding with Pi depletion. The Pi turnover times ranged from a few hours to several weeks, and were correlated with measured Pi concentrations (r = 0.9; Station ALOHA, n = 28; 2014, n = 14; 2016, n = 12). Pi uptake rates averaged 3.6 ± 1.3 nmol-P l−1 d−1 (n = 28: Station ALOHA), 9.2 ± 4.7 nmol-P l−1 d−1, (n = 15; 2014) and 5.1 ± 2.5 nmol-P l−1 d−1, (n = 12; 2016). The turnover time of the DATP pool was typically substantially shorter (0.4–5 days) than for the Pi-pool, and uptake rates ranged from 1 to 115 pmol l−1 d−1. However, at very low Pi and ATP concentrations, ATP turnover was longer than Pi turnover and ATP uptake rates lower. Total ATP hydrolysis was high along both transects, exceeding the ATP taken up by the microbial community, resulting in a net release of Pi into the ambient seawater. This net release was positively correlated to Pi concentration. The relative contribution by microbial size classes to total P-uptake depended on whether P was derived from ambient Pi or from DATP, with the <0.6>0.2 μm size class dominating the DATP uptake. Our results indicate that during Pi limiting conditions, regenerated P is rapidly consumed, and that Pi limitation occurs locally and transiently but does not appear to be the predominant condition in the upper water column of the NPSG.
Phosphorus (P) is essential for all life and is a key component of nucleic acids, cell membrane lipids and in biological energetic processes via e.g., adenosine-5′-triphosphate (ATP). Inorganic phosphate (Pi) is frequently at very low concentrations in aquatic environments and although the bioavailability of nitrogen (N) appears to be a proximately limiting resource for primary producers in marine ecosystems, P is believed to be the ultimately limiting macronutrient over geological time scales (Falkowski, 1997; Tyrell, 1999). Within the North Pacific Subtropical Gyre (NPSG) inorganic pools of P and N are generally at much lower concentrations than their respective dissolved organic pools (DOP, DON; Karl et al., 2001b), indicative of their preferential exploitation by the microbial community. The utilization of the DOP pool, at least during times of Pi-stress or limitation, should constitute a reservoir or buffer for P. Several studies have shown that microorganisms in marine environments do utilize the DOP both during P stress and under P-replete conditions in nature (Björkman and Karl, 2003; Mather et al., 2008; Lomas et al., 2010; Duhamel et al., 2011, 2017). However, the DOP pool is chemically diverse and still only partially characterized, but consists predominantly of phosphate esters and a substantial amount of phosphonates (Clark et al., 1998; Kolowith et al., 2001; Karl and Björkman, 2015; Repeta et al., 2016). Among the most commonly studied DOP compounds is ATP. ATP has several advantages as a “model” compound, among them that it is available in different radiolabeled forms. This makes it possible to discern preferential uptake of subcomponents of the molecule, and importantly, it is possible to measure its ambient particulate and dissolved concentrations (Bossard and Karl, 1986; Ammerman and Azam, 1991a; Björkman and Karl, 2001) and to follow its utilization by the microbial community (Casey et al., 2009; Björkman et al., 2012). Although ATP may only be a small portion, and not necessarily representative of the average DOP pool constituents, getting a clearer assessment of its flux through the different P-pools will aid in elucidating the behavior of the bioavailable DOP.
In this study we compare temporal and spatial variabilities in the utilization of Pi and ATP by the surface ocean microbial community, as a function of Pi, DOP and dissolved ATP (DATP) concentrations. Radiotracer techniques were used to determine the turnover times of the Pi or ATP pools respectively, as well as the Pi hydrolysis rates from the DATP pool. The temporal study was conducted at or near Station ALOHA (22.75°N, 158°W) in the North Pacific Subtropical Gyre (NPSG) over a multi-year period (2005–2015). The spatial variability in these same properties was investigated during an August-September 2014 zonal transect from California to Hawaii, and an April–May 2016 meridional transect from Hawaii to approximately 36°N along longitude 158°W. This is, to our knowledge, the first time that all the above P-pools and accompanying rates of utilization have been measured in concert within the oligotrophic oceans.
Sampling for rate measurements was conducted at, or near, Station ALOHA (22.75°N, 158.00°W) on several Hawaii Ocean Time-series (HOT), or Center for Microbial Oceanography: Research and Education (C-MORE) expeditions during an 11-year time-period from 2005 to 2015. In the late summer/early fall season of 2014 (18 Aug−16 Sep, 2014), a northeast to southwest (hereafter; zonal) transect cruise was conducted onboard the R/V New Horizon (NH1417: Nitrogen Effects on MicroOrganisms—NEMO) originating in San Diego, CA and terminating in Honolulu, HI. This transect cruise occupied 128 stations with near daily samplings for P concentrations, P-utilization experiments and primary productivity (n = 26, 20, and 25 respectively; Table 1,Figure 1), providing an opportunity to assess spatial variability of the inorganic and organic P dynamics over a larger area to complement the temporal investigations at or around Station ALOHA. In the spring of 2016 (April 19–May 4), a meridional cruise onboard the R/V Kaimikai-O-Kanaloa (KOK 1606: SCOPE—Gradients Cruise I), originating and ending in Honolulu, HI, occupied 14 stations between 23°N and 38°N along longitude 158°W, from within the NPSG into the transition zone toward sub-polar waters. Twelve stations were sampled during the meridional transect and comprised the same suite of measurements as the NH1417 cruise but investigated a different region and season than the earlier zonal transect (Table 1,Figure 1).
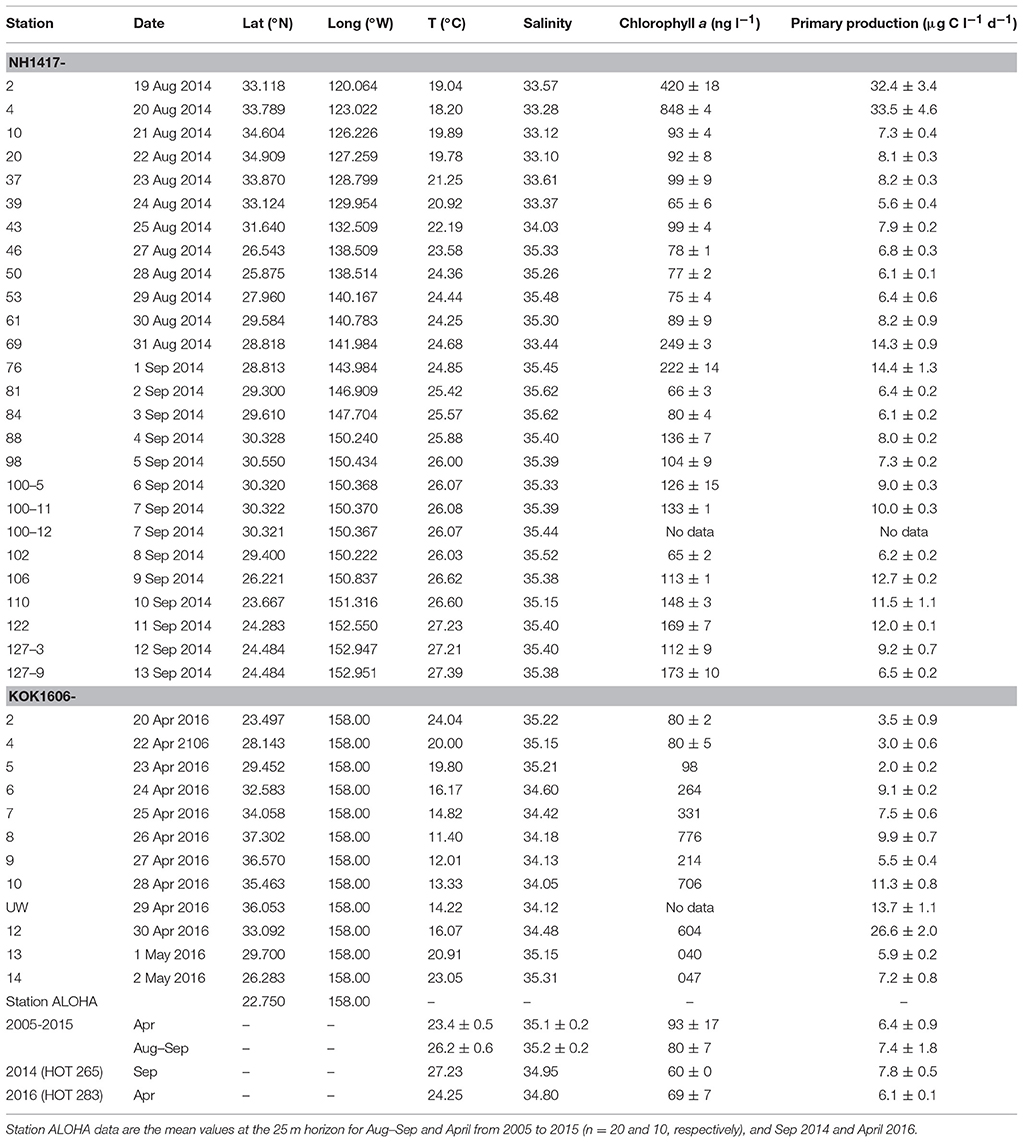
Table 1. Station number, date sampled, location co-ordinates (latitude [Lat], longitude [Long]), temperature (T; °C), salinity (PSS), chlorophyll a concentrations (ng l−1), and 14C-primary production (μg C l−1 d−1), at 25 m during the 2014 zonal transect and 15 m during the 2016 meridional transect.
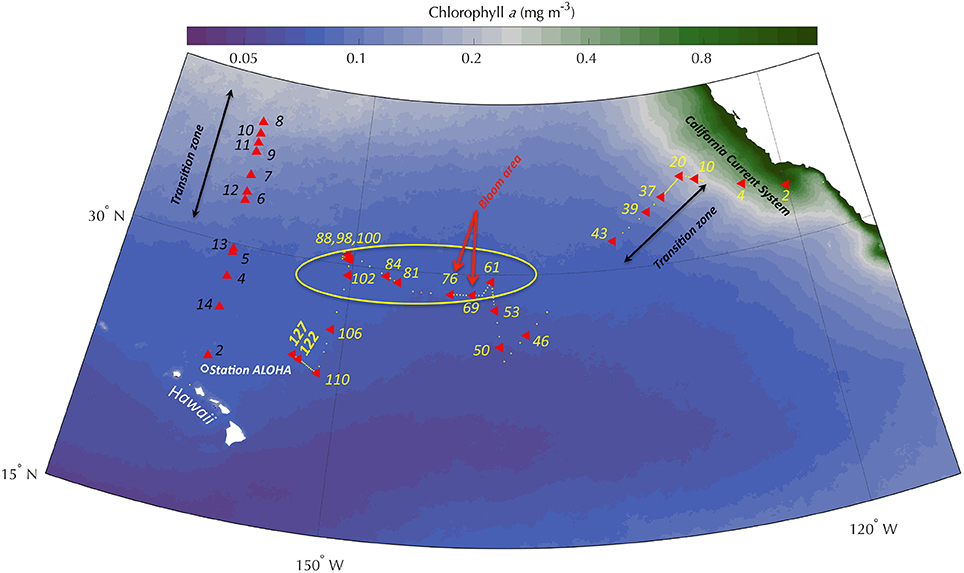
Figure 1. Map over study area in the North Pacific Ocean showing a multiyear composite of chlorophyll a concentrations in the surface waters (OCI algorithm, MODIS; Aqua, 9 km resolution) and the station locations for the zonal transect from San Diego, CA to Honolulu, HI in August-September of 2014, and the meridional transect from Honolulu to approximately 37°N along the 158°W longitude and back in April-May 2016. Station ALOHA (white circle) located at 22.75°N, 158.00°W and is the site for the Hawaii Ocean Time-series (HOT). The zonal transect occupied 127 stations (yellow bullets) of which 20 stations where phosphorus (Pi, ATP) rate experiments were conducted, including two additional stations for 14C-primary production (red triangles; yellow station numbers). Circled is the area along the 30°N meridian where Pi was depleted during the 2014 cruise. Note that Stations 88, 98, and 100 overlap in the figure, but were separated by 8–18 nmiles; the stations closest in space were separated in time by 3 days. The meridional transect (red triangles; black station numbers) occupied 14 stations of which 12 were sampled for P experiments and 14C-primary production. (Zonal transect: California Current System [CCS] – Stns 1–4; Transition zone [TZ] – Stns 5–43; North Pacific Subtropical Gyre [NPSG] – Stns 46–127: Meridional transect NPSG – Stns 2–5 and 13–14; TZ – Stns 6–12).
Water samples were collected using polyvinyl chloride (PVC) Niskin®-type bottles mounted on a 24-place rosette frame, equipped with conductivity, temperature and pressure (CTD) sensors. In addition to the parameters measured with the environmental sensors, discrete seawater samples were also collected. These included samples for soluble reactive phosphate (hereafter called inorganic phosphate [Pi]), total dissolved phosphorus (TDP), particulate P (PPO4), DATP and chlorophyll a. With the exception of DATP samples, which were pre-filtered through a 0.2 μm polycarbonate filter, the sample collections and subsequent analyses were performed according to the HOT standard protocols for the temporal data collected at HOT (hahana.soest.hawaii.edu/hot/methods/) with slight modifications during the transect cruises. In brief, for chlorophyll a determinations, seawater (150 ml to 2 l) was filtered through a glass fiber filter (GF/F; Whatman) and the filter extracted in 5 ml of 100% acetone. The samples were extracted for 1–7 days at −20°C in the dark prior to fluorometric analysis (Turner Designs; model 10-AU, or TD700). Samples for nutrient concentrations were collected into acid washed, deionized water and sample rinsed, high-density polyethylene bottles, stored upright and frozen (−20°C) until analyzed (Dore et al., 1996).
The Pi concentrations were measured using the MAGnesium Induced Co-precipitation technique (MAGIC; Karl and Tien, 1992), followed by standard colorimetric assays (Murphy and Riley, 1962) using a 10 cm cuvette cell (Beckman DU 640 spectrophotometer). The Pi samples were treated to reduce arsenate to arsenite to eliminate cross reactivity with the molybdenum blue complex (Johnson, 1971). The analytical precision of this method is ± 1 nmol l−1 with a detection limit (DL) of ≤ 3 nmol l−1, using the definition of DL = 3 x the standard deviation (s.d.) of the analytical precision. TDP was analyzed by the wet persulfate/high temperature oxidation method (Menzel and Corwin, 1965) followed by MAGIC and the standard Pi colorimetric assay. TDP measurements have an analytical precision of ± 5 nmol l−1. DOP was calculated as the difference between TDP and Pi concentrations in paired samples. DATP concentrations were determined as described in Björkman and Karl (2001) which is based on the co-precipitation of ATP with brucite, based on the same principal as the MAGIC method used for Pi, allowing DATP to be concentrated from seawater before analysis using firefly bioluminescence. Modifications from the original protocol were made to sample volume and concentration factors as follow; triplicate 50 ml subsamples from each field sample were amended with 250 μl 1 N NaOH, mixed and centrifuged at 1,000 × g for 60 min. The supernatant was carefully aspirated and the pellet dissolved with 50 μl 2.5 N HCl, followed by the addition of 250 μl of deionized water. Prior to analyses the sample was mixed with an equal volume of Tris buffer (pH 7.4, Sigma-Aldrich T7693). Samples for the calibration curve were made in surface seawater with the additions of known amounts of ATP and treated as samples. Blanks were made from surface seawater samples without ATP additions and treated with apyrase to hydrolyze any ATP in the sample (Sigma-Aldrich #A6132; stock 10 units ml−1, 10 μl per sample:Tris mix). The DL for this assay is 9 pmol DATP l−1, with the precision of ± 3 pmol l−1. Data averaged from multiple observations are presented as the mean ± s.d., (n = x) where x is the number of observations. Station ALOHA core data presented here were obtained from the publicly available HOT data archive; HOT Data Organization and Graphical System (HOT-DOGS: http://hahana.soest.hawaii.edu/hot/hot-dogs/).
Seawater was collected into acid washed, deionized water and sample rinsed, clear polycarbonate (PC) incubation bottles (Nalgene: 75–250 ml). All data presented in this study for Station ALOHA and NH1417 were collected from 25 m, and from 15 m during KOK1606. The samples were spiked with tracer amounts of either 32P or 33P orthophosphate (MP Biomedicals # 064014L, Perkin-Elmer #NEZ08000; carrier free) or ATP labeled at the gamma position with either 32P or 33P (MP Biomedicals # 01350200, Perkin-Elmer NEG302H00; specific activity 111 TBq mmol−1). The final radioactivity of the samples typically ranged from 0.1 to 1 MBq l−1 depending on experiment. The bottles were incubated in on-deck incubators, cooled with running, surface seawater and shielded with blue plexiglass (Arkema #2069) to achieve the approximate light level and spectral quality of the depth from which the sample water had been collected. The incubation time varied depending on location and expectancy of the rates, but all incubations were conducted during daytime. Experiments were typically performed as time-course incubations with 3–5 sampling events over a 3–6 h period. A subsample (0.1–0.5 ml) was collected from each incubation bottle to measure the total radioactivity added. Particulate activity was determined by filtering a 5–10 ml aliquot through a 0.2 μm pore size polycarbonate membrane filter (Nuclepore). Polycarbonate filters of 0.6 and 2 μm pore sizes were also included on occasion at Station ALOHA, and at all stations sampled along the two transects, to assess the relative size class contribution to community Pi or DATP pool turnover. The filters were rinsed with 3 × 2 ml of filtered seawater to remove unincorporated radioactivity, placed into a 7 ml plastic scintillation vial (Simport) and 4 ml of scintillation cocktail (Ultima Gold LLT, Perkin Elmer) added. Radioactivity was measured using a liquid scintillation counter (Perkin-Elmer, LSC 2910TR). Data were corrected for activity loss during the counting process due to decay of the short-lived isotopes. Measurements for primary productivity were performed in conjunction with the P-incubation experiments on both transect cruises. Primary productivity was determined by the 14C-bicarbonate assay (14C-PP) using 75 ml PC-bottles, spiked with 14C-bicarbonate (MP Biomedicals 117441H) to a final radioactivity of approximately 7.4 MBq l−1.
During the 2014 and 2016 transect cruises, and at Station ALOHA in 2013, the total hydrolysis rates of DATP were assessed from the 33P-ATP incubation experiments. The protocol used was modified from Ammerman and Azam (1991b). The filtrate from the 0.2 μm filter fraction was collected during the time course incubations. Triplicate 1 ml aliquots from each sample were placed into micro-centrifuge tubes and mixed with 0.2 ml activated charcoal slurry (20 mg charcoal ml−1 in 0.03 N sulfuric acid: The activated charcoal selectively binds organic molecules, such as DATP, while Pi will remain in solution. This allows for the separation of hydrolyzed 33P-Pi from 33P-DATP). The samples were thoroughly mixed by vortex and centrifuged for 15 min at 20,800 × g. A subsample (0.75 ml) of the supernatant was placed into a scintillation vial for radioactivity counting. DATP hydrolysis was measured from the increase of radioactivity over time in the supernatant, indicating that Pi had been cleaved from ATP and released into the ambient seawater, i.e., Pi regenerated from DATP. Total DATP hydrolysis was calculated as the sum of the particulate activity retained on the 0.2 μm filters (i.e., P from DATP taken up by microbes, hereafter; PATP) and the regenerated, non-incorporated 33Pi from 33P-DATP in the charcoal extractions. All rates were based on time course sampling and the rates determined through linear regression over time.
During the 2014 transect at station 100 (30.32°N, 150.38°W), an additional experiment was conducted to assess the kinetic response to increasing concentrations of Pi. Very short Pi-pool turnover times were measured at this location and were presumed to be due to low ambient concentrations of Pi (this was later confirmed by chemical analysis). Seawater samples were amended with non-radioactive Pi to target additions of 0, 5, 10, 25, 50, 75, 100, and 200 nmol Pi l−1. A subsample from each concentration step was placed into PC incubation bottles, spiked with 33P-Pi, incubated and sampled as described above. A separate set of incubation bottles, amended with 0, 25, 50, and 100 nmol Pi l−1, was spiked with 33P-ATP. The remaining seawater was stored frozen (−20°C) for later analysis of Pi concentrations. Time-course sampling was conducted for the three lowest P concentrations at 5, 25, 75, and 150 min of spiking with 33P-Pi. Incubations receiving 25 nmol Pi l−1 or above, and the 33P-ATP spiked samples, were sub-sampled in triplicate after approximately 3 h of incubation.
The Pi or ATP uptake rates and turnover times in days (TOT, d) were calculated as follows: TOT(d) = t/r where t is the total radioactivity added (Bq l−1) and r is the rate of radiolabel uptake into the particulate fraction (Bq l−1 d−1). The rate was determined from linear regression of the incubation time and radioactivity of the filters from the time course experiments. This calculation assumes that the specific activity of the substrate pool is constant during the incubation period. In our experiments <10% of the radiolabel was taken up during the incubation time, with the exception of the samples from stations 88 (30.33°N, 150.24°W) and 100 (30.32°N, 150.38°W) along the 2014 transect. At station 88; >80% of the radiolabel was taken up by 80 min and at station 100; ~40% was captured on the filters after 75 min. At such high proportions of the radiolabel taken up, the calculated uptake rate will be biased as a result of recycling, and may lead to underestimates of the actual rate of uptake. However, the finer time-course resolution and additions of Pi at station 100 allowed for the determination of rates at this station (see above Kinetic Pi rate experiment). In this experiment we also calculated the kinetic parameters Vmax and Km for the maximum uptake rate and half saturation constant, respectively, using Hanes-Woolf linear transformation of the data. This transformation uses the substrate concentration (S) and uptake velocity (V) to derive Vmax and Km as follows: S/V = (1/Vmax) × S +Vmax/Km. Here S/V is the measured TOT in our incubations, the slope of the linear regression is 1/Vmax, and the y-intercept is Vmax/Km.
The rate of Pi or PATP uptake, expressed as nmol l−1 d−1 or pmol l−1 d−1, was calculated from the turnover time of the respective radioactive tracers and the measured concentration of Pi or DATP of the samples.
The zonal transect in 2014 traversed the California Current System (CCS) for the first few stations (Stations 1–4), characterized by relatively low sea-surface temperatures (SST), high nutrient concentration, high chlorophyll a and 14C-PP (Table 1, Figure 2B). Stations 5–43 comprised the transition zone between the CCS and the NPSG (Figure 1). This region showed high eddy activity as detected by satellite estimates of sea surface height anomalies (Shilova et al., 2017), with variable chlorophyll a and declining Pi concentrations. Stations 44–127 were all within the NPSG with low eddy activity and unusually high SST, reaching temperatures above 27°C nearing the Hawaiian Islands. Time-series data from Station ALOHA have only rarely recorded such high temperatures, and in September 2014 was the first time in a decade to do so. The meridional transect in 2016 reached the transition zone between the NPSG and the subpolar front just south of 32°N (Station 6). This region demonstrated high spatial variability in a variety of parameters (e.g., chlorophyll a, salinity) likely due to entrainment and filaments of mixing water masses belonging to the oligotrophic gyre and more nutrient-enriched water in the transition zone.
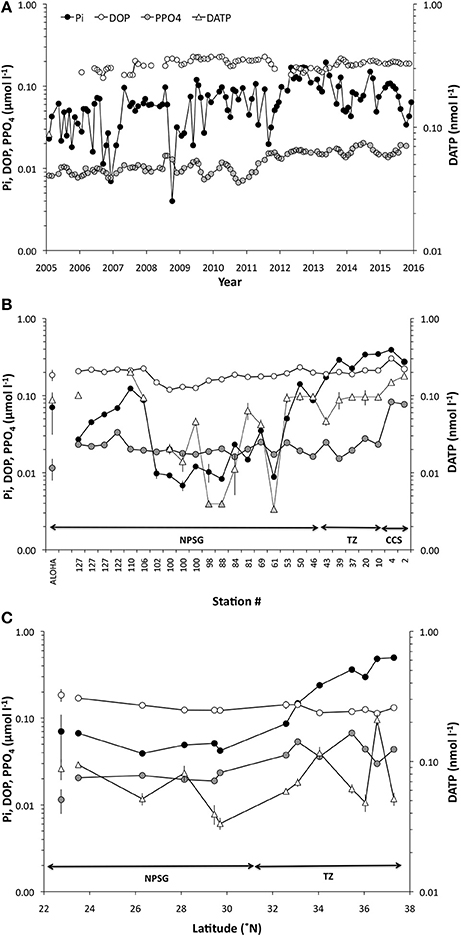
Figure 2. Temporal and spatial variability in inorganic phosphate (Pi), dissolved organic phosphate (DOP) and particulate organic phosphate (PPO4) concentrations (μmol l−1) at (A) Station ALOHA (2005–2016), (B) along the zonal transect in the fall 2014 and (C) along the meridional transect in the spring 2016. Dissolved adenosine-5′-triphosphate (DATP) concentrations are shown in nmol l−1 for the two transects in (B,C). The shaded triangles in (B) are below the stipulated detection limit, and presented only as a comparison to Pi. Arrows in (B,C) indicates the stations within the CCS, TZ, and NPSG as described in Figure 1. Note that the scale is logarithmic.
Over the past decade at Station ALOHA chlorophyll a concentration at the 25 m horizon varied by approximately a factor of two with the lowest concentrations observed during the summer months (72 ± 16 ng l−1; n = 28) and the highest during winter (119 ± 31 ng l−1; n = 26) with an average concentration of 93 ± 17 ng l−1 (Table 1). Chlorophyll a concentrations along the 2014 zonal transect were highest within the CCS, but even within the NPSG the concentrations varied over 3-fold (Station 81; 66 ± 3 ng l−1, Station 69; 249 ± 3 ng l−1: Table 1), with the highest chlorophyll a found in a phytoplankton bloom (Figure 1,Table 1). During the spring 2016 meridional transect, chlorophyll a varied two-fold within the NPSG and at the northernmost stations reached concentrations similar to those observed in the CCS. Station ALOHA 14C-PP, at the 25 m horizon, ranged from 4.5 to 11.8 μg C l−1 d−1, with a mean for August-September of 6.4 ± 0.9 μg C l−1 d−1 (n = 20) and 7.4 ± 1.8 μg C l−1 d−1 (n = 10) for April. Along the two transects 14C-PP varied by approximately a factor of 2–3 within the NPSG, but were much higher in the nutrient-enriched regions of the CCS and the northernmost stations of the 2016 transect (Table 1). During the zonal transect, within the NPSG, a peak in 14C-PP was observed at stations 69 and 76 (~ 14 μg C l−1 d−1). These two stations were also associated with the highest chlorophyll a measured during that transect within the NPSG (Table 1).
Variability in Pi concentrations at 25 m at Station ALOHA ranged approximately 25-fold over the past decade (2005–2015; 7–195 nmol P l−1; Figure 2A), with an average concentration of 70 ± 39 nmol l−1 (n = 107), and median of 62 nmol l−1. It should be noted that Pi inventories over this period displayed a rapid increase beginning in mid-2012, persisting through the end of 2013 before slowly subsiding into 2014 and 2015 (Figure 2A). The upper ocean inventories during this 1.5–year period were significantly higher than in the preceding 7–year period (integrated 0–100 m, [2005–2011, n = 67] 4.8 ± 2.4 mmol m−2; [2012–2013, n = 20] 11.3 ± 3.5 mmol m−2) and this skewed the mean Pi concentrations at the 25 m horizon upwards for the period by approximately 30% from the longer term mean for Station ALOHA. Pi concentrations during the 2014 zonal transect varied 60-fold driven by the high values found within the CCS, but were still variable by a factor of approximately 20 for stations within the NPSG (Figure 2B; Stations 46–127; range 7–141 nmol l−1). The stations occupied within the region along 29.3–30.5°N and between 140 and 150°W (Stations 61–102), were characterized by low Pi concentrations (range 7–35 nmol l−1, mean 15 ± 1 nmol l−1, n = 10), and within the more intensely sampled region around 29.3–30.5°N, ~150.3°W (stations 88–102) the mean Pi concentration was even lower at 9 ± 2 nmol l−1 (n = 6). During the spring 2016 meridional transect, Pi concentrations within the NPSG were 42 ± 8 nmol l−1, and increased though the transition zone into the subpolar front to approximately 500 nmol l−1 at 37.2°N (Figure 2C). The concentrations of DOP were much less variable both in space and time and ranged about a factor of two with concentrations at Station ALOHA averaging 185 ± 31 nmol P l−1 (n = 85; range 109–248 nmol P l−1; Figure 2A), and 2014 transect stations within the NPSG at 182 ± 34 nmol P l−1 (n = 19; range 119–232 nmol P l−1; Figure 2B). The DOP concentrations were significantly lower (t-test, p < 0.001) in the region encompassing stations 61–102 compared to the other stations within the NPSG. The meridional transect in the spring of 2016 showed a more uniform distribution even into the subpolar regions, ranging from a high of 170 nmol P l−1 at the southernmost site to a low of 114 nmol P l−1 toward the subpolar front (Figure 2C). The relative contribution of DOP to the total dissolved P (TDP) pool at Station ALOHA varied from 45% to near 100%, with an average of 72 ± 11% (n = 85). Along the zonal transect DOP contributed 41–95% of the total pool, when the CCS stations were included, and 62–95% (mean 84 ± 11%, n = 19) for stations sampled within the NPSG. DOP concentrations were relatively low during the meridional transect, but the DOP contribution to the TDP pool within the NPSG was in the range of the long-term mean for Station ALOHA (73 ± 3%, n = 5). The PPO4 concentrations varied approximately 3-fold during the 10-year period at Station ALOHA (Figure 2A; mean 12 ± 4 nmol l−1, n = 106; range 6–25 nmol l−1). The mean PPO4 during 2011–2015 was 16 ± 3 nmol l−1 (n = 41). During the zonal transect in 2014, PPO4 peaked within the CCS (Figure 2B), whereas concentrations within the NPSG varied approximately 2-fold (mean 21 ± 4 nmol l−1, n = 19; range 16–33 nmol l−1). Similarly, the meridional transect in 2016 showed the highest PPO4 concentrations within the transition zone and toward the subpolar front (Figure 2C), while concentrations within the NPSG showed small variations averaging 20 ± 2 nmol l−1 (n = 5). DATP concentrations along the zonal transect ranged from ~1 to 180 pmol DATP l−1, with the lowest concentrations coinciding with the lowest Pi pool and shortest Pi-, and ATP-pool turnover times. The highest concentrations were found within the CCS. However, the DATP concentrations were less dynamic than the range in concentrations imply, and were typically ~100 pmol l−1 for the majority of stations sampled (91 ± 15 pmol l−1, n = 11; excluding stations where Pi < 15 nmol l−1; Figure 2B). The meridional transect DATP concentrations ranged from 33 ± 3 to 209 ± 20 pmol l−1 with the highest values found within the transition zone. The average DATP concentration within the NPSG for the meridional transect 2016 was 60 ± 27 pmol l−1 (n = 5: Figure 2C).
Pi TOT at Station ALOHA varied from a few days to several weeks over a multi-year study with a long term mean of 18 ± 11 days (n = 28) and an uptake rate of 3.6 ± 1.3 nmol l−1 d−1 (range 0.6–7.1 nmol l−1 d−1; median 3.3 nmol l−1 d−1). The range observed for the two transects were from a few hours to 3 weeks within the NPSG, and reached 2–3 months in the CCS and subpolar transition zone respectively (Figures 3A,B). Very short turnover times (hours to 3 days) were found along the zonal transect around 30°N (Stations 61–100). Some of the stations (69–76) in this region were associated with a high phytoplankton biomass and enhanced primary productivity (chlorophyll a >0.2 μg l−1, 14C-PP ~ 14 μg C l−1 d−1; Table 1). The Pi-uptake rate along the zonal transect ranged from a few nmol l−1 d−1 to approximately 15 nmol−1 d−1 within the NPSG, and reached nearly 30 nmol l−1 d−1 within the CCS (Figure 4A). However, at the stations where we recorded the lowest Pi concentrations, and associated short turnover times, uptake rates were much enhanced (Figure 4A). The experiment to assess the kinetic response to increasing amounts of Pi was conducted at station 100, where there were indications of very low ambient Pi. Although the turnover time grew longer with additional Pi, as would be expected, the calculated rates for the whole water community did not show a clear kinetic response, as the calculated rates were similar for all concentrations tested (Table 2). A linear regression analysis gave an uptake rate estimate of 39 ± 1 nmol l−1 d−1 (n = 8, r2 = 0.991) for the whole water community. However, the >2 μm size class did show a kinetic response with increased Pi. The Pi uptake rates in this size class tripled between 10 and 75 nmol l−1 Pi, and although the relative contribution of the >2 μm size class to the whole water community was small, it increased from ~2 to 8% at concentrations above 75 nmol l−1 Pi, indicating that cells >2 μm were P-limited at ambient concentrations at this station. The kinetic analysis indicated that the Km for the >2 μm size class was 36 ± 7 nmol−1 (Table 2), which was much above the measured ambient Pi concentration of 5 ± 1 nmol l−1. Pi-uptake rates along the meridional transect were comparable to the long term mean of Station ALOHA within the NPSG (mean 2.8 ± 0.9 nmol l−1 d−1; n = 5), with higher rates throughout the transition zone (range 5.5–12 nmol l−1 d−1; Figure 4B).
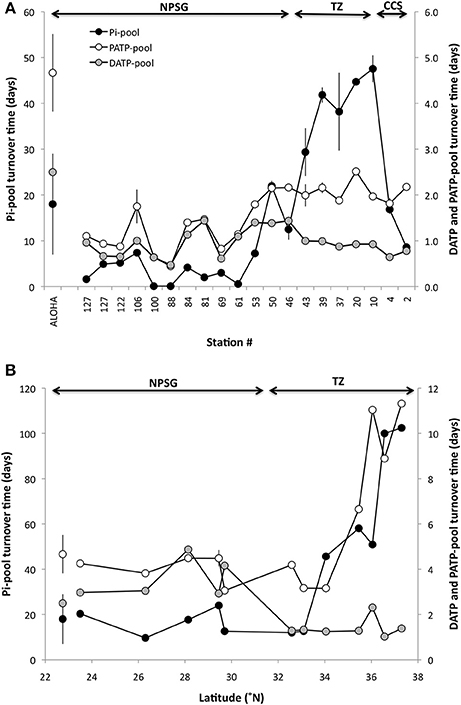
Figure 3. Turnover time (days) of the Pi-pool and dissolved and particulate ATP-pools (DATP and PATP, respectively) as measured by 33P radiotracer techniques. The Pi and PATP turnover times are based on the P uptake by the microbial community, whereas the DATP turnover time is the sum of the PATP and the net release of Pi originating from the hydrolysis of DATP. (A) zonal transect in the fall of 2014, and (B) meridional transect in the spring 2016. Error bars are derived from the error estimate of the regression of the time-course sampling used to calculate the turnover time. Values for Station ALOHA are mean ± 1 s.d. (Pi n = 30; ATP n = 7). Arrows indicate the stations within the CCS, TZ, and NPSG as described in Figure 1. Note that the scales differ among panels.
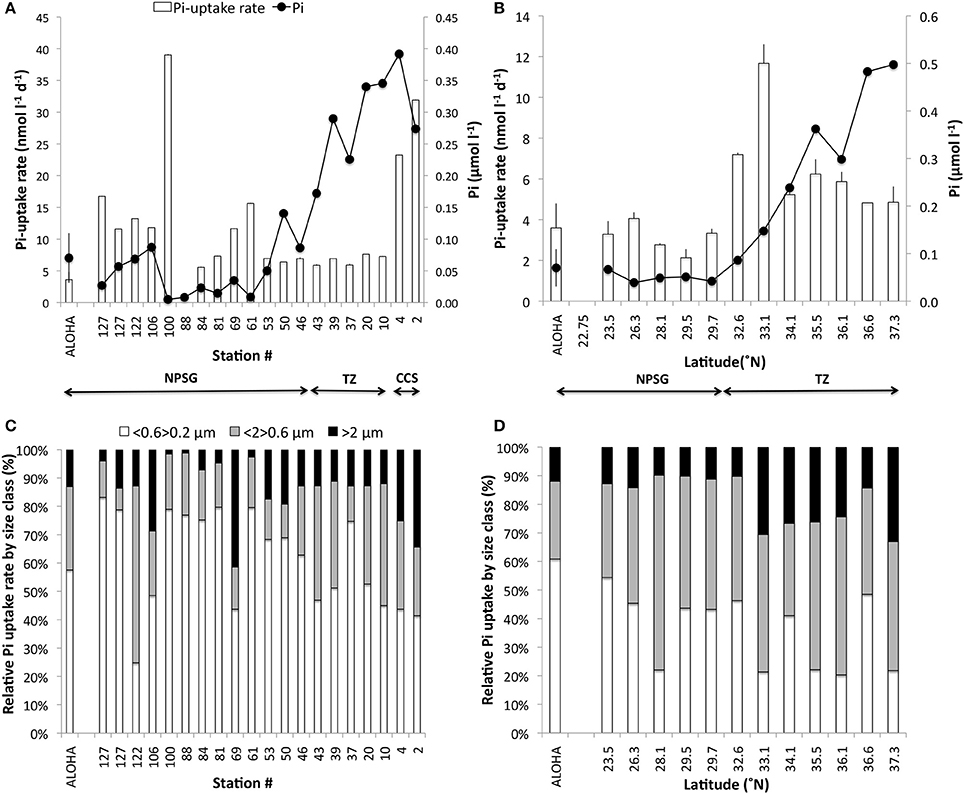
Figure 4. (A,B) Pi-uptake rates (nmol l−1 d−1; columns) and the corresponding Pi concentrations (μmol l−1; bullets) and (C,D) the relative contribution from different microbial size classes to the Pi-uptake measured. The zonal transect is shown in (A,C); the meridional transect in (B,D). Station ALOHA values for Pi uptake rates and Pi concentrations are shown to the left in each panel (mean ± 1 s.d; n = 28). Arrows indicate the stations within the CCS, TZ and NPSG as described in Figure 1. Note that the scales differ among panels.
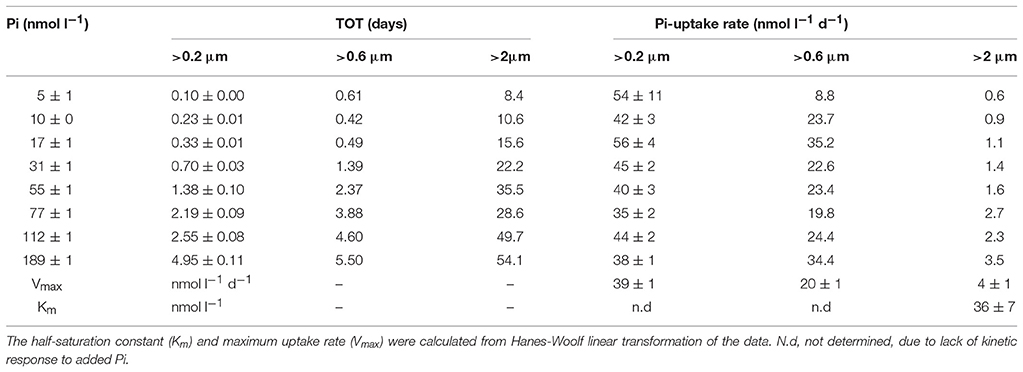
Table 2. Kinetic experiment carried out at Station 100 during the east-west transect in 2014. Seawater was amended with increasing concentrations of inorganic phosphate (Pi) to determine the turnover times (TOT) of the Pi- pool and Pi-uptake rates in different size fractions of the microbial community.
The relative contribution by different microbial size classes to the total community Pi-uptake, although variable along the two transects, showed a clear dominance by cells <2 μm with an average of 88% of Pi taken up by this size class within the NPSG and through the transition zone, but was lower in the CCS where cells >2 μm represented ~ 30% of the total Pi taken up (Figures 4C,D). Cells <0.6 μm became progressively more important to the total Pi uptake when transitioning from high Pi to low Pi environments. During the zonal transect from the CCS, transition zone to NPSG, cells <0.6 μm contributed 43 ± 2, 54 ± 12 to 67 ± 18% respectively to the total Pi uptake. The same pattern, although less pronounced, was seen during the meridional transect with 32 ± 13% at the transition zone and 42 ± 12% within the NPSG. At the stations along 30°N where Pi concentrations were <15 nmol l−1 (Stations 61, 81, 88, 100) the contributions from the >2 μm size class were at their lowest with <5% of the total. However, at station 69, where both chlorophyll a and 14C-PP were enhanced, indicative of a phytoplankton bloom, the >2 μm size class represented ~ 45% of the total Pi-uptake.
The TOT of ATP, based on the rate of uptake by the microbial community, was typically much shorter than that measured for the Pi-pool (Figures 3A,B) at 1–2 days in most cases (zonal transect range; 0.44 ± 0.05 to 2.17 ± 0.08 days; mean 1.6 ± 0.6 days, n = 20: meridional range; 1.02 ± 0.06 to 11.3 ± 1.9 days; mean 5.17 ± 3.04 days, n = 12: Figures 3A,B). Only at the stations along the zonal transect where Pi concentrations were below 10 nmol l−1 Pi (Stations 61, 88, 100), was the ATP pool turnover longer than that for Pi (Figure 3A). The total DATP pool TOT (i.e., the sum of the ATP taken up by microbes and Pi regenerated from the hydrolysis of DATP and released into the ambient seawater) was less than 1 day on average along the zonal transect (0.95 ± 0.30 days: n = 20). The mean DATP turnover time for the meridional transect was 1.43 ± 0.47 days (n = 12: Figures 3A,B).
The total DATP hydrolysis rates ranged nearly two orders of magnitude (3–230 pmol l−1 d−1) along the zonal transect, and approximately 10-fold along the meridional transect (Figures 5A,B). The very low rates were again in the region along 30°N where both Pi and DATP pools were depleted. During the zonal transect, excluding the stations where Pi and ATP were depleted, an average of 28 ± 9% (n = 8) of the total DATP hydrolyzed was not incorporated into cells, but regenerated as Pi within the NPSG, and an even higher proportion was regenerated within the transition zone (53 ± 4%, n = 5) and CCS (64 ± 0%, n = 2). The net Pi regenerated from DATP was even greater during the spring meridional transect with 53 ± 8% (n = 5) and 81 ± 8% (n = 7) within the NPSG and transition-sub polar regions, respectively (Figure 5B). The proportion (%) of Pi regenerated from DATP to total DATP hydrolysis correlated with ambient Pi concentrations, with an increasing proportion of the total not taken up with increasing Pi concentrations (Figure 6). Below 30 nmol Pi l−1 the regeneration diminished rapidly until Pi release from DATP was no longer measurable at ~ 5 nmol Pi l−1 (Figure 6).
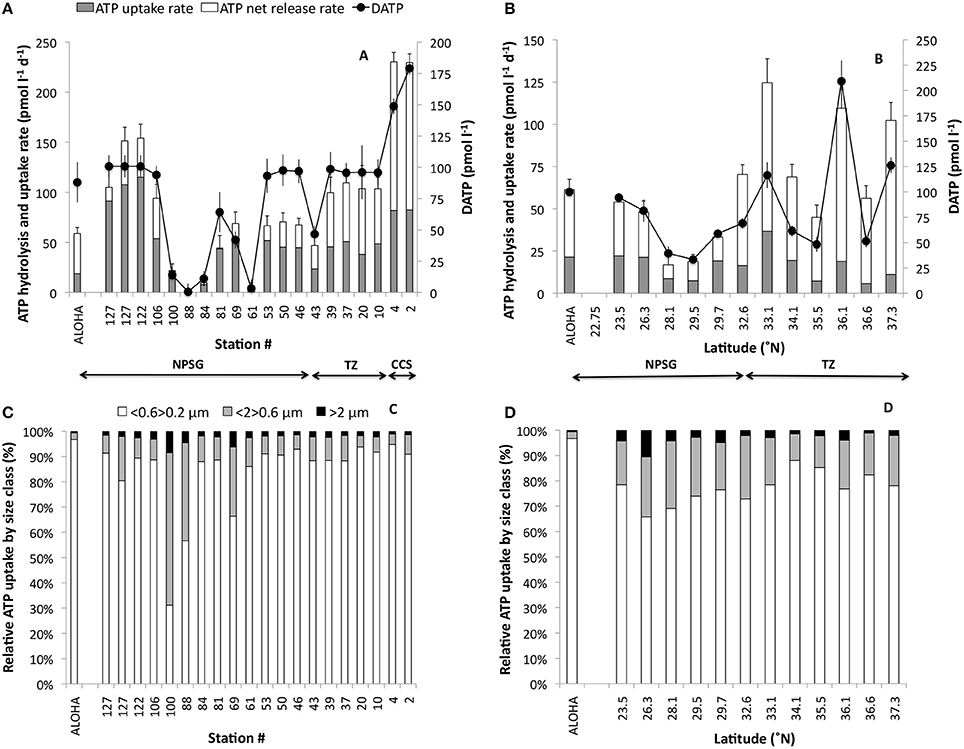
Figure 5. (A,B) Total DATP hydrolysis rates (pmol l−1 d−1) and the corresponding DATP concentrations (pmol l−1; bullets). The total DATP hydrolysis rate is partitioned into rate of microbial uptake of P from ATP (gray), and the net release rate of Pi from DATP into the surrounding seawater (white). (C,D) Show the relative contribution from different microbial size classes to the microbial ATP-uptake measured. The zonal transect is shown in (A,C); the meridional transect in (B,D). Station ALOHA data for Pi uptake rates and Pi concentrations are shown to the left in each panel as the mean ± 1 s.d. (n = 7). Arrows indicate the stations within the CCS, TZ and NPSG as described in Figure 1. Note that the scales differ among panels.
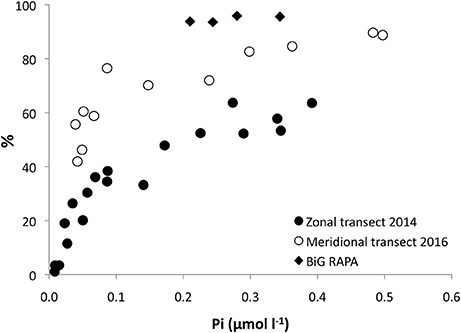
Figure 6. Proportion (%) of the total DATP hydrolysis released into the surrounding seawater as dissolved Pi, versus the ambient inorganic phosphate (Pi) concentration. Zonal transect (black bullets), meridional transect (white bullets) and data from BiG RAPA transect cruise in 2010 within the South Pacific Subtropical Gyre (Duhamel et al., 2017).
The relative contribution by different microbial size classes to the total community ATP-uptake, showed a different distribution than that of Pi. A great majority of P derived from ATP was incorporated into the smallest size class (<0.6>0.2 μm) with 80.1 ± 2.7% and 74.0 ± 2.0% of the total particulate uptake along the zonal and meridional transects respectively (Figures 5C,D). The >2 μm size class contributed <5% of the total uptake. The exceptions were at the Pi depleted stations (88, 100) and the bloom station (69) during the zonal cruise where the relative uptake by the larger size classes was considerably greater (Figure 5C). Furthermore, comparing the TOT of Pi and DATP for the different size classes, in paired experiments, revealed that there was no correlation between the two for the whole water community (>0.2 μm; Figure 7A), whereas the TOT for both Pi and DATP was similar in the >2 μm size class (Figure 7B, r = 0.9). In the Pi addition experiments at Station 100, where ATP had longer TOT than Pi at ambient concentrations of Pi, the TOT did not change significantly with additional Pi in the smallest size class (<0.6>0.2 μm) at ~ 1.3 days. However, at Pi additions of 50 and 100 nmol l−1, the TOT for DATP was faster than for Pi. The TOT of DATP in the two larger size classes was more similar to Pi with additional Pi.
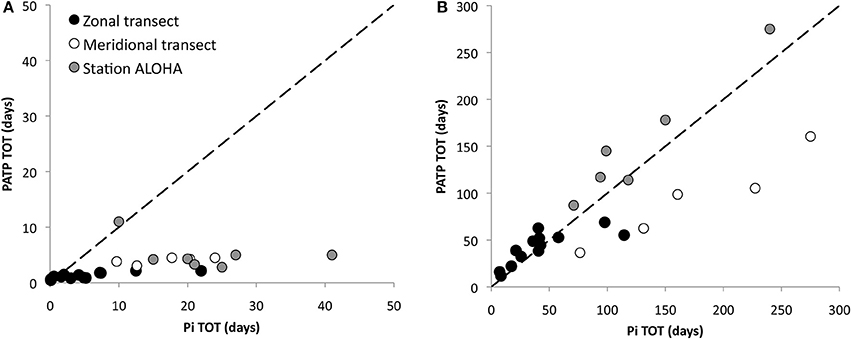
Figure 7. Inorganic phosphate (Pi) turnover time (TOT; days) vs. ATP TOT (days) within the North Pacific Subtropical Gyre (NPSG) for (A) the whole water community (>0.2 μm), along the two transects and at Station ALOHA, and (B) the >2 μm size class. The dashed line indicates the 1:1 relationship.
The TOT of Pi correlated well with Pi concentrations within the NPSG (Figure 8). Correlation analysis of paired measurements of Pi concentrations and TOT at Station ALOHA had an r = 0.9 (n = 28); the zonal transect 2014 r = 0.9 (n = 13) and the meridional transect r = 0.9 (n = 14; Figure 8). However, stations within the NPSG during the meridional transect showed weaker correlation at r = 0.7 (n = 5). The relationship between TOT and Pi concentrations showed a better fit to a power function than a linear regression and it is noteworthy that below 20 nmol l−1 Pi, the slope of a linear regression is comparatively low, indicating that any additional Pi does not have an appreciable effect on TOT, hence additional Pi leads to an increase in uptake rate. Above ~50 nmol l−1 Pi the TOT to Pi relationship stabilizes, i.e., additional Pi does not change uptake rate, so TOT instead increases. The same was not true for the TOT of DATP vs. DATP concentration, which was poorly correlated, in fact, the TOT of the DATP pool was better correlated to the Pi pool size than the DATP pool size (r = 0.7 vs. r = 0.5; data not shown).
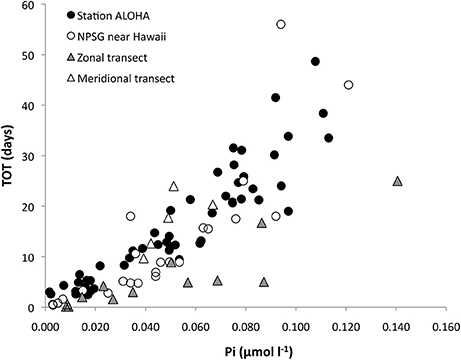
Figure 8. Inorganic phosphate (Pi) concentrations vs. Pi-pool turnover times (TOT; days) within the North Pacific Subtropical Gyre (NPSG). Station ALOHA (black bullets), stations near Hawaii (white bullets), the zonal transect (gray triangles) and the meridional transect (white triangles). Correlation coefficients for these data were r = 0.9 for Hawaii (n = 45, mixed layer) and the zonal transect (n = 13), r = 0.8 for stations near Hawaii (n = 31), and r = 0.7 for the meridional transect (n = 5).
The majority of the work presented here was conducted within the NPSG, an environment characterized by its oligotrophic nature with perennially low inorganic nutrients, low standing stocks of chlorophyll and biomass, and typically low primary productivity, with Station ALOHA serving as a representative for the biome (Karl and Lukas, 1996; Karl and Church, 2014). This ecosystem is microbial based, recycling intensive, with picophytoplankton (<2 μm), specifically the cyanobacterium Prochlorococcus, typically the largest contributors to phytoplankton biomass and primary production (Karl, 1999; Karl et al., 2001a). The two transect cruises (zonal, 2014; meridional, 2016), presented an opportunity to compare the temporal variability in the various P-pools and microbial uptake rates of Pi and DATP observed at Station ALOHA, with spatial variability in the NPSG as well as areas within the transition zones into the CCS to the east, and toward the subpolar waters to the north of the North Pacific Ocean. The transition zones showed strong trends in both salinity and temperature with salinities and temperatures increasing from the boundaries to the east and north into the NPSG, as well as higher inorganic nutrients, chlorophyll and primary productivity compared to those of the NPSG.
Although our understanding and knowledge of the cycling of P in the oligotrophic oceans have increased over the past decades, it is clear that these ecosystems are highly dynamic and not readily predictable. In particular the chemical composition and microbial utilization of the DOP pool, and its relative bioavailability remains an ongoing field of exploration (Karl and Björkman, 2015). Many studies have examined the bioavailability of DOP either by its susceptibility to alkaline phosphatase treatment (Moutin et al., 2008; Suzumura et al., 2012), through bioassays using known DOP compounds (Berman, 1988; Björkman and Karl, 1994; Björkman et al., 2000; Duhamel et al., 2017), or directly via specific ATP pool labeling (Karl and Bossard, 1985; Bossard and Karl, 1986; Björkman and Karl, 2005). In this study, we show the Pi-pool to be highly variable within the NPSG. Nevertheless, the range in concentrations at Station ALOHA and along the transects was similar. This suggests a mosaic upper ocean, with wide, yet limited dynamic range in terms of Pi-availability both temporally and across regions within the NPSG. In contrast, the DOP pool showed much less variability, and interestingly, the PPO4 pool was relatively invariant within the NPSG, although always at relatively low concentrations. This may indicate that even at very low Pi-inventories, the particulate P pool is buffered by increased utilization of the DOP pool. However, a reduction of the DOP pool in response to very low Pi is not evident at Station ALOHA, but may not be readily resolved given the analytical precision of the measurement (i.e., ability to detect a change in DOP of ±5%, or 10–15 nmol l−1 with sufficient certainty). Yet, during the 2014 zonal transect, in the region around 30°N where Pi was depleted, the DOP pool was significantly reduced relative to other stations along the transect, as well as compared to the long term mean at Station ALOHA. This lower DOP pool size may reflect an increased utilization of DOP due to P-limiting conditions. Nevertheless, the DOP concentrations in this region remained above 100 nM-P, indicating that a substantial fraction of the DOP pool may not be readily available to the microbial community in the surface ocean. Other studies have reached similar conclusions that only a relatively small fraction of the DOP pool appears to be bioavailable, e.g., Moutin et al. (2008) found that only 10–20% of the in situ DOP pool in the South Pacific Subtropical Gyre was hydrolyzable by alkaline phosphatase, similar to what Suzumura et al. (2012) reported for stations in the North Pacific near Japan (22–39%), and in the tropical and subtropical North Atlantic phosphomonoesters, substrates for alkaline phosphatase, constituted 19–37% of the DOP pool (Reynolds et al., 2014). This is also consistent with the degradation of selected DOP compounds at Station ALOHA, as well as the assessment of DOP utilization though bioassays (Björkman and Karl, 1994, 2003). An alternative explanation for high residual DOP during Pi-deplete conditions may be that other resources, such as available nitrogen or iron, are limiting or co-limiting production, and these limitations hamper further utilization of DOP. For example, in the subtropical North Atlantic, zinc has been implied as a limiting factor for the activity of alkaline phosphatase (Mahaffey et al., 2014), indicating that essential microelements may impact DOP degradation processes. The study region for the zonal transect around 30°N is known to consistently, if not predictably, harbor large, summertime phytoplankton blooms (Wilson, 2003, 2011; Villareal et al., 2012) and satellite imagery showed enhanced chlorophyll in this same area, consistent with such blooms, lasting from mid-July through September 2014. In a previous study within this same region Duhamel et al. (2010) found areas where the microbial community was under P-stress, as implied by the comparatively high alkaline phosphatase activity measured. The 2014 zonal transect coincided with late bloom stages, and areas most likely in post-bloom conditions as indicated by the vanishingly low concentrations of Pi in the surface waters.
The concentration of the DOP pool constituent DATP was quite uniform along the two transects within the NPSG, except where Pi was depleted and where the DATP pool also was drawn down to near the detection limit for our analysis. The concentrations were higher during the fall than spring transect possibly due to seasonal variability in DATP as previously observed at Station ALOHA (Björkman and Karl, 2001). Although DATP-phosphate is but a small fraction (~0.15%) of the total DOP pool, it appears to be highly bioavailable.
The Pi pool turnover times observed in this study were within the range previously reported from the NPSG (Perry and Eppley, 1981; Björkman et al., 2000), of a few hours to several weeks, again highlighting the variability in Pi-pool dynamics within the NPSG. The Pi-pool turnover time was strongly correlated with measured Pi pool concentrations, but did show concentration dependent kinetics, i.e., increasing uptake rate with increasing Pi concentration, at low ambient Pi concentrations, as described previously for Station ALOHA (Björkman et al., 2012).
The turnover time of the DATP pool was typically substantially shorter than for the Pi-pool, reflecting both its small pool size and that the microbial hydrolysis and uptake of P from DATP proceeds separately from that of the Pi pool (Ammerman and Azam, 1985; Björkman et al., 2012; Duhamel et al., 2017). Total DATP hydrolysis was high along both transects, exceeding the uptake of Pi from DATP by the microbial community, resulting in a net release of regenerated Pi into the ambient seawater. There was a positive relationship between Pi concentrations and the proportion of the DATP hydrolyzed, i.e., net regeneration of Pi from DATP, similar to that observed by Ammerman and Azam (1991a), with a higher fraction of the total hydrolyzed P taken up at lower Pi concentrations. In the South Pacific Subtropical Gyre, where Pi concentrations are perennially higher compared to the NPSG (Moutin et al., 2008), the proportion of regenerated Pi from ATP was also higher than observed in this study (Figure 6) emphasizing the decoupling of DATP hydrolysis and Pi uptake at high Pi concentrations (Duhamel et al., 2017). The steepest increase in the proportion of DATP regenerated as Pi was seen at Pi concentrations <100 nmol l−1 Pi, indicating that the newly regenerated Pi is of increasing importance to P-nutrition the smaller the Pi pool becomes, and the coupling between DATP hydrolysis and uptake becomes increasingly tighter, i.e., the recycling of P intensifies, as Pi concentrations drop below ~100 nmol l−1. Although the smallest components of the microbial community appear to have the highest affinity for Pi (Thingstad et al., 1993; Cañellas et al., 2000; Vadstein, 2000), and typically do not appear to be P-limited, the larger cells can capitalize at higher Pi concentrations with increased Pi-uptake rates as well as capturing a larger proportion of the total community P taken up (Björkman et al., 2012). This was observed during the two transect cruises, and demonstrated in the Pi addition experiment at station 100 where a range of Pi concentrations was used. In this experiment microorganisms in the >2 μm fraction increased both Pi uptake rate as well as the relative contribution of the total uptake with increasing Pi. The uptake of P originating from DATP was greatly dominated by the smallest size class (<0.6>0.2 μm) and likely driven by heterotrophic bacterial hydrolysis by the enzyme 5′-nucleotidase and subsequent uptake (Azam and Hodson, 1977; Bengis-Garber and Kushner, 1982; Ammerman and Azam, 1991a,b). Interestingly, at the Pi depleted stations along 30°N during the zonal transect, Pi from ATP was transferred to a greater extent into the two larger size classes, although the rates were very low. However, this partitioning was not seen in the Pi-uptake, where the largest size classes contributed the least to overall Pi uptake. Taken together, this indicates that this P depleted region was poised for rapid P assimilation, should P become available.
To gain a better appreciation for the flux of essential nutrients, such as phosphate, through biogeochemical cycles in the vast open ocean biomes, it is necessary to assess the dynamics of the P-pool and how its bioavailability may impact spatial and temporal variability in productivity and community composition. Our study showed that Pi concentrations in the surface waters within the NPSG were highly dynamic both in time and space whereas DOP and PPO4 pools were less variable; the particulate pool potentially buffered by the much larger reservoir provided by the DOP pool. Although Pi-stress, or limitation, occurred locally or periodically, P sufficiency appears to be the prevailing condition for the dominant components of the microbial community within the NPSG. DATP was typically more rapidly turned over than the PATP pool, which turned over faster than the Pi-pool. Microbial uptake of P was dominated by the <2 μm size class; however, the turnover time for Pi or ATP in the >2 μm fraction were similar, suggesting that microbial utilization of these two phosphate pools are independent of one another within the NPSG and that DATP predominantly is processed by the smallest microbial components of this ecosystem. DATP hydrolysis commonly resulted in the net release of Pi into the ambient seawater and may increasingly contribute to P-nutrition during low Pi conditions.
KB and SD designed the experiments, performed the field- and laboratory work. KB wrote the manuscript. SD, DK, MC contributed significantly to the intellectual content of the manuscript. DK and MC provided funding.
The authors declare that the research was conducted in the absence of any commercial or financial relationships that could be construed as a potential conflict of interest.
We thank the Captains and crew of the R/V Kilo Moana, R/V Kaimikai-O-Kanaloa, R/V New Horizon and R/V Knorr. We thank Lance Fujieki and Benedetto Barone for graphical assistance. Funding was provided by the National Science Foundation for the Hawaii Ocean Time-series program (OCE-1260164, MC, DK) and the Center for Microbial Oceanography: Research and Education (C-MORE, DBI-0424599, DK) and Dimensions in Biodiversity (OCE-124221, MC). Additional support was provided by the Gordon and Betty Moore Foundation: Marine Microbiology Initiative (3794, DK) and the Simons Foundation (SCOPE project ID 329108: DK and MC and Gradients project ID 426570SP: V. Armbrust; U. Washington, with subcontract to DK).
Ammerman, J. W., and Azam, F. (1985). Bacterial 5′-nucleotidase in aquatic ecosystems: A novel mechanism of phosphorus regeneration. Science 227, 1338–1340. doi: 10.1126/science.227.4692.1338
Ammerman, J. W., and Azam, F. (1991a). Bacterial 5′-nucleotidase activity in estuarine and coastal marine waters: Role in phosphorus regeneration. Limnol. Oceanogr. 36, 1437–1447. doi: 10.4319/lo.1991.36.7.1437
Ammerman, J. W., and Azam, F. (1991b). Bacterial 5′-nucleotidase activity in estuarine and coastal waters. Characterization of enzyme activity. Limnol. Oceanogr. 36, 1427–1436. doi: 10.4319/lo.1991.36.7.1427
Azam, F., and Hodson, R. E. (1977). Dissolved ATP in the sea and its utilisation by marine bacteria. Nature 276, 696–698. doi: 10.1038/267696a0
Bengis-Garber, C., and Kushner, D. J. (1982). Role of membrane bound 5′-nucleotidase in nucleotide uptake by a moderate halophile Vibrio costicola. J. Bacteriol. 149, 808–815.
Berman, T. (1988). Differential uptake of orthophosphate and organic phosphorus substrates by bacteria and algae in Lake Kinneret. J. Plankton Res. 10, 1239–1249. doi: 10.1093/plankt/10.6.1239
Björkman, K. M., and Karl, D. M. (2001). A novel method for the measurement of dissolved adenosine and guanosine triphosphate in aquatic habitats: applications to marine microbial ecology. J. Microb. Meth. 47, 159–167. doi: 10.1016/S0167-7012(01)00301-3
Björkman, K. M., and Karl, D. M. (2003). Bioavailability of dissolved organic phosphorus in the euphotic zone at Station ALOHA, North Pacific Subtropical Gyre. Limnol. Oceanogr. 48, 1049–1057. doi: 10.4319/lo.2003.48.3.1049
Björkman, K. M., and Karl, D. M. (2005). Presence of dissolved nucleotides in the North Pacific Subtropical Gyre and their role in cycling of dissolved organic phosphorus. Aquat. Microb. Ecol. 39, 193–203. doi: 10.3354/ame039193
Björkman, K., and Karl, D. M. (1994). Bioavailability of inorganic and organic phosphorus compounds to natural assemblages of microorganisms in Hawaiian coastal waters. Mar. Ecol. Prog. Ser. 111, 265–273. doi: 10.3354/meps111265
Björkman, K., Duhamel, S., and Karl, D. M. (2012). Microbial group specific uptake kinetics of inorganic phosphate and adenosine-5′-triphosphate (ATP) in the North Pacific Subtropical Gyre. Front. Microbiol. 3:189. doi: 10.3389/fmicb.2012.00189
Björkman, K., Thomson-Bulldis, A. L., and Karl, D. M. (2000). Phosphorus dynamics in the North Pacific Subtropical Gyre. Aquat. Microb. Ecol. 22, 185–198. doi: 10.3354/ame022185
Bossard, P., and Karl, D. M. (1986). The direct measurement of ATP and adenine nucleotide pool turnover in microorganisms: a new method for environmental assessment of metabolism, energy flux and phosphorus dynamics. J. Plankton Res. 8, 1–13. doi: 10.1093/plankt/8.1.1
Cañellas, M., Agusti, S., and Duarte, C. M. (2000). Latitudinal variability in phosphate uptake in the Central Atlantic. Mar. Ecol. Prog. Ser. 194, 283–294. doi: 10.3354/meps194283
Casey, J. R., Lomas, M. W., Michelou, V. K., Dyhrman, S. T., Orchard, E. D., Ammerman, J. W., et al. (2009). Phytoplankton taxon-specific orthophosphate (Pi) and ATP utilization in the western subtropical North Atlantic. Aquat. Microb. Ecol. 58, 31–44. doi: 10.3354/ame01348
Clark, L. L., Ingall, E. D., and Benner, R. (1998). Marine phosphorus is selectively remineralized. Nature 393:426. doi: 10.1038/30881
Dore, J. E., Houlihan, T., Hebel, D. V., Tien, G., Tupas, L., and Karl, D. M. (1996). Freezing as a method of sample preservation for the analysis of dissolved nutrients in seawater. Mar. Chem. 53, 173–185. doi: 10.1016/0304-4203(96)00004-7
Duhamel, S., Björkman, K. M., Repeta, D. J., and Karl, D. M. (2017). Phosphorus dynamics in biogeochemically distinct regions of the southeast subtropical Pacific Ocean. Prog. Oceanogr. 151, 261–274. doi: 10.1016/j.pocean.2016.12.007
Duhamel, S., Björkman, K. M., Van Wambeke, F., Moutin, T., and Karl, D. M. (2011). Characterization of alkaline phosphatase activity in the North and South Pacific Subtropical Gyres: implications for phosphorus cycling. Limnol. Oceanogr. 56, 1244–1254. doi: 10.4319/lo.2011.56.4.1244
Duhamel, S., Dyhrman, S. T., and Karl, D. M. (2010). Alkaline phosphatase activity and regulation in the North Pacific Subtropical Gyre. Limnol. Oceanogr. 55, 1414–1425. doi: 10.4319/lo.2010.55.3.1414
Falkowski, P. G. (1997). Evolution of the nitrogen cycle and its influence on the biological sequestering of CO2 in the ocean. Nature 387, 272–275. doi: 10.1038/387272a0
Johnson, D. L. (1971). Simultaneous determination of arsenate and phosphate in natural waters. Environ. Sci. Tech. 5, 411–414. doi: 10.1021/es60052a005
Karl, D. M. (1999). A sea of change: biogeochemical variability in the North Pacific Subtropical Gyre. Ecosystems 2, 181–214. doi: 10.1007/s100219900068
Karl, D. M., and Björkman, K. M. (2015). “Dynamics of DOP,” in Biogeochemistry of Marine Dissolved Organic Matter, 2nd Edn., eds D. Hansell and C. Carlson (Amsterdam; New York, NY: Academic Press), 233–334. doi: 10.1016/B978-0-12-405940-5.00005-4
Karl, D. M., and Bossard, P. (1985). Measurement and significance of ATP and adenine nucleotide pool turnover in microbial cells and environmental samples. J. Microbiol. Methods 3, 125–139. doi: 10.1016/0167-7012(85)90040-5
Karl, D. M., and Church, M. J. (2014). Microbial oceanography and the Hawaii Ocean Time-series programme. Nat. Rev. Microbiol. 12, 699–713. doi: 10.1038/nrmicro3333
Karl, D. M., and Lukas, R. (1996). The Hawaii Ocean Time-series (HOT) program: background, rationale and field implementation. Deep Sea Res. 43, 129–156. doi: 10.1016/0967-0645(96)00005-7
Karl, D. M., and Tien, G. (1992). MAGIC: A sensitive and precise method for measuring dissolved phosphorus in aquatic environments. Limnol. Oceanogr. 37, 105–116. doi: 10.4319/lo.1992.37.1.0105
Karl, D. M., Bidigare, R. R., and Letelier, R. M. (2001a). Long-term changes in plankton community structure and productivity in the subtropical North Pacific Ocean: the domain shift hypothesis. Deep Sea Res. 48, 1449–1470. doi: 10.1016/S0967-0645(00)00149-1
Karl, D. M., Björkman, K. M., Dore, J. E., Fujieki, L., Hebel, D. V., Houlihan, T., et al. (2001b). Ecological nitrogen-to-phosphorus stoichiometry at Station ALOHA. Deep Sea Res. 48, 1529–1566. doi: 10.1016/S0967-0645(00)00152-1
Kolowith, L. C., Ingall, E. D., and Benner, R. (2001). Composition and cycling of marine organic phosphorus. Limnol. Oceanogr. 46, 309–320. doi: 10.4319/lo.2001.46.2.0309
Lomas, M. W., Burke, A. L., Lomas, D. A., Bell, D. W., Shen, C., Dyhrman, S. T., et al. (2010). Sargasso Sea phosphorus biogeochemistry: an important role for dissolved organic phosphorus (DOP). Biogeosciences 7, 695–710. doi: 10.5194/bg-7-695-2010
Mahaffey, C., Reynolds, S., Davis, C. E., and Lohan, M. C. (2014). Alkaline phosphatase activity in the subtropical ocean: insights from nutrient, dust and trace metal addition experiments. Front. Mar. Sci. 1:73. doi: 10.3389/fmars.2014.00073
Mather, R. L., Reynolds, S. E., Wolff, G. A., Williams, R. G., Torres-Valdes, S., Woodward, E. M. S., et al. (2008). Phosphorus cycling in the North and South Atlantic Ocean subtropical gyres. Nat. Geoscience 1, 439–443. doi: 10.1038/ngeo232
Menzel, D. W., and Corwin, N. (1965). The measurement of total phosphorus in seawater based on the liberation of organically bound fractions by persulfate oxidation. Limnol. Oceanogr. 10, 280–282. doi: 10.4319/lo.1965.10.2.0280
Moutin, T., Karl, D. M., Duhamel, S., Rimmelin, P., Raimbault, P., Van Mooy, B., Claustre, H., et al. (2008). Phosphate availability and the ultimate control of new nitrogen input by nitrogen fixation in the tropical Pacific Ocean. Biogeosciences 5, 95–109. doi: 10.5194/bg-5-95-2008
Murphy, J., and Riley, J. P. (1962). A modified single solution method for determination of phosphate in natural waters. Anal. Chim. Acta 27, 31–36. doi: 10.1016/S0003-2670(00)88444-5
Perry, M. J., and Eppley, R. W. (1981). Phosphate uptake by phytoplankton in the central North Pacific Ocean. Deep Sea Res. 28A, 39–49. doi: 10.1016/0198-0149(81)90109-6
Repeta, D. J., Ferron, S., Sosa, O. A., Johnson, C. G., Repeta, L. D., Acker, M., et al. (2016). Marine methane paradox explained by bacterial degradation of dissolved organic matter. Nat. Geoscience 9, 884–887. doi: 10.1038/ngeo2837
Reynolds, S., Mahaffey, C., Roussenov, V., and Williams, R. G. (2014). Evidence for production and lateral transport of dissolved organic phosphorus in the eastern subtropical North Atlantic. Glob. Biogeochem. Cycles 28, 805–824. doi: 10.1002/2013GB004801
Shilova, I. N., Mills, M. M., Robidart, J. C., Turk-Kubo, K. A., Björkman, K. M., Kolber, Z., et al. (2017). Differential effects of nitrate, ammonium, and urea as N sources for microbial communities in the North Pacific Ocean. Limnol. Oceanogr. 62, 2550–2574. doi: 10.1002/lno.10590
Suzumura, M., Hashihama, F., Yamada, N., and Kinouchi, S. (2012). Dissolved phosphorus pools and alkaline phosphatase activity in the euphotic zone of the western North Pacific Ocean. Front. Microbiol. 3:99. doi: 10.3389/fmicb.2012.00099
Thingstad, T. F., Skjoldal, E. F., and Bohne, R. A. (1993). Phosphorus cycling and algal-bacterial competition in Sandfjord, western Norway. Mar. Ecol. Prog. Ser. 99, 239–259. doi: 10.3354/meps099239
Tyrell, T. (1999). The relative influence of nitrogen to phosphorus on oceanic primary production. Nature 400, 525–531. doi: 10.1038/22941
Vadstein, O. (2000). Heterotrophic, planktonic bacteria and cycling of phosphorus. Phosphorus requirements, competitive ability and food web interactions. Adv. Microb. Ecol. 16, 115–167. doi: 10.1007/978-1-4615-4187-5_4
Villareal, T. A., Brown, C. G., Brzezinski, M. A., Krause, J. W., and Wilson, C. (2012). Summer diatom blooms in the North Pacific subtropical gyre: 2008-2009. PLoS ONE 7:e33109. doi: 10.1371/journal.pone.0033109
Wilson, C. (2003). Late Summer chlorophyll blooms in the oligotrophic North Pacific Subtropical Gyre. Geophys. Res. Lett. 30, 1–4. doi: 10.1029/2003GL017770
Keywords: phosphorus cycling, North Pacific subtropical gyre, phosphate, ATP, station ALOHA
Citation: Björkman KM, Duhamel S, Church MJ and Karl DM (2018) Spatial and Temporal Dynamics of Inorganic Phosphate and Adenosine-5′-Triphosphate in the North Pacific Ocean. Front. Mar. Sci. 5:235. doi: 10.3389/fmars.2018.00235
Received: 24 January 2018; Accepted: 18 June 2018;
Published: 10 July 2018.
Edited by:
Javier Arístegui, Universidad de Las Palmas de Gran Canaria, SpainReviewed by:
Marta Sebastian, Instituto de Oceanografía y Cambio Global, SpainCopyright © 2018 Björkman, Duhamel, Church and Karl. This is an open-access article distributed under the terms of the Creative Commons Attribution License (CC BY). The use, distribution or reproduction in other forums is permitted, provided the original author(s) and the copyright owner(s) are credited and that the original publication in this journal is cited, in accordance with accepted academic practice. No use, distribution or reproduction is permitted which does not comply with these terms.
*Correspondence: Karin M. Björkman, YmpvcmttYW5AaGF3YWlpLmVkdQ==
Disclaimer: All claims expressed in this article are solely those of the authors and do not necessarily represent those of their affiliated organizations, or those of the publisher, the editors and the reviewers. Any product that may be evaluated in this article or claim that may be made by its manufacturer is not guaranteed or endorsed by the publisher.
Research integrity at Frontiers

Learn more about the work of our research integrity team to safeguard the quality of each article we publish.