 Camrin D. Braun
 Gregory B. Skomal
 Simon R. Thorrold
- 1Biological Oceanography, Massachusetts Institute of Technology-Woods Hole Oceanographic Institution Joint Program in Oceanography/Applied Ocean Science and Engineering, Cambridge, MA, United States
- 2Biology Department, Woods Hole Oceanographic Institution, Woods Hole, MA, United States
- 3Massachusetts Division of Marine Fisheries, New Bedford, MA, United States
Basking shark (Cetorhinus maximus) populations are considered “vulnerable” globally and “endangered” in the northeast Atlantic by the International Union for the Conservation of Nature (IUCN). Much of our knowledge of this species comes from surface observations in coastal waters, yet recent evidence suggests the majority of their lives may be spent in the deep ocean. Depth preferences of basking sharks have significantly limited movement studies that used pop-up satellite archival transmitting (PSAT) tags as conventional light-based geolocation is impossible for tagged animals that spend significant time below the photic zone. We tagged 57 basking sharks with PSAT tags in the NW Atlantic from 2004 to 2011. Many individuals spent several months at meso- and bathy-pelagic depths where accurate light-level geolocation was impossible during fall, winter and spring. We applied a newly-developed geolocation approach for the PSAT data by comparing three-dimensional depth-temperature profile data recorded by the tags to modeled in situ oceanographic data from the high-resolution HYbrid Coordinate Ocean Model (HYCOM). Observation-based likelihoods were leveraged within a state-space hidden Markov model (HMM). The combined tracks revealed that basking sharks moved from waters around Cape Cod, MA to as far as the SE coast of Brazil (20°S), a total distance of over 17,000 km. Moreover, 59% of tagged individuals with sufficient deployment durations (>250 days) demonstrated seasonal fidelity to Cape Cod and the Gulf of Maine, with one individual returning to within 60 km of its tagging location 1 year later. Tagged sharks spent most of their time at epipelagic depths during summer months around Cape Cod and in the Gulf of Maine. During winter months, sharks spent extended periods at depths of at least 600 m while moving south to the Sargasso Sea, the Caribbean Sea, or the western tropical Atlantic. Our work demonstrates the utility of applying advances in oceanographic modeling to understanding habitat use of highly migratory, often meso- and bathy-pelagic, ocean megafauna. The large-scale movement patterns of tagged sharks highlight the need for international cooperation when designing and implementing conservation strategies to ensure that the species recovers from the historical effects of over-fishing throughout the North Atlantic Ocean.
Introduction
The basking shark, Cetorhinus maximus (Gunnerus 1765), is the second largest fish species, attaining weights of up to 4 tons and lengths up to 12 m (Sims, 2008). It is known to inhabit boreal to tropical (Skomal et al., 2004) waters circumglobally and is most often observed on continental shelves (Sims et al., 2006). Despite its size and widespread distribution, major gaps in our understanding of basking shark ecology remain. Population size and structure are currently unresolved and information about fisheries interactions is limited (Sims, 2008). Although there is evidence to suggest population recovery in some areas following exploitation (Witt et al., 2012), the lack of information about key life history traits, population size, movements, and habitat use is problematic as global anthropogenic pressures on elasmobranchs continue to rise (Dulvy et al., 2008; Ferretti et al., 2010).
Basking sharks exhibit life history characteristics that make them particularly vulnerable to exploitation, including low fecundity, slow growth and maturity, and long gestation times (Compagno, 1984; Sims, 2008). There is, therefore, concern over the status of basking shark populations worldwide, and the species is listed on Appendix II of the Convention on the International Trade in Endangered Species (CITES) and Appendices I and II of the Convention for the Conservation of Migratory Species of Wild Animals (CMS). It is also considered “vulnerable” globally and “endangered” in the northeast Atlantic by the International Union for the Conservation of Nature (IUCN).
Historically, information on the ecology of large pelagic animals has been constrained to scarce observations that are limited geographically (Templeman, 1963; Squire J. L. Jr., 1990; Francis and Duffy, 2002). Almost all of our knowledge of basking shark ecology, for instance, comes from surface observations in coastal waters (Sims et al., 2006; Sims, 2008). Yet recent evidence from electronic archival tags suggests that perhaps the majority of their lives are spent offshore at depths below the euphotic zone (Skomal et al., 2004). Indeed, the rapid development of electronic tag technologies has provided a powerful means of gaining detailed information about the behavior of marine species (Block et al., 2011). Pop-up satellite archival transmitting (PSAT) tags have been particularly helpful in ocean environments as data are relayed back to the researcher via satellite upon tag release from the individual (e.g., Block et al., 2011). These tags have provided a wealth of information on sharks (Berumen et al., 2014; Werry et al., 2014), rays (Braun et al., 2014; Thorrold et al., 2014), and large teleost fishes (Braun et al., 2015a) by eliminating the need to physically recover the tag at the end of the deployment.
While electronic tags have revolutionized the study of movement ecology in the ocean, a significant hurdle remains when attempting to track marine fishes compared with terrestrial counterparts. Tags using Argos or Global Positioning System (GPS) locations require the tag antenna to break the water surface long enough for communication with satellites to be established (Argos) or a snapshot of the satellite constellation to be received (GPS). Researchers have, therefore, relied mostly on PSAT tags that use light-level geolocation in which a threshold algorithm is used to detect solar altitude above the horizon from which estimates of longitude (local noon) and latitude (sunrise/sunset) can be estimated (Hill and Braun, 2001). While sea surface temperature (SST) and bathymetry can improve these estimates (Galuardi et al., 2010; Lam et al., 2010), light-based geolocation requires occupation of the photic zone to record adequate light data for geolocation, and even estimates with quality light data can be error prone (Braun et al., 2015b). However, a number of marine species rarely, if ever, experience enough downwelling light or spend adequate time at the surface to determine their position with PSAT tags (Skomal et al., 2004; Aarestrup et al., 2009; Peklova et al., 2012). Animals that spend significant time at depths below the photic zone have, therefore, proved extremely difficult to track in ocean ecosystems (e.g., Skomal et al., 2004; Dewar et al., 2011).
The use of PSAT tags to track basking shark movements has proved particularly difficult in the northwestern Atlantic as basking sharks spend months at a time below the euphotic zone where light-based geolocation is impossible (Skomal et al., 2004). We have recently developed a new geolocation approach that combines all the physical data collected from archival tags, including light levels and depth-temperature profiles, in a likelihood framework to more accurately track the movements of tagged fishes in the ocean (Braun et al., 2018). Our method uses a purely diffusive animal movement model (e.g., Brownian motion) with behavior state switching (migratory or resident states based on a priori movement speeds) coupled with observations of the environment (e.g., in situ or modeled oceanography) to estimate the posterior distribution of the state (e.g., animal position and behavior) in a hidden Markov model (HMM) framework. Depth-temperature profiles provide diagnostic oceanographic signatures that, along with other data sources like light, SST, and maximum depth, may be leveraged to help constrain position (Skomal et al., 2004; Aarestrup et al., 2009).
Satellite tags have been deployed on basking sharks in the Atlantic since the pioneering work of Priede (1984). Yet, basking shark movements and ecology remain poorly understood. Here, we present the results of an intensive tagging effort that deployed 57 PSAT tags on adult basking sharks during summer months in waters adjacent to Cape Cod, Massachusetts. Profiles recorded by the tags were integrated with high-resolution oceanographic model outputs or in situ climatological data to construct likelihoods and improve geolocation estimates for basking sharks. The data provide a rare assessment of the large-scale movements and migratory behavior of the ocean's second largest fish. The information is, in turn, a prerequisite for any attempts to estimate abundance and population structure of basking sharks in the Atlantic Ocean.
Methods
Study Area and Tagging
We opportunistically deployed a variety of PSAT tags on basking sharks near Cape Cod, Massachusetts (USA) in the Northwest Atlantic (NWA) between 2004 and 2011 (Table 1). Total length of each individual was estimated relative to the tagging vessel and, where possible, the pelvic region was visually inspected to determine sex. Tags were applied by a professional harpoon fisherman into the dorsal musculature near the base of the first dorsal fin (Chaprales et al., 1998). This research was performed in accordance with the Woods Hole Oceanographic Institution's Animal Care and Use Committee (IACUC) protocol #16518.
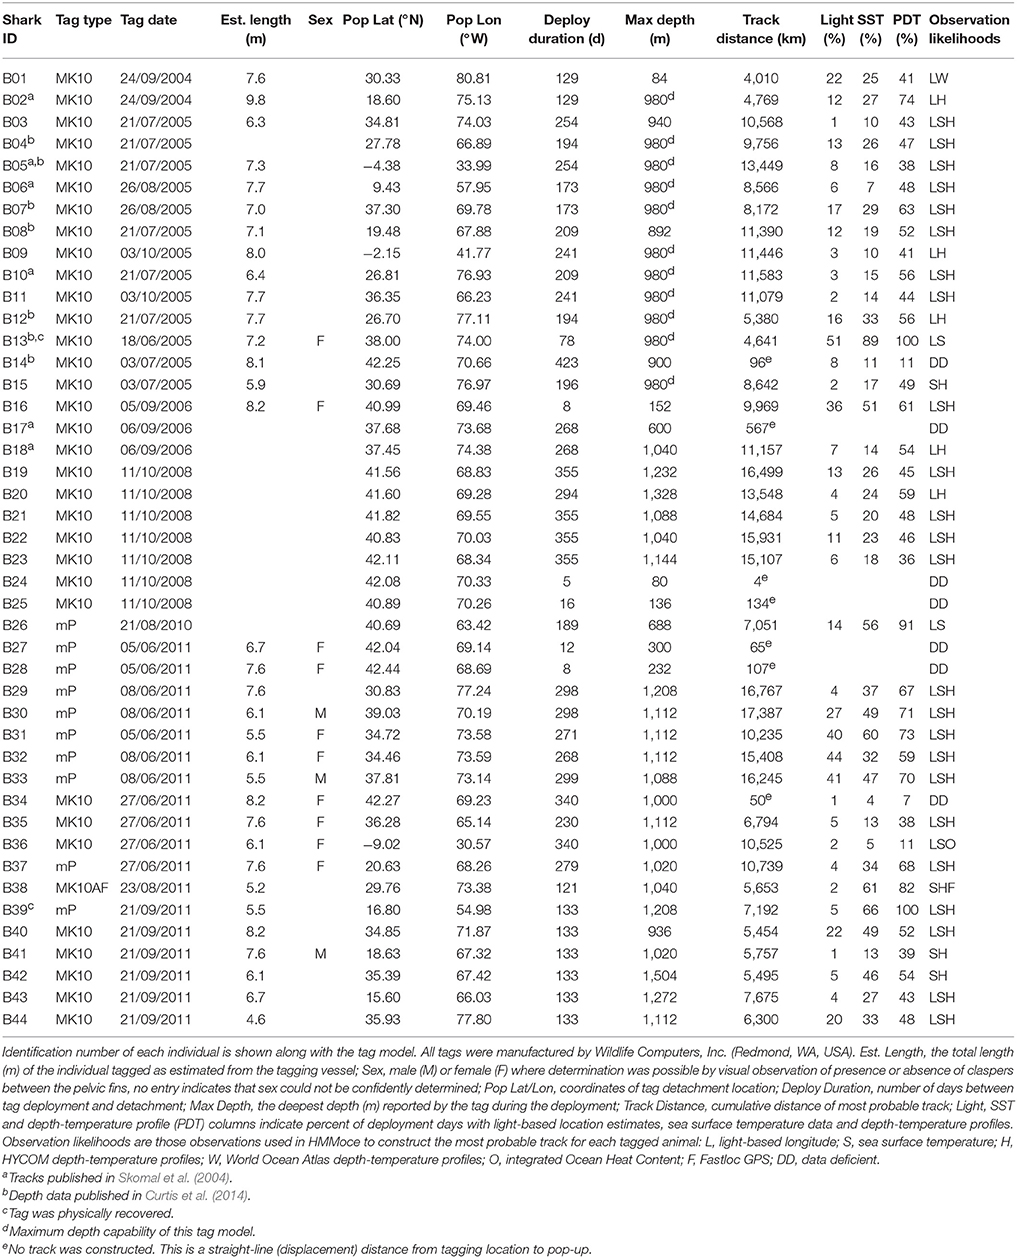
Table 1. Summary information from satellite tag deployments on Cetorhinus maximus in the NW Atlantic.
Tag Types
Three types of PSAT tags were deployed on basking sharks (Table 1). These tags (Models Mk10-PAT, Mk10-AF, miniPAT; Wildlife Computers, Inc., WA, USA) logged depth, temperature, and light level data every 10 s (Mk10-AF) or 15 s (Mk10-PAT, miniPAT) to onboard memory. All tags recorded light data for geolocation purposes, and the Mk10-AF tag housed a Fastloc GPS receiver for acquiring high-resolution location information. Software in the tags summarized the high-resolution archived data into depth-temperature profiles at 8 depths (between minimum and maximum depth occupied for the summary period) for a 6, 12, or 24-h period depending on tag programming. These data were compiled into a single daily summary profile for data analysis. Tags also transmitted a summary of an individual's time of occupation within designated depth or temperature bins at 6, 12, or 24-h resolution that was also compiled into daily summaries. Depth and temperature bin number, resolution, and extent differed slightly among tag type and year of tag deployment, but all were compiled to encompass the same depth (<10, 10–25, 25–50, 50–200, 200–400, 400–1,000, >1,000 m) and temperature bins (<7, 7–9, 9–11, 11–13, 13–15, 15–17, 17–19, 19–21, 21–23, 23–25, >25°C) for subsequent analysis. Results from the compilation of this time-at-depth and time-at-temperature data represented percent time of each deployment day that an individual occupied each of the common depth or temperature bins (shown above). Seasons were delimited in the analyses by the respective solstice and equinox dates for a given year.
At pre-programmed dates during tag deployment (range of programmed deployment duration 129–361 days), tags were released from the animal using a corrosive burn wire. After the tags released and floated to the surface, summarized data were transmitted to Argos satellites until battery failure. Transmitted data were decoded with manufacturer software (WC-DAP 3.0, Wildlife Computers, Inc., Redmond, WA), and light-based geolocation estimates were calculated and evaluated using tag manufacturer software (WC-GPE2). All subsequent analyses were conducted in the R Statistical Environment (R Core Team, 2016).
Geolocation Methods
We estimated most probable tracks for PSAT-tagged basking sharks using the HMMoce package (Braun et al., 2018) for R (R Core Team, 2016). This approach leverages light-levels, SST, depth-temperature profiles, and maximum depth data recorded by PSAT tags, with empirical oceanographic data and model outputs, to construct likelihoods of the tagged individual's movements. Likelihoods are convolved in a spatially-gridded HMM that computes posterior probability distributions to estimate the most likely state (position and behavior) of the animal at each time point, which was daily in this study. Parameter estimation is performed on a 1° grid (for improved computation speed), and full model runs use a 0.25° grid. In double-tagging experiments, HMMoce was shown to recreate movement trajectories with mean pointwise error of 141 km (range 93–183 km, n = 4) based on light and SST data that represented only 25 and 50% of the deployment days, respectively (Braun et al., 2018), although the geolocation error will likely vary with oceanographic regime and animal behavior.
Briefly, HMMoce estimates location and behavior from electronic archival tags. This involves: (1) calculating spatially-gridded observation likelihoods at each time point based on tag and environmental data; (2) forming the state-space model and estimating model parameters; and (3) model selection and interpretation. At each daily time step, we calculate a likelihood of the animal's position L(xt) on the grid:
where 1:n indicates individual, observation-based likelihoods formed for each type of input data at each time point [e.g., LSST(xt)]
Observation-based likelihoods were derived from in situ SST, light-based longitude, and depth-temperature profile data collected by the tags, using five separate likelihood calculations as follows and filtered using a bathymetric mask. (1) An SST likelihood was generated for tag-based SST-values integrated according to an error term (±1%) and compared to remotely-sensed SST from daily optimally-interpolated SST (OI-SST, 0.25° resolution) fields (Reynolds et al., 2007; Banzon et al., 2016). (2) Light-based longitude likelihood was derived using estimates of longitude from GPE2 software (Wildlife Computers, Inc.), which facilitated visual checking of light curves. Depth-temperature profiles recorded by the tag were compared to (3) daily reanalysis model depth-temperature products from the HYbrid Coordinate Ocean Model (HYCOM, 0.08° resolution; Bleck, 2002; Chassignet et al., 2007), and (4) monthly climatological mean depth-temperature data from the World Ocean Atlas 2013 (0.25° resolution; Locarnini et al., 2013) at standard depth levels available in these products. Individual likelihood surfaces for each depth level were then multiplied together for an overall profile likelihood at that time point. (5) Ocean Heat Content (OHC) was obtained by integrating the heat content of the water column above the minimum daily temperature to the most shallow depth recorded by the tag for both the tag profiles and HYCOM fields (Luo et al., 2015).
All observation-based likelihoods were formed using integrated likelihood calculations (Le Bris et al., 2013). For example, daily SST likelihoods were constructed as:
where N is a normal probability distribution function, μz the remotely-sensed SST grid cell value, and σz the grid cell standard deviation. The same integration approach was performed on the other observation likelihoods. For 3D likelihoods, this approach was performed at each relevant standard depth level in the environmental dataset and integrated limits were tag-based minimum and maximum temperatures recorded (or predicted by linear regression) at that depth level. Standard deviation for all likelihood calculations was calculated with a “moving window” mean using the focal() function in the raster package (Hijmans, 2016) for R to incorporate ~0.25° of environmental data around each grid cell. Start and end locations and available GPS data (from the MK10-AF tag) were seeded as known positions in all model runs.
The resulting observation likelihoods (in various combinations; Table 1) were used in a two-step Bayesian state-space approach to estimate the posterior distribution of the state (in this case, a joint probability distribution of location and behavior at each time point). We considered “resident” and “migratory” behavior states that corresponded to fixed speeds of 0.4 m s−1 (34.5 km d−1) for residency (following Curtis et al., 2014) and an order of magnitude higher (4 m s−1, 345 km d−1) for migratory movements. These speeds represent maximum diffusion allowed per day (1,200 and 120,000 km2 d−1 for resident and migratory daily diffusion, respectively) and were represented by Gaussian kernels (see documentation for HMMoce::gausskern for more information) that were convolved with observation likelihoods at each time point. Probability distributions were first calculated forward in time using alternating time and data updates of the current state estimate using a HMM filter on the derived likelihood grid. Parameter estimation was performed using an iterative Expectation-Maximization framework (Woillez et al., 2016). The HMM smoother recursion was the final step that worked backwards in time using filtered state estimates and all available observation data to determine smoothed state estimates. This step provided the time marginal of the probability distributions based on observations (posterior distributions). Distributions are summed for each behavior state and time step to determine the most likely behavior state for each time step. HMMoce calculates the mean or mode of the posterior distribution grid, at each time step, to estimate the animal's most probable track. Model selection was performed using Akaike Information Criterion (AIC). Resulting most probable track estimates represented daily location and most likely behavior state at that time point. Cumulative track distances were calculated using great-circle distance calculations between estimated daily locations using the rdist.earth function in the fields (Nychka et al., 2015) package for R.
The posteriors were summed across behavior states for additional inference on seasonal habitat use, which were conceptually similar to a residency (see Equation 5, Pedersen et al., 2011) or utilization distribution (Royle and Dorazio, 2008). This approach was used to incorporate uncertainty around most probable track estimates that is included in the posteriors, as opposed to traditional utilization distribution calculations based on, for example, kernel density (e.g., Berumen et al., 2014).
Results
We tagged 57 basking sharks spanning sub-adult (~500–600 cm) and adult (>600–700 cm) life stages (range 549–762 cm males, 549–823 cm females) and both sexes (10 females, 3 males, 31 unknown). Forty-five (79%) of the 57 PSAT tags deployed between 2004 and 2011 reported. Eight tags released prematurely, and one of the tags had no useable data. Data from 37 of the remaining 44 tags contained sufficient information for further analysis (Table 1). These deployments averaged 234 days (SD 85 days, range 79–424 days). There was no evidence of tagging-induced mortality. Of the 35 tags that transmitted data (excluding two that were physically recovered), we received data representing 7% (median, range 1–44%), 26% (median, range 4–61%), and 52% (median, range 7–91%) of deployment days with light-based position estimates, SST, and depth-temperature profile data, respectively. The remaining two tags were physically recovered: one tag washed ashore in The Bahamas after 133 days at liberty and one was located on a beach in Rhode Island still attached to the deceased shark after a 78 day deployment. The full archival record was analyzed for these two deployments and contained light-based position estimates and SST data for 5–51 and 66–89% of deployment days, respectively, during which the animal occupied the surface (SST) or euphotic zone (light). Transmitted and archival profile data were available for more deployment days than either light-based position estimates or SST data in all but one of the reporting tags. One individual (B28) was tagged with a Fastloc GPS tag which reported 4 GPS snapshots over 3 days during winter (Dec. 22, 23, 26). These locations were considered known in the model runs for this individual, and no other usable GPS positions were acquired.
For a given tag, varying amounts of each data type were obtained due to behavioral variability and individual differences in data transmission. Model selection favored HYCOM-based profile likelihoods (Figure 1) in 34 of 37 track calculations. Of the remaining three individual geolocation analyses, one favored OHC-based profile likelihoods, one WOA-based profile likelihoods, and one model selection used only light and SST observations. Available light and SST data were not used in the selected model for four and six individual tag datasets, respectively (Table 1). Nearly all model outputs indicated the “migratory” behavior state was more likely once the tagged individual left the New England shelf (76% of off-shelf position estimates), and this behavior remained dominant throughout the Sargasso Sea region (77% of off-shelf position estimates). Shelf habitats near New England and from the Antillean Arc to the Amazon Delta were characterized by a higher likelihood (~50% of on-shelf position estimates) of “resident” behavior (e.g., slower, more tortuous movements).
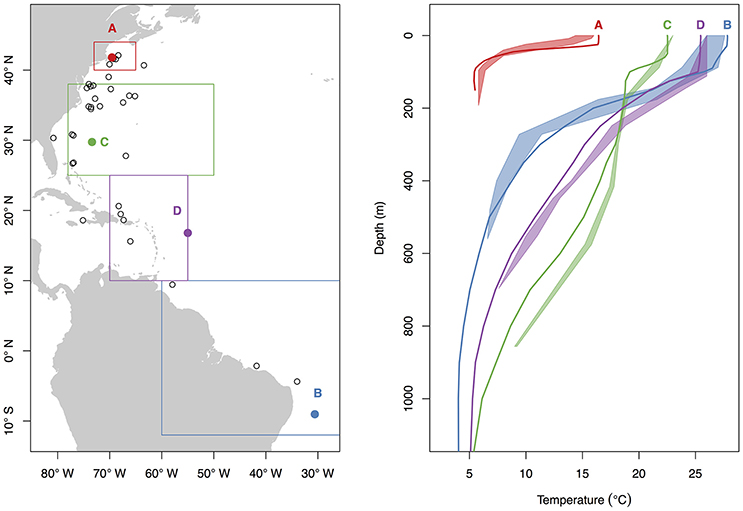
Figure 1. Example depth-temperature profile data from known pop-up locations of PSAT-tagged basking sharks. Selected, representative pop-up locations (color, Left) from distinct regions of the study area were used to compare tag-based depth-temperature profiles (shaded from minimum to maximum recorded profile temperatures, Right) to HYCOM profiles (lines, Right) from the same time and location. Black circles (Left) represent all tag pop-up locations in this study. Bounding boxes show the oceanographic regions discussed in the text, Figure 7, and Table 2 and correspond to New England (red), Sargasso Sea (green), Antillean Arc (purple) and South America (blue).
While all tags were deployed off the northeastern coast of the U.S., most probable tracks showed a wide range of individual movements (Figure 2). For individuals with sufficient data to perform the geolocation analysis (n = 34), track distances ranged from 4,009 to 17,387 km (mean 10,136 ± 3,988 SD) spanning 79–424 days (mean 207 ± 107 SD). Several of the sharks showed relatively directed, long-range movements south from the tagging location in New England to the Puerto Rico Trench (n = 4), Antillean Arc (n = 3), and Amazon Delta (n = 3) up to 17,387 km (6,200 km displacement) from the tagging location (Figure 2). Three individuals made transequatorial movements.
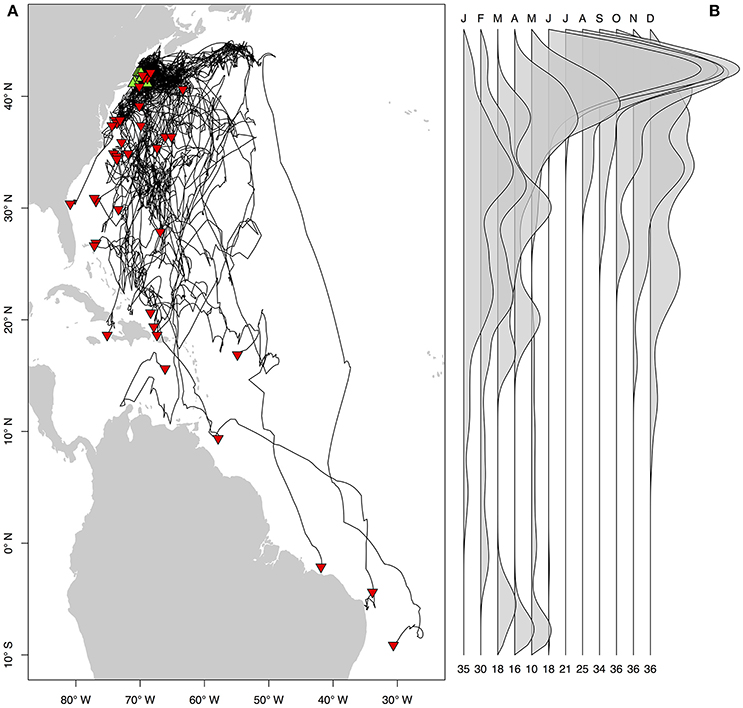
Figure 2. Most probable tracks (A) and latitude density by month (B) for 37 basking sharks satellite-tagged off New England during June through October of 2004–2011. Tracks are plotted as black lines, and green and red triangles represent tag and pop-up locations, respectively. Letters above the density plot indicate month (e.g., F = February), and numbers below indicate the number of individuals with tag data during that month.
Movements of tracked sharks demonstrated strong seasonality (Figures 2, 3) with individuals occupying coastal waters in high latitudes during the summer before moving south in fall (Figures 2, 3), and all but one individual (B26) departed New England by January. This individual remained along the shelf edge between New England and the Grand Banks for the winter and returned to the New England canyons by late February (B26 in Figure 4). All other tagged sharks overwintered in habitats as close as the Sargasso Sea and as far as the northeastern coast of Brazil before beginning to return to New England waters in late spring and early summer (Figures 2, 3). Seven tags were deployed for >300 days, including one for 423 days, and five of them transmitted sufficient data for track estimation. Six of these seven tags popped up in New England waters ~1 year after tagging (e.g. B20, B22 in Figure 5A), while the remaining tag reported near the Amazon Delta and represented the furthest southerly movements observed in this study (Figures 2, 5). Eighteen tags exhibited deployment durations >250 days, ten of which (59%) exhibited return migrations to the NWA, including one pop-up location 60 km from the tagging location 1 year later (B21). There was no significant difference in mean track distance between males and females (t-test, p = 0.4633), although male sample size was low (n = 3), and a linear regression analysis found no significant relation between shark size and extent of movement (p = 0.27, R2 = 0.05) or minimum latitude occupied (p = 0.48, R2 = 0.02).
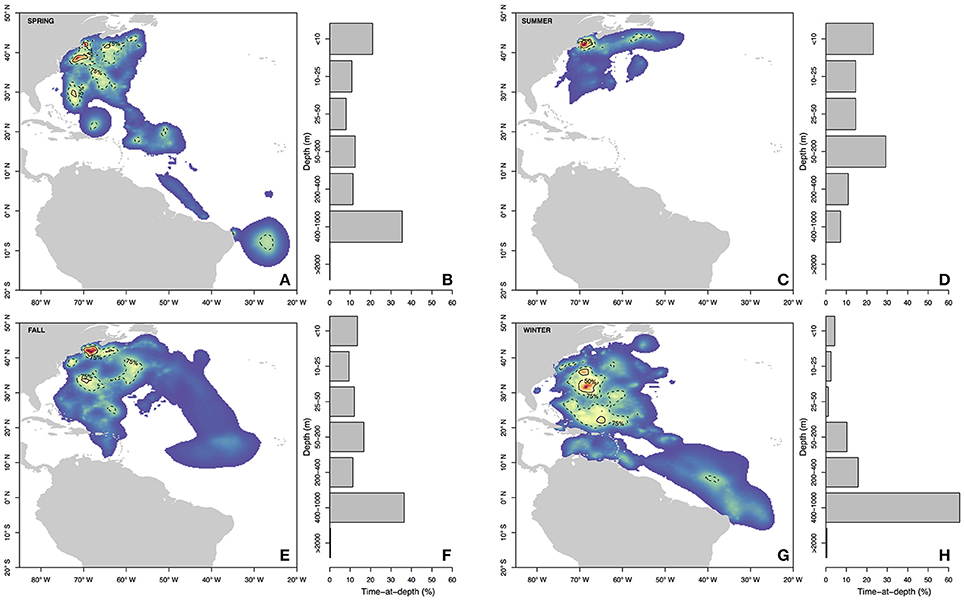
Figure 3. Seasonal residency distributions (A,C,E,G) and cumulative time-at-depth (B,D,F,H) for spring (A,B), summer (C,D), fall (E,F), and winter (G,H). Residency distributions were calculated using the HMMoce package for R. Contour lines represent 50 and 75% of occupation for a given season as depicted by solid and dashed contours, respectively.
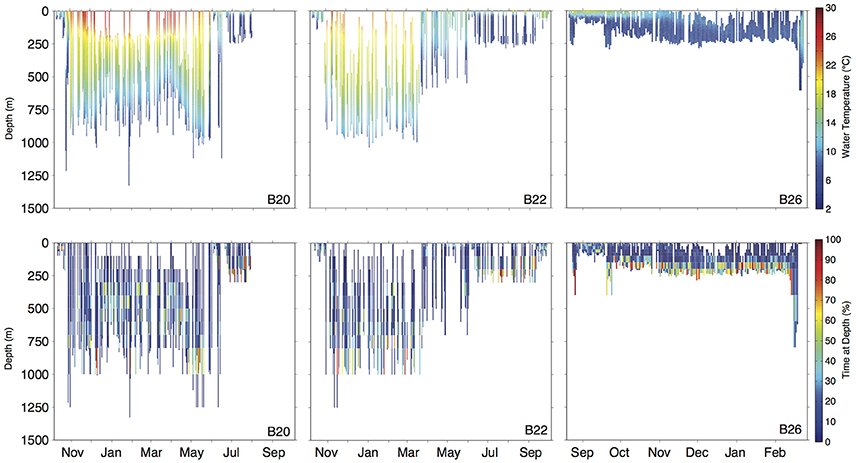
Figure 4. Daily depth-temperature profiles (row 1) and time-at-depth profiles (row 2) for three representative basking sharks (tracks plotted in Figure 5A). Note differing time scale (x-axis) among individuals.
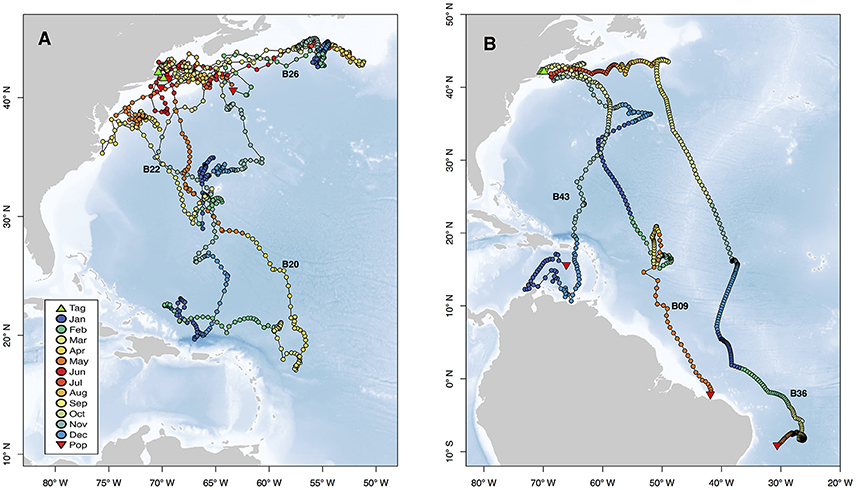
Figure 5. Movements of selected individuals demonstrating representative behaviors exhibited by sharks in this study. Two selected individuals exhibited site fidelity to Cape Cod (B20, B22) and one individual overwintered near Newfoundland (B26, A). The variety of long distance movements are represented by three individuals with pop-up locations from the eastern Caribbean to the SE coast of Brazil (B). Tracks are plotted as points colored by month, and green and red triangles represent tag and pop-up locations, respectively. Text labels correspond to Shark ID in Table 1, and blue background indicates bathymetry of the region. Vertical habitat use of these selected individuals is shown in Figures 4, 6.
Long-distance migrations often co-occurred with large vertical excursions and led to occupation of several distinct water masses throughout the year. Binned vertical histogram data (Figure 3) were used to quantify where in the water column sharks tended to frequent. Overall, extensive vertical excursions characterized basking shark dive behavior when an individual left the continental shelf region of the eastern US (Figures 3, 4, 6). Twenty-one individuals spent time below 1,000 m, and it was likely that only limitations in earlier tag technology (maximum depth capability of 980 m) prevented those individuals' tags from recording similar behavior. The maximum depth recorded by a tag (shark B42) was 1,504 m and recorded temperatures at depth in this study ranged from 4.2 to 29.9°C. Recorded SST-values from all individuals ranged from 7.4 to 29.9°C (median 18.3°C). Overall, 63% of basking shark depth-temperature data was 8–18°C, 87% was between 6 and 20°C, and all individuals made occasional forays into temperatures well-outside those bounds (Figure 7). In fact, one individual (B26) remained at northern latitudes (from Cape Cod to the Grand Banks) during winter and experienced <12°C ambient water temperatures for >3 months (B26 in Figure 4; range 4.8–12°C from Nov 1 to Feb 15).
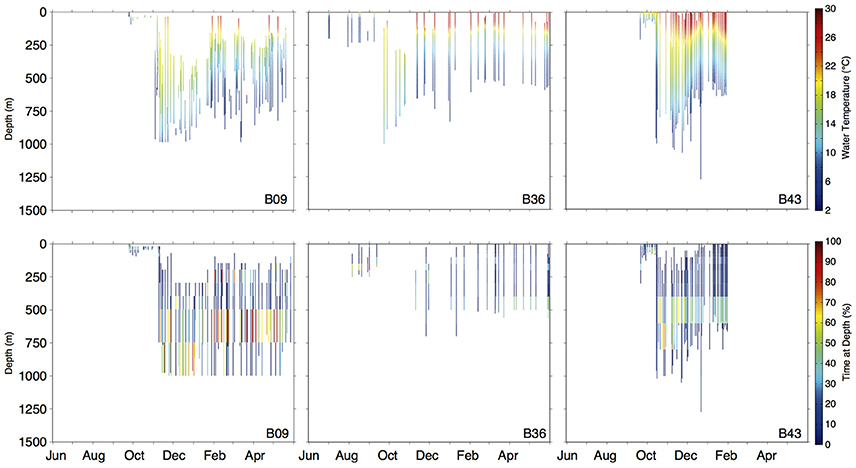
Figure 6. Daily depth-temperature profiles (row 1) and time-at-depth profiles (row 2) for three representative basking sharks (tracks plotted in Figure 5B). Note differing time scales (x-axis) among individuals.
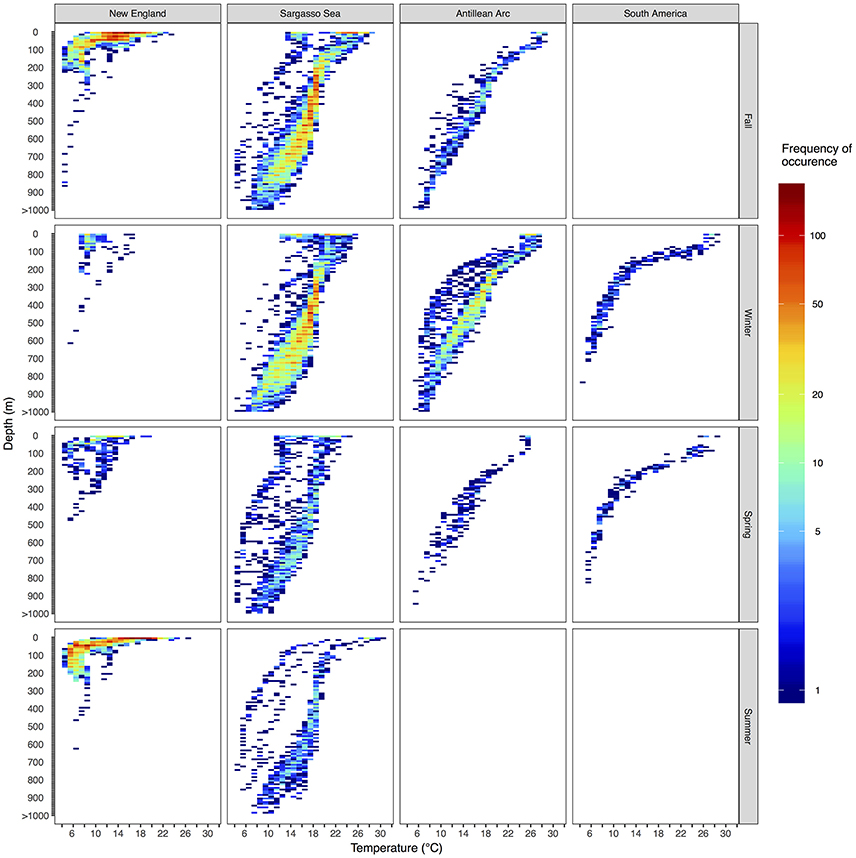
Figure 7. Vertical habitat envelopes of basking sharks. Temperature and depth data are binned every 1° and 25 m, respectively. Depths deeper than 1,000 m are added to the last bin. The bounds for each region are shown as boxes in Figure 1. Note the color bar is on a log scale. Summary statistics for each region and season are shown in Table 2, and blank panels indicate no data were collected for that region-season combination.
Vertical habitat envelopes described the distinct water masses across the study area (from coastal New England to open ocean off Brazil), their depth-temperature characteristics, and the vertical behavior observed in each water mass (Figure 7, Table 2). Generally, individuals spent much of their time in the epipelagic zone (<200 m) during summer months at northern temperate latitudes where temperatures were typically <20°C (Figures 4, 6, 7). However, during the fall, the majority of tagged individuals transitioned from the epipelagic orientation of the summer months to residency in the mesopelagic zone during the winter in which they cumulatively spent >60% of time between 400 and 1,000 m (Figures 3, 4, 6). Based on depth-temperature profile data, sharks remained below the euphotic zone for 27% (median; range 0–90%) of fall, winter and spring deployment days for which data existed, and this behavior exhibited no relationship with individual size or sex, although male sample size was low (n = 3). Temperature profiles from these periods of mesopelagic occupation indicated this behavior occurred largely in the Sargasso Sea where warm (14–20°C) water penetrates deep in to the water column (profile C in Figures 1, 7) resulting in relatively warm water at depth (e.g., B20 and B22 in Figures 6, 7). However, some sharks overwintered further south in the Guyana Basin and off the Brazilian shelf as indicated by warmer surface temperatures and a stronger temperature gradient with depth (e.g., profile B in Figure 1, B36 in Figures 6, 7). Sharks generally inhabited warmer waters throughout winter at low latitudes, despite prolonged deep-water occupation, than the surface waters that they inhabited during summer months (Figure 7, Table 2).
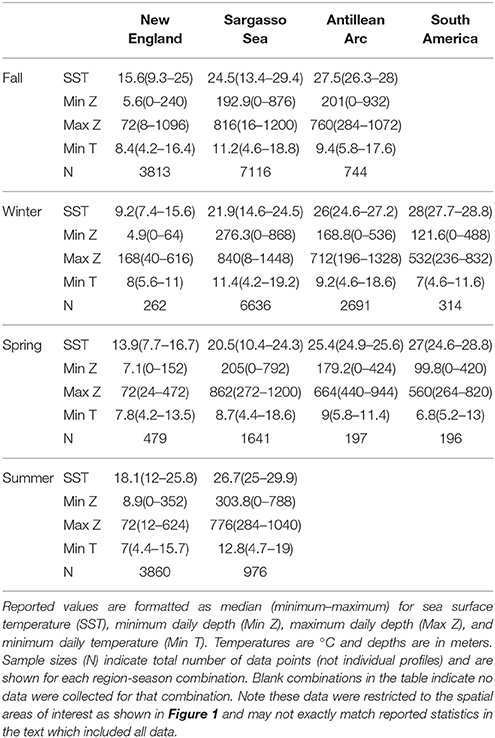
Table 2. Summary statistics for vertical habitat envelopes in Figure 7 by region and season.
Shark B22 provided a good example of the distinct water masses traversed during a 1-year deployment, with a complete round trip migration starting and ending in the tagging region (Figures 4, 5). This individual occupied a well-mixed, cool surface layer in the Gulf of Maine during October before moving through the Gulf Stream and into the northern Sargasso Sea in November. This individual occupied the northern Sargasso from December to March before moving back into a more uniformly cool layer in April and May near Cape Hatteras. By June, both the estimated track and water characteristics indicate this individual had returned to the shelf-edge waters near New England and onto the shelf near Cape Cod by late September (Figure 4).
Discussion
It is increasingly clear that pelagic fishes throughout the global ocean conduct long-range migratory movements (e.g., Block et al., 2011; Skomal et al., 2017) and connect the surface and deep ocean through meso- and bathy-pelagic dive behavior (Braun et al., 2014; Thorrold et al., 2014). The basking sharks tagged in the present study were no exception, making some of the longest horizontal movements of any ocean species tagged to date (Block et al., 2005; Bonfil, 2005; Hays et al., 2006; Skomal et al., 2017). Tagged individuals moved through several distinct water masses of the western Atlantic, and spent significant time in the mesopelagic, demonstrating the ability of basking sharks to traverse a wide range of environments from the surface to deep ocean across a 25°C temperature range.
Movements through distinct water masses often coincided with varying periods of deep water occupation. Nearly all tagged individuals demonstrated a shift from residency in surface waters to deep water occupation in the meso- and bathy-pelagic during colder months that may explain the apparent disappearance of basking sharks during winter (Parker and Boeseman, 1954). While our results corroborate previous studies that suggest seasonally variable dive behavior (Sims et al., 2003) and southward migration during winter (Doherty et al., 2017), sharks in this study made much more extensive movements throughout the open ocean than those observed in similar studies elsewhere (Doherty et al., 2017) and spent up to several months at mesopelagic depths. Sharks tagged in the northeast Atlantic (NEA) did make dives to similar maximum depths (~50% of tagged individuals dove below 1,000 m; Doherty et al., 2017) but averaged >80% of time above 200 m and <10% deeper than 500 m (Sims et al., 2003; Doherty et al., 2017). The mesopelagic occupation observed in this study suggests this behavior is much more ubiquitous among NWA basking sharks as they move throughout the open ocean than their NEA conspecifics that remain oriented to the shelf. This apparent difference and may be a product of the oceanography experienced (e.g., warm, homogenous depth-temperature profiles in the Sargasso Sea) by these individuals in the open ocean of the NWA.
The other main difference in behavior among these regions is the winter migration strategy. NEA basking sharks moved south from Ireland and the UK to the Bay of Biscay, but despite tagging 70 basking sharks with satellite tags, only one individual traversed >20° of latitude after summer occupation of the far northern latitudes (Doherty et al., 2017). In contrast, winter movements at and beyond this scale were more commonly observed in the NWA (Skomal et al., 2004 and this study). These observed movements demonstrate that tropical environments do not pose a barrier to basking shark movements and refute the suggestion that this species is largely restricted to temperate latitudes (Sims, 1999; Sims et al., 2003; Gore et al., 2008; Doherty et al., 2017).
The long-distance movements by basking sharks in this study are likely driven, at least in part, by the dynamic oceanographic environment of the western Atlantic Ocean. The NWA, in particular, is punctuated by strong seasonal fluxes in pelagic primary productivity (Miller and Wheeler, 2012) and temperature (Talley, 2011). The warm water and high productivity attract many species to the temperate NWA during summer (e.g., basking sharks, Curtis et al., 2014; white sharks, Skomal et al., 2017). While it is clear basking sharks are able to tolerate sub-12°C water for months at a time (B26 in Figure 4; Sims, 2008), individuals in this study spent much of their time overwintering in warm, mesopelagic waters. In fact, as a whole, sharks spent more time in warmer water during deep occupation periods in winter as they moved south than they did during summer. While the function of this deep occupation is unknown, the Sargasso Sea is a relatively stable, warm water mass during winter months and may host prey opportunities for basking sharks in the mesopelagic, including a substantial deep scattering layer that overlaps with basking shark depth use (400–600 m; Irigoien et al., 2014) and potentially co-occurring anguillid eel spawning aggregations (Wysujack et al., 2015). These migrations away from the northern winter may also be associated with hotspots of relatively high production at lower latitudes (e.g., Brazilian shelf; Mourato et al., 2014). Movements in this study demonstrated orientation to shelf edge habitats, particularly along the northern coast of Brazil during winter, that likely host persistent fronts (Le Fèvre, 1987; Sims, 2008) and thus relatively high primary production even at low latitude. While basking sharks have been shown to orient to persistent seasonal fronts (Miller et al., 2015), most individual tracks in this study demonstrated intense occupation of near-shelf regions that was punctuated by lengthy offshore excursions. Thus, perhaps the combination of favorable growth energetics associated with warm overwintering habitat (relative to overwintering at temperate latitudes) and food availability drive southerly movements away from temperate latitudes for winter and the mesopelagic occupation in (sub)tropical waters observed here. However, further work is needed to test the role of energetics and food resources as drivers of basking shark migrations.
Movement patterns of tagged basking sharks may also be associated with reproduction (Skomal et al., 2004). Basking sharks are commonly observed along the northeastern US during summer, presumably to forage; however, mating may also occur during this period while sharks are aggregated and potential courtship behavior has been observed (Wilson, 2004). Subsequent movements into the tropical Atlantic and occupation of mesopelagic depths may be a predator avoidance or parturition strategy as these environments are characterized by mild, stable conditions. This may further explain the lack of observations of pregnant females despite prolonged coastal fisheries in the NEA (Sims, 2008). Thus, while we did not observe significant differences in movement between sexes, the females that undertake long-range southerly migrations may be exploiting stable environmental conditions for gestation and parturition, and the stable habitat and relative lack of predators may provide suitable nursery habitat for neonates. The presence of <2.5 m TL basking sharks in the Gulf of Mexico during spring (Hoffmayer et al., 2011) lends some support for this hypothesis as it suggests that parturition is occurring during winter months in tropical or subtropical waters. The wide variation in movement patterns (>50° range in latitude) suggests these migrations were not driven by a localized mating event somewhere in the Atlantic. Unfortunately, we were unable to sex a significant portion of tagged individuals in this study due to tag application methods, and the limited sample size of sexed individuals indicates no difference in movements between sexes that may further clarify reproductive hypotheses.
Highly variable dive behavior, including extended forays away from the photic zone, exhibited by basking sharks made traditional light-based geolocation difficult in our study. Thus, we employed a recent advance (based on extensive work by Pedersen et al., 2008, 2011) in geolocation analysis methods to supplement missing light data with other forms of data recorded on the tag (Braun et al., 2018). Depth-temperature profiles, in particular, provided substantially more information to be used for geolocation than light and SST data used in traditional geolocation approaches. These profiles provided observations that were used for geolocation when tagged individuals were away from the surface and the tags were unable to collect light and SST metrics. In addition, the profile data yielded diagnostic depth-temperature profiles that were compared to modeled or in situ oceanographic data to reduce geolocation error (Braun et al., 2018). By using the high-resolution (0.08°) HYCOM reanalysis product, we were able to leverage the synoptic daily coverage of an oceanographic model that incorporates available in situ data to improve geolocation estimates. While previous tracking studies have highlighted the potential for error when using HYCOM outputs to represent the extremely dynamic Gulf Stream eddy field (Braun et al., 2018), the majority of basking sharks in this study moved latitudinally and spent relatively little time in the most dynamic regions of the NWA.
Model outputs also indicated a higher likelihood of “resident-like” movements in productive shelf habitats around New England and off the Antilles and South America. It is likely these restricted movements are indicative of foraging in these relatively productive shelf habitats (Mourato et al., 2014). In contrast, migratory movements (4 m s−1) were more likely in pelagic waters, including during overwintering in the Sargasso Sea. Because of model formulation, the higher speeds that we classified as “migratory” may also be more likely, overall, due to the scale at which the observation likelihoods are formulated. For instance, if tag-based SST corresponds to remotely sensed SST over a broad area (e.g., Sargasso Sea), we may expect migratory behavior to be more likely than the resident behavior that would result from more constrained likelihoods (e.g., tag-based SST matching more closely to a confined region). While this approach is significantly more computationally-intensive than traditional light-based geolocation approaches (see Table S2 in Braun et al., 2018), comparing tag data directly to in situ and/or modeled oceanographic profiles from the same time frame results in a more realistic representation of shark movements and the oceanographic environment they inhabit.
The basking shark tracks documented here represent the largest scale movements reported for basking sharks, including one individual's estimated track distance covering >17,000 km, and the deepest dive recorded by a basking shark (1,504 m). The observed tracks further expand the known range of basking sharks reported by Skomal et al. (2004). We recorded three individuals making transequatorial migrations yet no tagged individuals made significant longitudinal movements toward the NEA. North-south movements were, therefore, much more common in the portion of the NWA population sampled here than east-west movements that may, in turn, limit the exchange of genetic material between the NWA and NEA. In contrast, Gore et al. (2008) found that one of two satellite-tagged basking sharks moved from the Isle of Man to the eastern coast of Newfoundland in <3 months. In addition, there is little evidence for genetic structuring of basking sharks in the Atlantic (Hoelzel et al., 2006), suggesting sufficient connectivity to at least maintain panmixia between NEA and NWA populations.
Conclusion
The current reliance on light levels for geolocation of many marine fishes renders geolocation impossible when tagged individuals spend significant time below the euphotic zone. Tagged sharks in this study spent significant time at mesopelagic depths, particularly during winter, at which light levels were too low for geolocation. We supplemented light-based geolocation with position estimates generated by matching depth-temperature profiles collected by the sharks' tags to in situ or modeled oceanographic profiles. Our approach provided considerably more information on movement patterns than are typically available from PSAT data with limited light-level information, providing a valuable method for studying marine species that do not frequent the euphotic zone. The resulting basking shark tracks demonstrated large-scale movements up to over 17,000 km from Cape Cod to southern Brazil, winter residency in New England waters, and a range of behaviors in between. Most individuals exhibited seasonal movements into the Sargasso Sea during winter and multiple deployments of sufficient duration captured the return migration to Cape Cod the subsequent summer. Basking sharks in this study traversed multiple distinct water masses through the western Atlantic and exhibited basin-scale movements that warrant international cooperation for adequate management of this species. Winter habitat use was characterized by occupation of mesopelagic waters at low latitudes during which individuals often left the surface for months at a time. This cryptic deep-water overwintering provides impetus for further study of this poorly understood species.
Author Contributions
GS and ST: designed the study and conducted the tagging; CB: performed the analysis and wrote the manuscript. All authors contributed ideas throughout the process and read, commented on, and approved the final manuscript.
Conflict of Interest Statement
The authors declare that the research was conducted in the absence of any commercial or financial relationships that could be construed as a potential conflict of interest.
Acknowledgments
We thank B. Galuardi and C. H. Lam for contributing analysis code, and H. Dewar, U. Thygesen and I. Jonsen for valuable feedback on the manuscript. We gratefully acknowledge funding from the US National Science Foundation (OCE 0825148), the National Aeronautics and Space Administration (NNS06AA96G), the Massachusetts Environmental Trust, and the Federal Aid in Sport Fish Restoration Program. Computational support was provided by the AWS Cloud Credits for Research program. CB was funded by the Martin Family Society of Fellows for Sustainability Fellowship at the Massachusetts Institute of Technology, the Grassle Fellowship and Ocean Venture Fund at the Woods Hole Oceanographic Institution, and the NASA Earth and Space Science Fellowship. Funding for the development of HYCOM has been provided by the National Ocean Partnership Program and the Office of Naval Research. Data assimilative products using HYCOM are funded by the U.S. Navy. Computer time for HYCOM was made available by the DoD High Performance Computing Modernization Program.
References
Aarestrup, K., Okland, F., Hansen, M. M., Righton, D., Gargan, P., Castonguay, M., et al. (2009). Oceanic spawning migration of the European eel (Anguilla anguilla). Science 325, 1660–1660. doi: 10.1126/science.1178120
Banzon, V., Smith, T. M., Mike Chin, T., Liu, C., and Hankins, W. (2016). A long-term record of blended satellite and in situ sea-surface temperature for climate monitoring, modeling and environmental studies. Earth Syst. Sci. Data 8, 165–176. doi: 10.5194/essd-8-165-2016
Berumen, M. L., Braun, C. D., Cochran, J. E., Skomal, G. B., and Thorrold, S. R. (2014). Movement patterns of juvenile whale sharks tagged at an aggregation site in the red sea. PLoS ONE 9:e103536. doi: 10.1371/journal.pone.0103536
Bleck, R. (2002). An oceanic general circulation model framed in hybrid isopycnic-Cartesian coordinates. Ocean Model. 4, 55–88. doi: 10.1016/S1463-5003(01)00012-9
Block, B. A., Jonsen, I. D., Jorgensen, S. J., Winship, A. J., Shaffer, S. A., Bograd, S. J., et al. (2011). Tracking apex marine predator movements in a dynamic ocean. Nature 475, 86–90. doi: 10.1038/nature10082
Block, B. A., Teo, S. L., Walli, A., Boustany, A., Stokesbury, M. J., Farwell, C. J., et al. (2005). Electronic tagging and population structure of Atlantic bluefin tuna. Nature 434, 1121–1127. doi: 10.1038/nature03463
Bonfil, R. (2005). Transoceanic migration, spatial dynamics, and population linkages of white sharks. Science 310, 100–103. doi: 10.1126/science.1114898
Braun, C. D., Galuardi, B., and Thorrold, S. R. (2018). HMMoce: An R package for improved geolocation of archival-tagged fishes using a hidden Markov method. Methods Ecol. Evol. doi: 10.1111/2041-210X.12959
Braun, C. D., Kaplan, M. B., Horodysky, A. Z., and Llopiz, J. K. (2015a). Satellite telemetry reveals physical processes driving billfish behavior. Anim. Biotelemetry 3:2. doi: 10.1186/s40317-014-0020-9
Braun, C. D., Skomal, G. B., Thorrold, S. R., and Berumen, M. L. (2014). Diving behavior of the reef manta ray links coral reefs with adjacent deep pelagic habitats. PLoS ONE 9:e88170. doi: 10.1371/journal.pone.0088170
Braun, C. D., Skomal, G. B., Thorrold, S. R., and Berumen, M. L. (2015b). Movements of the reef manta ray (Manta alfredi) in the Red Sea using satellite and acoustic telemetry. Mar. Biol. 162, 2351–2362. doi: 10.1007/s00227-015-2760-3
Chaprales, W., Lutcavage, M., Brill, R., Chase, B., and Skomal, G. (1998). Harpoon method for attaching ultrasonic and “Popup” satellite tags to giant bluefin tuna and large palegic fishes. Mar. Technol. Soc. J. 32:104.
Chassignet, E. P., Hurlburt, H. E., Smedstad, O. M., Halliwel, G. R., Hogan, P. J., Wallcraft, A. J., et al. (2007). The HYCOM (HYbrid Coordinate Ocean Model) data assimilative system. J. Mar. Syst. 65, 60–83. doi: 10.1016/j.jmarsys.2005.09.016
Compagno, L. J. V. (1984). FAO Species Catalogue Vol. 4, Part 2 Sharks of the World: An Annotated and Illustrated Catalogue of Shark Species Known to Date. Food and Agriculture Organization of the United Nations.
Curtis, T. H., Zeeman, S. I., Summers, E. L., Cadrin, S. X., and Skomal, G. B. (2014). Eyes in the sky: linking satellite oceanography and biotelemetry to explore habitat selection by basking sharks. Anim. Biotelemetry. 2:12. doi: 10.1186/2050-3385-2-12
Dewar, H., Prince, E. D., Musyl, M. K., Brill, R. W., Sepulveda, G., Luo, J., et al. (2011). Movements and behaviors of swordfish in the Atlantic and Pacific Oceans examined using popup satellite archival tags. Fish. Oceanogr. 20, 219–241. doi: 10.1111/j.1365-2419.2011.00581.x
Doherty, P. D., Baxter, J. M., Gell, F. R., Godley, B. J., Graham, R. T., Hall, G., et al. (2017). Long-term satellite tracking reveals variable seasonal migration strategies of basking sharks in the north-east Atlantic. Sci. Rep. 7:42837. doi: 10.1038/srep42837
Dulvy, N. K., Baum, J. K., Clarke, S., Compagno, L. J. V., Compagno, E., Domingo, A., et al. (2008). You can swim but you can't hide: the global status and conservation of oceanic pelagic sharks and rays. Aquat. Conserv. Mar. Freshw. Ecosyst. 18, 459–482. doi: 10.1002/aqc.975
Ferretti, F., Worm, B., Britten, G. L., Heithaus, M. R., and Lotze, H. K. (2010). Patterns and ecosystem consequences of shark declines in the ocean. Ecol. Lett. 13, 1055–1071. doi: 10.1111/j.1461-0248.2010.01489.x
Francis, M., and Duffy, C. (2002). Distribution, seasonal abundance and bycatch of basking sharks (Cetorhinus maximus) in New Zealand, with observations on their winter habitat. Mar. Biol. 140, 831–842. doi: 10.1007/s00227-001-0744-y
Galuardi, B., Royer, F., Golet, W., Logan, J., Neilson, J., and Lutcavage, M. (2010). Complex migration routes of Atlantic bluefin tuna (Thunnus thynnus) question current population structure paradigm. Can. J. Fish. Aquat. Sci. 67, 966–976. doi: 10.1139/F10-033
Gore, M. A., Rowat, D., Hall, J., Gell, F. R., and Ormond, R. F. (2008). Transatlantic migration and deep mid-ocean diving by basking shark. Biol. Lett. 4, 395–398. doi: 10.1098/rsbl.2008.0147
Hays, G. C., Hobson, V. J., Metcalfe, J. D., Righton, D., and Sims, D. W. (2006). Flexibleforaging movements of leatherback turtles across the north atlantic ocean. Ecology 87, 2647–2656. doi: 10.1890/0012-9658(2006)87[2647:FFMOLT]2.0.CO;2
Hill, R. D., and Braun, M. J. (2001). “Electronic Tagging and Tracking in Marine Fisheries,” in Proceedings of the Symposium on Tagging and Tracking Marine Fish with Electronic Devices (Dordrecht: Springer). doi: 10.1007/978-94-017-1402-0_17
Hoelzel, A. R., Shivji, M. S., Magnussen, J., and Francis, M. P. (2006). Low worldwide genetic diversity in the basking shark (Cetorhinus maximus). Biol. Lett. 2, 639–642. doi: 10.1098/rsbl.2006.0513
Hoffmayer, E. R., Driggers, W. B., Franks, J. S., Hanisko, D. S., Rofferet, M. A., and Cavitt, L. E (2011). Recent occurrences of basking sharks, Cetorhinus maximus (Chondrichthyes: Cetorhinidae), in the Gulf of Mexico. Mar. Biodivers. Rec. 4:e87. doi: 10.1017/S1755267211000844
Irigoien, X., Klevjer, T. A., Røstad, A., Martinez, U., Boyra, G., Acu-a, J. L., et al. (2014). Large mesopelagic fishes biomass and trophic efficiency in the open ocean. Nat. Commun. 5:3271. doi: 10.1038/ncomms4271
Lam, C. H., Nielsen, A., and Sibert, J. R. (2010). Incorporating sea-surface temperature to the light-based geolocation model TrackIt. Mar. Ecol. Prog. Ser. 419, 71–84. doi: 10.3354/meps08862
Le Bris, A., Fréchet, A., and Wroblewski, J. S. (2013). Supplementing electronic tagging with conventional tagging to redesign fishery closed areas. Fish. Res. 148, 106–116. doi: 10.1016/j.fishres.2013.08.013
Le Fèvre, J. (1987). Aspects of the biology of frontal systems. Adv. Mar. Biol. 23, 163–299. doi: 10.1016/S0065-2881(08)60109-1
Locarnini, R. A., Mishonov, A. V., Antonov, J. I., Boyer, T. P., Garcia, H. E., and Baranova, O. K. (2013). World Ocean Atlas 2013, Vol. 1, Temperature. NOAA Atlas NESDIS 73, 40.
Luo, J., Ault, J. S., Shay, L. K., Hoolihan, J. P., Prince, E. D., Brown, C. A., et al. (2015). Ocean heat content reveals secrets of fish migrations. PLoS ONE 10:e0141101. doi: 10.1371/journal.pone.0141101
Miller, P. I., Scales, K. L., Ingram, S. N., Southall, E. J., and Sims, D. W. (2015). Basking sharks and oceanographic fronts: quantifying associations in the north-east Atlantic. Funct. Ecol. 29, 1099–1109. doi: 10.1111/1365-2435.12423
Mourato, B. L., Hazin, F., Bigelow, K., Musyl, M., Carvalho, F., and Hazin, H. (2014). Spatio-temporal trends of sailfish, Istiophorus platypterus catch rates in relation to spawning ground and environmental factors in the equatorial and southwestern Atlantic Ocean. Fish. Oceanogr. 23, 32–44. doi: 10.1111/fog.12040
Nychka, D., Furrer, R., Paige, J., and Sain, S. (2015). Fields: Tools for Spatial Data. R package version 9.0. Boulder, CO: University Corporation for Atmospheric Research. Available online at: www.image.ucar.edu/fields
Parker, H. W., and Boeseman, M. (1954). The basking shark, Cetorhinus maximus, in winter. J. Zool. 124, 185–194 doi: 10.1111/j.1096-3642.1954.tb01487.x
Pedersen, M. W., Patterson, T. A., Thygesen, U. H., and Madsen, H. (2011). Estimating animal behavior and residency from movement data. Oikos 120, 1281–1290. doi: 10.1111/j.1600-0706.2011.19044.x
Pedersen, M. W., Righton, D., Thygesen, U. H., and Andersen, H. (2008). Geolocation of North Sea cod (Gadus morhua) using hidden Markov models and behavioural switching. Can. J. Fish. Aquat. Sci. 65, 2367–2377. doi: 10.1139/F08-144
Peklova, I., Hussey, N. E., Hedges, K. J., Treble, M. A., and Fisk, A. (2012). Depth and temperature preferences of the deep-water flatfish Greenland halibut Reinhardtius hippoglossoides in an Arctic marine ecosystem. Mar. Ecol. Prog. Ser. 467:193. doi: 10.3354/meps09899
Priede, I. G. (1984). A basking shark (Cetorhinus maximus) tracked by satellite together with simultaneous remote sensing. Fish. Res. 2, 201–216. doi: 10.1016/0165-7836(84)90003-1
R Core Team. (2016). R: A Language and Environment for Statistical Computing. Vienna: R Foundation for Statistical Computing.
Reynolds, R. W., Smith, T. M., Liu, C., Chelton, D. B., Casey, K. S., and Schlax, M. G. (2007). Daily high-resolution-blended analyses for sea surface temperature. J. Clim. 20, 5473–5496. doi: 10.1175/2007JCLI1824.1
Royle, J. A., and Dorazio, R. M. (2008). Hierarchical Modeling and Inference in Ecology: The Analysis of Data from Populations, Metapopulations and Communities. London: Academic Press.
Sims, D. W. (1999). Threshold foraging behaviour of basking sharks on zooplankton: life on an energetic knife-edge? Proc. R. Soc. Lond. B Biol. Sci. 266, 1437–1443. doi: 10.1098/rspb.1999.0798
Sims, D. W. (2008). Sieving a Living: A Review of the Biology, Ecology and Conservation Status of the Plankton-Feeding Basking Shark Cetorhinus Maximus. Adv. Mar. Biol. 54, 171–220. doi: 10.1016/S0065-2881(08)00003-5
Sims, D. W., Southall, E. J., Richardson, A. J., and Southall, E. J. (2003). Seasonal movements and behaviour of basking sharks from archival tagging: no evidence of winter hibernation. Mar. Ecol. Prog. Ser. 248, 187–196. doi: 10.3354/meps248187
Sims, D. W., Witt, M. J., Richardson, A. J., Southall, E. J., Reid, P., and Metcalfe, J. D. (2006). Encounter success of free-ranging marine predator movements across a dynamic prey landscape. Proc. R. Soc. B Biol. Sci. 273, 1195–1201. doi: 10.1098/rspb.2005.3444
Skomal, G. B., Braun, C. D., Chisholm, J. H., and Thorrold, S. R. (2017). Movements of the white shark Carcharodon carcharias in the North Atlantic Ocean. Mar. Ecol. Prog. Ser. 580, 1–16. doi: 10.3354/meps12306
Skomal, G. B., Wood, G., and Caloyianis, N. (2004). Archival tagging of a basking shark, Cetorhinus maximus, in the western North Atlantic. J. Mar. Biol. Assoc. United Kingdom 84, 795–799.
Squire, J. L. Jr (1990). Distribution and apparent abundance of the basking shark, Cetorhinus maximus, off the central and southern California coast, 1962-85. Mar. Fish. Rev. 52, 8–11.
Templeman, W. (1963). Distribution of Sharks in the Canadian Atlantic: With Special Reference to Newfoundland Waters. Fisheries Research Board of Canada.
Thorrold, S. R., Afonso, P., Fontes, J., Braun, C. D., Santos, R. S., Skomal, G. B., et al. (2014). Extreme diving behavior in devil rays link surface waters and the deep ocean. Nat. Commun. 5:4274. doi: 10.1038/ncomms5274
Werry, J. M., Planes, S., Berumen, M. L., Lee, K. A., Braun, C. D., and Clua, E. (2014). Reef-fidelity and migration of tiger sharks, galeocerdo cuvier, across the coral Sea. PLoS ONE 9:e83249. doi: 10.1371/journal.pone.0083249
Wilson, S. G. (2004). Basking sharks (Cetorhinus maximus) schooling in the southern Gulf of Maine. Fish. Oceanogr. 13, 283–286. doi: 10.1111/j.1365-2419.2004.00292.x
Witt, M. J., Hardy, T., Johnson, L., McClellan, C. M., Pikesley, S. K., Ranger, S., et al. (2012). Basking sharks in the northeast Atlantic: spatio-temporal trends from sightings in UK waters. Mar. Ecol. Prog. Ser. 459, 121–134. doi: 10.3354/meps09737
Woillez, M., Fablet, R., Ngo, T. T., Lalire, M., Lazure, P., and de Pontuala, H. (2016). A HMM-based model to geolocate pelagic fish from high-resolution individual temperature and depth histories: European sea bass as a case study. Ecol. Modell. 321, 10–22. doi: 10.1016/j.ecolmodel.2015.10.024
Keywords: movement ecology, satellite archival telemetry, migration, mesopelagic, oceanographic modeling, site fidelity
Citation: Braun CD, Skomal GB and Thorrold SR (2018) Integrating Archival Tag Data and a High-Resolution Oceanographic Model to Estimate Basking Shark (Cetorhinus maximus) Movements in the Western Atlantic. Front. Mar. Sci. 5:25. doi: 10.3389/fmars.2018.00025
Received: 28 September 2017; Accepted: 18 January 2018;
Published: 08 February 2018.
Edited by:
Mark Meekan, Australian Institute of Marine Science, AustraliaReviewed by:
Ian David Jonsen, Macquarie University, AustraliaUffe Høgsbro Thygesen, Technical University of Denmark, Denmark
Heidi Dewar, Southwest Fisheries Science Center (NOAA), United States
Copyright © 2018 Braun, Skomal and Thorrold. This is an open-access article distributed under the terms of the Creative Commons Attribution License (CC BY). The use, distribution or reproduction in other forums is permitted, provided the original author(s) and the copyright owner are credited and that the original publication in this journal is cited, in accordance with accepted academic practice. No use, distribution or reproduction is permitted which does not comply with these terms.
*Correspondence: Camrin D. Braun, Y2JyYXVuQHdob2kuZWR1