 Inga Lips
 Urmas Lips
- Department of Marine Systems, Tallinn University of Technology, Tallinn, Estonia
The inter-annual dynamics of the photosynthetic ciliate Mesodinium rubrum in the central Gulf of Finland in spring-summer continuum during 5 years were followed. The analysis was mainly based on high-resolution measurements and sampling in the surface layer along the ferry route Tallinn-Helsinki. The main purpose was to analyze the dynamics of M. rubrum biomass, its contribution to the photosynthetic plankton biomass, and the influence of water temperature and variations of inorganic nutrients in the surface and sub-surface layer on its dynamics. The analysis revealed that the outcome of the M. rubrum bloom in spring was largely related to the surface layer water temperature—in the years of earlier warming, the higher biomass of this species was formed. The photosynthetic ciliate was an important primary producer in all studied years during the late phase or post-spring bloom period in the Gulf of Finland. The maximum proportion of M. rubrum in the photosynthetic plankton community was estimated up to 88% in May and up to 91% in June. We relate the observed post-spring bloom decrease of phosphate concentrations in the surface layer to the dominance and growth of M. rubrum. We suggest that this link can be explained by the vertical migration behavior of M. rubrum and phosphate utilization in the surface layer coupled with inorganic nitrogen assimilation in the sub-surface layer. Thus, the dynamics of M. rubrum could strongly influence the amount of post-spring bloom excess in the euphotic layer and the depth of nitracline in the Gulf of Finland.
Introduction
Phytoplankton production, together with the terrestrial organic carbon load, is the largest primary source of organic carbon to the Baltic Sea (Kulinski and Pempkowiak, 2011). As total annual ecosystem respiration in temperate estuaries and estuarine type seas like Baltic Sea exceeds gross primary production, the temporary shift to autotrophy state only occurs during seasonal and episodic bloom events of photosynthetic plankton when photosynthesis exceeds total system respiration (Cloern et al., 2014). In the Baltic Sea, during the phytoplankton spring bloom, up to 60% of annual carbon fixation takes place, and 40–80% of this fixed carbon sinks out from the surface layer (Heiskanen, 1998; Tamelander and Heiskanen, 2004). The spring bloom leads to depletion of inorganic nutrients in the euphotic layer and through the sedimentation of phytoplankton-derived organic carbon to the acceleration of benthic respiration and nutrient regeneration rates (Conley and Johnstone, 1995).
Spring bloom in the Baltic Sea is co-dominated by diatoms and dinoflagellates (e.g., Kononen and Niemi, 1984; Wasmund and Uhlig, 2003). The late phase of the spring bloom (in May) in the Gulf of Finland is dominated by vertically migrating dinoflagellates together with ciliates (Heiskanen, 1995; Höglander et al., 2004; Lips et al., 2014). Ciliates are an important trophic link between primary producers and metazoa consuming a significant fraction of small-sized phytoplankton and bacterioplankton production and are important in remineralization of macronutrients (Rivkin et al., 1999; Calbet and Landry, 2004). Besides this, ciliates can also be significant contributors to primary production through mixotrophy which is the occurrence of phagotrophy and phototrophy in the same organism. Mixotrophic oligotrichs have been reported both in freshwater and in seawater ecosystems (Esteban et al., 2010).
Mass occurrences of photosynthetic ciliate Mesodinium rubrum Lohmann 1908 (Myrionecta rubra Jankowski 1976) are reported around the world (e.g., Mackenzie and Gillespie, 1986; Crawford, 1989; Wilkerson and Grunseich, 1990; Cloern et al., 1994; Johnson et al., 2013; Kang et al., 2013). In the Baltic Sea, the highest abundances/biomasses and largest size distribution of M. rubrum are observed after the diatom-dinoflagellate dominated spring bloom, usually in May–June (Lindholm, 1985; Passow, 1991; Rychert, 2004; Thamm et al., 2004). The peak of M. rubrum biomass mostly coincides with the period when nitrates are exhausted from the upper mixed layer and the increase of photosynthetic biomass is mostly regarded to be based on regenerated nutrients (according to Dugdale and Goering, 1967).
M. rubrum is extremely mobile, known to be fastest autotroph in the sea with a swimming velocity that is reported to reach 8.5 mm s−1 (30 m h−1; Smayda, 2010) and showing marked phototaxis and vertical migrations (Lindholm, 1985). Some studies already a long time ago demonstrated the very high rate of primary production of this species (e.g., Mackenzie and Gillespie, 1986; Crawford, 1989; Stoecker et al., 1991; review by Johnson, 2011). Increased temperature and water column stability, decreased salinity and depletion of dissolved inorganic nitrogen from the surface layer are known to have positive influence to the occurrence and abundance of M. rubrum (Lindholm and Mörk, 1990; Cloern et al., 1994; Montagnes et al., 2008; Johnson et al., 2013) in different locations worldwide. In several studies, the ability of directly utilize nitrate, ammonium, dissolved organic nitrogen (Lindholm and Mörk, 1990; Wilkerson and Grunseich, 1990; Tong et al., 2015) and phosphates (review by Lindholm, 1985; Tong et al., 2015) have been reported. M. rubrum mass occurrences tend to develop in a chemical environment where competing photosynthetic species are a resource (nutrient) limited or are not able to migrate vertically to exploit the pools of dissolved inorganic nutrients below the euphotic layer. Ability to migrate vertically complemented with efficient nutrient uptake has been considered to enable M. rubrum to compete with phytoplankters (Stoecker et al., 1991).
The main aim of this paper is to present the interannual dynamics of photosynthetic ciliate M. rubrum in the central Gulf of Finland in spring-summer continuum and to analyze how the increase in mixotrophic ciliate biomass affects the spatial distribution (both horizontal and vertical) and temporal variation of nutrients in the stratified water column. We hypothesize that the magnitude and intensity of M. rubrum bloom has a significant impact on the inorganic nutrient concentrations after the spring bloom and hence may influence the outcome of summer phytoplankton blooms. The analysis is based on high-resolution measurements and sampling in the surface layer along the ferry route Tallinn-Helsinki complemented with vertical profiling and sampling through the water column at one station close to the ferry line. We recognize that M. rubrum belongs to a species complex (Johnson et al., 2016) and that our data may include M. major and/or multiple variants of M. rubrum. However, since we did not measure the diversity of genetic variants, we will refer to all observed Mesodinium ciliates as M. rubrum.
Materials and Methods
Study Region
The dataset analyzed was collected during 5 years (2009–2012, 2014) in the central part of the Gulf of Finland, the easternmost basin of the Baltic Sea (Figure 1). The Gulf of Finland is a stratified elongated estuarine basin where the general water movement in the surface layer is anticlockwise (Alenius et al., 1998) but the dynamics of water masses are very much meteorologically driven at the mesoscale. The surface layer salinity in the area is typically between 4 and 6 g kg−1, decreasing from west to east due to the major river discharge at the eastern end of the Gulf and slightly from south to north due to the anti-clockwise general circulation. A seasonal variation of inorganic nutrient concentrations is observed in the Gulf of Finland upper layer—minimum values in summer and maximum in winter. Nitrogen is considered the limiting nutrient in the Baltic Sea, and after the development of thermal stratification in spring the nitrogen-rich deeper layers are separated from the nitrogen-depleted surface layer causing the rapid decline in the phytoplankton biomass co-dominated by diatoms and dinoflagellates. At the same time there can be observed the residual amounts of phosphates and silicates in the surface layer after the spring bloom (e.g., Tamelander and Heiskanen, 2004). In summer, the strong stratification and nitrogen limitation give competitive advantages for cyanobacteria (Lips and Lips, 2008) able to fix molecular nitrogen and photosynthetic species able to migrate vertically in the water column (Lips et al., 2011).
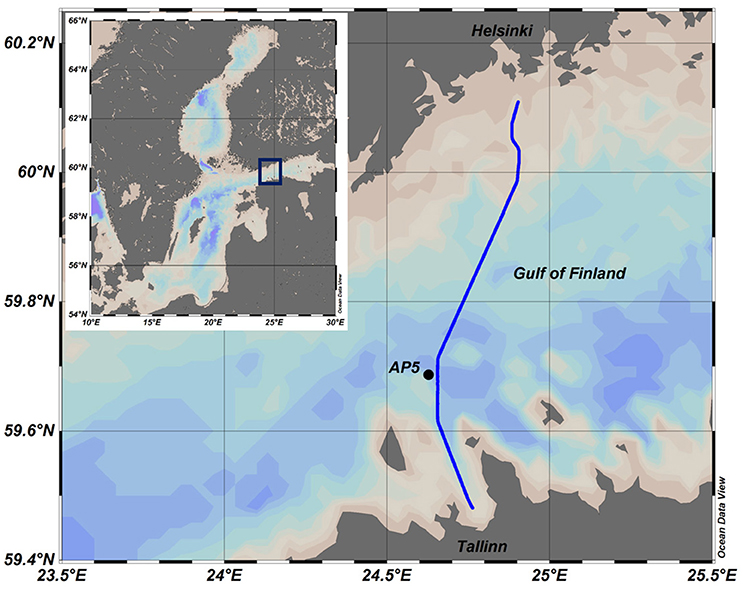
Figure 1. Map of the Baltic Sea and the study area. Ferrybox route is shown as a solid line and Station AP5 as a black circle.
Measurements and Sample Analysis
Measurements were conducted using autonomous ferrybox system (-4H- Jena Engineering GmbH) installed on board the passenger ferry “Baltic Princess” (AS Tallink Grupp) plying between Tallinn and Helsinki (Figure 1) in 2009–2012 and 2014. Seawater was pumped through the measuring system from ~4 to 5 m depth while the ferry was moving at an average speed of 15–16 knots. The temperature, salinity, and chlorophyll a (Chl a) fluorescence were measured with the time resolution of 20 s corresponding approximately to a spatial resolution of 160 m.
Weekly-biweekly water sampling from up to 17 locations along the 75-km-long ferry route was conducted using an automatic refrigerating (4°C) sampler (Sigma 900 MAX), being part of the ferrybox system. Sampling dates and number of samples collected for nutrient and phytoplankton analyses on each date along the south-north transect are shown in Table 1. Altogether 753 samples were collected from the surface layer in five studied years and analyzed to determine the concentrations of , , Chl a, and phytoplankton species composition, wet weight, and carbon (C) biomass.
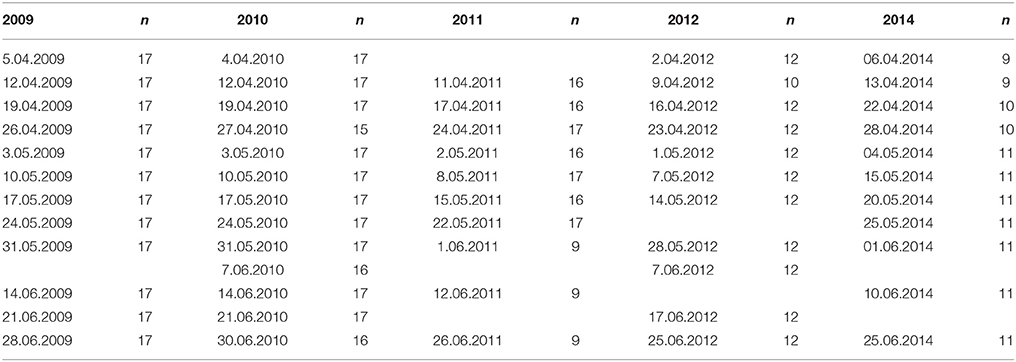
Table 1. Ferrybox sampling dates and number of samples (n) in different years.
Sampling and measurements on board the research vessel SALME were performed at the station AP5 (Figure 1) in spring-summer 2010–2012 and 2014 (the sampling days and depths can be seen in Figure 3). CTD measurements using an Ocean Seven 320plus CTD probe (Idronaut S.r.l.) equipped with a Seapoint Chl a fluorometer were performed, and water samples with a vertical resolution from 5 to 10 m were collected. Collected water samples were analyzed to determine the same parameters as from ferrybox samples. On 20–21 May 2014, the 24 h campaign for measurements and sampling was performed. Vertical profiles of temperature, salinity, Chl a fluorescence and dissolved oxygen content were registered together with phytoplankton sampling with 2 h interval. Samples for nutrient analysis were collected with 6 h interval.
Inorganic nutrients were analyzed with the automatic nutrient analyzers μMac 1000 (Systea S.r.l.) and Lachat QuikChem 8500 Series 2 (Lachat Instruments, Hach Company). The nutrient analyses were performed according to the guidelines of the American Public Health Association (APHA, 1992; methods 4500-NO3 and 4500-P for μMac 1000) and recommendations made by USEPA, ISO, and DIN standards (methods 31-107-04-1-D NO3 (Egan, 2000) and 31-115-01-1-I PO4 (Ammerman, 2001) for the Lachat instrument). The lower detection range for and was 0.03 and 0.07 μM, respectively.
The Chl a concentration in the water samples was determined using Whatman GF/F glass fiber filters following extraction at room temperature in the dark with 96% ethanol for 24 h. The Chl a content from the extract was measured spectrophotometrically (Thermo Helios γ) in the laboratory (HELCOM, 1988). Chl a fluorescence measured on board the research vessel and by the ferrybox system was calibrated against Chl a measured in the water samples. For each device and season, a linear regression equation between fluorescence and Chl a was found and used to convert fluorescence values into Chl a content values.
Phytoplankton sub-samples (100 ml) were preserved and analyzed according to the HELCOM recommendations and EVS-EN 15972:2011 standard. The wet weight biomasses were calculated according to Olenina et al. (2006), and the phytoplankton carbon (C) content was calculated using C:biovolume factors according to Menden-Deuer and Lessard (2000). Carbon biomass of naked ciliates was calculated according to the method described by Putt and Stoecker (1989).
Calculations
For the years, when the autonomous profiler data were available, the stratification parameter P [J m−3] was estimated after Simpson et al. (1990) as
where ρ(z) is the density profile in the water layer between the depths h1 and h2. The obtained estimates of P characterize the strength of stratification between the depth of 40 m (h2) where nutrients were always available and the ferrybox sampling depth of 4 m (h1). The pre-processed CTD-profiles with a depth step of 0.5 m acquired at station AP5 were used.
All correlations between the data series are given as Pearson correlation coefficients. Only significant correlations are referred with a p-value < 0.05.
The consumption rate of phosphates was estimated as suggested by Lips et al. (2014) assuming that the temporal changes in phosphate concentrations, using a large enough number of analyses over the entire transect, were mostly related to the consumption. A linear regression equation between the measured phosphate concentrations and date (day of the year) was found for each post-spring bloom period using the least squares method. The slope of the found regression line was taken as the estimate of the consumption rate of (units μM day−1). The related need for was calculated according to the Redfield ratio (N:P ratio 16:1).
Results
Inter-Annual Changes in Sea Surface Temperature and Salinity
The Gulf of Finland was partially ice-covered in 2009 and 2014, and ice-covered in 2010, 2011, and 2012; however, in 2012 the ice winter was 2 weeks shorter than on average. The spring warming of the surface layer differed in timing and rate of temperature increase in the studied years (Figure 2). The earliest warming was observed in 2014 when the average cross-gulf surface layer temperature exceeded 4°C by 21 April and 5°C 1 week later (see Figure 2, where relevant dates are marked with vertical red and black lines). The average cross-gulf surface layer temperature exceeded 4 and 5°C a few days earlier in 2009 compared with 2012 (Table 2). The warming of the surface layer in 2010 and 2011 was slower compared with other years, and spring 2011 was characterized by several warming-cooling periods in April-May. Due to several cooling periods in spring 2011, the average cross-gulf temperature stayed around 4°C until 21 May.
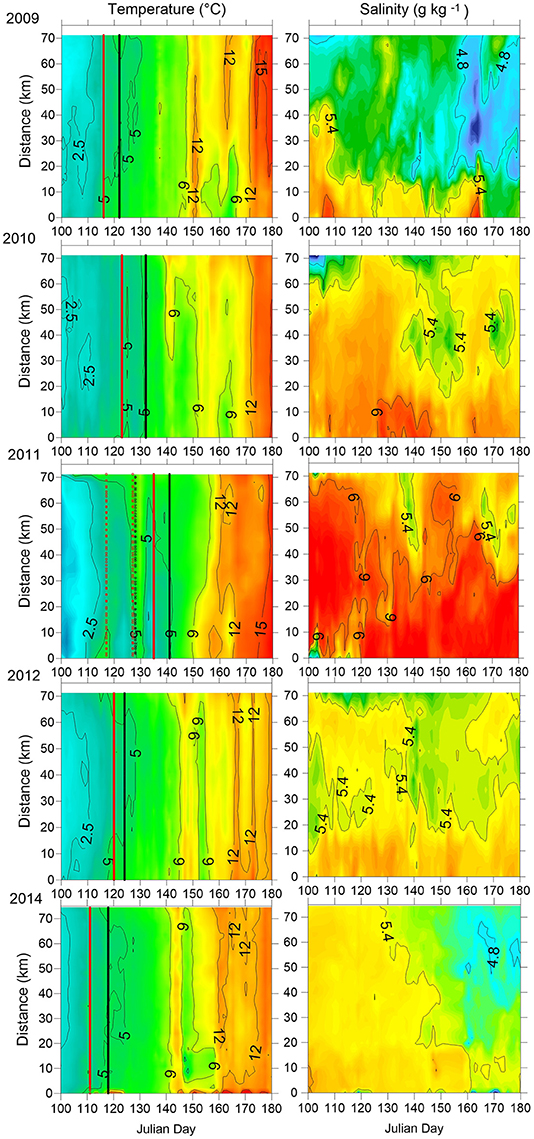
Figure 2. The temporal variation of horizontal distribution of temperature and salinity in the surface layer along the cross-gulf section in the Gulf of Finland in 2009–2012 and 2014. Data of daily measurements with a spatial resolution of 160 m are used. Distance from the southern end of the study transect (see Figure 1) is plotted on the y-axis. The days when the average cross-gulf temperature exceeded 4°C (red line) and 5°C (black line) are indicated.
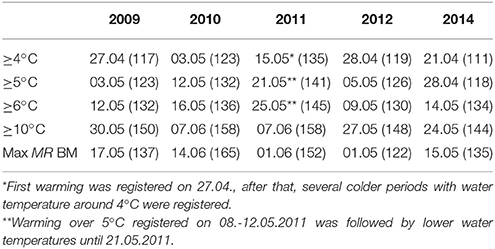
Table 2. The warming of the surface layer: dates (Julian day) when the certain average cross-gulf temperature was reached and dates when maximum M. rubrum biomass was observed.
The surface layer salinity (Figure 2) in spring-early summer differed between the years, indicating the complex wind-driven circulation patterns and mixing in the Gulf of Finland surface layer in the studied years. On average, the lowest surface layer salinity was registered in 2009 and the highest in 2011. Most probably the high surface layer salinity in 2010 and 2011 was caused by intense vertical mixing in winters 2009–2010 and 2010–2011, respectively. For instance, in winter 2010–2011, there occurred two longer periods with westerly-southwesterly winds resulting in estuarine circulation reversals (eastward flow in the surface layer and westward flow in the deeper layers) that led to intense vertical mixing and a temporal collapse of vertical stratification (Liblik et al., 2013). The latter could also influence the concentrations of nutrients in the surface layer at the onset of the spring bloom.
A typical north-south gradient of the surface layer salinity (on average, salinity is higher near the Estonian coast than near the Finnish coast; e.g., (Kikas and Lips, 2016) was well seen in spring 2009. In spring 2012, a water tongue with slightly lower salinity occurred in the central part of the Gulf. The horizontal distribution of salinity was uniform across the Gulf in March-April-May 2014, while slightly less saline waters appeared in the northern Gulf in June 2014 and the ordinary north-south salinity gradient was established.
Vertical stratification of the water column at low temperatures in April–early May is mostly controlled by the vertical distribution of salinity. The strongest stratification in the upper 40 m layer at station AP5 until mid-May was found in 2010 and 2012 (Figure 3) with stratification parameter varying from 32.5 to 45.7 J m−3 and from 34.5 to 46.9 J m−3, respectively. At the same time, the stratification was weak in April–early May both in 2011 and 2014. The stratification parameter varied from 12.0 to 22.0 J m−3 in 2011 and from 12.4 to 24.6 J m−3 in 2014, although the surface layer salinity was clearly higher in 2011 than in 2014. In all studied years, vertical stratification strengthened in late May–June due to the formation of the seasonal thermocline. Vertical stratification in June was still stronger in 2010 and 2012 (stratification parameter exceeded 70 J m−3) than in 2011 and 2014, but a change from a weak to strong stratification was also clear at the measurement site in June 2014 with the estimated stratification parameter up to 55.4 J m−3 in late June.
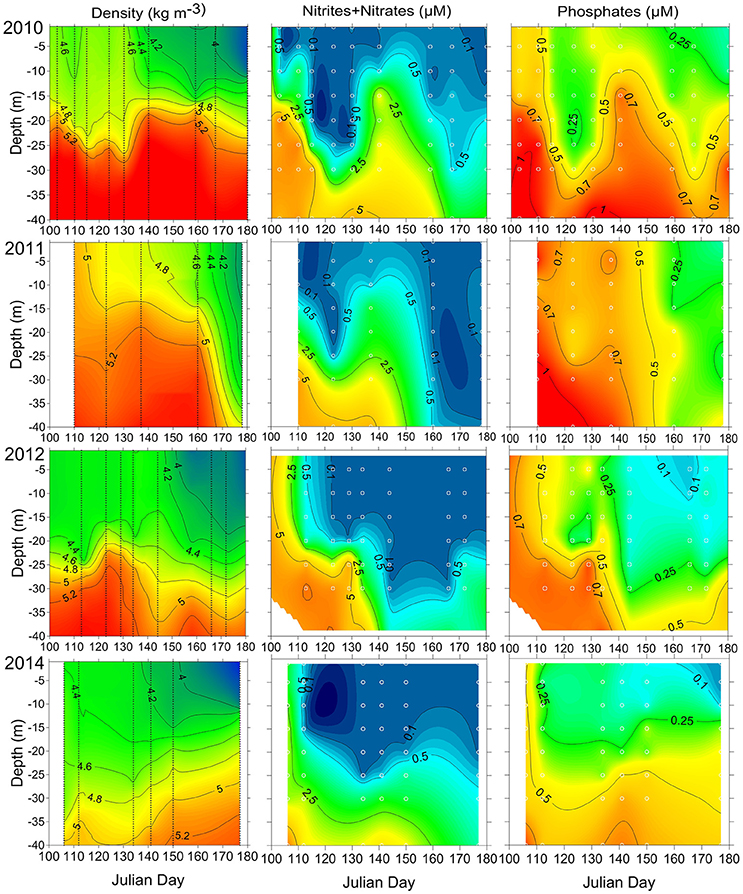
Figure 3. The temporal variation of vertical distribution of density and inorganic nutrients at station AP5 in 2010–2012 and 2014. The sampling days are indicated with vertical lines, and sampling depths are shown as white circles.
Inter-Annual Changes in Inorganic Nutrient Concentrations
Sampling for the analysis of inorganic nutrient concentrations started in the second week of April (during the phytoplankton spring bloom and was usually performed until the end of May-beginning of June when the concentrations were below or close to the detection limit (Figure 4). In April, during the development of phytoplankton spring bloom, the concentrations decreased weekly in all studied years. The highest initial concentrations were measured in 2011 among the all five spring periods. The concentrations were below or close to the detection limit by the 24 April in 2014, by the 2 May in 2011 and by the 7 May in 2012. In 2009 and 2010, the concentrations of fell close to detection limit by 10 May (except in the southern part of the study transect in 2010). A late spring increase in the surface layer concentration was detected in 2010 and 2011.
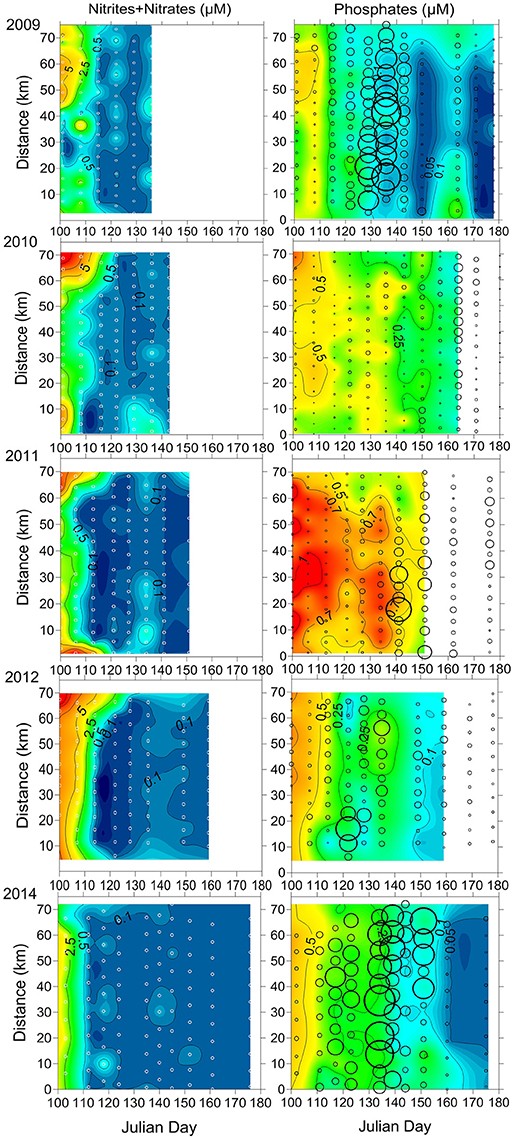
Figure 4. The temporal variation of the horizontal distribution of inorganic nutrients in the surface layer along the cross-gulf section in the Gulf of Finland in 2009-2012 and 2014. Sampling sites are indicated as white circles on left panels. The open circles on right panels indicate the distribution and intensity of M. rubrum biomass (μgC l−1; smallest circle = 0 μgC l−1; biggest = 510 μgC l−1).
The measurements of concentrations at station AP5 in 2010–2012 and 2014 (Figure 3) were conducted during the same period as sampling along the ferry route, and the analysis results allow following the depletion of inorganic nitrogen in the surface and sub-surface layer and deepening of the nitracline with time. By mid-April in 2010, the concentrations in the upper 10 m layer were in the range of 0.2–0.4 μM whereas high levels were measured at the depths of 15 and 20 m (1.6 and 6.8 μM respectively). A significant deepening of the nitracline was observed at the beginning of May, and higher concentrations were reintroduced to the upper layer due to the rise of the pycnocline at the end of May (Figure 3). In 2011, the upper 10 m layer was depleted of by the start of sampling on 21 April whereas relatively high concentrations were measured at a depth of 15 and 20 m (0.7 and 1.9 μM respectively). The sharp deepening of the nitracline down to 25 m was observed at the beginning of May, and a similar rise of the pycnocline, as it was registered in 2010, took place by 18 May. Due to this process, higher concentrations were detected in the upper layer again in both years. The subsequent samplings in 2011 were conducted with an ~2-week time lag, and probably the were depleted faster than seen from the interpolated field in Figure 3. In 2012, the deepening of the nitracline was observed from the beginning of May, and no significant rise in concentrations was detected in the second half of May at station AP5; instead, the continuous deepening of the nitracline down to 25–30 m was observed. In 2014, the were depleted down to the 25 m depth and, like in 2012, no significant rise in nitracline depth was revealed after the spring bloom.
After the depletion of , there was always some left in the surface layer (Figure 4) and the concentrations of excess were quite different in the studied years. In 2009 and 2012, the average concentrations were 0.13 μM (in the range of 0.12–0.16 μM) and 0.18 μM (in the range of 0.08–0.24 μM), respectively. For the same period, the concentrations of were on average 0.33 μM (in the range of 0.20–0.42 μM) and 0.37 μM (in the range of 0.23–0.48 μM) in 2010 and 2014 respectively, and 0.76 μM (in the range of 0.44–0.97 μM) in 2011. The observed late spring rise of the pycnocline increased the surface layer concentrations in 2010 and 2011 remarkably (Figures 3, 4).
Consumption of Inorganic Nutrients in May–June
The was depleted in the surface layer by 31 May in 2009, an increase in concentration in the surface layer was observed in mid-June, and the was depleted again by the end of the month. In 2010, the sampling for analysis was performed until 14 June, and there was still on average 0.16 μM left (range of 0.11–0.24 μM) in the surface layer. In 2011, the sampling period for nutrient analysis was shorter compared with other years in this study, but by 1 June, there was still on average 0.42 μM left (range of 0.30–0.56 μM) in the surface layer along the cross-gulf study transect. In 2012, the sampling of nutrients was conducted until 7 June, and by that time, the phosphate concentrations in the surface layer were close to the detection limit. In 2014, nutrients were sampled until 25 June, and levels were below detection limit by 10 June.
According to the availability of in the surface layer after the depletion of , the consumption of surplus was estimated (Table 3). The consumption rates of were estimated for the following periods: from 10 May until 31 May in 2009 (days 130–151), from 10 May until 14 June in 2010 (days 130–165), from 2 May until 1 June in 2011 (days 122–152), from 7 May until 7 June in 2012 (days 129–160), and from 4 May until 25 June in 2014 (days 125–146). The consumption of within these periods was much lower compared with the consumption during the antedate phytoplankton spring bloom (data not presented). Relatively low consumption of in the post-spring bloom period was found in 2009 and 2012, and the estimates were significantly higher in 2010, 2011, and 2014. The probable consumption/need of , assuming that nutrients were consumed according to the N:P ratio of 16:1, was also estimated. Higher inorganic nitrogen needs to deplete surplus from the surface layer were found in 2010, 2011, and 2014 compared with 2009 and 2012. The statistically significant relationship between the decrease of and an increase of M. rubrum biomass in the surface layer was found (R = 0.70, p < 0.01, n = 27) for all springs except the year 2010.
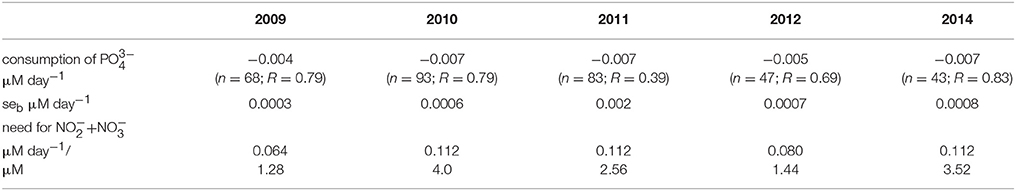
Table 3. Estimated consumption rates of after the depletion of nitrites-nitrates in the surface layer (n = number of observations and R = correlation coefficient; for all series p < 0.01), standard errors of the estimates seb, and calculated potential need for to consume the observed excess according to the N:P ratio of 16:1.
Interannual Changes in Mesodinium rubrum Biomass in May–June
The ciliate M. rubrum was an important primary producer in all studied years during the late phase or post-spring bloom (dominated by diatoms and dinoflagellates) period in the Gulf of Finland. In April, during the spring bloom peak, its average contribution to the photosynthetic plankton community was low, on average 8% (n = 213) in all studied years, being the lowest in 2011 when it stayed around 4% (n = 50). The average contribution of M. rubrum to the photosynthetic plankton community in the sea area between Tallinn and Helsinki in May was very variable in studied years. The lowest contribution in 2010 and 2011 (11–13% with n = 51 and n = 66, respectively) and the highest in 2009 and 2014 (53–61% with n = 81 and n = 44, respectively) were registered. The average contribution to the photosynthetic plankton biomass in May 2012 was 28% (n = 48). Even the M. rubrum biomass seemed modest in spring-summer 2010 its proportion in the overall phytoplankton community was similar to the year 2012—on average 32% if the period from the beginning of May until the end of June was taken into account.
The most significant differences between the years were in the timing of the maximum contribution of M. rubrum. The highest proportion in the photosynthetic plankton community measured in May was in 2009 (81%, n = 85), 2012 (72%, n = 48), and 2014 (86%, n = 44). The highest contributions in June were observed in 2010 (97%, n = 99), 2011 (91%, n = 27), and 2014 (86%, n = 33). In addition, the remarkable differences in biomass and distribution of M. rubrum were observed (Figure 4). The most intensive blooms, distributed quite evenly across the Gulf, were registered in 2009 and 2014 when very high biomass values were measured at the first half of May – on 10 and 17 May (91–457 and 106.6–510.1 μgC l−1, respectively) in 2009 and on 15 May (136–439 μgC l−1) in 2014. The year 2014 is characterized by a longer period with high biomass values of M. rubrum either along the entire cross-gulf transect or in the different parts of it (28 April until 4 June, Figure 4). High values of M. rubrum biomass were also detected in 2011 and 2012 but the cross-gulf distribution was patchy and the intensive bloom period shorter with biomasses over 300 μgC l−1 only at one sampling date, on 22 May in 2011 (9.5–508 μgC l−1) and on 1 May in 2012 (24.2–479.4 μgC l−1). Remarkably lower M. rubrum biomass values were observed in May–June 2010 when the highest values were measured a month later, compared with the other studied years, on 14 June (76–276 μgC l−1).
A significant relationship (R = 0.60, p < 0.01, n = 22) was found between the start (a week with a noticeable increase in biomass compared with the previous sampling) of the M. rubrum bloom and warming of the sea surface layer. The clear increase in M. rubrum biomass was observed after the cross-gulf average surface layer temperature had reached over 4°C (Figure 5). The maximum M. rubrum biomass was higher and established earlier in warmer springs (2009 and 2014; Table 2). Also, the average cross-gulf biomass of M. rubrum in May was greater in the years characterized by earlier surface layer warming (2009–155 μgC l−1, 2012–119 μgC l−1, and 2014–193 μgC l−1). Springs with slower surface layer warming or very dynamic temperature pattern were characterized by lower M. rubrum average biomass in May (2010–51 μgC l−1 and 2011–62 μgC l−1).
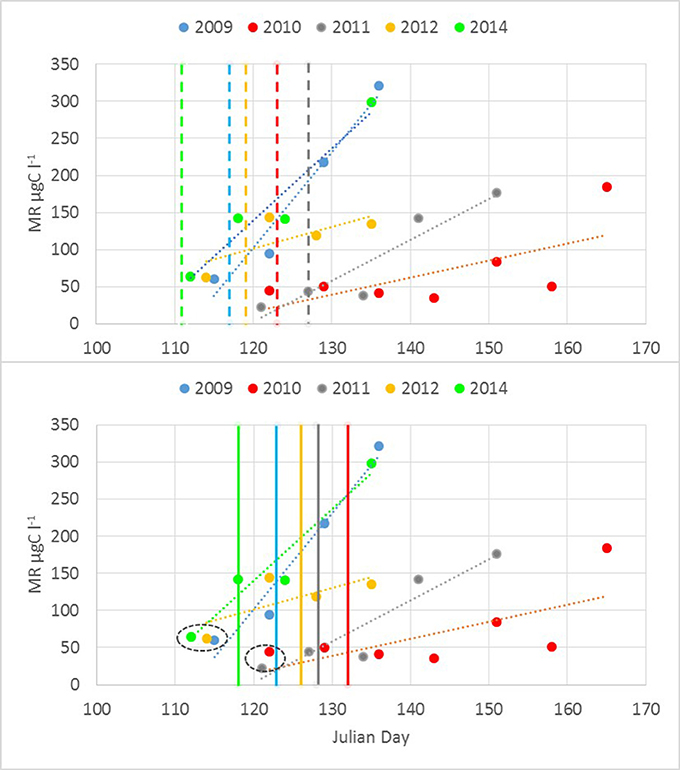
Figure 5. Mesodinium rubrum biomass increase up to maximum concentration observed in relation to the average cross-gulf surface layer temperature. Color-coded vertical lines mark the days in different years when average surface layer temperature rose over 4°C (upper panel) and 5°C (lower panel).
A moderate relationship was found with average cross-gulf surface layer salinity and M. rubrum biomass build up (R = 0.40, p < 0.05, n = 28).
A qualitative relationship between the vertical stratification and bloom outcome could be demonstrated based on the estimated stratification parameter at station AP5 (located at the distance of 22 km north from the southern end of the cross-gulf study transect; Figure 3) and M. rubrum biomass in the area. The lowest biomass of M. rubrum in spring was observed in 2010 when also the vertical stratification was very strong at station AP5. The highest biomass was found in spring 2014, characterized with the weak vertical stratification, and the decline of M. rubrum biomass in the southern part of the study transect coincided with the strengthening of stratification at station AP5 in late May 2014. Nevertheless, similar outcomes of the bloom with occasional high biomass of M. rubrum were registered in 2011 and 2012, although the vertical stratification differed significantly between these years—the stratification parameter varied from 12.0 to 35.6 J m−3 in 2011 and from 26.3 to 51.0 J m−3 (72.1 J m−3 in early July) in 2012.
Moderate but statistically not significant agreement of M. rubrum biomass in May with preceding period cryptophyte biomass was found (Figure 6). Still, the years with higher cryptophyte biomass in April showed the earlier establishment of the ciliate bloom, except in 2011 when the surface layer temperature was very variable in April. In addition, the decline of the M. rubrum bloom corresponds with the development of Dinophysis acuminata (Claparède and Lachmann 1859) biomass increase in June (Figure 6; R = 0.51, p < 0.05, n = 23).
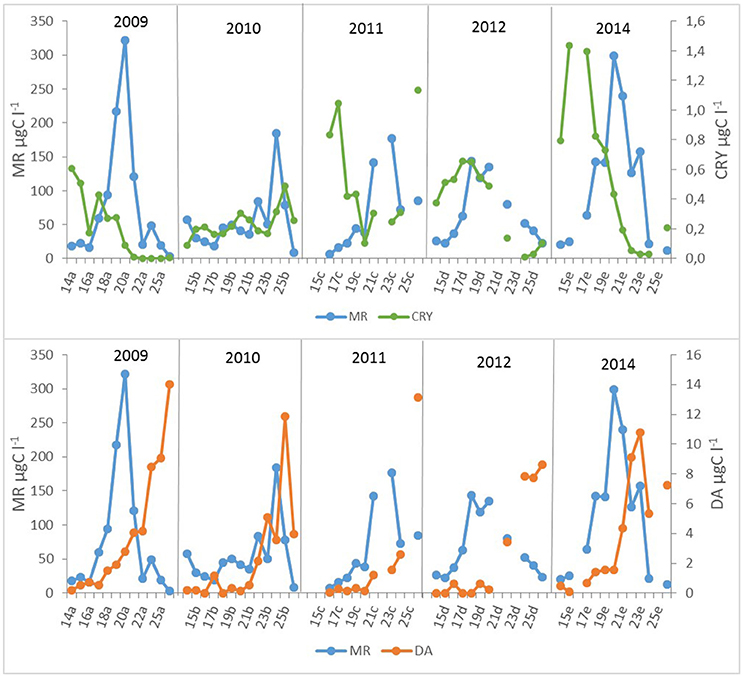
Figure 6. Mesodinium rubrum (MR), cryptomonads (CRY), and Dinophysis acuminata (DA) biomass dynamics in different years (a−2009, b−2010, c−2011, d−2012, e−2014). The number of the week is shown on the x-axis.
Diel Vertical Dynamics in Mesodinium rubrum Abundance in Spring 2014
On 21–22 May 2014, the 24 h measurement and sampling campaign was performed at station AP5. By this time, the water temperature in the upper 5 m layer was above 7°C (Figure 7). The surface layer salinity was about 5.45 g kg−1, and a clear vertical salinity gradient was observed in the sub-surface layer below 20 m depth. The was depleted down to 20 m depth, but there was still some left in the surface layer (Figure 7).
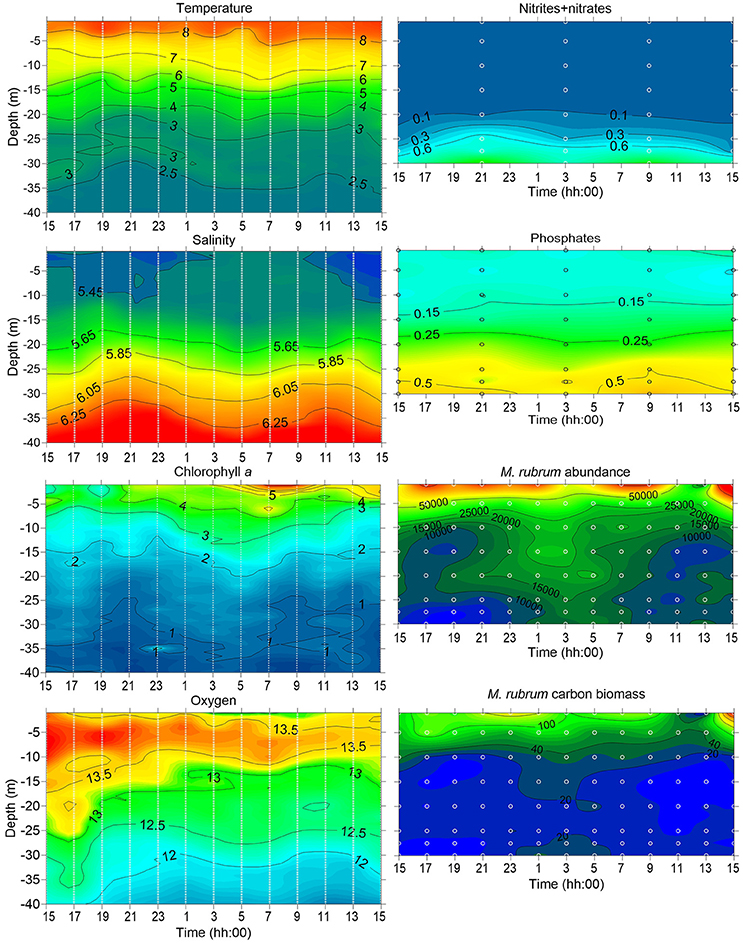
Figure 7. Temporal changes in vertical distribution of temperature (°C), salinity (g kg−1), chlorophyll a (μ l−1) and dissolved oxygen (mg l−1; left panels) measured at station AP5 during the 24 h experiment (2 h interval) on 20–21 May 2014. Temporal changes in vertical distribution of nutrients (nitrites-nitrates and phosphates; μM), M. rubrum abundance (units l−1) and biomass (μ l−1; right panels) sampled at 6 and 2 h intervals respectively at station AP5; sampling depths are indicated as white circles.
Phytoplankton sampling at 2 h intervals and 5 m vertical resolution allowed following the vertical displacement of M. rubrum cells (Figure 7). Although the highest abundances were usually obtained from the 1 m depth, the clear increase in abundance in the sub-surface layers can be observed at night. Cells started to descend after 7 p.m. (local time) and maximum abundances at 25–30 m depth were registered in the early morning between 1 and 7 a.m. Most of the descending cells did not migrate deeper than 20 m depth, where the start of nitracline was located. By 11 a.m. next day, the cells were again mainly concentrated in the upper 15 m layer.
Discussion
The biomass of the photosynthetic ciliate M. rubrum had an evident influence on the primary production of plankton community and nutrient cycling. The inorganic nitrogen, accumulated in the upper layer in the Gulf of Finland during winter, is consumed on average by the beginning of May (Figure 4) by rapidly growing spring bloom diatoms and dinoflagellates (Lips et al., 2014). Due to the low N:P ratio in the winter pool of nutrients and nutrients in the sub-surface layer after the formation of stratification, vertical mixing, and/or advection introduces into surface layer always in excess compared with nitrogen (Laanemets et al., 2011). The depletion of excess in the surface layer before the increase of biomass of N-fixing cyanobacteria (at the end of June-beginning of July) was recognized in the present study.
The depletion of surplus would need significant amounts of inorganic nitrogen which is depleted from the surface layer after the spring bloom. It is possible to roughly estimate the potential need for inorganic nitrogen (Table 3) and to predict biomass increase of photosynthetic plankton according to the Redfield ratio (C:N:P of 106:16:1) based on the available in the surface layer and neglecting the remineralization process and consumption by bacteria. For example, the predicted increase in photosynthetic biomass in the surface layer for the period from 3 May to 17 May 2009 (after the depletion of in the surface layer; days 122–136) could be ~100 μgC l−1 taking into account the average concentration of available (0.08 μM). The real measured biomass increase in photosynthetic plankton (including ciliate M. rubrum) was on average 42% higher. This discrepancy can be explained either by the fact that net community production may be underestimated if it is based on nutrient concentrations and Redfield ratios only because the contributions of recycled nutrients cannot be taken into account (Thomas et al., 1999) or there are other potential nutrient sources unnoticed when sampling only from the surface layer. In the present study, during the selected period, the shift to species able to migrate vertically in the stratified water column, took place. In fact, the main biomass increase was formed by phototrophic ciliate M. rubrum—the biomass increased more than two times from an average 95–220 μgC l−1 in the study area. During the first week (3–10 May), the total biomass of phytoplankton increased only by 50 μgC l−1 while the biomass of M. rubrum increased at the same time by 120 μgC l−1 (the difference is due to the disappearance of spring bloom species from the community after the inorganic nitrogen depletion from the surface layer). Within the next week (10–17 May), the average increase in total biomass of phototrophic plankton was 130 μgC l−1, whereas, on average 100 μgC l−1 was due to the increase of biomass of M. rubrum. The estimated consumption rate of in the surface layer would have supported the total photosynthetic biomass increase approximately by 65 and 40 μgC l−1 only, respectively for these 2 weeks. Hence, the observed biomass increase in the whole period of 3–17 May was suggested to be mainly established due to the change in the photosynthetic plankton community composition and the ability of particular species to migrate to the sub-surface layers and assimilate nutrients (both nitrates and phosphates) necessary for their growth.
Still, there are other features and mechanisms to be considered. One should note the increase in concentration in the surface layer by 17 May 2009 (day 136, Figure 4). When the measured decrease of in the surface layer for the period of 10–17 May was rather low (0.03 μM), the increase in concentration at the same time was remarkable (0.34 μM) and coincided with the highest M. rubrum biomass values measured in spring 2009 in the study area. If to assume that the increase of inorganic nitrogen concentration in the surface layer was induced by the rise of pycnocline, as it was observed in May 2010 and 2011 (Figure 3; no vertical profiles available for spring 2009), there should have also been observed the increase in concentration in the surface layer. Instead, the slight decrease in concentration coincided with the increase in concentration and M. rubrum biomass. The first major increase in M. rubrum biomass (from 3 to 10 May) was proposed to be mainly related to the species ability to migrate to the lower layers and exploit nutrient reserves there to be able to multiply later in the surface layer. The N-depleted surface layer together with significant biomass increase support this assumption. The second biomass increase (from 10 to 17 May) of M. rubrum is most probably a combination of previous and following growth, and advection of water masses with lower salinity into the study area (Figure 2), which probably had higher inorganic nitrogen concentration. Hence, high-resolution measurements and sampling enable to see a more comprehensive picture.
Similar calculations were made for May-June 2014, a period when a decrease in concentration in the surface layer during M. rubrum bloom was observed. The predicted average biomass increase of primary producers for a period from 22 April to 15 May (~100 μgC l−1) was also lower than the average real outcome (155 μgC l−1). It is important to note, that the increase of M. rubrum biomass was as high as 4.7 times during the considered period, increasing its contribution to the overall photosynthetic plankton biomass from 15 to 56%. These noticed simultaneous dynamics of nutrients and phototrophic plankton biomass suggest the assimilation of inorganic nutrients (both – nitrates and phosphates) in the sub-surface layers and their transport to the surface layer by vertically migrating M. rubrum.
The year 2010 was characterized with the lowest maximum biomass of M. rubrum. Calculations showed that in the period from 31 May to 14 June, the decrease of by 0.11 μM could have supported the biomass increase according to the Redfield ratio approximately by 140 μgC l−1, which was slightly lower but still quite close to the measured average biomass increase for this period (159 μgC l−1). For the same period, the average increase in M. rubrum biomass was 100 μgC l−1, and the contribution of this species to the total phototrophic plankton biomass was increasing within 2 weeks from 50 to 85%. The biomass increase seemed to be mostly based on the left in the surface layer and assimilation of sub-surface after the rise of nitracline at the second half of May (Figure 3).
These kind of calculations, without taking into account all possible sources and sinks of inorganic nutrients, are very rough. In addition, dynamic mesoscale features on the background of meteorologically forced transport and mixing (as intensive horizontal flows of water masses with different salinity and/or nutrient concentration to or through the study area) make these simplified calculations/assessments complicated. At the same time, the decrease in the surface layer concentration in spring is very often significantly associated with the M. rubrum biomass increase and dominance in the community. Hence, the contribution of this species to the dynamics of inorganic nutrients cannot be neglected. The biomass of photosynthetic plankton in the second half of May was dominated by M. rubrum (70%) in all studied years. As the main increase in total photosynthetic plankton biomass was due to the growth of this species, the significant amounts of available inorganic nutrients (both in horizontal and vertical scale) were consumed most probably by it.
The spring bloom is predominantly regarded as a new production according to the definition of Dugdale and Goering (1967). After the nitrate depletion and decline of the spring bloom, the primary production in the Baltic Sea is mostly assumed to be based on the availability of regenerated nutrients (e.g., Kivi et al., 1993). Earlier studies (Jimenez and Intriago, 1987; Lindholm and Mörk, 1990and references therein, Crawford and Lindholm, 1997; Lips and Lips, 2014) are supporting the results of the present study about the importance of vertical migration to the nutrient dynamics and autotrophic growth in periods characterized by inorganic nutrient limitation in the surface layer. The remarkable growth of M. rubrum and formation of red tides in different seasons are based on new nutrients introduced to the surface layer either by physical processes (rise of the thermocline/pycnocline, advection of surface layer water masses, upwelling) or biological capabilities (vertical migration through pycnoclines). The dominance of photosynthetic ciliate M. rubrum after the spring bloom not only increases the retention time of newly produced material in the nutrient-limited euphotic layer (Lips et al., 2014) but its contribution to the overall photosynthetic community and primary production can be outstanding. Leppänen and Bruun (1986) estimated that Mesodinium contributed about 10% of primary production in spring (April-May) in the open Northern Baltic Proper having at the same time on average only 2% of the total biomass of primary producers. Three decades later the overall contribution of this photosynthetic ciliate to the spring primary producers biomass seems to be increased significantly allowing the estimation on average 8–38% of total primary producers for the same period. Hence, 4–19 times higher contribution to the spring primary production can be expected, and the even greater contribution due to the overall climate change and an increase in sea surface temperature can be foreseen.
The very dynamic nature of M. rubrum blooms in spring would make difficult predictions of impact to the other trophic levels without knowledge of this species ecological preferences. Considering the regulating factors in dynamics of plankton community, limiting factors affecting population growth directly and controlling factors influencing the outcome of growth processes exist (Thingstad and Sakshaug, 1990). Johnson et al. (2013) have shown a significant positive correlation of M. rubrum field population with temperature in spring. Also, Montagnes et al. (2008) demonstrated a significant effect of temperature on M. rubrum abundance; the one-degree increase would increase the mean abundance by 1.42, and explained it with a decreased growth rate at low temperature. The limitation of cellular metabolic capacity by the thermal stress (Moeller et al., 2011) and a decrease in swimming velocity with decreasing temperatures (Riisgård and Larsen, 2009) have also been suggested. The motion of M. rubrum is characterized by jumping after shorter or longer periods of motionless, but it is also capable of sustained swimming (Fenchel and Hansen, 2006). Besides escape from predators, the jumping is necessary to create fluid motion surrounding the ciliate to increase the contribution of advective transport in nutrient uptake (Jiang, 2011). Slow warming (Figure 2, Table 2) in the study area at the end of April in 2010 probably created a physical environment not supporting the intensive growth and active motions, including the vertical migrations to assimilate nitrates from deeper layers, of M. rubrum compared with other studied years. Hence, when migratory capabilities were reduced, the competitive advantages over other migrating photosynthetic plankton were downgraded. The other important factor in combination with the low surface water temperature to influence the growth of M. rubrum is the low position of nitracline (below 20 m already by the end of April) in 2010 (Figure 3). Although the ability of M. rubrum to migrate through the density gradients is well-documented (e.g., Figueroa et al., 1998), the present results suggest that vertical stratification could notably influence the growth and bloom outcome of this species. The latter is also supported by the data from spring 2014. The observed clear decrease of M. rubrum biomass in late May 2014 in the southern part of the transect (Figure 4) coincided with the strengthening of vertical stratification (Figure 3).
M. rubrum is an obligate phototroph obtaining most of its carbon from photosynthesis, and only one cryptophyte prey per cell is required to maintain its maximum growth (Hansen and Fenchel, 2006). The suitable prey and predator relationships are hypothesized to support the M. rubrum surface bloom formation (Stoecker et al., 2009). Cryptophytes-M. rubrum relationships can also be followed in the data set of studied years with significant bloom maximum in 2009, 2011–2012, and 2014 (Figure 6), but the same does not hold for the year 2010 when the initial biomass of cryptophytes was several times lower in April compared with other years. Most probably, the combination of regulating factors (both limiting and controlling) influenced the M. rubrum biomass outcome in 2010.
Complex migratory patterns observed in the present study and described by others (e.g., review by (Crawford, 1989) might be related to a combination of requirements for light, cryptophyte prey, and nutrients, especially nitrates. The migrations in response to nutrient and light conditions in the stratified sea can lead to a vertical distribution in which the majority of the population may be concentrated close to the surface during the day and in deeper layers at night. Most commonly, only part of the populations are performing such daily migrations (Pérez et al., 1999; Rychert, 2004), but getting a more realistic picture of the extent of such migrations temporally very high-resolution measurements are needed. The suggested vertical migrations of M. rubrum between the surface layer and the nitracline should create incidents when during the high biomass period of this ciliate in the plankton community the Chl a concentrations could occasionally be elevated in the sub-surface layer. Sub-surface maxima have been reported earlier in the Gulf of Finland in summer in the cases when the dinoflagellate Heterocapsa triquetra (Ehrenberg) Stein 1883 was present in the community in high abundances (Lips et al., 2011; Lips and Lips, 2014). The high-resolution measurements with a profiling mooring and a towed undulating vehicle (data not presented here) registered the sub-surface Chl a maxima in spring 2012. During the period of the high biomass of M. rubrum in the first half of May, thin layers of relatively high Chl a values were observed on several occasions. In the frame of the present study, the vertical sampling conducted at 2 h intervals and resolution of 5 m might have been too low as M. rubrum could have theoretically made several migrations within 2 h or was missed in the depths not sampled. Still, the integrated biomass values increased slightly from 21 p.m. until 1 a.m. (240–380 μC l−1) and decreased again afterwards, indicating the high probability of success in sampling during the active migration. The high swimming speed allows M. rubrum to descend to the nitracline in the evening, stay there to assimilate nutrients and migrate back to the well-lit surface layer by midday. From the presented 24-h study, the observed migration pattern allows suggesting the diurnal vertical migrations of this species. Still, extensive studies should be made in the future to see the longer pattern and regularity of such migrations and assess more precisely the influence not only to the horizontal but also to the vertical distribution of inorganic nutrients. The ability to migrate vertically and exploit the nutrient pools from the lower layers may significantly influence the nutricline depth after the development of stratification in spring. Interestingly, even the nitracline was located at 20 m depth in May 2014, part of the M. rubrum cells migrated deeper—down to 25 and 30 m depth.
The photosynthetic ciliate M. rubrum might be a key player in the trophic transfer of energy after the decline of spring bloom and establishment of late summer phytoplankton blooms. This phototrophic ciliate not only prolongs the autotrophic production in the nutrient-depleted surface layer but also acts as an important food supply to other organisms (e.g., Park et al., 2006; Fileman et al., 2007; Lee et al., 2014; Figure 6). Also, the excretion of nutrients through mineralization and cell explosion can be a significant source of nitrogen (Lindholm, 1985; Miller et al., 1995) to phytoplankton species present in the surface layer community. High nitrate and phosphate assimilation rates reported in previous studies (Dugdale et al., 1987; Jiang, 2011; Tong et al., 2015), support the assumption that inorganic nitrogen available in spring-summer continuum, either brought close to the surface through pycnocline rise or from adjacent areas, will be mostly assimilated by dominating M. rubrum if the other environmental conditions support its growth. Also, the dominance of M. rubrum in May-June, its migration behavior, and phosphate utilization in the surface layer is strongly influencing the amount of excess that is usually regarded to support the summer cyanobacterial bloom development (e.g., Janssen et al., 2004; Laanemets et al., 2006; Raateoja et al., 2011). The years, when was depleted or close to the depletion by the end of our study period, are characterized by lower cyanobacterial biomass development and vice versa (Kahru and Elmgren, 2014). Hence, the dynamics and intensity of M. rubrum blooms in May-June have, besides nutrient distribution, the significant impact also on the late summer phytoplankton communities. The interactions between M. rubrum biomass development and other phytoplankton groups should be studied further as its contribution to the total photosynthetic biomass has increased in all seasons in the Baltic Sea (Jaanus et al., 2011). Thamm et al. (2004) have demonstrated the shift of the peak occurrence of this species from spring (in 1987) over spring/summer (in 1990) to summer (in 1997).
Conclusions
The clear relationship between the start and outcome of the M. rubrum bloom and average cross-gulf surface layer temperature emphasize the potentially high impact of this species to the spring–early summer plankton community in the background of overall climate change and continuous increase in sea surface temperature. The very high proportion of M. rubrum in the phototrophic plankton community has created the shift from, previously acknowledged, regenerated production toward new production at the period between spring bloom and summer cyanobacterial bloom in the Baltic Sea. The dominance of M. rubrum after the spring bloom in vertically stratified Gulf of Finland strongly influences the amount of excess phosphates in the surface layer and vertical inorganic nutrient dynamics. Within present study, comprising sampling with high temporal and spatial resolution, the understanding of dynamics and possible impacts of spring M. rubrum blooms to the Gulf of Finland ecosystem was increased.
Author Contributions
UL organized and partly conducted the measurements and sampling in the study area. IL conducted all phytoplankton and partly the nutrient analysis. Both authors contributed to the data analysis and manuscript writing.
Funding
The present work was supported by institutional research funding IUT (IUT19-6) of the Estonian Ministry of Education and Research, by the Estonian Science Foundation grant no. 8930 and by EU Regional Development Foundation, Environmental Conservation and Environmental Technology R&D Programme project VeeOBS (3.2.0802.11-0043).
Conflict of Interest Statement
The authors declare that the research was conducted in the absence of any commercial or financial relationships that could be construed as a potential conflict of interest.
Acknowledgments
We appreciate the help of crew and colleagues during sampling and analysis.
References
Alenius, P., Myrberg, K., and Nekrasov, A. (1998). Physical oceanography of the Gulf of Finland: a review. Boreal Environ. Res. 3, 97–125.
Ammerman, J. (2001). QuikChem® Method 31-115-01-1-I – Determination of Orthophosphate by Flow Injection Analysis. Lachat Instruments.
APHA (1992). APHA, AWWA, and WPCF Standard Methods for the Examination of Water and Wastewater, 18th Edn. Washington, DC: Am. Public Health Assoc.
Calbet, A., and Landry, M. R. (2004). Phytoplankton growth, microzooplankton grazing, and carbon cycling in marine systems. Limnol. Oceanogr. 49, 51–57. doi: 10.4319/lo.2004.49.1.0051
Cloern, J. E., Cole, B. E., and Hager, S. W. (1994). Notes on Mesodinium rubrum red tides in San Francisco Bay (California, USA). J. Plankton Res. 16, 1269–1276. doi: 10.1093/plankt/16.9.1269
Cloern, J. E., Foster, S. Q., and Kleckner, A. E. (2014). Phytoplankton primary production in the world's estuarine-coastal ecosystems. Biogeosciences 11, 2477–2501. doi: 10.5194/bg-11-2477-2014
Conley, D. J., and Johnstone, R. W. (1995). Biogeochemistry of N, P and Si in Baltic Sea sediments: response to a simulated deposition of a spring diatom bloom. Mar. Ecol. Prog. Ser. 122, 265–276. doi: 10.3354/meps122265
Crawford, D. (1989). Mesodinium rubrum: the phytoplankter that wasn't. Mar. Ecol. Prog. Ser. 58, 161–174. doi: 10.3354/meps058161
Crawford, D. W., and Lindholm, T. (1997). Some observations on vertical distribution and migration of the phototrophic ciliate Mesodinium rubrum (= Myrionecta rubra) in a stratified brackish inlet. Aquat. Microb. Ecol. 13, 267–274. doi: 10.3354/ame013267
Dugdale, R. C., and Goering, J. J. (1967). Uptake of new and regenerated forms of nitrogen in primary productivity. Limnol. Oceanogr. 12, 196–206. doi: 10.4319/lo.1967.12.2.0196
Dugdale, R. C., Wilkerson, F. P., Barber, R. T., Blasco, D., and Packard, T. T. (1987). Changes in nutrients, pH, light penetration and heat budget by migrating photosynthetic organisms. Oceanol. Acta SP, 103–107.
Egan, L. (2000). QuikChem® Method 31-107-04-1-D – Determination of Nitrate and/or Nitrite in Brackish Waters by Flow Injection Analysis. Lachat Instruments.
Esteban, G. F., Fenchel, T., and Finlay, B. J. (2010). Mixotrophy in ciliates. Protist 161, 621–641. doi: 10.1016/j.protis.2010.08.002
Fenchel, T., and Hansen, P. J. (2006). Motile behaviour of the bloom-forming ciliate Mesodinium rubrum. Mar. Biol. Res. 2, 169–177. doi: 10.1080/17451000600571044
Figueroa, F. L., Niell, F. X., Figueiras, F. G., and Villarino, M. L. (1998). Diel migration of phytoplankton and spectral light field in the Ria de Vigo (NW Spain). Mar. Biol. 130, 491–499. doi: 10.1007/s002270050269
Fileman, E., Smith, T., and Harris, R. (2007). Grazing by Calanus helgolandicus and Para-Pseudocalanus spp. on phytoplankton and protozooplankton during the spring bloom in the Celtic Sea. J. Exp. Mar. Biol. Ecol. 348, 70–84. doi: 10.1016/j.jembe.2007.04.003
Hansen, P. J., and Fenchel, T. (2006). The bloom-forming ciliate Mesodinium rubrum harbours a single permanent endosymbiont. Mar. Biol. Res. 2, 169–177. doi: 10.1080/17451000600719577
Heiskanen, A.-S. (1995). Contamination of sediment trap fluxes by vertically migrating phototrophic microorganisms in the coastal Baltic sea. Mar. Ecol. Prog. Ser. 122, 45–58. doi: 10.3354/meps122045
Heiskanen, A.-S. (1998). Factors governing sedimentation and pelagic nutrient cycles in the northern Baltic Sea. Boreal Environ. Res. 8:80.
HELCOM (1988). Guidelines for the Baltic monitoring programme for the third stage. Biological determinants. Balt. Sea Environ. Proc. 27D, 1–161.
Höglander, H., Larsson, U., and Hajdu, S. (2004). Vertical distribution and settling of spring phytoplankton in the offshore NW Baltic Sea Proper. Mar. Ecol. Prog. Ser. 283, 15–27. doi: 10.3354/meps283015
Jaanus, A., Andersson, A., Olenina, I., Toming, K., and Kaljurand, K. (2011). Changes in phytoplankton communities along a north-south gradient in the Baltic Sea between 1990 and 2008. Boreal Environ. Res. 16, 191–208.
Janssen, F., Neumann, T., and Schmidt, M. (2004). Inter-annual variability in cyanobacteria blooms in the Baltic Sea controlled by wintertime hydrographic conditions. Mar. Ecol. Prog. Ser. 275, 59–68. doi: 10.3354/meps275059
Jiang, H. (2011). Why does the jumping ciliate Mesodinium rubrum possess an equatorially located propulsive ciliary belt? J. Plankton Res. 33, 998–1011. doi: 10.1093/plankt/fbr007
Jimenez, R., and Intriago, P. (1987). Observations on blooms of Mesodinium rubrum in the upwelling area off Ecuador. Oceanol. Acta SP. 145–154.
Johnson, M. D. (2011). Acquired phototrophy in ciliates: a review of cellular interactions and structural adaptations. J. Eukar. Microb. 58, 185–195. doi: 10.1111/j.1550-7408.2011.00545.x
Johnson, M. D., Beaudoin, D. J., Laza-Martinez, A., Dyhrman, S. T., Fensin, E., Lin, S., et al. (2016). The genetic diversity of Mesodinium and associated cryptophytes. Front. Microbiol. 7:2017. doi: 10.3389/fmicb.2016.02017
Johnson, M. D., Stoecker, D. K., and Marshall, H. G. (2013). Seasonal dynamics of Mesodinium rubrum in Chesapeake Bay. J. Plankton Res. 35, 877–893. doi: 10.1093/plankt/fbt028
Kahru, M., and Elmgren, R. (2014). Multidecadal time series of satellite-detected accumulations of cyanobacteria in the Baltic Sea. Biogeosciences 11, 3619–3633. doi: 10.5194/bg-11-3619-2014
Kang, N. S., Lee, K. H., Jeong, H. J., Yoo, Y. D., Seong, K. A., Potvin, É., et al. (2013). Red tides in Shiwha Bay, western Korea: a huge dike and tidal power plant established in a semi-enclosed embayment system. Harmful Algae 30, S114–S130. doi: 10.1016/j.hal.2013.10.011
Kikas, V., and Lips, U. (2016). Upwelling characteristics in the Gulf of Finland (Baltic Sea) as revealed by Ferrybox measurements in 2007-2013. Ocean Sci. 12, 843–859. doi: 10.5194/os-12-843-2016
Kivi, K., Kaitala, S., Kuosa, H., Kuparinen, J., Leskinen, E., Lignell, R., et al. (1993). Nutrient limitation and grazing control of the Baltic plankton community during annual succession. Limnol. Oceanogr. 38, 893–905. doi: 10.4319/lo.1993.38.5.0893
Kononen, K., and Niemi, Å. (1984). Long-term variation of the phytoplankton composition at the entrance of the Gulf of Finland. Ophelia Suppl. 3, 101–110.
Kulinski, K., and Pempkowiak, J. (2011). The carbon budget of the Baltic Sea. Biogeosciences 8, 3219–3230. doi: 10.5194/bg-8-3219-2011
Laanemets, J., Lilover, M. J., Raudsepp, U., Autio, R., Vahtera, E., Lips, I., et al. (2006). A fuzzy logic model to describe the cyanobacteria Nodularia spumigena blooms in the Gulf of Finland, Baltic Sea. Hydrobiologia 554, 31–45. doi: 10.1007/s10750-005-1004-x
Laanemets, J., Väli, G., Zhurbas, V., Elken, J., Lips, I., and Lips, U. (2011). Simulation of mesoscale structures and nutrient transport during summer upwelling events in the Gulf of Finland in 2006. Boreal Environ. Res. 16, 15–26.
Lee, K. H., Jeong, H. J., Yoon, E. Y., Jang, S. H., Kim, H. S., and Yih, W. (2014). Feeding by common heterotrophic dinoflagellates and a ciliate on the red-tide ciliate Mesodinium rubrum. Algae 29, 153–163. doi: 10.4490/algae.2014.29.2.153
Leppänen, J.-M., and Bruun, J.-E. (1986). The role of pelagic ciliates including Mesodinium during the spring bloom of 1982. in the open northern Baltic Proper Ophelia Suppl. 4, 147–157.
Liblik, T., Laanemets, J., Raudsepp, U., Elken, J., and Suhhova, I. (2013). Estuarine circulation reversals and related rapid changes in winter near-bottom oxygen conditions in the Gulf of Finland, Baltic Sea. Ocean Sci. 9, 917–930. doi: 10.5194/os-9-917-2013
Lindholm, T. (1985). Mesodinium rubrum- a unique photosynthetic ciliate. Adv. Aquat. Microbiol. 3, 1–48.
Lindholm, T., and Mörk, A. C. (1990). Depth maxima of Mesodinium rubrum (Lohmann) hamburger and buddenbrock - examples from a stratified Baltic Sea Inlet. Sarsia 75, 53–64. doi: 10.1080/00364827.1990.10413441
Lips, I., and Lips, U. (2008). Abiotic factors influencing cyanobacterial bloom development in the Gulf of Finland (Baltic Sea). (2008). Hydrobiologia 614, 133–140. doi: 10.1007/s10750-008-9449-2
Lips, I., Rünk, N., Kikas, V., Meerits, A., and Lips, U. (2014). High-resolution dynamics of the spring bloom in the Gulf of Finland of the Baltic Sea. J. Mar. Syst. 129, 135–149. doi: 10.1016/j.jmarsys.2013.06.002
Lips, U., and Lips, I. (2014). Bimodal distribution patterns of motile phytoplankton in relation to physical processes and stratification (Gulf of Finland, Baltic Sea). Deep Sea Res. Part II Top. Stud. Oceanogr. 101, 107–119. doi: 10.1016/j.dsr2.2013.05.029
Lips, U., Lips, I., Liblik, T., Kikas, V., Altoja, K., Buhhalko, N., et al. (2011). Vertical dynamics of summer phytoplankton in a stratified estuary (Gulf of Finland, Baltic Sea). Ocean Dyn. 61, 903–915. doi: 10.1007/s10236-011-0421-8
Mackenzie, A. L., and Gillespie, P. A. (1986). Plankton ecology and productivity, nutrient chemistry, and hydrography of Tasman Bay, New Zealand, 1982–1984, New Zealand. J. Mar. Freshw. Res. 20, 365–395. doi: 10.1080/00288330.1986.9516158
Menden-Deuer, S., and Lessard, E. J. (2000). Carbon to volume relationships for dinoflagellates, diatoms, and other protist plankton. Limnol. Oceanogr. 45, 569–579. doi: 10.4319/lo.2000.45.3.0569
Miller, C. A., Penry, D. L., and Glibert, P. M. (1995). The impact of trophic interactions on rates of nitrogen regeneration and grazing in Chesapeake Bay. Limnol. Oceanogr. 40, 1005–1011. doi: 10.4319/lo.1995.40.5.1005
Moeller, H. V., Johnson, M. D., and Falkowski, P. G. (2011). Photoacclimation in the phototrophic marine ciliate Mesodinium rubrum (ciliophora). J. Phycol. 47, 324–332. doi: 10.1111/j.1529-8817.2010.00954.x
Montagnes, D. J. S., Allen, J., Brown, L., Bulit, C., Davidson, R., Díaz-Ávalos, C., et al. (2008). Factors controlling the abundance and size distribution of the phototrophic ciliate Myrionecta rubra in open waters of the North Atlantic. J. Eukaryot. Microbiol. 55, 457–465. doi: 10.1111/j.1550-7408.2008.00344.x
Olenina, I., Hajdu, S., Edler, L., Andersson, A., Wasmund, N., Busch, S., et al. (2006). Biovolumes and size-classes of phytoplankton in the Baltic Sea. Balt. Sea Environ. Proc. 104:144.
Park, M. G., Kim, S., Kim, H. S., Myung, G., Kang, Y. G., and Yih, W. (2006). First successful culture of the marine dinoflagellate Dinophysis acuminata. Aquat. Micriob. Ecol. 45, 101–106. doi: 10.3354/ame045101
Passow, U. (1991). Vertical migration of Gonyaulax catenata and Mesodinium rubrum. Mar. Biol. 110, 455–463. doi: 10.1007/BF01344364
Pérez, M. T., Dolan, J. R., Vidussi, F., and Fukai, E. (1999). Diel vertical distribution of planktonic ciliates within the surface layer of the NW Mediterranean (May 1995). Deep Res. Part I Oceanogr. Res. Pap. 47, 479–503. doi: 10.1016/S0967-0637(99)00099-0
Putt, M., and Stoecker, D. K. (1989). An experimentally determined carbon : volume ratio for marine “oligotrichous” ciliates from estuarine and coastal waters. Limnol. Oceanogr. 34, 1097–1103. doi: 10.4319/lo.1989.34.6.1097
Raateoja, M., Kuosa, H., and Hällfors, S. (2011). Fate of excess phosphorus in the Baltic Sea: a real driving force for cyanobacterial blooms? J. Sea Res. 65, 315–321. doi: 10.1016/j.seares.2011.01.004
Riisgård, H. U., and Larsen, P. S. (2009). Ciliary-propelling mechanism, effect of temperature and viscosity on swimming speed, and adaptive significance of “jumping” in the ciliate Mesodinium rubrum. Mar. Biol. Res. 5, 585–595. doi: 10.1080/17451000902729704
Rivkin, R. B., Putland, J. N., Anderson, M. R., and Deibel, D. (1999). Microzooplankton bacterivory and herbivory in the NE subarctic Pacific. Deep Sea Res. Part II Top. Stud. Oceanogr. 46, 2579–2618. doi: 10.1016/S0967-0645(99)00077-6
Rychert, K. (2004). The size structure of the Mesodinium rubrum population in the Gdansk Basin. Oceanologia 46, 439–444.
Simpson, J. H., Brown, J., Matthews, J., and Allen, G. (1990). Tidal straining, density currents and mixing in the control of estuarine stratification. Estuar. Coasts 13, 125–132. doi: 10.2307/1351581
Smayda, T. J. (2010). Adaptations and selections of harmful and other dinoflagellate species in upwelling systems. 2. Motility and migratory behaviour. Progr. Oceanogr. 85, 71–91. doi: 10.1016/j.pocean.2010.02.005
Stoecker, D. K., Johnson, M. D., De Vargas, C., and Not, F. (2009). Acquired phototrophy in aquatic protists. Aquat. Microb. Ecol. 57, 279–310. doi: 10.3354/ame01340
Stoecker, D. K., Putt, M., Davis, L. H., and Michaels, A. E. (1991). Photosynthesis in Mesodinium rubrum: species-specific measurements and comparison to community rates. Mar. Ecol. Prog. Ser. 73, 245–252. doi: 10.3354/meps073245
Tamelander, T., and Heiskanen, A. S. (2004). Effects of spring bloom phytoplankton dynamics and hydrography on the composition of settling material in the coastal northern Baltic Sea. J. Mar. Syst. 52, 217–234. doi: 10.1016/j.jmarsys.2004.02.001
Thamm, R., Schernewski, G., Wasmund, N., and Neumann, T. (2004). Spatial phytoplankton pattern in the Baltic Sea. Balt. Sea Typol. Coastline Rep. 4, 928–2734.
Thingstad, T. F., and Sakshaug, E. (1990). Control of phytoplankton growth in nutrient recycling ecosystems. Theory and terminology. Mar. Ecol. Prog. Ser. 63, 261–272. doi: 10.3354/meps063261
Thomas, H., Ittekkot, V., Osterroht, C., and Schneider, B. (1999). Preferential recycling of nutrients – the ocean's way to increase new production and to pass nutrient limitation? Limnol. Oceanogr. 44, 1999–2004. doi: 10.4319/lo.1999.44.8.1999
Tong, M., Smith, J., Kulis, D., and Anderson, D. (2015). Role of dissolved nitrate and phosphate in isolates of Mesodinium rubrum and toxin-producing Dinophysis acuminata. Aquat. Microb. Ecol. 75, 169–185. doi: 10.3354/ame01757
Wasmund, N., and Uhlig, S. (2003). Phytoplankton trends in the Baltic Sea. ICES J. Mar. Sci. 60, 177–186. doi: 10.1016/S1054-3139(02)00280-1
Keywords: Mesodinium rubrum, spring bloom, nutrients, stratification, Baltic Sea
Citation: Lips I and Lips U (2017) The Importance of Mesodinium rubrum at Post-Spring Bloom Nutrient and Phytoplankton Dynamics in the Vertically Stratified Baltic Sea. Front. Mar. Sci. 4:407. doi: 10.3389/fmars.2017.00407
Received: 21 September 2017; Accepted: 29 November 2017;
Published: 12 December 2017.
Edited by:
Riina Klais, University of Tartu, EstoniaReviewed by:
Matthew D. Johnson, Woods Hole Oceanographic Institution, United StatesHarri Kuosa, Finnish Environment Institute, Finland
Copyright © 2017 Lips and Lips. This is an open-access article distributed under the terms of the Creative Commons Attribution License (CC BY). The use, distribution or reproduction in other forums is permitted, provided the original author(s) or licensor are credited and that the original publication in this journal is cited, in accordance with accepted academic practice. No use, distribution or reproduction is permitted which does not comply with these terms.
*Correspondence: Inga Lips, aW5nYS5saXBzQHR0dS5lZQ==