
94% of researchers rate our articles as excellent or good
Learn more about the work of our research integrity team to safeguard the quality of each article we publish.
Find out more
ORIGINAL RESEARCH article
Front. Mar. Sci., 27 November 2017
Sec. Aquatic Microbiology
Volume 4 - 2017 | https://doi.org/10.3389/fmars.2017.00359
This article is part of the Research TopicMicrobial Ecology in the North Pacific Subtropical GyreView all 10 articles
 Ger J. van den Engh1,2*
 Joseph K. Doggett2
 Anne W. Thompson3
 Martina A. Doblin4
 Carla N. G. Gimpel2
 David M. Karl2
The fluorescence and scattering properties of Prochlorococcus and Synechococcus at Station ALOHA as measured by flow cytometry (termed the FCM phenotype) vary with depth and over a variety of time scales. The variation in FCM phenotypes may reflect population selection or physiological acclimation to local conditions. Observations before, during, and after a storm with deep water mixing show a short-term homogenization of the FCM phenotypes with depth, followed by a return to the stable pattern over the time span of a few days. These dynamics indicate that, within the upper mixed-layer, the FCM phenotype distribution represents acclimation to ambient light. The populations in the pycnocline (around 100 m and below), remain stable and are invariant with light conditions. In samples where both cyanobacteria coexist, fluorescence properties of Prochlorococcus and Synechococcus are tightly correlated providing further evidence that FCM phenotype variability is caused by a common environmental factor or factors. Measurements of the dynamics of FCM phenotypes provide insights into phytoplankton physiology and adaptation. Alternatively, FCM phenotype census of a water mass may provide information about its origin and illumination history.
Prochlorococcus is the numerically dominant photosynthetic organism in the warm oligotrophic waters of the North Pacific Subtropical Gyre (NPSG; Campbell and Vaulot, 1993). In surface waters, Prochlorococcus cells make up more than 98% of the chlorophyll-containing particles that are detected by flow cytometry (FCM). At a relative abundance of about 1%, Synechococcus is a distant second. Larger cells, mostly pigmented picoeukaryotes (1–3 μm), make up the remainder of the chlorophyll-containing particles that are counted by a flow cytometer. If phytoplankton groups are ranked by their contribution to total chlorophyll fluorescence, the balance shifts toward the larger organisms. Even then, despite its diminutive size, Prochlorococcus accounts for more than half of the chlorophyll present in the upper 200 m of the subtropical and tropical North Pacific Ocean (Campbell et al., 1994; Partensky et al., 1999). Because of their abundance, Prochlorococcus and Synechococcus represent a significant compartment of autotrophic biomass and carbon fixation in the NPSG.
The niche spaces of Prochlorococcus and Synechococcus straddle two distinct physical environments (Karl and Church, 2014). A warm surface layer with relatively homogeneous physical properties that are maintained by turbulence, floats on a stratified column, the pycnocline, which is stabilized by a density gradient that is the net result of opposite gradients in temperature and salinity. The upper, mixed-layer is relatively depleted in inorganic nitrogen (<10 nM) and other nutrients (Karl et al., 2001). The top of the pycnocline starts around a depth of 100 m (± 30 m) where the photosynthetically available radiation (PAR) is reduced to about 2% of the surface irradiance. With strong winds or surface cooling, the mixed-layer may extend well into the pycnocline, especially in winter, causing a sharp transition between the mixed and the stratified environments. In calm weather, an intermediate transition zone with a slight temperature gradient may form between the surface mixed-layer and the top of the permanent pycnocline.
FCM provides an accurate, quantitative description of the individuals that make up a phytoplankton community (Trask et al., 1982). The term FCM phenotype will be used for the aggregate of optical properties that characterizes a particle by flow cytometry. The Prochlorococcus and Synechococcus cells that are found across the two environments exhibit a wide range of FCM phenotypes, covering an almost 2-decade range in signal intensities (Vaulot et al., 1995). Broadly, chlorophyll fluorescence, and to a lesser extent forward light scatter (an approximate proxy for cell size), increase with depth. There are two explanations for the gradient in phenotypes. The increase in chlorophyll content may represent photo-acclimation: the organisms adjust their chlorophyll content, size, and shape to compensate for the changes in irradiance with increasing depth (Vaulot et al., 1995; Bricaud et al., 1999; Moore and Chisholm, 1999; Partensky et al., 1999; Mann and Chisholm, 2000). More often, the observed phenotypic variation is attributed to heterogeneity in genotype. Prochlorococcus has two main ecotypes (Partensky et al., 1999; West and Scanlan, 1999; Rocap et al., 2003; Bouman et al., 2006; Kettler et al., 2007; Zwirglmaier et al., 2008; Martiny et al., 2009) with at least 12 genomic clades (Biller et al., 2014), each with hundreds of subpopulations (Kashtan et al., 2014). Laboratory studies show that representatives of the two main ecotypes differ in light requirements for growth and consequently have been termed high-light (HL) and low-light (LL) adapted ecotypes (Moore and Chisholm, 1999). From the genomics perspective, a light gradient could cause a gradient of eco-genotypes each with a characteristic phenotype that can be distinguished with flow cytometry (Rocap et al., 2003; Zwirglmaier et al., 2008). Many reports indeed show Prochlorococcus genotype segregation with depth in the water column (Malmstrom et al., 2010). Genotype stratification could be the cause of gradients in FCM phenotype. Thus, there are two distinct, not necessarily mutually exclusive, mechanisms that may contribute to the FCM phenotype gradients of Prochlorococcus and Synechococcus observed at Station ALOHA: the local environment selects for best-fit genotypes, each with a different, distinct phenotype, or phenotype transcends the genotype and the heterogeneous cells, through a process of physiological acclimation, assume a similar shape and pigment expression to better match the requirements of ambient conditions. The relative contributions of these two mechanisms in wild type populations need to be clarified.
To complicate matters, the distribution patterns of Prochlorococcus are usually described in relation to sampling depth. Depth does not represent a reliable descriptor of the local environment. The stratified layers at Station ALOHA are subject to considerable vertical movements. Tidal and inertial forces and passing weather fronts transmit large amounts of energy along the mixed layer-pycnocline interface. This energy dissipates through subsurface waves that temporarily heave the pycnocline toward the surface and cause high-velocity shearing of adjacent density layers (Mann and Lazier, 1991; Knauss, 1996; Stewart, 2008). Consequently, the inhabitants of different water layers are not permanently fixed to one depth or isolume, but swing up and down, often 50 m or more, as a result of passing internal waves. During this process cells experience large changes in light exposure over unpredictable and often relatively short time periods (Karl et al., 2002) When considering the interplay of phenotype, genotype, acclimation, niche selection and light conditions, the dynamics of water masses must be taken into account.
The fluorescence and scatter traits of FCM phenotypes are associated with local light intensity and other environmental conditions. Analysis of FCM phenotypes in the context of a dynamic environment may reveal aspects of acclimation physiology and genome selection that shape phytoplankton communities. Such studies may also be helpful in following the movement of water masses or the dynamics of mesoscale features such as eddies. Acclimation and ecotype selection of phytoplankton populations must take place at characteristic time scales. Knowledge of the time constants at which phenotype adjustment occurs may be used to reconstruct the illumination history of a water mass. Dusenberry (1995) and Dusenberry et al. (1999) supplied evidence that acclimation-dependent phenotype differences can be used as biological markers for the dynamics of the water column. Bidigare et al. (2014) proposed an analogous approach in which ratios of specific pigments from the water column can be used to estimate mixing rates within the upper euphotic zone. Here we attempt to identify water mass characteristics by describing its individual plankton constituents through their FCM phenotypes.
During the period of 2010–2015, we acquired a large number of high-resolution depth profiles of FCM phenotypes of Prochlorococcus and Synechococcus at Station ALOHA. Under the prevailing light weather conditions, depth profiles collected throughout the year, show a characteristic gradient of FCM phenotypes. In 2014 and 2015 we observed deep mixing events that rearranged the FCM phenotype patterns. These disturbances and the subsequent return to the steady-state, confirm the notion that acclimation, whether through physiological response or genetic ecotype segregation, plays a major role in FCM phenotype distribution patterns. The results demonstrate that fine-scale sampling, in both space and time, provides valuable information identifying environmental factors that control phytoplankton abundance, biology, and ecology, and that high-resolution FCM depth profiles contain information about the circulation history of the water mass in which the phytoplankton resides.
Samples were obtained during several expeditions to Station ALOHA (6 nautical mile radius around 22° 45′ N, 158° 00′ W, Karl and Lukas, 1996) conducted on September 30-October 4, 2013 (HOT255), March 11–25, 2014 (KM1409), and December 15–19, 2014 (HOT268) using a 24-bottle CTD rosette. Water from the CTD was collected in 15 mL polypropylene tubes after three rinses with sample water. In our experience, the finer details of the pico-phytoplankton FCM phenotype rapidly degrade with established fixation and storage procedures. To avoid loss of resolution due to fixation and freezing, samples were stored in the dark without treatment at room temperature until analysis as soon as possible but no longer than 2 h after collection.
The CTD rosette sensors captured in situ temperature (T), conductivity (salinity), dissolved oxygen (DO) concentration, and fluorescence for each cast. DO concentrations were calibrated with discrete water samples collected for Winkler titration and fluorescence data were calibrated with samples collected for total chlorophyll determinations. Density (sigma theta) was calculated from (potential) temperature and salinity. Mixed-layer depth (MLD) was calculated using three independent methods (MLD1-3). MLD1 and MLD3 were set at the depth where the density anomaly (density – 1.000 × 10³) was 0.125 greater than at 1 decibar (db) or more than 0.03 greater than at 10 db, respectively. MLD2 was set at the depth where temperature was 0.05 degrees C offset from that at 1 db. Wind speed data at Station ALOHA were obtained from the Woods Hole Oceanographic Institution Hawai'i Ocean Time-series Station (WHOTS) buoy for the period of interest (http://www.soest.hawaii.edu/whots/).
Flow cytometry analysis was performed at sea in a purpose-built laboratory van mounted on the ship's deck. An inFlux cell sorter (Cytopeia, 2005, presently manufactured by Becton Dickinson, USA) fit with a low-glow, black ceramic nozzle tip, with 457 nm and 488 nm lasers, and a small-particle forward scatter detector (FSC), was used for marine particle analysis (Petersen et al., 2012). Forward and side scatter signals (FSC and SSC) were collected from the 488 nm illumination beam. Red fluorescence (692/40 nm bandpass filter) and orange fluorescence (572/27 nm bandpass filter) were collected for both the 457 nm and the 488 nm excitation lasers. Data collection of all parameters was triggered by the 488 nm scatter signal. The trigger threshold was set well below the lowest scatter signals from surface Prochlorococcus cells. Spurious scatter events and scatter-to-fluorescence cross-talk were minimized by setting the polarization of the excitation laser perpendicular to the axis of flow. At these settings, measurements of sheath fluid alone registered fewer than 10 events s−1. If higher background counts were detected, the instrument was thoroughly cleaned with 5% bleach or Contrad 90 detergent (Decon Laboratories, UK) and rinsed until the background counts fell below 10 events s−1.
Sheath fluid was prepared from concentrated BioSure 8X sheath fluid (BioSure, Grass Valley, CA) diluted to 1X concentration with DI water produced from the ship's reverse osmosis system and filtered through a 0.2 μm pore size Sterivex filter (Millipore, Billerica, MA). Flow rate was monitored with a Sensirion liquid flow meter (Sensirion, Switzerland) placed in the sample line. Samples were run at a differential pressure that yielded a flow rate of ~20 μl min−1.
Scatter and fluorescence signals were collected with user-built detector assemblies with an extended range. The detectors cover a signal range of more than 6 decades by combining the signals from two photomultipliers that operate at different gains. The relative gain settings (~100x) are calibrated by a regression analysis of the events that fall within the linear window of both detectors. After analog-to-digital conversion, the list-mode data from two detectors are combined into one plot with custom software. This approach allows simultaneous detection and display of all phytoplankton sizes ranging from dim surface dwelling Prochlorococcus to bright picoeukaryotes.
Optical alignments of lasers, lenses, and stream were conducted as follows for optimal and consistent flow cytometry while minimizing the effects of the movements of a ship at sea. After loading and pressurizing the sheath fluid, beer (Heineken, Amsterdam, The Netherlands1) was sampled for the first step of alignment. Beer fluoresces when excited by 488 nm and 457 nm lasers, is biocompatible, and has good batch-to-batch reproducibility. For these reasons it is the reagent of choice for imaging the sample stream within the sheath jet. One-mL aliquots of calibration beer may be stored at −20°C. The fluorescence of the beer sample stream, when illuminated by the laser, allows quick and optimal alignment of the spatial pinhole filter in the inFlux optical system and sample stream. Low sample flow rates (less than 1 psi difference between sample and sheath pressure) were maintained to restrict the width of the sample stream (and therefore the path of the enclosed particles) within the focal depth of the inFlux collection optics. Ultra-rainbow beads (1 μm diameter, Spherotech, USA) were used for the next stage of cytometer alignment. If needed, further adjustments to the stream, lasers, and/or small particle detectors were carried out by monitoring pulse amplitude, shape and position within the image-plane pinholes on an oscilloscope.
For relative fluorescence estimates, samples were spiked with a dilute stock of 1 μm ultra-rainbow beads. Optical alignment was confirmed and, if needed, adjusted at 30 min intervals during sampling. However, if the alignment procedures described were carried out correctly, even energetic movement of the ship did not disturb laser and stream alignments. Samples were analyzed in random order to prevent data bias due to any changes in alignment and sensitivity during data collection from an entire water column profile. Data from 100 μl of seawater were collected for each sample.
Flow cytometry data were collected in list-mode with “Spigot” software (created by Juno Cho and Barclay Purcell, no longer available through Becton-Dickinson). Stored FCM files were plotted and analyzed with custom programs written in Python. Counts of Prochlorococcus and Synechococcus populations were determined by gates drawn in bivariate distributions of 457 nm and 488 nm excited chlorophyll fluorescence.
To estimate the light exposure of cells circulating in the mixed-layer (top 100 m), we used the Beer-Lambert law where light intensity (I) decreases exponentially with depth (x):
The average extinction coefficient (α) at Station ALOHA has been empirically determined to be:
α = 0.04 (Letelier et al., 2004)
For integration we introduce a standard depth, A, where the light intensity is 1/e of the surface intensity:
Thus, the integrated light exposure of a particle traveling at a uniform velocity from the surface to a depth of 100 m (4A) is:
The average light intensity factor per depth unit is
which is equivalent to permanent residence at a depth of ~35 m.
Flow cytometry provides a quantitative description of the cell distribution and optical properties of microbial communities (Trask et al., 1982). Figure 1 illustrates the FCM phenotypes of the plankton community at Station ALOHA. A forward scatter detector registers all particles greater than 200 nm (Figure 1A). Less than half of the scattering particles naturally contain fluorescent molecules (e.g., chlorophyll, phycoerythrin) and therefore also register on one or more of the fluorescence detectors. These representative profiles for samples taken at 5-m depth intervals were obtained during a period of calm weather in October 2013 (HOT255).
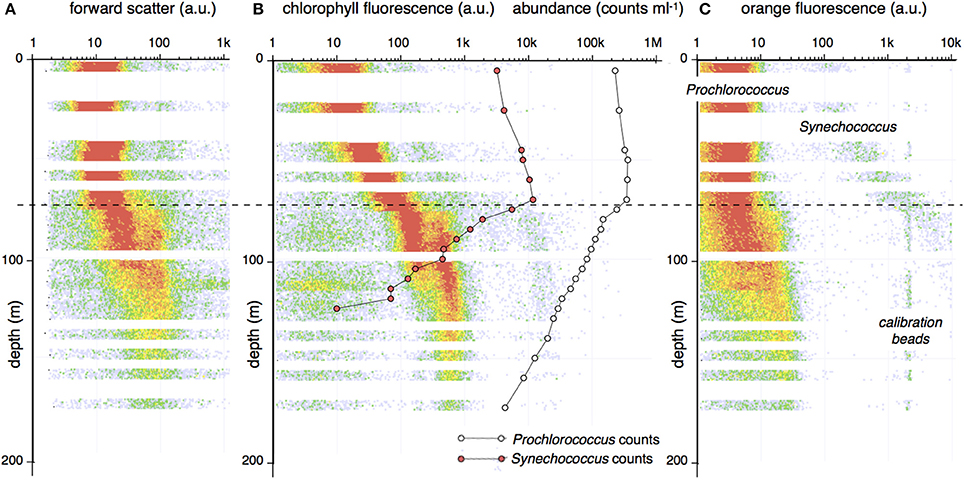
Figure 1. A characteristic flow cytometry depth profile from Station ALOHA, October 2013. Samples were collected at 5-m increments. For each sample, the scatter and fluorescence properties were determined for all cells (particles > 200 nm) present in 100 μL of seawater. A depth profile was generated by distributing the cells in a 5-m thick layer of depth/parameter bins according to the measurement properties. The color of each bin indicates the number of events with that property. The vertical axis represents depth. The horizontal axis indicates measurement values in logarithmic units (64 channels/decade). The traces represent: (A) Forward (low angle) light scatter; (B) Red fluorescence (692 ± 20 nm; a proxy for chlorophyll). (C) Orange fluorescence (570 ± 20 nm; a proxy for phycoerythrin). The center panel also shows the abundance of Prochlorococcus (open circles) and Synechococcus (red circles) expressed as cells mL−1. Cell abundance and chlorophyll fluorescence are both indicated in logarithmic (arbitrary) units on the same scale. The dotted line indicates the approximate position of the top of the permanent pycnocline. Fluorescence and cell count profiles show an abrupt change at the edge of the pycnocline.
The cell counts, light scattering, and fluorescence properties of Prochlorococcus and Synechococcus vary with depth. The distribution pattern has two distinct phases (Figure 1B). In the upper mixed layer (~80 m shown as a dashed line in Figure 1), the chlorophyll fluorescence shows a gradual, monotonic increase with depth while Synechococcus and Prochlorococcus counts increase by about 2-fold. At a depth of 80 m, there is a transition in the abundance and in the optical properties of both cell types. Beyond this depth, the population counts decline exponentially, while the chlorophyll fluorescence assumes a bimodal distribution. The position of the two modes remains relatively constant down to 175 m. Below 80 m, a dim but distinct orange fluorescence signal becomes apparent (Figure 1C) and the scatter signals of Prochlorococcus, both forward and perpendicular scatter (latter not shown), increase by an order of magnitude. Between a depth of 80 and 115 m, Prochlorococcus presents as two groups with distinct scatter and chlorophyll fluorescence properties (Figure 2). These observed distribution patterns are consistent with previous reports (Campbell et al., 1994; Binder et al., 1996; Partensky et al., 1999; Malmstrom et al., 2013).
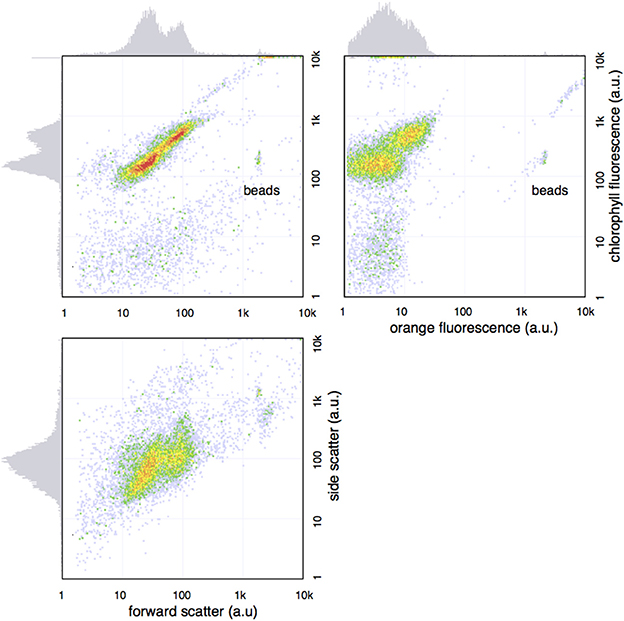
Figure 2. Bimodal distribution of Prochlorococcus seen in the sample from 90 m in the cast of Figure 1. The bivariate plot show two populations with distinct FCM phenotype, as seen by light scatter and fluorescence profiles on the x- and y-axes.
Daily high-resolution profiles collected over a period of 2 weeks in March 2014, during which there was a deep mixing event, provide insights into the dynamics of Prochlorococcus and Synechococcus populations at Station ALOHA. CTD casts performed at regular intervals before and after the wind-driven mixing event, document the rearrangement of the water column and the associated changes in the phytoplankton assemblage (Figure 3). After a period of relatively low wind-speeds ending near day 4, the average wind speed increased over a period of a few hours, then gradually decreased over several days (Figure 3). Before the mixing event, the surface zone of uniform temperature and salinity was relatively shallow ranging from 10 to 50 m. A temperature gradient between the homogeneous surface and the start of the stratified pycnocline (~100 m) supported an intermediate zone of higher salinity (Figures 4, 6A). Before the mixing event, surface temperatures were greater than 24°C. After the mixing event the surface temperatures dropped below 24°C and temperature and salinity became uniform throughout the mixed-layer (Figures 4, 6B). An abrupt inflection point in the temperature profile marked the bottom of the mixed-layer and the top of the permanently stratified thermocline/pycnocline interface. At samplings taken only a few hours apart, the depth of this temperature inflection point varied by as much as 50 m indicating the presence of subsurface waves at the mixed-layer/pycnocline interface. These large changes in the physical properties of the water column provide an excellent context in which to explore the dynamics of Prochlorococcus and Synechococcus abundances and the distribution of their phenotypes.
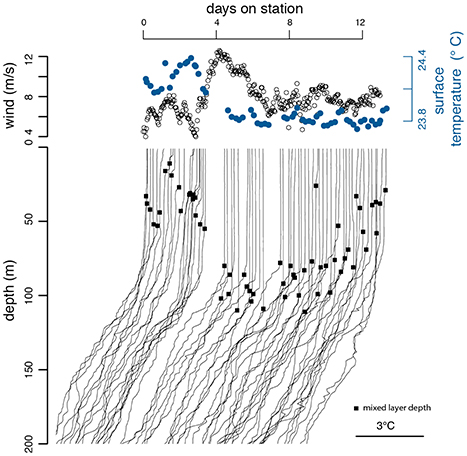
Figure 3. Wind speeds and depth/temperature profiles at Station ALOHA during a 2-week sampling period (KM1409) in March 2014. The depth profiles are shifted according to the time of measurement. The black circles on the temperature curves of the bottom panel indicate mixed-layer depth.
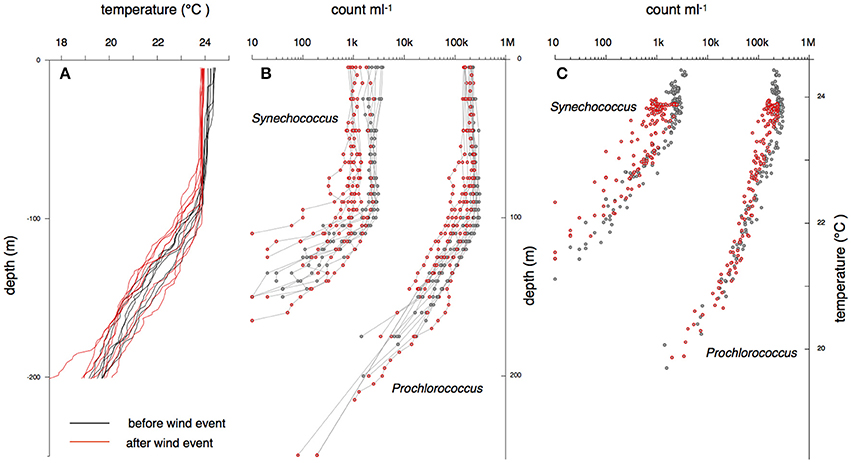
Figure 4. Temperature and cell abundance profiles collected during the 2-week period at Station ALOHA in March 2014 shown in Figure 3. Black lines indicate samples collected before a peak in wind-driven mixing and red lines indicate samples collected after the peak in wind-speed (Figure 3).
Over the 15 casts before, during, and after the deep mixing event, the cell count profiles of Prochlorococcus and Synechococcus were qualitatively similar, displaying a pattern with two distinct phases (Figure 4A). Throughout the mixed-layer, Prochlorococcus and Synechococcus counts were relatively constant varying less than a factor of two within each cast with only a few points marginally outside of this range. In contrast, below the mixed-layer, within the thermocline, Prochlorococcus and Synechococcus declined exponentially with depth (Figure 4B). Synechococcus declined at a rate of 0.07–0.09 m−1 and Prochlorococcus declined at 0.05 m−1. The rate of decline in cell count remained constant until the populations fell below the limit of detection (fewer than 10 cells per 100 μl seawater). Over the 2-week time course, the start of the exponential decline in Prochlorococcus and Synechococcus numbers oscillated between a depth of 60–120 m, with the greatest variability in the onset of exponential decline in the period after the mixing event. Throughout these oscillations, the depth of onset of the exponential decline remained correlated with the depth of the thermocline (Figure 5).
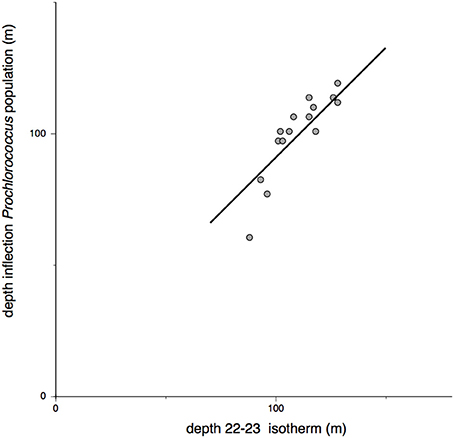
Figure 5. Relationship between Prochlorococcus abundance and the depth where water temperatures drop from 23 to 22° C. The line is drawn at an angle of 45° through the mean of the x and y coordinates.
Though the overall shapes of the profiles were similar, total abundances of Prochlorococcus and Synechococcus in the surface mixed-layer were lower immediately after the mixing event in March 2014 (Figure 4B). Throughout the surface layer, the concentrations of Prochlorococcus ranged between 1 and 3 × 10⁵ mL−1. Out of ~250 samples from the mixed zone, which were taken during both calm weather and gale force winds with deep water mixing, only a few points fell outside of a 2-fold range (Figure 4B). Synechococcus abundances showed a larger variation. The mean pre- and post-wind event values differ by about a factor of 3. Again, for individual traces, only a few points fell outside a 2-fold range (Figure 4B).
The Prochlorococcus FCM phenotype over the depth range sampled, varied with changing environmental features. Before the wind event (Figure 6A), when the water column had a shallow mixed-layer transitioning via a temporary temperature gradient into the permanent pycnocline, Prochlorococcus optical characteristics followed the general pattern as shown in Figure 1. Chlorophyll fluorescence of cells steadily increased by nearly two orders of magnitude with depth well into the thermocline. At the point where Prochlorococcus abundance began to decline, forward scatter increased (not shown), and cells started to exhibit a dim orange fluorescence, with chlorophyll fluorescence remaining relatively constant with depth (Figure 6A). As in Figure 1, the gradual changes in chlorophyll fluorescence matched the transition into the pycnocline.
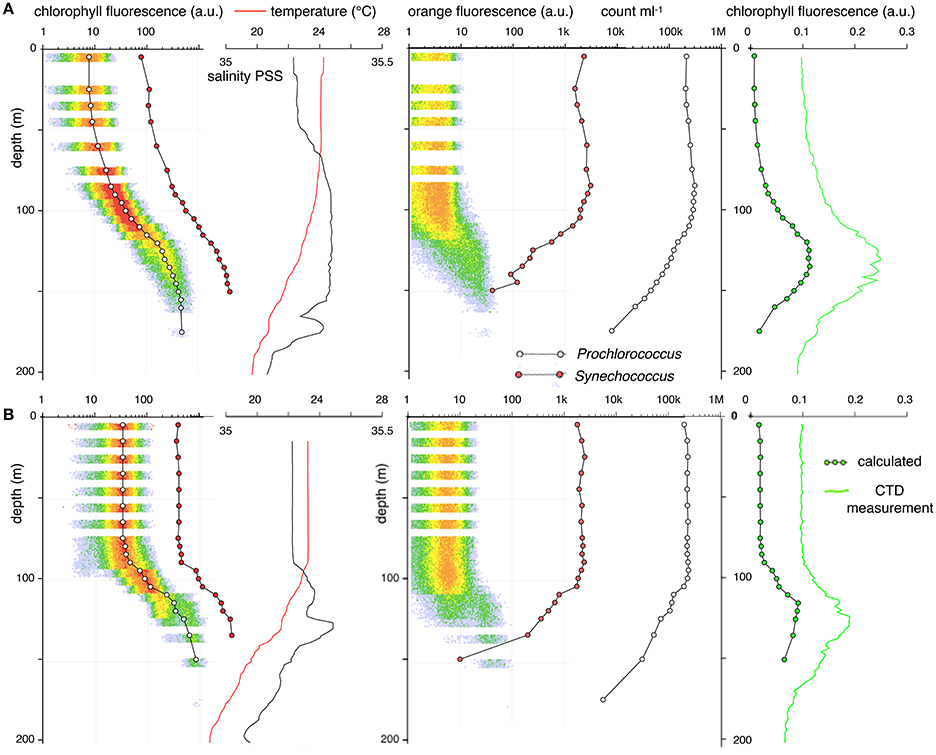
Figure 6. Abundance and optical properties of Prochlorococcus (open circles) and Synechococcus (red circles) measured by flow cytometry at Station ALOHA. The solid red line indicates temperature; the black line indicates salinity. The open circles represent the mean fluorescence and abundance of Prochlorococcus. Solid red circles represent those values for Synechococcus. The green line represents bulk fluorescence as measured by the CTD. The solid green circles represent the product of the mean Prochlorococcus fluorescence and the cell counts. (A) Depth profile in calm weather (March 14, 2014, 20:45 HST). (B) Depth profile after a deep mixing event (March 16, 2014, 18:10 HST). Before the mixing event, the mean fluorescence of Prochlorococcus and Synechococcus increases monotonically over a 50-fold range with depth. Within 24 h after homogenization of the upper water column, as evidenced by the straight salinity and temperature measurements, the fluorescence of Prochlorococcus and Synechococcus are invariant with depth at a value intermediate to the surface and deep measurements obtained just before the storm. During these changes, there is no appreciable change in Prochlorococcus or Synechococcus abundance.
While the mixing event was ongoing (Figure 6B), a sharp mixed-layer boundary at 100 m depth, was observed with a corresponding change in the Prochlorococcus phenotype and abundance with depth. In contrast to a well-stratified water column where red fluorescence increased gradually with depth (Figure 6A), chlorophyll fluorescence was constant throughout the depth of the mixed-layer before beginning a substantial increase within the thermocline (Figure 6B). In contrast to the gradual changes in the stratified column, the increase in forward scatter, red fluorescence, orange fluorescence and the exponential decay in population counts is now restricted to the pycnocline below the mixed surface 100 m.
As the winds subsided, the homogeneous chlorophyll fluorescence in the top 100 m gradually re-established its depth-related gradient where cell fluorescence increases instep with light attenuation (Figures 7, 8). For the next 4 days, the passing of internal waves, as evident from large amplitude oscillations in the mixed-layer/pycnocline interface (Figure 3) and the discontinuities in the temperature and salinity profiles, was also reflected in Prochlorococcus abundance patterns. During the large swings in the position of the mixed-layer/pycnocline interface, the inflection point in the Prochlorococcus cell count remained correlated with the top of the pycnocline (Figure 5).
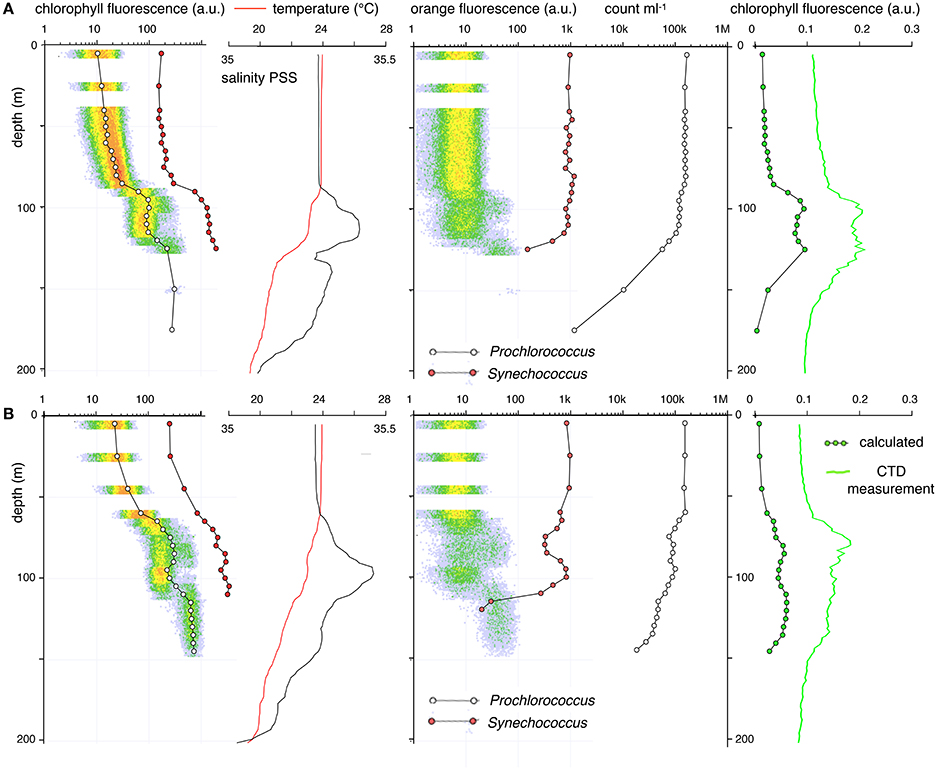
Figure 7. Two examples of 5-m resolution flow cytometry profiles of Prochlorococcus and Synechococcus that show local inversion patterns that correlate with salinity/temperature anomalies. Symbol and line coloring as in Figure 6. As the temperature of the high salinity layers equilibrates with that of the surrounding layers, the salt anomaly will descend and will be diluted by mixing with the lower salt layer underneath. The salinity/temperature anomalies correlate with discontinuities in the Prochlorococcus and Synechococcus fluorescence and abundance profiles. (A) March 19, 2014, 16:40 HST; (B) March 21, 2014, 17:00 HST.
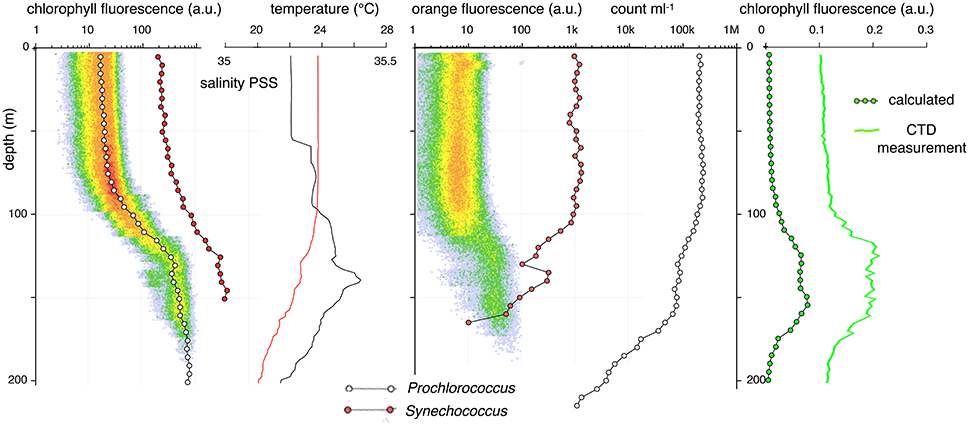
Figure 8. A 5-m FCM phenotype depth profile at Station ALOHA on March 23, 2014, 9:00 HST. After a deep mixing event the water column has become stable and a slight temperature gradient has developed in the mixed zone. The top of the thermocline still shows signs of salinity and Prochlorococcus anomalies. As in the previous profiles, discontinuities in the Prochlorococcus FCM phenotype profiles correspond to a double peak in the CTD bulk chlorophyll fluorescence trace.
Several post-storm profiles had discontinuous anomalies in the Prochlorococcus and Synechococcus profiles that were most clearly observed in the chlorophyll fluorescence traces. In these profiles a pattern normally seen at a shallower depth appears to be repeated in a deep zone (Figures 7, 8). Such repeats or inversion anomalies were always accompanied by large discontinuities in the salinity profile (Figure 7) as well as breaks in the temperature profile, indicating a vertical water column structure that had not yet returned to the calm-weather equilibrium state. When such repeats in population characteristics happened, all features of the deep layer—abundance of Prochlorococcus and Synechococcus, scatter, orange/red fluorescence— recapitulated the properties of a population closer to the surface. A week after the storm, the characteristics of the Prochlorococcus and Synechococcus populations re-established the characteristic pattern of the pre-mixing-event distributions, although some evidence of salinity anomalies was still present. The final trace again showed a double population at the mixed-zone/permanent pycnocline interface (Figure 8).
Further evidence that Prochlorococcus and Synechococcus properties are constant throughout a well-mixed layer but vary with depth under stratified conditions were obtained on HOT cruise 268 in December 2014 (Figure 9). Four profiles were taken following a deep mixing event that descended into the previously established pycnocline, as evidenced by the temperature profile. This short time-series provides no evidence of a transition between the surface and the deep Prochlorococcus populations. Abundance (between 50 and 150 × 103 cell mL−1) and FCM phenotype of Prochlorococcus in the mixed layer were relatively constant. Below the transition into the pycnocline the optical properties were abruptly different, exhibiting the high forward scatter, chlorophyll fluorescence, and orange fluorescence signals that are typical for the deep water population. As in the other profiles, the Prochlorococcus population counts decreased exponentially with sample depth.
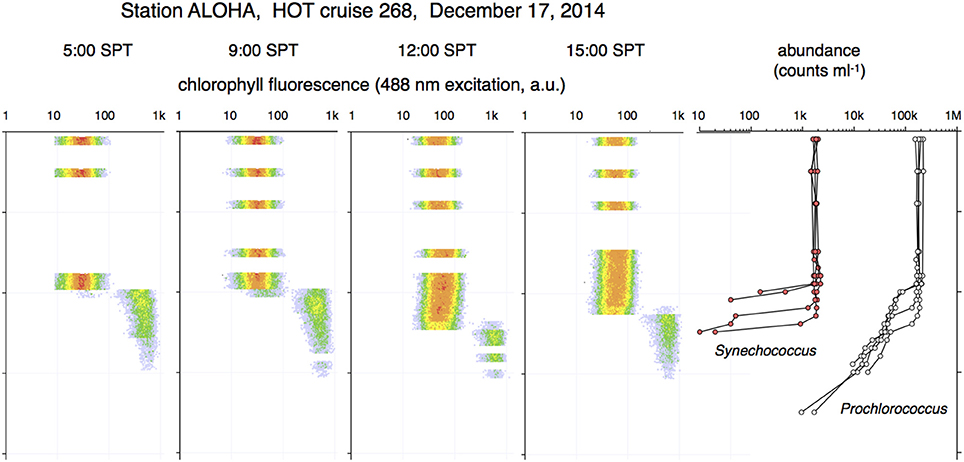
Figure 9. Deep mixing profiles from 4 casts in December 2014. The mixed layer reaches down to 100 m. The flow cytometry properties of Prochlorococcus in the upper column are homogeneous. All cells in the pycnocline are of the deep FCM phenotype.
The dynamics of Prochlorococcus and Synechococcus populations at Station ALOHA, before, during, and after a wind-driven mixing event, indicate that the gradient of phenotypes that is observed using flow cytometry (Figures 1, 6A) represents acclimation to local light conditions.
Under prolonged conditions of stable, calm weather the chlorophyll fluorescence pattern inversely matches the attenuation of light with depth over a range of nearly 2 decades. For example, the two ridges in the chlorophyll fluorescence profile of Figure 1 (the ridge near the surface and the one around 100 m) differ by a factor of 50. The reported extinction coefficient at Station ALOHA is 0.04 (Letelier et al., 2004) which corresponds to a 50-fold decrease in PAR over 100 m. In all profiles where the column is stable and stratification takes place, the mean fluorescence profile follows the 0.04 extinction profile within the 5-m sampling resolution. The close agreement between chlorophyll fluorescent intensity and the extinction coefficient of seawater is not likely to be coincidental.
After a storm, in which the top 100 m is thoroughly mixed as evidenced by uniform temperature (Figures 6B, 7, 8), the chlorophyll fluorescence signals from individual Prochlorococcus and Synechococcus cells become invariant with depth and assume a value intermediate to the signals of the surface and deep populations before mixing. This uniform chlorophyll expression pattern is reached within 24 hrs. In the aftermath of a mixing event, when the upper column again develops a shallow thermocline, the chlorophyll/depth relationship is re-established in 3–4 days (Figure 8).
Prochlorococcus and Synechococcus are reported to divide once per day (Vaulot et al., 1995; Marie et al., 1997; confirmed at Station ALOHA by Liu et al., 1995, 1997; Doggett and van den Engh, unpublished). The time scale of the changes in chlorophyll expression indicates that Prochlorococcus and Synechococcus adjust their FCM phenotype to ambient conditions rather than being replaced by a population with a different genetic makeup. After mixing of the upper water column, Prochlorococcus and Synechococcus cell abundances are lower (Prochlorococcus ~70%, Synechococcus ~30% of pre-storm numbers, Figure 4). During the subsequent re-establishment of the chlorophyll-expression gradient the abundance of both species does not change significantly. The changes in the FCM phenotype of the population occur over the span of a few cell generations (one generation to become homogeneous and at most 4 to reestablish the phenotype gradient). It is difficult to generate a plausible scenario that replaces the majority of a population by sub-population selection while maintaining a constant population size in 1–3 cell divisions. The linearization of the chlorophyll depth gradient and the subsequent re-establishment must represent physiological adaptation of the individuals in the population rather than population replacement.
Further evidence that chlorophyll expression patterns of cyanobacteria are a response to environmental factors is supplied by the observation that chlorophyll fluorescence signals of Prochlorococcus and Synechococcus are tightly correlated over a wide range of depths and environmental conditions. Figure 10 compares the chlorophyll fluorescence of Prochlorococcus and Synechococcus in all samples in which both species were present, that were collected before, during, and after the wind-driven mixing event (over 200 samples). Considering the large genomic and physiological differences between these cyanobacteria, the remarkable correlation in chlorophyll expression patterns of Prochlorococcus and Synechococcus again strongly suggests that the phenotype changes represent a response to local environmental conditions.
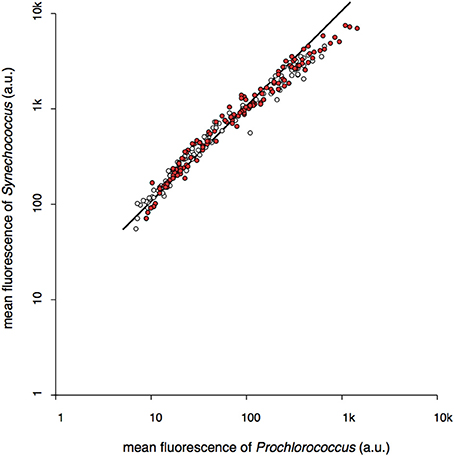
Figure 10. The relationship between the average red fluorescence (chlorophyll) of Prochlorococcus and Synechococcus populations at each depth collected over the 2-week cruise period in March 2014 during which a significant wind-drive mixing event occurred. Open circles represent samples collected before, red circles indicate samples collected after peak wind speeds.
While the population sizes of cyanobacteria in the surface layers are relatively constant, the cell counts in the pycnocline diminish exponentially with depth. From about 100 m to 200 m, Prochlorococcus counts decrease by about 5 decades in magnitude (from 2 × 10⁶ cell mL−1 to ~10 cell mL−1, Figures 1, 6). The exponential decrease in cell abundance is much steeper than the reduction of available light (<2 decades over the same range). Within the pycnocline, with cell numbers decreasing, the chlorophyll content of cells no longer matches ambient light, but becomes invariant with depth.
The transition point in the biphasic population pattern (constant population density in the surface zone; decreasing numbers at depths with less than 2% surface PAR) coincides with the depth of the top of the pycnocline. Figure 5 exhibits the point of intersection between the population plateau phase and the line through the exponential decay phase in profiles before, during, and after the storm event of 2014. Within the time span sampled, the position of the pycnocline underwent large vertical movements over a period of 12 h (Figure 3). The interpolation points move up and down in association with the position of the pycnocline. With a diel division cycle, constant cell numbers indicate that daily cell production is balanced by an equal loss in cell numbers.
Acclimation to ambient light may explain how Prochlorococcus and Synechococcus in the mixed layers are able to maintain a relatively constant population size despite a gradient in PAR. Within the upper 100 m, mean chlorophyll content of individual Prochlorococcus and Synechococcus cells increases inversely with a decrease in available light (Figures 1, 6A, 8) with little change in the forward light scatter signal (~size, Figure 1). By modulating their chlorophyll content in this manner, the photosynthetic cells in the mixed-layer zone increase their light-gathering capacity to compensate for the decrease in irradiance and maintain a constant rate of photon capture (Letelier et al., 2017). Despite a light intensity gradient of almost 2 decades, the cells are able to collect the amount of energy that is required for a daily division cycle. To maintain constant growth under decreasing light conditions, the overall light harvesting capacity per cell must increase, but since the number of collected photons per cell is constant, the mechanism that turns excited photons into chemical energy does not need to be adjusted. Therefore, the number of photo-reaction centers per cell can be expected to remain the same, resulting in an increasing ratio of chlorophyll per reaction center. Differences in chlorophyll/reaction center ratios may explain the paradoxical observation that photosynthesis rates do not correlate with chlorophyll content (Laws et al., 2016). It should be noted here that a flow cytometer measures chlorophyll fluorescence at an extremely high excitation irradiance. Fluorescence photons represent excess photons that cannot be processed by the reaction centers. Under such saturation conditions, fluorescence emission becomes proportional to the number of chlorophyll molecules. In contrast, photosynthesis rate measurements are determined by the number of reaction centers and, under saturating light conditions, are independent of light intensity (Kirk, 2011).
A large variance in chlorophyll signal combined with a near-constant population size (both in number and in volume) implies that bulk chlorophyll fluorescence measurements with CTD sensors cannot directly relate to phytoplankton population size (Cullen, 2014). The total amount of chlorophyll associated with the Prochlorococcus and Synechococcus at different depth layers can be estimated by multiplying the mean per cell chlorophyll fluorescence with the volumetric cell counts. Calculated profiles are in good agreement with the profile of the bulk chlorophyll fluorescence measured by the CTD sensor (Figures 6–8). When the CTD sensors register a double chlorophyll peak (Figures 7A,B), the calculated profile also has a bimodal shape. In all profiles, both the measured and calculated chlorophyll profiles reach a maximum just below the top of the pycnocline where the cell numbers have already started a significant decline. At the depth of the maximum chlorophyll signal (which is often used as a marker to guide depth sampling) the Prochlorococcus counts are about 1/3 and the Synechococcus counts are about 1/10 of the plateau values in the mixed-layer zone. In populations with a daily cell division, productivity must relate to population size. Since the population maximum is reached when chlorophyll measurements are still rising, bulk chlorophyll measurements cannot be expected to correlate with productivity (Cullen, 2014; Laws et al., 2016).
The previous discussion describes the properties of cyanobacteria in relation to sampling depth, as if the marine environment is a static system. However, wind events and subsurface waves frequently cause rearrangement of the water layers. Periodic wind-driven deep mixing events and/or episodes with significant subsurface waves may disturb the static conditions and may greatly affect light exposure. In a stratified ocean, Prochlorococcus and Synechococcus at a depth of 100 m receive only about 2% of the light compared to the individuals near the surface (Letelier et al., 2004). Under complete dynamic mixing, when all individuals circulate throughout the mixed zone and spend an equal time at all depths, each inhabitant would receive an integrated light dose of about 25% the surface dose or the equivalent of a stationary exposure at a depth of about 35 m (calculations in Methods and Materials). Consequently, during a deep mixing event the majority of cells will experience a significantly higher illumination dose than under stable stratified conditions.
The layers of the permanent pycnocline are not subject to vertical circulation but still may experience dynamic changes in light regime. Tidal or storm-related subsurface waves may lift and lower the top of the R pycnocline by as much as 50 m corresponding to a 10–20-fold change in photon flux with in a period of 31 h (Karl and Church, 2017, Figures 3, 4, 7). Thus, the inhabitants of the deep pycnocline will experience episodic exposure to high-light conditions. The irradiance regime in the pycnocline is different from that in the upper column. The latter will experience exposure with a diel periodicity. The light exposure in the pycnocline has a random, unpredictable component leading to a variability in irradiance including periods of relatively low photon fluxes (Letelier et al., 1996; Karl et al., 2002).
The differences in optical properties across depth profiles of Prochlorococcus and Synechococcus are often (implicitly) attributed to genomic ecotypes that segregate at different depths (Johnson et al., 2006; Zwirglmaier et al., 2008). The designation of low-light (LL) and high-light (HL) ecotypes suggests that light intensity at different depths is the determining factor (Moore and Chisholm, 1999). However, as the storm observation data show, the FCM phenotype segregation is restored within the time span of a few cell cycles after a mixing event takes place, giving little time for genotype segregation by competitive proliferation. The frequency at which the upper water column is scrambled and the speed at which equilibrium of FCM phenotype gradients are re-established indicate that acclimation and plasticity of genome expression are likely to be more important. If niche selection of genomes adapted to different niches in the water column plays a role, it is most likely to occur in the stable pycnocline where populations remain segregated over longer periods (weeks to month, or longer). Light intensity is not the only, or even the major defining difference between the periodically mixed-layer and the stable pycnocline (Braakman et al., 2017). Compared to the mixed-layer zone, the pycnocline has higher nutrient concentrations with a different composition (Karl and Church, 2017). The inhabitants of the pycnocline are not always in the dark but may experience elevated light conditions of an aperiodic, random nature due to subsurface waves. If there are differences in genomic traits between mixed-layer and pycnocline inhabitants, they can be expected to include metabolic requirements (Björkman et al., 2015) and adaptations to a diel light cycle in the mixed-layer zone vs. a random irradiance regime in the pycnocline (Ottesen et al., 2014).
One more aspect must be considered. In living organisms, fluorescence intensity is not necessarily proportional to chromophore content (van den Engh and Farmer, 1992; Asbury et al., 2000; Uy et al., 2004). Light collection for photosynthesis involves pigment complexes that dissipate energy along multiple pathways. Photon energy moves among pigment molecules by resonant energy transfer. The energy may be used for photosynthesis or may be released as fluorescence or heat. Energy transfer depends to the sixth power on molecular distances (Jovin, 1979). Therefore, small changes in molecular arrangements may have a large effect on the ratio of photon capture vs. fluorescence emission. In addition, phototrophs express variable amounts of compounds (e.g., zeaxanthin) that quench chlorophyll's excited state, further affecting the relationship between fluorescence and photosynthetic activity (Bricaud et al., 1995; Falkowski and Raven, 1997). If cyanobacteria are capable of adjusting their chlorophyll content to match ambient conditions, the cells may also be able to modulate their absorption efficiency. This could be accomplished by adjusting the molecular arrangement or composition of their light harvesting complex, thereby affecting the efficiency of chlorophyll fluorescence. More information about fluorescence spectra and efficiencies is needed for an accurate quantitative interpretation of in situ chlorophyll fluorescence signals.
This study demonstrates the potential of high-resolution depth profiling and single cell analysis by flow cytometry in analyzing marine microbial community structure and dynamics. Fine-scale features, both temporal and spatial, reveal intricate relationships and dependencies between phototrophic microbes and their dynamic physical environment that are easily missed with samples collected at a few standard depths. Our observations show that microbial community structure may undergo sudden, dramatic changes within a narrow depth range, especially when crossing boundary layers. Understanding of the nature and cause of such changes may reveal hidden mechanisms and patterns of phytoplankton behavior. High-resolution sampling combined with detailed single cell analysis of phenotype, metabolic activity, genomic identity and functional gene capacity will be valuable in deciphering the rules of genetic adaptation and metabolic acclimation that determine the differences in lifestyles of Prochlorococcus and Synechococcus in the open ocean.
GvdE: primary author, designed experimental equipment, participated in all experiments. JD: participated in all experiments, reviewed and contributed to manuscript. AT: participated in crucial experiments, made major contributions to manuscript. MD: participated in crucial experiments, reviewed and made major contributions to manuscript. CG, participated in crucial experiments, reviewed and contributed to manuscript. DK: made major contributions to experimental design and final content of manuscript.
At the time when the experiments were conducted GvdE and AT were employed by BD BioSciences, a major developer and distributor of flow cytometry equipment. The article may be perceived as promoting a specific model of flow cytometer that is manufactured and sold by BD. GvdE and AT no longer have any financial interest in the company.
The other authors declare that the research was conducted in the absence of any commercial or financial relationships that could be construed as a potential conflict of interest.
We thank the officers and crews of the R/V Kilo Moana and Kaimikai-O-Kanaloa, and the scientists aboard for their assistance in sample collection. Funding was provided by the National Science Foundation (grant #OCE-1260164) and (award #1646709 to AT), the Gordon and Betty Moore Foundation (award #3794 to DK), and the Simons Foundation (SCOPE award #329108 to DK). CG is a recipient of a Fulbright fellowship and received support from Fondecyt, Chile. MD's participation in this research was funded by the Australian Government through the Australian Research Council (LE130100019). During a period of this study AT and GvdE were employed by BD BioSciences. The opportunity to do research that is not directly linked to BD's commercial mission is greatly appreciated. We thank Andy Siegel (Foster School of Business, UW) for checking the calculation of the light exposure of circulating particles.
1. ^Full disclosure: one of the authors (GvdE) hails from Amsterdam. His Dutch roots may have played a role in the selection of Heineken brand beer. In our experience, all lager labels, irrespective of gustatory qualities, are equally suitable for the calibration and alignment of flow cytometry equipment.
Asbury, C. L., Uy, J. L., and van den Engh, G. (2000). Polarization of fluorescence and scatter signals in flow cytometry. Cytometry 40, 88–101. doi: 10.1002/(SICI)1097-0320(20000601)40:2<88::AID-CYTO2>3.0.CO;2-J
Bidigare, R. R., Buttler, F. R., Christensen, S. J., Barone, B., Karl, D. M., and Wilson, S. T. (2014). Evaluation of the utility of xanthophyll cycle pigment dynamics for assessing upper ocean mixing processes at Station ALOHA. J. Plankton Res. 36, 1423–1433. doi: 10.1093/plankt/fbu069
Biller, S. J., Berube, P. M., Berta-Thompson, J. W., Kelly, L., Roggensack, S. E., Awad, L., et al. (2014). Genomes of diverse isolates of the marine cyanobacterium Prochlorococcus. Sci. Data. 1:140034. doi: 10.1038/sdata.2014.34
Binder, B. J., Chisholm, S. W., Olson, R. J., Frankel, S. L., and Worden, A. Z. (1996). Dynamics of picophytoplankton, ultraphytoplankton and bacteria in the central equatorial Pacific. Deep-Sea Res. Part II 4–6, 907–931. doi: 10.1016/0967-0645(96)00023-9
Björkman, K. M., Church, M. J., Doggett, J. K., and Karl, D. M. (2015). Differential assimilation of inorganic carbon and leucine by Prochlorococcus in the oligotrophic North Pacific Subtropical Gyre. Front. Microbiol. 17:1401. doi: 10.3389/fmicb.2015.01401
Bouman, H. A., Ulloa, O., Scanlan, D. J., Zwirglmaier, K., Li, W. K. W., Platt, T., et al. (2006). Oceanographic basis of the global surface distribution of Prochlorococcus ecotypes. Science 312, 918–921. doi: 10.1126/science.1122692
Braakman, R., Follows, M. J., and Chisholm, S. W. (2017). Metabolic evolution and the self-organization of ecosystems. Proc. Natl. Acad. Sci. U.S.A. 114, E3091–E3100. doi: 10.1073/pnas.1619573114
Bricaud, A., Allali, K., Morel, A., Marie, D., Veldhuis, M. J. W., Partensky, F., et al. (1999). Divinyl chlorophyll a-specific absorption coefficients and absorption efficiency factors for Prochlorococcus marinus: kinetics of photoacclimation. Mar. Ecol. Prog. Ser. 188, 21–32. doi: 10.3354/meps188021
Bricaud, A., Babin, M., Morel, A., and Claustre, H. (1995). Variability of chlorophyll specific absorption coefficient of natural plankton: analysis and parameterization. J. Geophys. Res. 109, C11010. doi: 10.1029/2004JC002419
Campbell, L., Nolla, H. A., and Vaulot, D. (1994). The importance of Prochlorococcus to community structure in the central North Pacific Ocean. Limnol. Oceanogr. 39, 954–961. doi: 10.4319/lo.1994.39.4.0954
Campbell, L., and Vaulot, D. (1993). Photosynthetic picoplankton community structure in the subtropical North Pacific Ocean near Hawaii (station ALOHA). Deep-Sea Res. Part I 40, 2043–2060. doi: 10.1016/0967-0637(93)90044-4
Cullen, J. J. (2014). Subsurface chlorophyll maximum layers: enduring enigma or mystery solved? Annu. Rev. Mar. Sci. 7, 207–239. doi: 10.1146/annurev-marine-010213-135111
Dusenberry, J. A. (1995). Picophytoplankton Photoacclimation and Mixing in the Surface Oceans. Ph.D. thesis, MIT.
Dusenberry, J. A., Olson, R. J., and Chisholm, S. W. (1999). Frequency distributions of phytoplankton single-cell fluorescence and vertical mixing in the surface ocean. Limnol. Oceanogr. 44, 431–435. doi: 10.4319/lo.1999.44.2.0431
Johnson, Z. I., Zinser, E. R., Coe, A., McNulty, N. P., Woodward, E. M. S., and Chisholm, S. W. (2006). Niche partitioning among Prochlorococcus ecotypes along ocean-scale environmental gradients. Science 311, 1737–1740. doi: 10.1126/science.1118052
Jovin, T. M. (1979). “Fluorescence polarization and energy transfer: theory and application,” in Flow Cytometry and Sorting, eds M. R. Melamed, P. F. Mullaney, and M. L. Mendelsohn (New York, NY: Wiley and Sons), 137–166.
Karl, D., Bidigare, R., and Letelier, R. M. (2002). “Sustained seasonal and interannual variability of phytoplankton processes in the NPSG,” in Phytoplankton Productivity: Carbon Assimilation in Marine and Freshwat4er Ecosystems, eds P. J. LeB, W. D. N. Thomas, and C. Reynolds (Oxford: Blackwell Science Ltd.), 222–264.
Karl, D. M., Björkman, K. M., Dore, J. E., Fujieki, L., Hebel, D. V., Houlihan, T., et al. (2001). Ecological nitrogen-to-phosphorus stoichiometry at Station ALOHA. Deep-Sea Res. Part II 48, 1529–1566. doi: 10.1016/S0967-0645(00)00152-1
Karl, D. M., and Church, M. J. (2014). Microbial oceanography and the Hawaii Ocean Time-series programme. Nat. Rev. Microbiol. 12, 699. doi: 10.1038/nrmicro3333
Karl, D. M., and Church, M. J. (2017). Ecosystem structure and dynamics in the North Pacific Subtropical Gyre: new views of an old ocean. Ecosystems 20, 433–457. doi: 10.1007/s10021-017-0117-0
Karl, D. M., and Lukas, R. (1996). The Hawaii Ocean Time-series (HOT) program: background, rationale and field implementation. Deep-Sea Res. Part II 43, 129–156. doi: 10.1016/0967-0645(96)00005-7
Kashtan, N., Roggensack, S. E., Rodrigue, S., Thompson, J. W., Biller, S. J., and Coe, A. (2014). Single-cell genomics reveals hundreds of coexisting subpopulations in wild Prochlorococcus. Science 344, 416–420. doi: 10.1126/science.1248575
Kettler, G. C., Martiny, A. C., Huang, K., Zucker, J., Coleman, M. L., and Rodrigue, S. (2007). Patterns and implications of gene gain and loss in the evolution of Prochlorococcus. PLoS Genet. 3:e231. doi: 10.1371/journal.pgen.0030231
Laws, E. A., Bidigare, R. R., and Karl, D. M. (2016). Enigmatic relationship between chlorophyll a concentrations and photosynthetic rates at Station ALOHA. Heliyon 2, 2–15. doi: 10.1016/j.heliyon.2016.e00156
Letelier, R. M., Dore, J. E., Winn, C. D., and Karl, D. M. (1996). Seasonal and interannual variations in photosynthetic carbon assimilation at Station ALOHA. Deep-Sea Res. Part II 43, 467–490. doi: 10.1016/0967-0645(96)00006-9
Letelier, R. M., Karl, D. M., Abbott, M. R., and Bidigare, R. R. (2004). Light driven seasonal patterns of chlorophyll and nitrate in the lower euphotic zone of the North Pacific Subtropical Gyre. Limnol. Oceanogr. 49, 508–519. doi: 10.4319/lo.2004.49.2.0508
Letelier, R. M., White, A. E., Bidigare, R. R., Barone, B., Church, M. J., and Karl, D. M. (2017). Light absorption by phytoplankton in the North Pacific subtropical gyre. Limnol. Oceanogr. 62, 1526–1540. doi: 10.1002/lno.10515
Liu, H., Campbell, L., and Landry, M. R. (1995). Growth and mortality rates of Prochlorococcus and Synechococcus measured with a selective inhibitor technique. Mar. Ecol. Prog. Series 116, 277–287.
Liu, H., Nolla, H., and Campbell, L. (1997). Prochlorococcus growth rate and contribution to primary production in the equatorial and subtropical North Pacific Ocean. Aquat. Microb. Ecol. 12, 39–47. doi: 10.3354/ame012039
Malmstrom, R. R., Coe, A., Kettler, G. C., Martiny, A. C., Frias-Lopez, J., and Zinser, E. R. (2010). Temporal dynamics of Prochlorococcus ecotypes in the Atlantic and Pacific oceans. ISME J. 4, 1252–1264. doi: 10.1038/ismej.2010.60
Malmstrom, R. R., Rodrigue, S., Huang, K. H., Kelly, L., Kern, S. E., Thompson, A., et al. (2013). Ecology of uncultured Prochlorococcus clades revealed through single-cell genomics and biogeographic analysis. ISME J. 7, 184–198. doi: 10.1038/ismej.2012.89
Mann, E. L., and Chisholm, S. W. (2000). Iron limits the cell division rate of Prochlorococcus in the eastern equatorial Pacific. Limnol. Oceanogr. 45, 1067–1076. doi: 10.4319/lo.2000.45.5.1067
Mann, K. H., and Lazier, J. R. N. (1991). Dynamics of Marine Ecosystems: Biological-Physical Interactions in the Oceans. Cambridge, MA: Blackwell Scientific Publications.
Marie, D., Partensky, F., Jacquet, S., and Vaulot, D. (1997). Enumeration and cell cycle analysis of natural populations of marine picoplankton by flow cytometry using the nucleic acid stain SYBR Green 1. Appl. Environ. Microbiol. 63, 186–193.
Martiny, A. C., Kathuria, S., and Berube, P. M. (2009). Widespread metabolic potential for nitrite and nitrate assimilation among Prochlorococcus ecotypes. Proc. Natl. Acad. Sci. U.S.A. 106, 10787–10792. doi: 10.1073/pnas.0902532106
Moore, L. R., and Chisholm, S. W. (1999). Photophysiology of the marine cyanobacterium Prochlorococcus: ecotypic differences among cultured isolates. Limnol. Oceanogr. 44, 628–638. doi: 10.4319/lo.1999.44.3.0628
Ottesen, E. A., Young, C. R., Gifford, S. M., Eppley, J. M., Marin, R., Schuster, S. C., et al. (2014). Multispecies diel transcriptional oscillations in open ocean heterotrophic bacterial assemblages. Science 345, 207–212. doi: 10.1126/science.1252476
Partensky, F., Hess, W. R., and Vaulot, D. (1999). Prochlorococcus, a marine photosynthetic prokaryote of global significance. Microbiol. Molec. Biol. Rev. 63, 106–127.
Petersen, T. W., Harrison, B., Horner, D. N., and van den Engh, G. (2012). Flow cytometric characterization of marine microbes. Methods 57, 350–358. doi: 10.1016/j.ymeth.2012.07.001
Rocap, G., Larimer, F. W., Lamerdin, J., Malfatti, S., Chain, P., and Ahlgren, N. A. (2003). Genome divergence in two Prochlorococcus ecotypes reflects oceanic niche differentiation. Nature 424, 1042–1047. doi: 10.1038/nature01947
Trask, B. J., van den Engh, G. J., and Elgershuizen, J. H. B. W. (1982). Analysis of phytoplankton by flow cytometry. Cytometry 2, 258–264. doi: 10.1002/cyto.990020410
Uy, J. L., Asbury, C. L., Petersen, T. W., and van den Engh, G. (2004). The polarization of fluorescence of DNA stains depends on the incorporation density of the dye molecules. Cytometry 61A, 18–25. doi: 10.1002/cyto.a.20059
van den Engh, G. J., and Farmer, C. (1992). Photo-bleaching and photon saturation in flow cytometry. Cytometry 13, 669–677. doi: 10.1002/cyto.990130702
Vaulot, D., Marie, D., Olson, R. J., and Chisholm, S. W. (1995). Growth of Prochlorococcus, a photosynthetic prokaryote, in the equatorial Pacific Ocean. Science 268, 1480–1482. doi: 10.1126/science.268.5216.1480
West, N. J., and Scanlan, D. J. (1999). Niche-partitioning of Prochlorococcus populations in a stratified water column in the Eastern North Atlantic Ocean. Appl. Environ. Microbiol. 65, 2585–2591.
Zwirglmaier, K., Jardillier, L., Ostrowski, M., Mazard, S., Garczarek, L., and Vaulot, D. (2008). Global phylogeography of marine Synechococcus and Prochlorococcus reveals a distinct partitioning of lineages among oceanic biomes. Environ. Microbiol. 10, 147–161. doi: 10.1111/j.1462-2920.2007.01440.x
Keywords: flow cytometry, Prochlorococcus, Synechococcus, Station ALOHA, thermocline, population dynamics, light acclimation
Citation: van den Engh GJ, Doggett JK, Thompson AW, Doblin MA, Gimpel CNG and Karl DM (2017) Dynamics of Prochlorococcus and Synechococcus at Station ALOHA Revealed through Flow Cytometry and High-Resolution Vertical Sampling. Front. Mar. Sci. 4:359. doi: 10.3389/fmars.2017.00359
Received: 07 July 2017; Accepted: 25 October 2017;
Published: 27 November 2017.
Edited by:
Matthew J. Church, University of Montana, United StatesReviewed by:
Luke Thompson, Southwest Fisheries Science Center (NOAA), United StatesCopyright © 2017 van den Engh, Doggett, Thompson, Doblin, Gimpel and Karl. This is an open-access article distributed under the terms of the Creative Commons Attribution License (CC BY). The use, distribution or reproduction in other forums is permitted, provided the original author(s) or licensor are credited and that the original publication in this journal is cited, in accordance with accepted academic practice. No use, distribution or reproduction is permitted which does not comply with these terms.
*Correspondence: Ger J. van den Engh, Z2VyLmVuZ2hAbWUuY29t
Disclaimer: All claims expressed in this article are solely those of the authors and do not necessarily represent those of their affiliated organizations, or those of the publisher, the editors and the reviewers. Any product that may be evaluated in this article or claim that may be made by its manufacturer is not guaranteed or endorsed by the publisher.
Research integrity at Frontiers

Learn more about the work of our research integrity team to safeguard the quality of each article we publish.