 Friederike G. Engel
 Aleksandra M. Lewandowska
 Sarah L. Eggers
 Birte Matthiessen
94% of researchers rate our articles as excellent or good
Learn more about the work of our research integrity team to safeguard the quality of each article we publish.
Find out more
METHODS article
Front. Mar. Sci., 27 September 2017
Sec. Marine Ecosystem Ecology
Volume 4 - 2017 | https://doi.org/10.3389/fmars.2017.00317
This article is part of the Research TopicChanging Plankton Communities: Causes, Effects and ConsequencesView all 14 articles
Ecological research in recent decades revealed that species loss has a predominantly negative effect on ecosystem functioning and stability. Most of these studies were based on random species loss scenarios, but extinctions in nature are not random. Recent experimental studies using macroscopic communities largely advanced knowledge about the effects of non-random species loss. However, in microscopic communities like the phytoplankton, implementing realistic species loss scenarios is challenging and experimental data are scarce. Creating more realistic experiments to study the role of phytoplankton diversity for ecosystem functioning is particularly important, as they provide up to 50% of global primary productivity, form the basis of all pelagic food webs, and are important for biogeochemical cycling. In this study, we experimentally tested and evaluated three methods for non-random species loss in a natural marine phytoplankton community. Dilution, filtration, and heat stress removed the targeted rare, large, and sensitive species, respectively. All these species groups are extremely vulnerable to extinction in future climate scenarios and play important roles in the communities. Dilution and filtration with a fine mesh additionally decreased initial biomass, which increased the variability of species left in the respective replicates. The methods tested in this study can be used to non-randomly manipulate phytoplankton species diversity in communities used for experiments. However, in studies where species identities are more important than species richness, the dilution and filtration methods should be modified to eliminate the effect of decreasing initial biomass.
Over the last centuries, humans have increasingly influenced and modified all ecosystems on planet Earth. Habitat destruction, the emission of greenhouse gases, and the introduction of non-native species led to species loss rates comparable to historic mass extinction events (Barnosky et al., 2011). A large number of experimental studies tested the effects of species loss on different ecosystem processes. They uncovered a generally negative effect of species loss on ecosystem functioning and stability (Hooper et al., 2005; Cardinale et al., 2012). Depending on the magnitude of species loss, its effect size on ecosystem functioning is comparable to those arising from direct effects of environmental factors, such as acidification or nutrient pollution (Hooper et al., 2012). To date, in most diversity manipulation experiments, researchers altered species richness by randomly adding species to or excluding them from communities (Bracken and Low, 2012; Mensens et al., 2015; Radchuk et al., 2015). However, loss of species in natural communities is not random, but depends on a multitude of factors including population size (i.e., rarity), body size, and sensitivity to environmental stress (Gross and Cardinale, 2005). Previous research showed that the effects of biodiversity loss on ecosystem functioning can largely differ in randomly assembled communities compared to communities experiencing non-random species loss (Solan et al., 2004; Bracken et al., 2008; Mensens et al., 2015).
Manually removing or adding target species is feasible in communities with larger and substrate-bounded organisms, such as in grasslands (Zavaleta and Hulvey, 2004; Selmants et al., 2012, 2014) or the marine benthos (Bracken et al., 2008; Stachowicz et al., 2008; Bracken and Low, 2012). However, in microbial communities, such as phytoplankton, the manipulation of non-random species loss from natural communities is particularly challenging. A recent laboratory experiment with freshwater phytoplankton showed that it is possible to create communities with distinct species richness gradients using different levels of dilution and disturbance (Hammerstein et al., 2017). Nevertheless, technically it is nearly impossible to remove certain target species or groups from a natural microbial community without significantly altering the overall organism density. Hence, such diversity manipulations are prone to be confounded with a hidden density treatment, which can have two major consequences. First, it can directly affect the total biomass which is often used as a measure for ecosystem functioning. Second, it can enhance the variability of which species are remaining in a treated community and thus indirectly affect ecosystem functioning. To date the latter problem remains largely unquantified, so that the effects of realistic changes in phytoplankton diversity on ecosystem functioning in experiments remain essentially unknown (Gamfeldt et al., 2015).
Even though extinctions in the oceans are not as common as on land, and direct extinctions caused by humans were less often recorded for marine organisms, the influence humans have on aquatic ecosystems is immense and will likely continue to increase (McCauley et al., 2015). In particular for marine phytoplankton, that contribute almost 50% to global primary production (Field et al., 1998) and play an important role in biogeochemical cycling (Falkowski et al., 1998), future changes in biodiversity remain speculative.
In the present study, we tested different methods to non-randomly remove rare, large and sensitive species from natural phytoplankton communities. These methods can be employed to manipulate community composition before the onset of an experiment or they can be used as factors in the experiment to create different levels of species composition. In the following section we elaborate on the rationale behind focusing on these particular groups.
Rare species are often characterized by small population sizes, narrow geographical ranges and little genetic variation within populations (Rabinowitz, 1981; Frankham, 2005; Harnik et al., 2012). These characteristics in combination with stochastic processes make rare species more likely to go extinct than common species (Lande, 1993; Frankham, 2005; O'Grady et al., 2006; Leitão et al., 2016). Due to numerical disadvantages, rarity is often accompanied by competitive inferiority which can lead to extinction by competitive exclusion. An example of competitive inferiority can be seen in the context of priority effects, where the first colonizers exhibit a numerical advantage such that they can exclude later arriving species by monopolizing shared resources (Urban and De Meester, 2009; de Meester et al., 2016). Priority effects can also happen at the onset of a phytoplankton bloom. Eggers and Matthiessen (2013) showed experimentally that the initial structure of a phytoplankton community influenced the identity of the respective dominant species at bloom peak.
Despite their increased risk of extinction, rare species are important in communities because they can maintain ecosystem functions under changing environmental conditions when they substitute for dominant species that are lost or decline in numbers (Walker et al., 1999; Norberg et al., 2001; Elmqvist et al., 2003; Lyons et al., 2005; Mouillot et al., 2013; Jain et al., 2014; Leitão et al., 2016; Jousset et al., 2017). Hence, manipulating the loss of rare species in bloom building phytoplankton can provide important information about possible future scenarios, in which these species might be lost at disproportionally high rates.
Experiments and observations have shown that rising seawater temperatures lead to the reduction of average cell size in phytoplankton communities (Morán et al., 2010; Peter and Sommer, 2012; Sommer et al., 2012). Though the underlying reasons are not completely understood yet, current research suggests that it is partly driven by decreased nutrient availability in the euphotic layer of the oceans due to stronger stratification under warmer conditions (Hofmann et al., 2011; Winder and Sommer, 2012; Acevedo-Trejos et al., 2014; Lewandowska et al., 2014). This situation benefits smaller-sized cells. Small cells have more efficient nutrient uptake rates because they have more favorable surface area to volume ratios (Aksnes and Egge, 1991; Raven, 1998; Mara-ón, 2014). Additionally, experiments have attributed the increase in smaller phytoplankton cell sizes with warming to trophic interactions. Depending on the preferred size spectrum of the prey, more intense grazing by zooplankton under higher temperatures can lead to the reduction in average phytoplankton cell size in a community (Sommer and Lewandowska, 2011). Since smaller cell size has been proposed to be one of the universal responses to global warming for aquatic organisms (Daufresne et al., 2009), testing the effect of losing larger species from phytoplankton communities can be very important for future phytoplankton diversity experiments.
Species are considered sensitive when they have a narrow environmental optimum and therefore steep reaction norms. They are generally very susceptible to changes in the environment including a variety of biotic and abiotic factors, such as salinity, pH, and temperature. In this study, we tested the effect of losing heat sensitive species, because one of the major changes in the future ocean is predicted to be an increase in the average surface ocean temperature (IPCC, 2014). Many species that are sensitive to environmental change are at the same time low in their abundance, because they have very specialized habitat requirements (Davies et al., 2004). Therefore, we additionally combined the loss of sensitive and rare species as one of the treatments, a valuable addition to the experimental design as it can improve our understanding of the mechanisms underlying sensitive species loss.
The aim of this study was to test the immediate effects of the above described non-random species loss scenarios on a natural phytoplankton community and to evaluate their impact on diversity change at bloom peak. Additionally, we aimed to qualitatively analyze how far the manipulations led to increased variability in species identities present in the communities (i.e., whether the methods manipulated the loss of the same species among replicates).
The experimental units consisted of white polypropylene buckets filled with 25 L of sterile filtered (0.2 μm) seawater that we collected from the Kiel Fjord (Kiel, Germany) in March 2013. At that time it was possible to obtain nutrient-rich winter water with dissolved inorganic nutrient concentrations of 30.73 μmol L−1 nitrate and nitrite (NO3 + NO2), 0.77 μmol L−1 phosphate (PO4), and 34.77 μmol L−1 silicate (SiO4).
We distributed the experimental units randomly in two temperature controlled rooms (10°C) that were equipped with computer-programmed ceiling light units (Econlux, Hibay LED 100 W, full sun-light spectrum) providing light from above and creating an underwater light intensity of 130 μmol m−2 s−1 and a light-dark cycle of 16:8 h. This corresponded to the local irradiance levels in Kiel Fjord at the time of the year the experiment was conducted (Brock, 1981).
Depending on the treatment, we inoculated the experimental units with different volumes of a natural phytoplankton stock community that was collected shortly before the experimental start from surface waters of the Kiel Fjord, Germany in April 2013 at the onset of spring bloom. To exclude meso-grazers (copepods) from the experiment, we pre-filtered the stock community with a 200 μm sieve. For a detailed description of treatment application see section Manipulation of Different Species Loss Scenarios and Table 1.
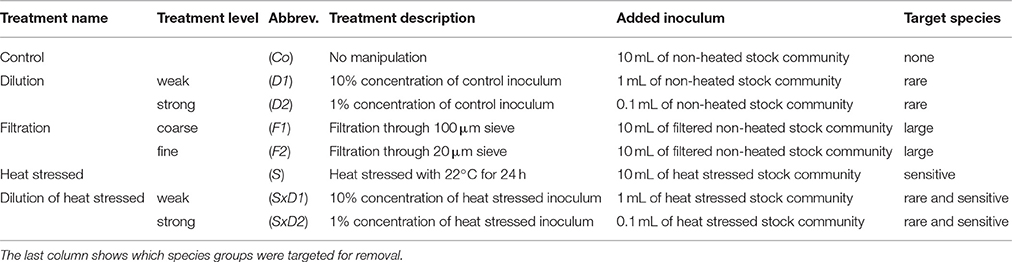
Table 1. Overview of the experimental design with treatment names and levels, abbreviations, and how the treatments were realized.
We stirred the water body of each experimental unit carefully once per day to ensure a homogenous distribution of the phytoplankton in the experimental units. To prevent airborne particle transport into the experimental units, but still allowing for oxygen exchange and light penetration, we loosely covered the buckets with transparent polyethylene foil.
We applied three methods (dilution, filtration, and heat stress), resulting in five treatments (Table 1): control (Co–no manipulation), dilution to remove rare species (two levels: D1–weak dilution, D2–strong dilution), filtration to remove large species (two levels: F1–coarse filtration, F2–fine filtration), heat stressed (S) to remove heat sensitive species, and dilution of heat stressed to simultaneously remove sensitive and rare species (two levels: SxD1–weak dilution of heat stressed, SxD2–strong dilution of heat stressed). Each treatment level and combination was 4-fold replicated which resulted in 32 experimental units in total.
In order to lose temperature sensitive species prior to the experimental onset, we separated the collected and pre-filtered stock community into two temperature treatments (control (10°C) = non-heated stock community; heat stress (22°C) = heated stock community). We chose 22°C, because it represents a critical temperature for many Baltic Sea auto- and heterotrophs (Reusch et al., 2005; Eggers et al., 2012; Werner et al., 2016). The stock communities were stored in closed glass bottles (Duran, 2,500 mL) in climate cabinets for 24 h. After 24 h, we inoculated the experimental units according to the different treatments (Table 1). For the control (Co), we added 10 mL of the non-heated stock community. We applied the two levels of the dilution treatment by adding inocula of 1 and 0.1 mL of the non-heated stock community, resulting in 10% (D1) and 1% (D2) of the control concentrations, respectively. For the two levels of the filtration treatment, we filtered the non-heated stock community with 100 μm (F1) and 20 μm (F2) sieves, respectively. 10 mL of the respective filtrates were added to the experimental units. For the heat stressed treatment (S), we added 10 mL of the heated stock community to the experimental units. To prepare the combined treatment of heat stress and dilution, we added inocula of 1 and 0.1 mL of the heated stock community to achieve 10% (SxD1) and 1% (SxD2) concentrations of the heat stressed treatment, respectively. For an overview of all treatments, treatment levels and combinations as well as their respective inocula volumes see Table 1.
To assess if the targeted species were actually lost due to the specific diversity manipulations, we classified each species as at least one of the following four categories: common, rare, large, and sensitive (Table 2, Figure 1). We based these categorizations on species abundances (common or rare species) and cell sizes (large species) obtained microscopically from a 100 mL sample of the non-heated stock community. Additionally, we microscopically determined species abundances in a 100 mL sample of the heated stock community to define sensitive species. For a detailed overview of the categorizations see Table 2.
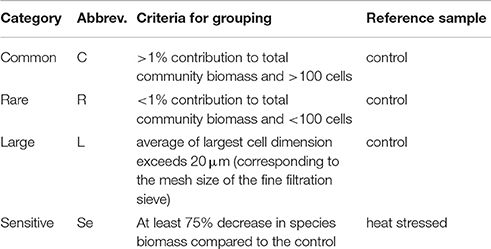
Table 2. Categorization of species into separate groups based on 100 mL samples analyzed of the control (non-heated stock community) and heat stressed treatment (heated stock community).
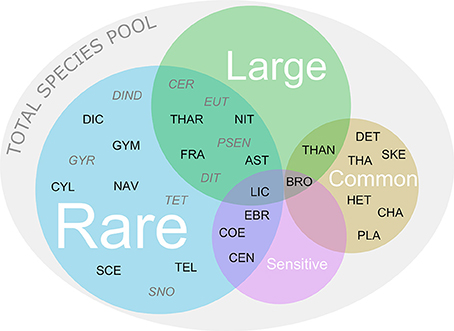
Figure 1. Categorization of common, rare, sensitive, and large species initially present in the total species pool. Combinations of more than one category are displayed as overlapping areas in the Venn diagram. For abbreviations of species names and their initial relative biomass in each treatment see Supplementary Table 2. The black letters show species that were initially present in the control. The gray italic letters show species that were initially not present in the control but found in other treatments.
Because phytoplankton species often belong to more than one of the above defined four categories, overlapping species were placed as shown in Figure 1. Since the sample that we initially analyzed for the control treatment already represented a dilution of the total species pool present in the stock community, it did not contain the full set of phytoplankton species at the onset of the experiment. More precisely, we found single individuals of some species in initial samples of specific treatments but not in the control. We defined these species as rare (Figure 1). Resulting from this, we based the qualitative assessment of the initial loss of target species caused by the treatments on the total species pool of 30 species. In addition, we related the quantitative assessment of how many species were effectively lost in the treatments to the control.
We sampled phytoplankton twice over the course of the experiment: at the onset of the experiment (initial), and after the community had reached stationary phase (bloom peak). To determine when each community had reached the stationary phase, we took daily fluorescence measurements with a fluorometer (Turner Designs 10AU™ Field Fluorometer). We applied a sigmoidal growth model (Equation 1) to confirm the exact developmental stage of the bloom:
where ft is the relative fluorescence after t days, a is the maximum relative fluorescence (carrying capacity), b is the starting relative fluorescence, and μ is the growth rate. The treatments reached their termination point when the growth curve of at least one replicate of that treatment significantly fit the model for three consecutive days. At this time, the other replicates of the treatment had reached stationary phase and we sampled all replicates of the same treatment. We took the last samples 18 days after starting the experiment, corresponding to approximately 9–18 microalgae generations. We preserved the phytoplankton samples in Lugol's iodine solution and stored them in the dark until further processing. To determine phytoplankton cell numbers and biovolume, we counted the samples using an inverted microscope after Utermöhl (1958). For the initial samples (i.e., at the onset of the experiment), we examined a 100 mL sample of each treatment. This corresponded to cell abundances ranging from approximately 200 (D2, SxD2) to over 14,000 (Co, S) cells counted (see Supplementary Table 1). Identifications were made to the species level when possible, otherwise genera were determined. Based on procedures described in Hillebrand et al. (1999), we calculated species-specific cell biovolume by approximating cell shapes to simple geometric bodies. By summing up species specific biovolumes, we calculated the total biovolume of a sample, which is used as a proxy for total biomass hereafter.
To compare phytoplankton communities, we calculated species richness, Pielou's evenness (Pielou, 1966) and Bray-Curtis dissimilarity (Bray and Curtis, 1957; Clarke et al., 2006) using the vegan package in R version 3.2.3 (Oksanen et al., 2017; R Core Team, 2017). The latter two were calculated based on species-specific biomass data. For the bloom peak samples, we computed Bray-Curtis dissimilarity both as average within (B-Cintra) and between (B-Cinter) treatments. For the initial samples, we could only calculate B-Cinter, because we did not have any replication of the inocula. Therefore, the initial samples could only be compared quantitatively. Taking multiple sub-samples at this point would have led to pseudo-replication. To compare treatments at bloom peak, we performed a multi-factorial ANOVA in R 3.2.3 (R Core Team, 2017). We tested the main effects of the categorical factors dilution, filtration and heat stress as well as the interaction of dilution and heat stress on species richness, Pielou's evenness (J'), and within-treatment variation (B-Cintra). Evenness and dissimilarity data were log-transformed to increase normality and account for non-homogenous variance distribution, respectively. We performed post-hoc tests (Tukey HSD) to specify which treatments significantly differed from one another. Finally, we created multi-dimensional scaling (MDS) plots based on the Bray-Curtis dissimilarity matrix in Primer 6 (Clarke and Gorley, 2006).
All diversity manipulations initially decreased species richness by at least two species compared to the control (Figure 2A). We found the strongest declines in initial richness in the dilution treatment (D1 and D2) and in the strong dilution of stressed treatment (SxD2). Compared to the control, the decreases were six and nine species, respectively (Figure 2A). Both filtration treatment levels, as well as the heat stressed treatment (S), reduced initial richness by two species compared to the control (Figure 2A).
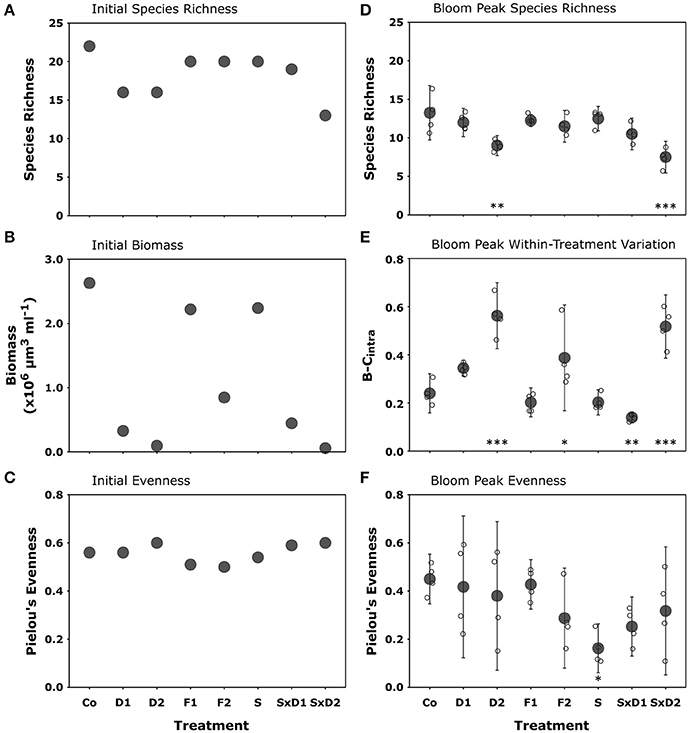
Figure 2. Initial species richness (A), total biomass (shown as biovolume; B), and Pielou's evenness (J'; C); bloom peak species richness (D); within treatment variation (as Bray-Curtis dissimilarity (B-Cintra); E), and Pielou's evenness (J′, F). Filled gray dots represent treatment means (±95% CI), while open dots show the single replicates of the bloom peak samples. Asterisks denote statistically significant differences from the control detected with Tukey HSD tests (*p < 0.05, **p < 0.01, ***p < 0.001).
The total species pool in the initial samples consisted of 30 species, of which 22 were present in the control treatment (Co) (Figures 1, 2A, 3). Generally, the vast majority (i.e., 22) of the species in the total pool was rare, including 12 species that were additionally large and/or sensitive (Figures 1, 3).
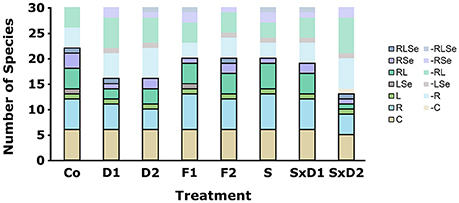
Figure 3. Initial number of species belonging to the different categories. Species were defined as common (C), rare (R), large (L), rare large (RL), rare sensitive (RSe), large sensitive (LSe) or rare large sensitive (RLSe) as seen in Figure 1 and abbreviated as in Table 2. Opaque bars framed by black lines depict the number of species present in each category while transparent bars show categories of species missing from the total species pool of 30 species.
Dilution successfully implemented the loss of rare species. In both levels of the dilution treatment (D1 and D2), 14 species were absent from the total species pool, of which 13 were initially defined as rare (Figure 3). Likewise, in the two levels of the dilution of stressed treatment (SxD1 and SxD2) almost only rare species were absent from the total species pool. That is, in the weak dilution of stressed treatment (SxD1), 11 species were missing from the total species pool, of which 10 were rare. In the strong dilution of stressed treatment (SxD2), 15 of the 17 missing species were rare (Figure 3).
Filtration only partially removed large species. In both levels (F1 and F2), five of the ten species that were missing from the total species pool were large (Figure 3). However, six species that we initially categorized as large species were still found in both levels of the filtration treatment (Figure 3). All of them appeared in low abundances in the fine filtration (F2), but some of them were frequent in the coarse filtration (F1). As a side effect, both filtration treatment levels also removed five small rare species (Figure 3). This is comparable to the absence of rare species in the control treatment and can be attributed to detection limits (i.e., not all species were found in the sub-sample of the initial communities).
Heat stress successfully removed sensitive species. Ten species from the total species pool were missing in the heat stressed treatment (S), of which four were sensitive (Se; Figure 3). Considering the fact that we initially defined five species as sensitive (Figure 1), a high proportion of sensitive species were effectively lost with heat stress. Similarly, in the two levels of the dilution of heat stressed treatment, three out of five sensitive species were missing (Figure 3). All but one of the remaining missing species in the heat stressed treatment (S) were rare (Figure 3).
The treatments differentially affected initial total biomass. Reduction of total biomass in the strong dilutions (D2 and SxD2) was highest (99% compared to the control; Figure 2B). The heat stressed treatment (S) and the coarse filtration (F1) reduced total initial biomass by 15% compared to the control (Figure 2B). Reduction in the fine filtration (F2) and weak dilutions (D1 and SxD1) was intermediate ranging from 68 to 88% (Figure 2B).
Those treatments that substantially reduced the initial total biomass (i.e., F2, D1 SxD1, D2, SxD2; Figure 2B) had the biggest influence on community composition which is reflected in the alignment of the community similarities along the initial biomass dilution gradient (Figure 4A). Whereas, the community composition of the heat stressed treatment (S) and the coarse filtration (F1) remained very close to the control (60% similarity in community structure, Figure 4A), the strong dilutions (D2 and SxD2) were least similar in their community structures to all other treatments (<20% similarity, Figure 4A).
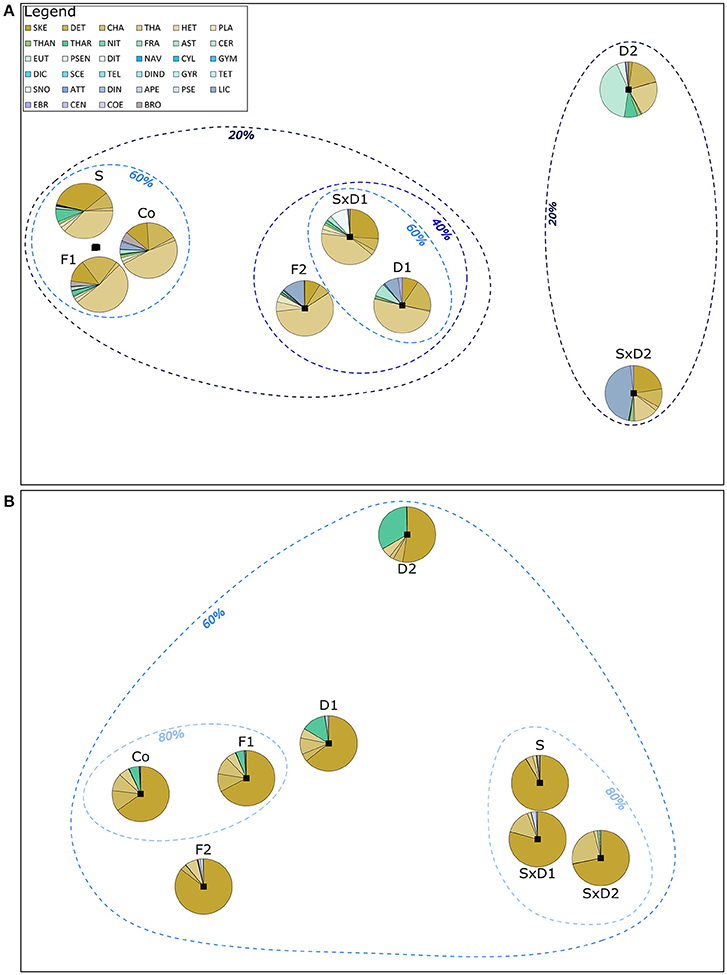
Figure 4. Schematic representation of community similarities between the different treatments. The distances are based on MDS plots that were obtained by calculating a Bray-Curtis dissimilarity matrix (B-Cinter) between the replicates of each treatment. The overlain pie charts show initial (A) and bloom peak (B) species composition in the different treatments. The dashed lines depict percentages of community composition similarities between different treatments. Pie diagrams represent average species composition based on biomass data. In (A), the pie charts for S, F1, and Co correspond to highly similar data points overlapping in between these three pie charts. F1 and Co of the initial samples had a similarity of more than 80%, but this could not be represented graphically. Legend with color-coded species abbreviations is valid for both, a and b. 2D stress for (A,B): 0.01.
Initially, Thalassiosira sp. (THA) was the dominant species in most treatments according to biomass data, followed by Skeletonema costatum (SKE) and Detonula confervaceae (DET). These three species together contributed over 70% to total biomass in nearly all treatments. Only the strongly diluted treatments (D2 and SxD2) were dominated by other species. In the strong dilution (D2), Ceratium fusus (CER) was the dominant species (41% contribution to total biomass) and in the strong dilution of stressed treatment (SxD2), the primarily benthic diatom Licmophora sp. (LIC) was the most dominant species (45% biomass; Figure 4A, Supplementary Table 2). This was caused by the extremely large cell-size of individual CER and LIC in relation to the here concurrently diluted contribution to biomass of smaller-sized THA and DET. Though community compositions largely differed between the treatments, initial Pielou's evenness remained similar in all species loss scenarios (between 0.5 and 0.6; Figure 2C).
Compared to the initial values, species richness, evenness, community composition, and hence similarity between the communities changed in all treatments, including the control. In the control, the average species richness at bloom peak was 13 (Figure 2D), a decrease by nine species compared to experimental onset (Figure 2A). Likewise, evenness at bloom peak decreased by 0.11 in the control compared to the initial value (Figure 2C), resulting in an average value of 0.45 (Figure 2F). Since a decrease in species richness and Pielou's evenness was apparent in all treatments, the control remained the most species rich and evenly distributed treatment at bloom peak (Figures 2D,F).
The strongly diluted treatments (D2 and SxD2), that initially led to the strongest species loss, still showed a significantly lower species richness at bloom peak compared to the control (Figure 2D). In the strong dilution (D2), richness declined by four species and in the combination of heat stress and strong dilution (SxD2) it declined by six species (Figure 2D; Tukey HSD: p = 0.002 and < 0.001, respectively; for ANOVA results see Table 3). The latter effect seemed largely driven by the strong dilution because heat stress alone did not result in a significant species loss at bloom peak compared to the control (Figure 2D; Tukey HSD: p = 0.99; ANOVA results in Table 3). Filtration did not have a lasting significant effect on species richness at bloom peak [Figure 2D, Tukey HSD: p = 0.95 (F1) and p = 0.55 (F2); ANOVA results in Table 3].
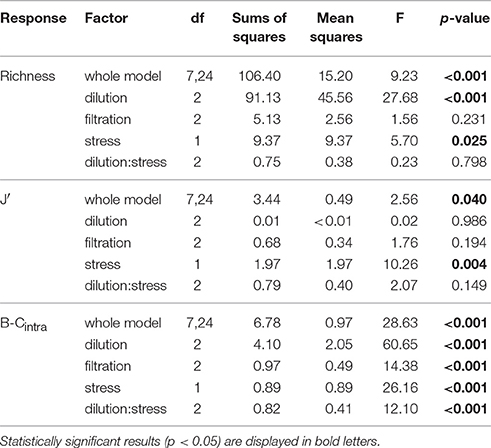
Table 3. ANOVA results showing the effects of the factors dilution, filtration, heat stress and the interaction between dilution and heat stress on species richness, Pielou's Evenness (J'), and within-treatment variation (B-Cintra) at bloom peak.
At bloom peak, the treatments were more equal in their species composition compared to the initial samples. Whereas, similarity of the community structure of some treatments were initially <20% (Figure 4A), similarity at bloom peak was more than 60% between all treatments (Figure 4B). This was mainly caused by the dominance of SKE that contributed at least 52% to total biomass in all treatments at bloom peak (Figure 4B, Supplementary Table 3).
Generally, community composition of the treatments at bloom peak was no longer mainly influenced by the dilution gradient; instead the level of heat stress had the most pronounced effect on community composition and similarity between treatments (Figure 4B). This effect was driven by even stronger dominance (90%) of SKE in the heat stressed treatment compared to the control (65%), and by the strong joined dominance of SKE and CHA in the dilution of stressed communities (Figure 4B, Supplementary Table 3). Even though heat stress did not affect Pielou's evenness initially (Figure 2C), the strong dominance of SKE in the heat stressed community significantly decreased evenness at bloom peak (J' = 0.16) compared to the control (J' = 0.45; Figure 2F; Tukey HSD: p = 0.038; ANOVA results in Table 3). SKE is a species that has been observed to have higher growth rates under warmer conditions and performs best in temperatures between 20 and 24°C (Sanchez et al., 1995). The initial effects of filtration (F1 and F2) and weak dilution (D1) on community composition (Figure 4A) were not mirrored at bloom peak. Thus, community compositions in these treatments were similar to the control (Figure 4B).
As an important side-effect, we observed high within-treatment variation (dissimilarity between replicates of a treatment, B-Cintra) in most dilutions (D1, D2, and SxD2) and in the fine filtration (F2) treatment (Figure 2E). Random effects, such as differing species-specific relative contribution to total biomass, or the absence and presence of certain species in replicates of the same treatment (Supplementary Figure 1), could manifest themselves in the treatments that initially decreased total biomass (Figure 2B). More precisely, the weak dilution (D1) had two pairs of replicates that were alike but differed from the other two replicates (Supplementary Figure 1). The strong dilution (D2) had one replicate that contained a large biomass of Thalassiosira rotula (THAR), contributing 40% to total biomass, while the other three replicates did not contain any THAR at all. In the strong dilution of stressed treatment (SxD2), two replicates had very high proportions (47 and 61%) of Chaetoceros spp. (CHA), while the other two replicates had minimal amounts of CHA (0.8 and 3.2%). In the strong filtration treatment (F2), one replicate differed from the rest in that it contained a larger proportion of THA and DET compared to the other three replicates (Supplementary Figure 1). Consequently, as stated above, B-Cintra clearly coincided with the amount of initially removed biomass in the different treatments. The only exception to this pattern was the weak dilution of stressed treatment (SxD1), in which the replicates were very homogenous at bloom peak (Supplementary Figure 1), resulting in a significantly lower B-Cintra value than in the control (Figure 2E).
Using non-random species loss scenarios for experiments in community ecology is becoming increasingly important, because it allows for a more realistic approach to predict phytoplankton communities' functional reaction to changing environmental conditions. The here tested methods advance the marine sciences in two ways: first, they give the opportunity for more realistic experiments in phytoplankton community ecology and second, they allow a quantification of the hidden treatment effect due to initial variation of phytoplankton density. Certainly, these two factors are linked—in that the dilutive manipulations always alter both species richness and species identities simultaneously.
Essentially, all three treatments (dilution, heat stress, and filtration) reduced richness of the targeted species groups. That is, dilution effectively removed rare (decrease by 93% compared to the total species pool) and heat stress sensitive species (decrease by 80% compared to the total species pool). Filtration removed some of the large species, but the success rate was only 50% removal compared to the total species pool.
Successful decrease of species richness due to dilution at the onset of the bloom (Figure 2A) translated into lower species richness at bloom peak (Figure 2D), but did not significantly influence Pielou's evenness at bloom peak (Figure 2F). Since rare species are statistically more likely to be excluded from a smaller inoculum, we expected an initial decrease in species richness. Problematic is that even though dilution lead to the effective loss of rare species, it was not possible to control which species were lost in replicates of the same treatment. This lead to a high variability of species present at bloom peak, causing more heterogeneous responses in species composition and evenness between replicates of the same treatment (Figure 2F, Supplementary Figure 1). In experiments studying the effect of species loss on ecosystem processes, the high variability of species causes problems, because the effects observed in these experiments cannot clearly be attributed to the decrease in richness. It could just as likely be an effect of species identity carrying certain functional traits. Furthermore, in many experiments—especially those focusing on species traits—species identity is of great importance. For example, in grazing experiments it is essential to distinguish whether edible or inedible species are lost. In certain climate change studies, it is of great interest if calcifying coccolithophores or silicifying diatoms are lost. In these cases, our methods of non-random species loss should be modified (e.g., by using other stress factors) or might not be suited at all.
To eliminate the problem of not only decreasing species numbers, but also losing random species traits in different replicates of the same treatment, the inoculum size could be adjusted so that starting densities between treatments would be more comparable. In culture experiments with bacteria, this is already practiced (Franklin et al., 2001; Hol et al., 2015). For this, the diluted community is allowed to grow for several days such that an increase in biomass can be achieved before the start of the experiment. However, to the best of our knowledge, this method has not been used for phytoplankton and therefore should be tested experimentally. It has to be confirmed that rare phytoplankton species are actually removed from the culture in the long run and cannot grow back to original numbers if the inoculum is re-grown.
Nevertheless, for experiments that only focus on species richness, dilution is a good method to create non-randomly assembled communities. With dilution, distinct gradients of species richness can be created (Roger et al., 2016; Hammerstein et al., 2017), which is a large improvement over traditional culture experiments with randomly assembled communities. Furthermore, some experimental ecologists have used this side effect of dilution to their advantage. Trommer et al. (2012) for example, aimed at reaching high variation within treatments to increase ecological noise and make the community response broader. In addition to being an experimental manipulation method, the dilution treatment can be useful for other applications, such as long-term phytoplankton evolution experiments. In these experiments, researchers use semi-continuous culturing approaches where each new culture is established as a (diluted) inoculum of the former (Lohbeck et al., 2012; Schlüter et al., 2014). For these types of experiments, the tested levels of dilution allow to estimate the potential loss of genotypes at each step.
In general, dilution can be used as a standard method to lose rare species or genotypes in natural phytoplankton communities, for experiments that only manipulate richness. For experiments with an additional focus on species identities, some adjustments should be made to the dilution method and within-treatment variation should be considered.
Heat stress successfully decreased species richness of sensitive species (Figure 2A). This did not have an immediate effect on community composition (Figure 4A), but was reflected at bloom peak by the extreme dominance of a warm-adapted species (Figure 4B). For this manipulation it is helpful to have a good knowledge of the community present at the onset of the experiment, because that allows for fine-tuning of the heat stress treatment (e.g., setting a specific target temperature or exposing species to a certain temperature for a specific time frame). Other methods to target different types of sensitive species are also feasible. Hammerstein et al. (2017) used a mechanical disturbance by shaking the cultures to create communities with distinct gradients of species richness with the goal to lose sensitive species. Summarizing, heat stress can be one successful method to lose sensitive species in natural phytoplankton communities.
In this study, fine filtration (20 μm) successfully decreased initial richness (Figure 2A), and similarly to the dilution treatment, reduced initial biomass (Figure 2B). The observed effects on within-treatment variability at bloom peak were also comparable to dilution (Figure 2E). This problem can easily be mitigated by adjusting the inoculum volume of the filtration treatment so that it contains comparable phytoplankton densities to the control.
A disadvantage of the filtration method was that it did not completely remove all large species. Many large species are long and thin, which means that individuals could still pass through the sieve if they reach it in the right angle. This can create a bias in size class categorization (Graham and Jones, 2007). Sieving the samples multiple times could minimize this problem. In contrast to this, cells of some species that were not defined as large were filtered out in this treatment. This included genera like Skeletonema, Chaetoceros, and Detonula, which are chain-forming and therefore accumulate to a greater size (Round et al., 1990). The individual cell size, however, can be smaller than the colony size. In this case, it has to be clarified whether an individual cell or the entire colony is categorized in a specific size class. Related to this, the special morphology of some genera, including Chaetoceros, can also lead to a size class bias. Chaetoceros cells themselves may not have an average dimension exceeding 20 μm, but many species of this genus are conspicuous due to long spines protruding from the valves (Round et al., 1990). We also observed this in the present study: the overall largest cell dimension including spines often exceeded 20 μm and therefore fewer cells of this genus were found in the filtration treatment. The morphology and life history of species has to be considered when targeting specific species for removal.
Another challenge to the accuracy of the filtration treatment in our experiment is based on the definition for large species that we employed (i.e., the largest cell dimension exceeds 20 μm). We chose this definition due to the scarcity of species exceeding 100 μm in size. We still found several species initially categorized as large in the coarse filtration treatment (F1), for which we had used the 100 μm sieve (Figure 2). In other studies, the definition of large species might be chosen differently as there may be predominantly species in larger size classes, depending on the sampling location and time of the year.
If all these complications are considered, filtration can be a successful method to test the ecosystem consequences of manipulating the “master trait” cell size in experimental phytoplankton communities.
In general, the tested manipulations of non-random species loss allow to assess the effects of realistic phytoplankton diversity change. These methods can be used to manipulate species composition for a wide variety of biodiversity experiments independent of their scale (i.e., micro- and mesocosm) or location (i.e., outdoor and indoor). However, researchers should take special care to avoid the pitfalls of the dilution and filtration methods, especially when species identities are important for the experimental outcome. All in all, these methods are a valuable improvement for hitherto artificially assembled phytoplankton communities in biodiversity—ecosystem functioning experiments, simply because non-random species loss is more realistic (Gamfeldt et al., 2015).
BM, AL, and SE conceived the study. FE conducted the experiment and analyzed the data. FE, BM, AL, and SE wrote the manuscript. All authors agree on the final version of this manuscript and agree to be accountable for all aspects of this work.
The research was funded by internal grants from the GEOMAR Helmholtz Centre for Ocean Research Kiel.
The authors declare that the research was conducted in the absence of any commercial or financial relationships that could be construed as a potential conflict of interest.
We thank Thomas Hansen and Bente Gardeler for technical assistance and two reviewers for their helpful comments on the manuscript.
The Supplementary Material for this article can be found online at: http://journal.frontiersin.org/article/10.3389/fmars.2017.00317/full#supplementary-material
Acevedo-Trejos, E., Brandt, G., Bruggeman, J., and Merico, A. (2014). Mechanisms shaping size structure and functional diversity of phytoplankton communities in the ocean. Sci. Rep. 5:8918. doi: 10.1038/srep08918
Aksnes, D. L., and Egge, J. K. (1991). A theoretical model for nutrient uptake in phytoplankton. Mar. Ecol. Prog. Ser. 70, 65–72. doi: 10.3354/meps070065
Barnosky, A. D., Matzke, N., Tomiya, S., Wogan, G. O. U., Swartz, B., Quental, T. B., et al. (2011). Has the Earth's sixth mass extinction already arrived? Nature 471, 51–57. doi: 10.1038/nature09678
Bracken, M. E. S., Friberg, S. E., Gonzalez-Dorantes, C. A., and Williams, S. L. (2008). Functional consequences of realistic biodiversity changes in a marine ecosystem. Proc. Natl. Acad. Sci. U.S.A. 105, 924–928. doi: 10.1073/pnas.0704103105
Bracken, M. E. S., and Low, N. H. N. (2012). Realistic losses of rare species disproportionately impact higher trophic levels. Ecol. Lett. 15, 461–467. doi: 10.1111/j.1461-0248.2012.01758.x
Bray, J. R., and Curtis, J. T. (1957). An ordination of the upland forest communities of Southern Wisconsin. Ecol. Monogr. 27, 325–349. doi: 10.2307/1942268
Brock, T. D. (1981). Calculating solar radiation for ecological studies. Ecol. Modell. 14, 1–19. doi: 10.1016/0304-3800(81)90011-9
Cardinale, B. J., Duffy, J. E., Gonzalez, A., Hooper, D. U., Perrings, C., Venail, P., et al. (2012). Biodiversity loss and its impact on humanity. Nature 486, 59–67. doi: 10.1038/nature11148
Clarke, K. R., Somerfield, P. J., and Chapman, M. G. (2006). On resemblance measures for ecological studies, including taxonomic dissimilarities and a zero-adjusted Bray-Curtis coefficient for denuded assemblages. J. Exp. Mar. Biol. Ecol. 330, 55–80. doi: 10.1016/j.jembe.2005.12.017
Daufresne, M., Lengfellner, K., and Sommer, U. (2009). Global warming benefits the small in aquatic ecosystems. Proc. Natl. Acad. Sci. U.S.A. 106, 12788–12793. doi: 10.1073/pnas.0902080106
Davies, K. F., Margules, C. R., and Lawrence, J. F. (2004). A synergistic effect puts rare, specialized species at greater risk of extinction. Ecology 85, 265–271. doi: 10.1890/03-0110
de Meester, L., Vanoverbeke, J., Kilsdonk, L. J., and Urban, M. C. (2016). Evolving perspectives on monopolization and priority effects. Trends Ecol. Evol. 31, 136–146. doi: 10.1016/j.tree.2015.12.009
Eggers, S. L., Eriksson, B. K., and Matthiessen, B. (2012). A heat wave and dispersal cause dominance shift and decrease biomass in experimental metacommunities. Oikos 121, 721–733. doi: 10.1111/j.1600-0706.2011.19714.x
Eggers, S. L., and Matthiessen, B. (2013). Initial dominance in coccolithophore communities affects community structure but does not translate into altered community functioning. Mar. Ecol. Prog. Ser. 473, 67–77. doi: 10.3354/meps10064
Elmqvist, T., Folke, C., Nyström, M., Peterson, G., Bengtsson, J., Walker, B., et al. (2003). Response diversity, ecosystem change, and resilience. Front. Ecol. Environ. 1, 488–494. doi: 10.1890/1540-9295(2003)001[0488:RDECAR]2.0.CO;2
Falkowski, P. G., Barber, R. T., and Smetacek, V. (1998). Biogeochemical controls and feedbacks on ocean primary production. Science 281, 200–206. doi: 10.1126/science.281.5374.200
Field, C. B., Behrenfeld, M. J., Randerson, J. T., and Falkowski, P. (1998). Primary production of the biosphere: integrating terrestrial and oceanic components. Science 281, 237–240. doi: 10.1126/science.281.5374.237
Frankham, R. (2005). Genetics and extinction. Biol. Conserv. 126, 131–140. doi: 10.1016/j.biocon.2005.05.002
Franklin, R. B., Garland, J. L., Bolster, C. H., and Mills, A. L. (2001). Impact of dilution on microbial community structure and functional potential: comparison of numerical simulations and batch culture experiments. Appl. Environ. Microbiol. 67, 702–712. doi: 10.1128/AEM.67.2.702-712.2001
Gamfeldt, L., Lefcheck, J. S., Byrnes, J. E. K., Cardinale, B. J., Duffy, J. E., and Griffin, J. N. (2015). Marine biodiversity and ecosystem functioning: what's known and what's next? Oikos 124, 252–265. doi: 10.1111/oik.01549
Graham, J. L., and Jones, J. R. (2007). Microcystin distribution in physical size class separations of natural plankton communities. Lake Reserv. Manag. 23, 161–168. doi: 10.1080/07438140709353919
Gross, K., and Cardinale, B. J. (2005). The functional consequences of random vs. ordered species extinctions. Ecol. Lett. 8, 409–418. doi: 10.1111/j.1461-0248.2005.00733.x
Hammerstein, S. K., Stockenreiter, M., and Stibor, H. (2017). Directed diversity manipulations within natural phytoplankton communities. Limnol. Oceanogr. Methods 15, 653–662. doi: 10.1002/lom3.10190
Harnik, P. G., Simpson, C., and Payne, J. L. (2012). Long-term differences in extinction risk among the seven forms of rarity. Proc. R. Soc. B 279, 4969–4976. doi: 10.1098/rspb.2012.1902
Hillebrand, H. Dürselen, C.-D., Kirschtel, D., Pollingher, U., and Zohary, T. (1999). Biovolume calculation for pelagic and benthic microalgae. J. Phycol. 424, 403–424. doi: 10.1046/j.1529-8817.1999.3520403.x
Hofmann, M., Worm, B., Rahmstorf, S., and Schellnhuber, H. J. (2011). Declining ocean chlorophyll under unabated anthropogenic CO2 emissions. Environ. Res. Lett. 6:34035. doi: 10.1088/1748-9326/6/3/034035
Hol, W. H. G., Garbeva, P., Hordijk, C. A., Hundscheid, M. P. J., Klein Gunnewiek, P. J. A., van Agtmaal, M., et al. (2015). Non-random species loss in bacterial communities reduces antifungal volatile production. Ecology 96, 2042–2048. doi: 10.1890/14-2359.1
Hooper, D. U., Adair, E. C., Cardinale, B. J., Byrnes, J. E. K., Hungate, B. A., Matulich, K. L., et al. (2012). A global synthesis reveals biodiversity loss as a major driver of ecosystem change. Nature 486, 105–108. doi: 10.1038/nature11118
Hooper, D. U., Chapin, F. S. III., and Ewel, J. J. (2005). Effects of biodiversity on ecosystem functioning: a consensus of current knowledge. Ecol. Monogr. 75, 3–35. doi: 10.1890/04-0922
IPCC (2014). Climate Change 2014. Synthesis Report. Contribution of Working Groups I, II and III to the Fifth Assessment Report of the Intergovernmental Panel on Climate Change. eds R. K. Pachauri and L. A. Meyer (Geneva: IPCC).
Jain, M., Flynn, D. F. B., Prager, C. M., Hart, G. M., Devan, C. M., Ahrestani, F. S., et al. (2014). The importance of rare species: a trait-based assessment of rare species contributions to functional diversity and possible ecosystem function in tall-grass prairies. Ecol. Evol. 4, 104–112. doi: 10.1002/ece3.915
Jousset, A., Bienhold, C., Chatzinotas, A., Gallien, L., Gobet, A., Kurm, V., et al. (2017). Where less may be more: how the rare biosphere pulls ecosystems strings. ISME J. 11, 853–862. doi: 10.1038/ismej.2016.174
Lande, R. (1993). Risks of population extinction from demographic and environmental stochasticity and random catastrophes. Am. Nat. 142, 911–927. doi: 10.1086/285580
Leitão, R. P., Zuanon, J., Villéger, S., Williams, S. E., Baraloto, C., Fortunel, C., et al. (2016). Rare species contribute disproportionately to the functional structure of species assemblages. Proc. R. Soc. B 283:20160084. doi: 10.1098/rspb.2016.0084
Lewandowska, A. M., Boyce, D. G., Hofmann, M., Matthiessen, B., Sommer, U., and Worm, B. (2014). Effects of sea surface warming on marine plankton. Ecol. Lett. 17, 614–623. doi: 10.1111/ele.12265
Lohbeck, K. T., Riebesell, U., and Reusch, T. B. H. (2012). Adaptive evolution of a key phytoplankton species to ocean acidification. Nat. Geosci. 5, 346–351. doi: 10.1038/ngeo1441
Lyons, K. G., Brigham, C. A., Traut, B. H., and Schwartz, M. W. (2005). Rare species and ecosystem functioning. Conserv. Biol. 19, 1019–1024. doi: 10.1111/j.1523-1739.2005.00106.x
Mara-ón, E. (2014). Cell size as a key determinant of phytoplankton metabolism and community structure. Ann. Rev. Mar. Sci. 7, 241–264. doi: 10.1146/annurev-marine-010814-015955
McCauley, D. J., Pinsky, M. L., Palumbi, S. R., Estes, J. A., Joyce, F. H., and Warner, R. R. (2015). Marine defaunation: animal loss in the global ocean. Science 347:1255641. doi: 10.1126/science.1255641
Mensens, C., De Laender, F., Janssen, C. R., Sabbe, K., and De Troch, M. (2015). Stressor-induced biodiversity gradients: revisiting biodiversity-ecosystem functioning relationships. Oikos 124, 677–684. doi: 10.1111/oik.01904
Morán, X. A. G., López-Urrutia, Á., Calvo-Díaz, A., and Li, W. K. W. (2010). Increasing importance of small phytoplankton in a warmer ocean. Glob. Chang. Biol. 16, 1137–1144. doi: 10.1111/j.1365-2486.2009.01960.x
Mouillot, D., Bellwood, D. R., Baraloto, C., Chave, J., Galzin, R., Harmelin-Vivien, M., et al. (2013). Rare species support vulnerable functions in high-diversity ecosystems. PLoS Biol. 11:e1001569. doi: 10.1371/journal.pbio.1001569
Norberg, J., Swaney, D. P., Dushoff, J., Lin, J., Casagrandi, R., and Levin, S. A. (2001). Phenotypic diversity and ecosystem functioning in changing environments: a theoretical framework. Proc. Natl. Acad. Sci. U.S.A. 98, 11376–11381. doi: 10.1073/pnas.171315998
O'Grady, J. J., Brook, B. W., Reed, D. H., Ballou, J. D., Tonkyn, D. W., and Frankham, R. (2006). Realistic levels of inbreeding depression strongly affect extinction risk in wild populations. Biol. Conserv. 133, 42–51. doi: 10.1016/j.biocon.2006.05.016
Oksanen, J., Blanchet, F. G., Friendly, M., Kindt, R., Legendre, P., McGlinn, D., et al. (2017). Vegan: Community Ecology Package. R package version 2.4-4. Available online at: https://CRAN.R-project.org/package=vegan
Peter, K. H., and Sommer, U. (2012). Phytoplankton cell size: intra- and interspecific effects of warming and grazing. PLoS ONE 7:e49632. doi: 10.1371/journal.pone.0049632
Pielou, E. C. (1966). The measurement of diversity in different types of biological collections. J. Theor. Biol. 13, 131–144. doi: 10.1016/0022-5193(66)90013-0
Rabinowitz, D. (1981). “Seven forms of rarity,” in The Biological Aspects of Rare Plant Conservation, ed H. Synge (Chichester: John Wiley), 205–217.
Radchuk, V., De Laender, F., Van den Brink, P. J., and Grimm, V. (2015). Biodiversity and ecosystem functioning decoupled: invariant ecosystem functioning despite non-random reductions in consumer diversity. Oikos 125, 424–433. doi: 10.1111/oik.02220
Raven, J. A. (1998). The twelfth tansley lecture. small is beautiful: the picophytoplankton. Funct. Ecol. 12, 503–513. doi: 10.1046/j.1365-2435.1998.00233.x
R Core Team (2017). R: A Language and Environment for Statistical Computing. Vienna: R Foundation for Statistical Computing.
Reusch, T. B. H., Ehlers, A., Hämmerli, A., and Worm, B. (2005). Ecosystem recovery after climatic extremes enhanced by genotypic diversity. Proc. Natl. Acad. Sci. U.S.A. 102, 2826–2831. doi: 10.1073/pnas.0500008102
Roger, F., Bertilsson, S., Langenheder, S., Osman, O. A., and Gamfeldt, L. (2016). Effects of multiple dimensions of bacterial diversity on functioning, stability and multifunctionality. Ecology 97, 2716–2728. doi: 10.1002/ecy.1518
Round, F. E., Crawford, R. M., and Mann, D. G. (1990). The Diatoms: Biology and Morphology of the Genera. Cambridge: Cambridge University Press.
Sanchez, S., Martinez, M. E., Molina, E., and de la Casa, J. A. (1995). The influence of temperature on the growth and fatty acid composition of Skeletonema costatum in a batch photobioreactor. J. Chem. Technol. Biotechnol. 62, 148–152. doi: 10.1002/jctb.280620206
Schlüter, L., Lohbeck, K. T., Gutowska, M. A., Groger, J. P., Riebesell, U., and Reusch, T. B. H. (2014). Adaptation of a globally important coccolithophore to ocean warming and acidification. Nat. Clim. Chang. 4, 1024–1030. doi: 10.1038/nclimate2379
Selmants, P. C., Zavaleta, E. S., Pasari, J. R., and Hernandez, D. L. (2012). Realistic plant species losses reduce invasion resistance in a California serpentine grassland. J. Ecol. 100, 723–731. doi: 10.1111/j.1365-2745.2011.01949.x
Selmants, P. C., Zavaleta, E. S., and Wolf, A. A. (2014). Realistic diversity loss and variation in soil depth independently affect community-level plant nitrogen use. Ecology 95, 88–97. doi: 10.1890/13-1192.1
Solan, M., Cardinale, B. J., Downing, A. L. A., Engelhardt, K. M., Ruesink, J. L., and Srivastava, D. S. (2004). Extinction and ecosystem function in the marine benthos. Science 306, 1177–1180. doi: 10.1126/science.1103960
Sommer, U., Aberle, N., Lengfellner, K., and Lewandowska, A. (2012). The baltic sea spring phytoplankton bloom in a changing climate: an experimental approach. Mar. Biol. 159, 2479–2490. doi: 10.1007/s00227-012-1897-6
Sommer, U., and Lewandowska, A. (2011). Climate change and the phytoplankton spring bloom: warming and overwintering zooplankton have similar effects on phytoplankton. Glob. Chang. Biol. 17, 154–162. doi: 10.1111/j.1365-2486.2010.02182.x
Stachowicz, J. J., Best, R. J., Bracken, M. E. S., and Graham, M. H. (2008). Complementarity in marine biodiversity manipulations: reconciling divergent evidence from field and mesocosm experiments. Proc. Natl. Acad. Sci. U.S.A. 105, 18842–18847. doi: 10.1073/pnas.0806425105
Trommer, G., Pondaven, P., Siccha, M., and Stibor, H. (2012). Zooplankton-mediated nutrient limitation patterns in marine phytoplankton: an experimental approach with natural communities. Mar. Ecol. Prog. Ser. 449, 83–94. doi: 10.3354/meps09508
Urban, M. C., and De Meester, L. (2009). Community monopolization: local adaptation enhances priority effects in an evolving metacommunity. Proc. R. Soc. B 276, 4129–4138. doi: 10.1098/rspb.2009.1382
Utermöhl, H. (1958). Zur Vervollkommnung der quantitativen Phytoplankton Methodik. Mitteilungen Int. Vereinigung Theor. Angew. Limnol. 9, 263–272.
Walker, B., Kinzig, A., and Langridge, J. (1999). Attribute diversity, resilience, and ecosystem function: the nature and significance of dominant and minor species. Ecosystems 2, 95–113. doi: 10.1007/s100219900062
Werner, F. J., Graiff, A., and Matthiessen, B. (2016). Temperature effects on seaweed-sustaining top-down control vary with season. Oecologia 180, 889–901. doi: 10.1007/s00442-015-3489-x
Winder, M., and Sommer, U. (2012). Phytoplankton response to a changing climate. Hydrobiologia 698, 5–16. doi: 10.1007/s10750-012-1149-2
Keywords: phytoplankton, non-random species loss, realistic species loss, species loss manipulation, extinction
Citation: Engel FG, Lewandowska AM, Eggers SL and Matthiessen B (2017) Manipulation of Non-random Species Loss in Natural Phytoplankton: Qualitative and Quantitative Evaluation of Different Approaches. Front. Mar. Sci. 4:317. doi: 10.3389/fmars.2017.00317
Received: 20 July 2017; Accepted: 19 September 2017;
Published: 27 September 2017.
Edited by:
Kristian Spilling, Finnish Environment Institute (SYKE), FinlandReviewed by:
Maria Stockenreiter, Fakultät für Biologie, Ludwig-Maximilians-Universität München, GermanyCopyright © 2017 Engel, Lewandowska, Eggers and Matthiessen. This is an open-access article distributed under the terms of the Creative Commons Attribution License (CC BY). The use, distribution or reproduction in other forums is permitted, provided the original author(s) or licensor are credited and that the original publication in this journal is cited, in accordance with accepted academic practice. No use, distribution or reproduction is permitted which does not comply with these terms.
*Correspondence: Friederike G. Engel, ZmVuZ2VsQGdlb21hci5kZQ==
Disclaimer: All claims expressed in this article are solely those of the authors and do not necessarily represent those of their affiliated organizations, or those of the publisher, the editors and the reviewers. Any product that may be evaluated in this article or claim that may be made by its manufacturer is not guaranteed or endorsed by the publisher.
Research integrity at Frontiers
Learn more about the work of our research integrity team to safeguard the quality of each article we publish.