- 1Department of Oceanography and Coastal Sciences, Louisiana State University, Baton Rouge, LA, USA
- 2Korea Polar Research Institute, Incheon, South Korea
The Southern Ocean plays a critical role in the global carbon cycle; dissolved organic matter (DOM), a component in the carbon cycling, can be characterized optically. Sea surface chromophoric dissolved organic matter (CDOM) absorption and fluorescence properties were examined in the New Zealand sector of the Southern Ocean (NZSSO) along a transect encompassing various hydrographic fronts associated with the Antarctic Circumpolar Current (ACC) during summer. Phytoplankton chlorophyll, dissolved organic carbon (DOC) and CDOM absorption were observed to be most elevated off the New Zealand shore and then decreased to low values [chlorophyll: 0.21 ± 0.06 mg m−3; DOC: 54.19 ± 4.02 μM, and CDOM absorption coefficient at 325 nm (ag325): 0.097 ± 0.061 m−1] between the Subtropical (STF) and Antarctic Polar (APF) Fronts. Increases in phytoplankton biomass and DOC concentrations between the fronts were associated with meanders or eddies observed in satellite sea surface salinity and chlorophyll imagery. Overall, CDOM absorption was the dominant contributor to total absorption at 443 nm with implications for ocean color. Beyond the APF in the Antarctic Zone, an elevated chlorophyll band likely associated with upwelled waters transitioned to low chlorophyll in the summer ice edge zone that influenced DOM optical properties. A latitudinal increase in ag325 and corresponding decrease in spectral slope S (μm−1) poleward from the STF could be due to a combination of factors including, decreasing CDOM photooxidation, upwelling of high-CDOM waters or bacterial CDOM production in the Antarctic Zone. Parallel factor analysis (PARAFAC) of fluorescence spectra identified two protein-like (C1 and C2) and two humic-like (C3 and C4) components common in the global ocean. ag325 and the humic-like C4 fluorescent component were positively correlated to chlorophyll, indicating biological control. Surface distribution of the protein-like C1 and C2 and the marine humic-like C3 components showed patterns that appeared to be influenced by both physical and biological processes. This study provides insights into surface CDOM optical properties and its transformation along a complex topographically influenced sector of the Southern Ocean that could be used to trace changes linked to the meridional overturning circulation.
Introduction
The Southern Ocean, comprising a region from the Subtropical Front (STF) to the Antarctic continent connects the three main oceanic basins through the easterly flowing Antarctic Circumpolar Current (ACC) that plays a significant role in the global biogeochemical processes and carbon cycling (Sarmiento and LeQuere, 1996). Driven by the strong westerly winds, the ACC consists of several narrow and persistent fronts that contribute to the ocean overturning circulation and the upwelling of carbon and nutrients to the surface ocean that supports much of the ocean's productivity (Orsi et al., 1995; Belkin and Gordon, 1996; Daly et al., 2001; Budillon and Rintoul, 2003; Marshall and Speer, 2012). While the Southern Ocean is considered a high-nutrient low-chlorophyll (HNLC) region due mainly to iron limitation (Boyd et al., 1999), many productive regions especially during the spring-summer months contribute significantly to the global primary production, carbon cycling, and biogeochemical processes (Arrigo et al., 1998; Daly et al., 2001; Hiscock et al., 2003; Honjo, 2004; McNeil and Tilbrook, 2009). The chromophoric dissolved organic matter (CDOM) is the fraction of the dissolved organic matter (DOM) pool that absorbs light in the UV and visible region of the spectrum. It influences ocean color and light propagation in oceanic waters, and provides useful information on DOM sources and sinks (Blough and Del Vecchio, 2002; Nelson and Siegel, 2002, 2013; Swan et al., 2009).
Photosynthetic plankton in the surface ocean is the main source of oceanic DOM and is principally exported to deeper waters through mixing and downwelling of water parcels (Hansell and Carlson, 2001; Jiao et al., 2010; Hansell, 2013). Components of this DOM pool in the form of humic, fulvic, and amino acids impart characteristic absorption and fluorescence properties that can be used to characterize CDOM composition and the diagenetic state (Mopper and Schultz, 1993; Coble, 1996; Stedmon and Markager, 2005). CDOM can be produced in situ by biological production (authochthonous), primarily through microbial remineralization of organic matter or transported from terrestrial sources (Blough and Del Vecchio, 2002; D'Sa, 2008; D'Sa and DiMarco, 2009; Romera-Castillo et al., 2010). It is removed by photochemical degradation and microbial consumption and is influenced by physical processes such as circulation, upwelling, or mixing (Blough and Del Vecchio, 2002; Nelson et al., 2010). The spectral absorption property of CDOM especially over the narrow 275–295 nm wavelength interval (S or S275−295) has been used to gain insights into source, molecular size and reactivity with elevated slope values linked to photo-oxidative degradation (Helms et al., 2008; D'Sa et al., 2014). While CDOM optical properties have been studied in various oceanic regions (Nelson and Siegel, 2002, 2013; Kitidis et al., 2006; Swan et al., 2009), only limited studies have been reported for the Southern Ocean (Kieber et al., 2009; Ortega-Retuerta et al., 2009; Del Castillo and Miller, 2011; Nelson et al., 2010; Nelson and Gauglitz, 2016).
A subfraction of CDOM that fluoresces when excited with UV light (fluorescent DOM or FDOM) is used in the characterization of CDOM using excitation-emission matrix spectroscopy (EEMs) wherein a three-dimensional fluorescence intensity landscape is obtained across a range of excitation (e.g., 250–450 nm) and emission (e.g., 290–550 nm) wavelengths (Coble, 1996). EEM spectra of different fractions of FDOM such as humic-like and protein-like fluorophores display characteristic signatures in the EEM spectra. For example, humic-like material with greater aromaticity (“A” and “C” type compounds typically of terrestrial origin) generally display broad fluorescence peaks with emission typically at longer wavelengths in comparison to marine humics or “M” type compounds attributed to biological activity. In contrast, protein-like fluorescent material display narrower peaks typically in the UV spectral region with characteristics similar to tryptophan and tyrosine-like amino acids likely derived from marine planktonic organisms or bacterial activity (Coble, 1996; Yamashita and Tanoue, 2003; Stedmon and Markager, 2005). Due to the overlapping contribution of the various fluorophores in the EEMs, statistical approaches such as parallel factor analysis (PARAFAC) are commonly used to decompose CDOM EEMs data into their individual fluorescent components that have provided a more quantitative and qualitative assessment of its composition (Stedmon et al., 2003; Stedmon and Bro, 2008) in various oceanic regions (Murphy et al., 2008; Jorgensen et al., 2011; Catalá et al., 2015, 2016; D'Sa et al., 2016), including the Southern Ocean (Wedborg et al., 2007; Nelson and Gauglitz, 2016).
A characteristic feature of the Southern Ocean is the presence of fronts (STF, SAF, APF, and SACCF) that transition the Southern Ocean from the warm subtropical waters into cold polar waters thus separating zones of uniform water properties in a series of step-like changes in temperature, salinity, and biogeochemical processes (Belkin and Gordon, 1996; Budillon and Rintoul, 2003; Honjo, 2004). In the New Zealand sector of the Southern Ocean (NZSSO), however, the location of these fronts are strongly influenced by prominent topographic features that include the Campbell Plateau, the Pacific Australian Ridge (PAR) and the highly productive Ross Sea to the south (Gordon, 1975). Surface CDOM absorption properties have previously been reported for the NZSSO during early spring (Kieber et al., 2009) while DOM fluorescence at a single wavelength has been reported for a transect on the western Pacific Ocean east of New Zealand (Yamashita et al., 2007). Knowledge on CDOM absorption contribution to the total absorption has been useful in improving satellite estimates of chlorophyll and primary production in the Southern Ocean (Reynolds et al., 2001; Siegel et al., 2002; Lee et al., 2011).
In this study, CDOM absorption and fluorescence properties were examined from surface measurements conducted during a transect of the Korean Research vessel Araon along the ~172°E meridian between New Zealand and Terra Nova Bay (TNB) in the Ross Sea. Additionally, surface absorption budgets were obtained to assess CDOM contribution to the total absorption field while satellite-derived salinity and chlorophyll estimates were used to assess synoptic large-scale features (e.g., meanders and eddies) to aid the interpretation of CDOM optical measurements in the NZSSO.
Methods
Sampling and Study Area
Seawater samples (27) were collected from a flow-through system obtained from a depth of ~2 m as the Korean ice breaker and research vessel Araon transected from Christchurch, NZ to TNB in the western Ross Sea from 30 January to 6 February 2014 (Figure 1). Sub-samples were then filtered through GF/F filters and the filtrate stored in acid cleaned pre-combusted amber bottles with teflon-lined caps at 4°C in a refrigerator for later laboratory processing for CDOM absorption and fluorescence. Filtered GF/F samples were also preserved in a freezer for measurements of chlorophyll concentrations and particulate absorption. Sampling from the flow-through system was however discontinued between 68 and 74°S due to the presence of summer sea-ice. Seawater temperature was measured at the outflow of the flow-through system; however, differences in temperature between the inlet and outlet of the flow-through likely existed and the data has been mainly used to examine broad temperature trends along the transect. The main topographic features such as the Chatham Rise (CR), Campbell Plateau (CP), and the PAR system are shown (Figure 1), along with the locations of fronts such as the Subtropical (STF), Subantarctic (SAF) and its northern (NSAF) and southern (SSAF) branches, Antarctic Polar (APF), and the Southern Antarctic Circumpolar Current (SACCF) Fronts in the NZSSO (Figure 1).
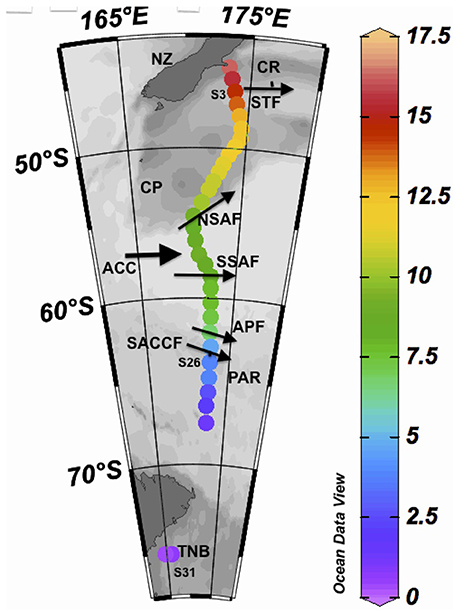
Figure 1. Study site. Sea surface temperature (SST) shown at sampling stations obtained between 30 Jan and 6 Feb, 2014 along a transect between Christchurch, New Zealand (NZ) and Terra Nova Bay (TNB) in the western Ross Sea. Thick arrow indicates the direction of the Antarctic Circumpolar Current (ACC) and the thinner arrows indicate the approximate locations of the Subtropical Front (STF), the Subantarctic Front (SAF) and its northern (NSAF) and southern (SSAF) branches, the Antarctic Polar Front (APF), and the Southern Antarctic Circumpolar Current Front (SACCF). CR and PAR indicate the locations of the Chatham Rise and the Pacific Australian Ridge, respectively. Also shown are the locations of three sampling stations (S3, S26, S31) discussed in the text.
Chlorophyll Concentrations
Seawater samples (500 ml) were filtered through Whatman GF/F filters (25 mm diameter) for the fluorometric determination of chlorophyll (Holm-Hansen et al., 1965) using a Turner Designs Model 10AU fluorometer calibrated with pure chlorophyll a (Sigma Chemical Company).
DOC Measurements
Samples for dissolved organic carbon (DOC) were filtered through pre-rinsed Whatman GF/F filters and stored in acid cleaned, pre-combusted amber bottles with Teflon-lined caps in a freezer. Laboratory measurements of DOC were made on a Shimadzu TOC 5000A (with ASI-5000A autosampler) using a high temperature combustion method to convert carbon compounds to carbon dioxide, including using the Consensus Reference Material (CRM) for QA/QC (Benner and Strom, 1993; Hansell and Carlson, 2001).
CDOM and Particulate Absorption Measurements
Water samples collected from the flow-through system were filtered immediately through pre-rinsed Whatman GF/F filters under low vacuum and stored in acid cleaned, pre-combusted amber bottles at 4°C in the dark before laboratory analysis. After the filtered samples were allowed to reach ambient room temperature, absorbance measurements of CDOM (A(λ)) were obtained on a WPI Ultrapath™ system from 190 to 722 nm on either 0.5 m or 2.0 waveguide cells. To minimize differences in refractive index between sample and reference which cause offsets in absorbance measurements (D'Sa et al., 1999; D'Sa and DiMarco, 2009), a reference salt solution was prepared using granular NaCl (Mallinckrodt) and Milli-Q water to closely match the seawater samples. Absorbance data were corrected by subtracting the mean value over a 10 nm interval (695–705 nm) of the measured absorbance at 700 nm from each wavelength and the ag(λ) (m−1) was calculated using the equation:
Absorption coefficient at 325 nm (ag325) was used as a quantitative parameter of CDOM. The spectral slopes for the intervals of 275–295 nm (S or S275−295, μm−1) were calculated according to Helms et al. (2008). Due to very low CDOM absorption in the visible, absorption especially at 443 nm was below the detection limit of the instrument for some samples.
Particulate absorption measurements were obtained using the quantitative filter technique (QFT) procedure (Mitchell et al., 2003). To measure the particulate absorption, 500 ml of surface seawater samples were filtered onto 25 mm GF/F filters under low vacuum and preserved at −80°F before laboratory analysis. Optical density of particles on the filter paper were measured in the transmission mode on a Perkin-Elmer Lambda 850 with an integrating sphere and also on a fiber-optic based spectrophotometer (Naik and D'Sa, 2012) as it provided better sensitivity in comparison to the Lambda 850. Details on the laboratory analysis of particulate absorption on the two systems have been previously described (Naik and D'Sa, 2012; Naik et al., 2013). As both CDOM and particulate absorption were very low, measurements on both the spectrophotometer and waveguide were sensitive to instrument noise and baseline variability resulting in uncertainties for some samples in the visible band of the spectrum. Thus, due to the very low absorption values, the relative absorption budget is reported only at 443 nm, a commonly used wavelength.
EEMs Measurements and PARAFAC Analysis
Filtered seawater samples used for CDOM absorption measurements were also used to record EEMs using a FluoroMax-4 (Jobin Yvon Horiba) fluorometer by scanning the emission spectra from 290 to 550 nm at 5 nm intervals over excitation wavelengths between 250 and 450 nm at 5 nm increments. The EEMs spectra were obtained after correction of the fluorescence spectra for instrument bias, and the water Raman normalization of the fluorescence intensity (Singh et al., 2010; D'Sa et al., 2014). Due to low absorbance of the samples, there was no requirement for inner filter correction of the fluorescence data. The resulting EEM fluorescence observations were evaluated by PARAFAC analysis using the DOM-Fluor toolbox (Stedmon and Bro, 2008), with the model constrained by non-negativity, and run with three to seven components. Model validation was carried out using split-half analysis, residual analysis and random starts (Stedmon and Bro, 2008; D'Sa et al., 2016).
Satellite Data
MODIS Aqua chlorophyll imagery at 4 km were obtained from NASA Ocean Color Giovanni website (giovanni.gsfc.nasa.gov). Due to extensive cloud cover over the study area, imagery averaged between 26 Jan and 10 Feb, 2014 were used that included the sampling period (30 Jan–6 Feb, 2014). Sea surface salinity data (7-day average) from the Aquarius microwave instrument onboard the Aquarius/SAC-D satellite was obtained from NASA Jet Propulsion Laboratory corresponding to the sampling period. A comparison study of the 1° gridded Aquarius sea surface salinity with Argo array salinity product showed standard deviation in salinity values ranging between 0.15 and 0.6 for high-latitude oceans (Lee, 2016).
Results
Surface Physical Properties
Sea surface temperature (~2 m depth) measured on board the Araon during its 8-day transect from New Zealand to Terra Nova Bay (TNB) show gradients and a decreasing meridional trend in temperature (Figure 1). Poleward decrease and gradients in sea surface salinity are also observed in the Aquarius satellite salinity imagery (Figure 2A) and at matching station locations extracted from the satellite data (Figure 3). While frontal positions are best identified from hydrographic data across the ACC, in this study we use underway data and satellite imagery combined with historical observations (Budillon and Rintoul, 2003) to infer latitudinal locations of the fronts during the study period (Figure 3).
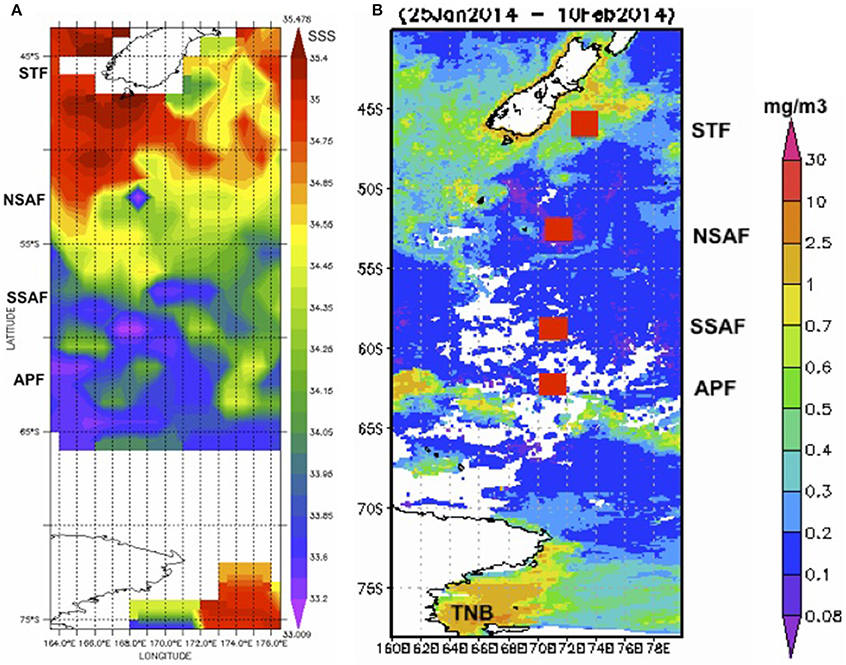
Figure 2. Satellite imagery. (A) Aquarius satellite-derived sea surface salinity for the period 29 Jan–6 Feb, 2014 along the New Zealand sector of the Southern Ocean, and (B) MODIS-derived chlorophyll (25 Jan–10 Feb, 2014) with approximate locations of the Southern Ocean fronts (red squares).
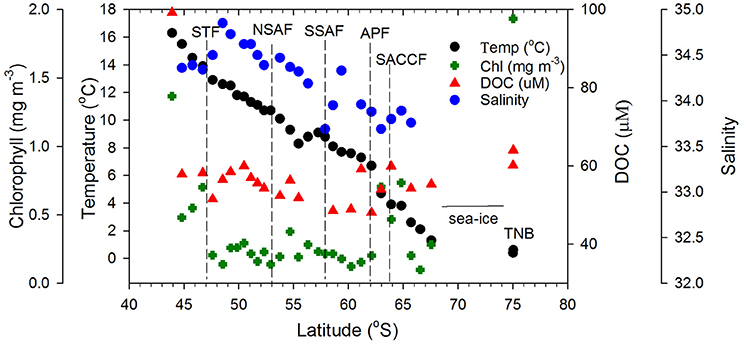
Figure 3. Surface biophysical properties. Sea surface temperature, satellite-derived salinity, chlorophyll, and DOC concentrations along the transect. Dashed vertical lines represent the locations of the Southern Ocean fronts.
The STF, which separates the warmer and saltier subtropical surface water from the cooler and fresher subantarctic surface water, marks the northernmost extent of the ACC and remains close to the coast south and east of NZ and then moves offshore. Large gradients in salinity and temperature observed in the convergence zone (Figures 1, 2) have been associated with considerable eddy activity southeast of NZ (Williams, 2004; Fernandez et al., 2014). South of NZ, the Sub Antarctic Front (SAF), a major front of the ACC system bifurcates into northern (NSAF) and southern (SSAF) branches with the NSAF (~53°S) closely following the steep southeastern flank of the Campbell Plateau (CP) and the SSAF (~58°S) found over the abyssal plain of the south-west Pacific Basin (Budillon and Rintoul, 2003; Fernandez et al., 2014). Large variability in sea surface salinity south of NZ (Figure 2A) indicates eddies and meanders associated with these fronts in the subantarctic zone lying between the STF and SAF (Budillon and Rintoul, 2003). The APF located at ~62°S and generally found between 60.2 and 62.8°S, is characterized by large gradients in temperature and salinity (Figure 3) and delineates the cold Antarctic Surface Water (ASW) to the south (Antarctic Zone) from the warmer subantarctic surface waters to the north. The Antarctic Zone contains the Antarctic divergence (Daly et al., 2001) and the southern boundary of the ACC (SACCF) which in this region follows closely the Pacific-Antarctic Ridge and is located at ~63.8°S (Budillon and Rintoul, 2003). The seasonal ice zone, generally located south of the SACCF, was ice-covered south of 68°S during the transect. In the western Ross Sea, the Terra Nova Bay polynia is an ice-free coastal region with cold ASW (Figures 1, 3; temperature up to +2°C, S < 34.5; Rivaro et al., 2011).
Surface Chlorophyll Distribution
Surface chlorophyll estimates from MODIS reveal elevated concentrations southeast of NZ and Chatham Rise and the STF region (Figure 2B). Along the rest of the transect from STF to APF, chlorophyll values were low with few elevated bands that appear related to eddies and meanders associated with the interaction of the STF and the SAF (Figures 2A,B). An elevated chlorophyll band south of the APF is observed in the Antarctic Zone while high chlorophyll values were observed further south in the TNB region of the western Ross Sea. A similar pattern was observed in surface chlorophyll from field observations along the transect (Figure 3) with low chlorophyll values in the core of the ACC between STF and APF (0.21 ± 0.06 mg m−3) that varied in the range 0.12–0.38 mg m−3, and the more elevated values associated with peaks observed due to meanders and eddies (Figure 2A). Higher chlorophyll values were however observed off NZ shore and STF region (0.66 ± 0.43 mg m−3), the elevated band south of the APF (0.64 ± 0.15 mg m−3), with highest values in TNB (2.42 mg m−3).
Surface Dissolved and Particulate Matter Absorption along the Transect
Surface DOC concentrations were high off the NZ shore (66.71±21.88 μM) and TNB (62.11 μM), with slightly elevated values observed coincident with chlorophyll peaks at 50°S, 55°S, and around the APF. In the ACC core (STF to APF) values ranged between 48.07 and 60.01 μM with a mean of 54.19 ± 4.02 μM. ag325 between the STF and SACCF ranged between 0.024–0.145 m−1 (mean of 0.097 ± 0.061 m−1) and showed an increasing trend poleward (Figure 4). ag325 was however elevated in the NZ shelf waters (0.179 ± 0.110 m−1) and in TNB (0.188 m−1). The spectral slope S values (29.45 ± 3.71 μm−1) generally showed an inverse relationship to ag325 along the transect (Figure 4). S was low closest to the NZ shore (station 1) but increased toward STF and generally decreased poleward into the Antarctic Zone (Figure 4). ag325 was positively correlated with chlorophyll (Figure 5B; r2 = 0.48) but was uncorrelated to DOC concentrations (Figure 5A).
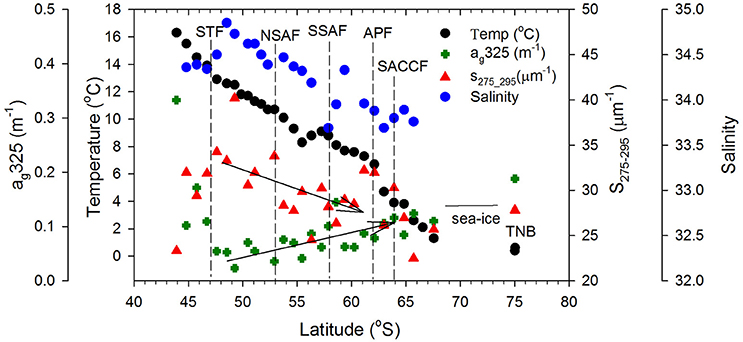
Figure 4. CDOM optical properties. Sea surface temperature, Aquarius satellite-derived salinity, surface CDOM absorption at 325 nm, ag325 (m−1) and spectral slope S275−295 (μm−1) along the ship transect from NZ to TNB. Dashed vertical lines represent the location of the Southern Ocean fronts and the two arrows indicate trends in CDOM absorption and slope between the STF and APF.
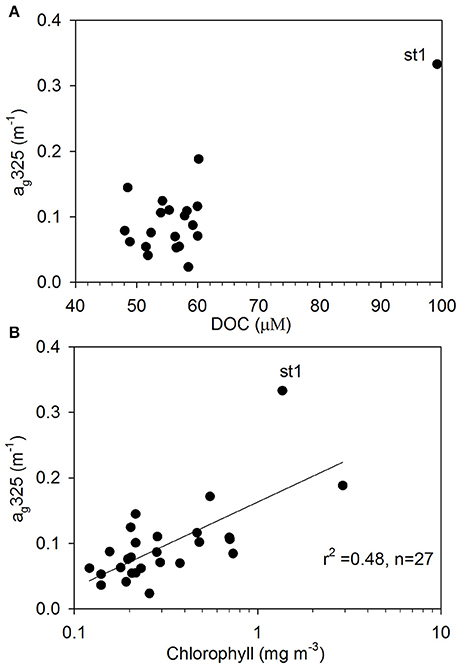
Figure 5. CDOM absorption properties. Relationships between (A) DOC and ag325 (m−1), and (B) chlorophyll and ag325 (m−1) (st1 denotes station 1 closest to the New Zealand shore).
The relative absorption coefficients in the visible (443 nm) of CDOM, particulate matter (phytoplankton aphy and nonalgal anap) varied across the transect (Figure 6) ranging for ag443 from 0.0043 to 0.14 m−1, aphy(443) from 0.0043 to 0.14 m−1, and anap(443) from detection limit to 0.0033 m−1, respectively. Although anap(443) contributed the least to the total absorption (<10%), its relative contribution increased closer to the NZ coast and south of the APF, coinciding with the band of elevated chlorophyll (Figure 6A). Variability in phytoplankton absorption aphy(443) was similar to chlorophyll along the transect with elevated values off the NZ shore and south of APF (Figures 3, 6A). However, its contribution relative to CDOM at 443 nm was variable across the transect being generally greater in regions of high chlorophyll while CDOM dominated at other locations as also indicated by the ternary plot (Figure 6B).
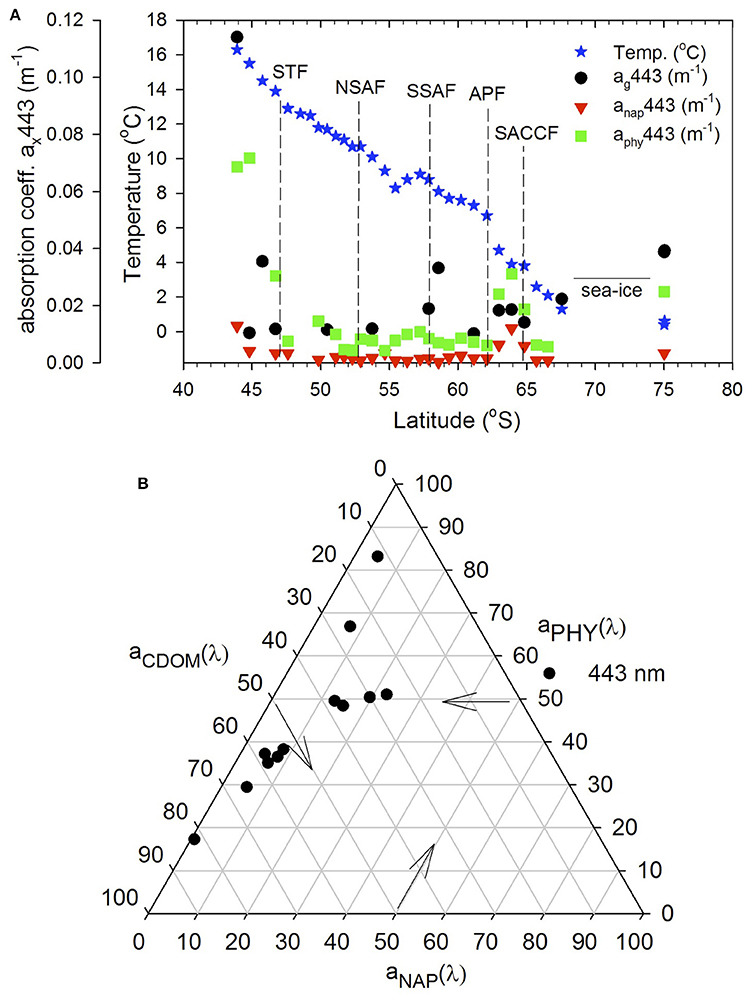
Figure 6. Absorption budgets (ag, aphy, and anap) at 443 nm. (A) Absorption coefficients at 443 nm of CDOM, phytoplankton and nonalgal particles along the transect. (B) ternary plot of absorption coefficient at 443 nm.
Surface FDOM Properties
Typical EEMs spectra obtained from surface samples in the STF, APF, and TNB reveal the presence of prominent peaks in the spectra (Figure 7A). These peaks have traditionally been used to characterize CDOM composition using terminology such as A, C, M, B, and T peaks (Coble, 1996). The presence of the marine humic-like M peak (ex/em, ~300/380–420 nm) is clearly observed, while the fluorescence peaks associated with the protein-like material, namely, the tyrosine-like and tryptophan-like aromatic amino acids (in the UV spectral range) appear combined visually. In contrast, the typical humic-like A and C peaks though not visually observable, were present at low background levels. PARAFAC analysis identified four major fluorescent components in the surface waters between NZ and TNB (Figure 7B; Table 1). The excitation and emission loadings of each of the four components (Figure 7B, bottom right; Table 1) identified components 1 (C1) and C2 with excitation/emission (ex/em) wavelengths of 260/300 nm and 270/330 nm associated with tyrosine- and tryptophan-like material that is microbially produced (Yamashita and Tanoue, 2003; Murphy et al., 2008). Component 3 with ex/em wavelength of 295/400 nm has been previously identified as the marine or “M” humic-like component of microbial origin (Coble, 1996; Yamashita and Tanoue, 2003; Stedmon and Markager, 2005). The broad fluorescence peak of component 4 (C4) with primary (and secondary) ex/em wavelength peaks at <260(360)/460 nm is similar to previously identified terrestrial humic-like A and C like material and generally ubiquitous in the marine environment (Coble, 1996; Murphy et al., 2008, Table 1).
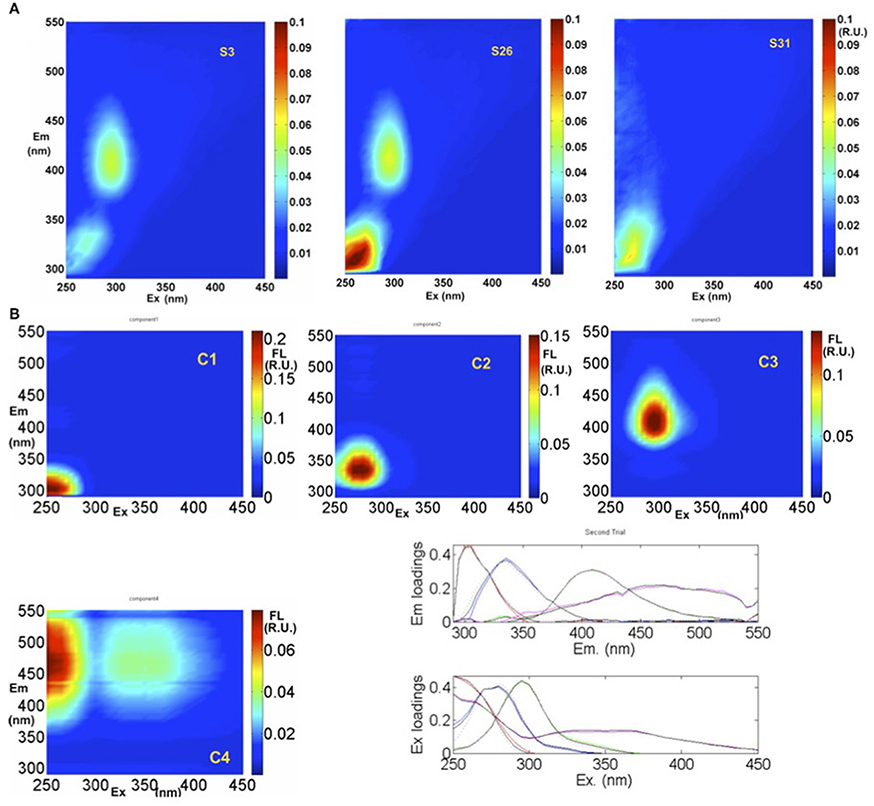
Figure 7. EEMs fluorescence spectra and PARAFAC analysis. (A) Example EEMs at three locations (S3, S26, and S31) along the transect. (B) Spectral properties of four fluorescent components (C1, C2, C3, and C4) identified by PARAFAC in Raman Units (R.U.) of intensity. Excitation and emission loadings derived from the four-component PARAFAC model using split-half validation technique (bottom right). Positions of their maxima are given in Table 1.
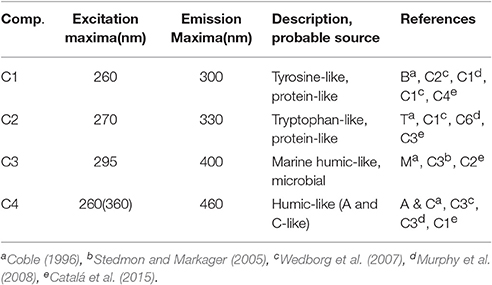
Table 1. Description of the four components identified by PARAFAC analysis of EEMs fluorescence data and their comparisons with previously identified components.
The distribution pattern of the four FDOM components differed along the transect (Figure 8). The humic-like C4 component was elevated off NZ shore and TNB and uniformly low between the STF and APF (Figure 8A) and was positively correlated to chlorophyll (Figure 9A). The C3 marine M-like humic component was found to be elevated off NZ and in regions with elevated phytoplankton chlorophyll (Figure 8A) but showed no clear trends with chlorophyll (not shown). The two protein-like components C1 and C2 were elevated off NZ and TNB, as well as at/near the fronts (Figure 8B), with C1 showing a weak negative correlation to salinity (Figure 9B).
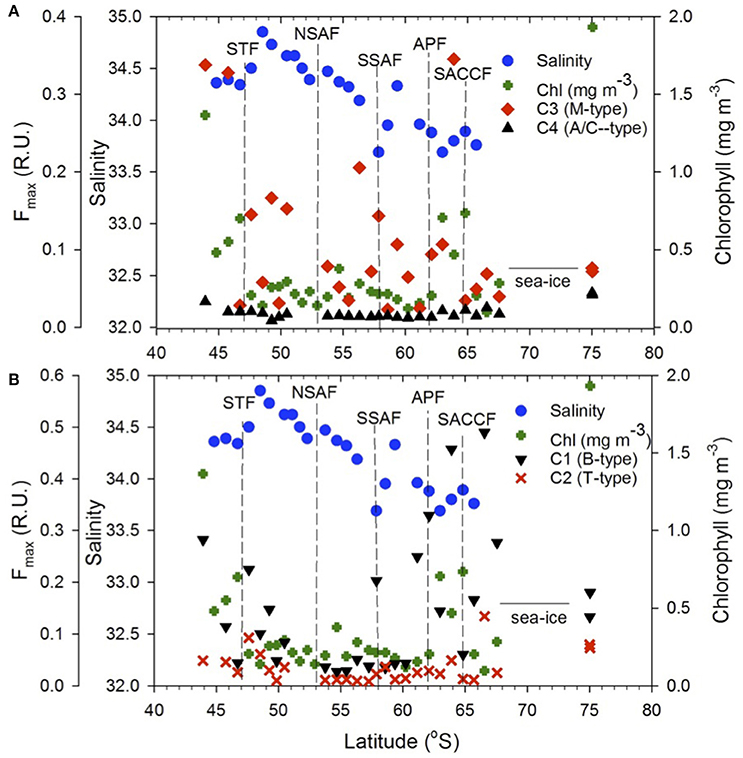
Figure 8. FDOM components. Meridional distribution of the (A) C3 and C4, (B) C1 and C2 FDOM components, sea surface salinity and chlorophyll along the transect. Dashed vertical lines show locations of the Southern Ocean fronts.
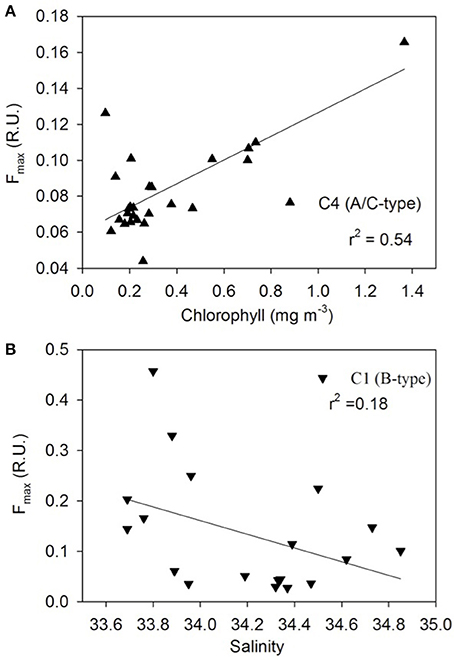
Figure 9. FDOM component properties. Relationships between (A) chlorophyll and humic-like C4, and (B) satellite-derived sea surface salinity and protein-like C1 components.
Discussion
Biophysical Environment
The STF located south and east off NZ forms the boundary between the warmer/salty, nutrient-poor subtropical waters and the colder/fresher, nutrient rich subantarctic waters. Off the NZ shore, the subtropical surface water, generally located 15–40 km offshore, is modified by mixing with freshwater runoff from land and with the subantarctic water further offshore (Sander et al., 2015; Figure 2A). The MODIS imagery (Figure 2B) shows a broad band of elevated chlorophyll in the subtropical frontal region around NZ that are thought to be related to the mixing of warm, macronutrient-poor, relatively micronutrient-rich (especially iron) subtropical water with cold, macronutrient-rich and micronutrient-poor subantarctic water (Orsi et al., 1995; Belkin and Gordon, 1996; Boyd et al., 1999). Similar patterns of chlorophyll distribution were previously described with elevated chlorophyll occurring in the STF to the west and east of NZ throughout the year (Murphy et al., 2001) and along a narrow band c. 43°S on the south side of the Chatham Rise and extending eastwards to the Chatham Islands (Figure 2B). South of New Zealand, the complex marine topography associated with the Macquarie Ridge and the Campbell Plateau strongly influences the circulation pattern with the ACC undergoing intense wave-like migrations and energetic eddies (Gordon, 1975; Bryden and Heath, 1985). Surface expression of such circulation patterns and associated meanders and eddies observed in the satellite sea surface salinity imagery south of New Zealand (Figure 2A) also appear associated with more elevated chlorophyll concentrations observed in the MODIS imagery and field measurements along the transect (~50 and 55°S; Figures 2B, 3). Similar trends were previously observed linking meanders and eddies to the interaction of the two SAF branches and the complex topography (Campanelli et al., 2011). Nonetheless, chlorophyll concentrations were low in the subantarctic waters (0.2–0.3 mg m−3) and comparable to levels reported in other subantarctic regions (Boyd et al., 1999; Han and Takahashi, 2001; Murphy et al., 2001; Hunt and Hosie, 2006). South of the APF, an elevated chlorophyll band (0.64 ± 0.15 mg m−3; Figures 2B, 3) showed similarity to earlier observations that appear persistent in the region (Moore and Abbott, 2000; Campanelli et al., 2011). This significant increase in phytoplankton biomass has been attributed to iron replenishment in the mixed layer of the Antarctic zone by the Upper Circumpolar Deep Water (UCDW; Hiscock et al., 2003) or to the wind-induced increase of the mixed layer depth (Carranza and Gille, 2015). As in previous observations (Daly et al., 2001; Han and Takahashi, 2001), elevated surface chlorophyll were not observed at fronts, but near fronts or in eddies and meanders (Figures 2, 3). Further south in the summer ice edge zone, relatively low chlorophyll values (Figure 3) were similar to values reported in the Australian sector of the Southern Ocean in early austral summer that were attributed to the short time for phytoplankton growth following ice melt or to reduced water column stability due to strong prevailing winds (Han and Takahashi, 2001). In the TNB region of the western Ross Sea, chlorophyll biomass was relatively high (Figures 2, 3) and likely associated with a late summer bloom with values in the range previously reported for surface waters in the area (Rivaro et al., 2011). Overall, surface summer chlorophyll distribution along the NZ transect supported the Southern Ocean as a HNLC region with productive sites linked to meanders and eddies and other local processes.
CDOM Distribution and Absorption Budgets
Surface DOC concentrations in the NZSSO between the STF and SACCF (54.19 ± 4.02 μM) were comparable to those reported in the Australian sector of the Southern Ocean (45–55 μM; Ogawa et al., 1999) and summer surface concentrations in the Ross Sea (55 ± 5μM; Carlson et al., 2000). In comparison to the refractory DOC pool (~42 μM) observed in deeper waters of the Ross Sea, and the Southern Ocean (Ogawa et al., 1999; Carlson et al., 2000), surface DOC in excess of that in deep water is likely associated with a labile or semi-labile fraction of DOM with turnover on varying time scales (hours, days, months to years) that supports heterotrophic microbial production and is potentially important for export (Carlson, 2002; Hansell, 2013).
ag325 was highest in the NZ shore station and decreased to its lowest values near the STF indicating terrestrial influences on CDOM in the northern sector of the transect. Surface patterns and range of ag325 distribution in the ACC were generally consistent with earlier reported values in the Pacific region of the Southern Ocean (Nelson et al., 2010). A general poleward increase in ag325 (0.024–0.145 m−1) and a corresponding decreasing trend in spectral slope S between the STF and APF were likely due to a combination of factors such as (i) decreasing rates of CDOM loss poleward due to solar photodegradation, (ii) upwelling of the CDOM-rich subsurface waters in the Antarctic Zone and its convective transport associated with the wind-driven overturning circulation (Nelson et al., 2010; Marshall and Speer, 2012) or, (iii) to biogeneration of CDOM by bacteria (Ortega-Retuerta et al., 2009). Elevated values of the spectral slope S observed at a meander south of the STF and at fronts (e.g., NSAF, APF, SACCF; Figures 2, 4) suggest that this CDOM optical property could potentially be used to identify such features in the Southern Ocean. CDOM was uncorrelated with DOC (Figure 5A) but positively correlated to chlorophyll (Figure 5B) suggesting strong biological control on CDOM in the surface waters of the study region.
The light absorption properties of CDOM and particulate matter in the visible (e.g., 443 nm) influences the light field and ocean color. ag(443) was similar to those reported in other regions of the Southern Ocean (Clementson et al., 2001; Kieber et al., 2009; Del Castillo and Miller, 2011). aphy(443) and anap(443) between the STF and APF were comparable to those reported in the same latitudinal bands in the Australia sector of the Southern Ocean (Clementson et al., 2001), and other oceanic waters (Bricaud et al., 1998; Naik et al., 2013). anap(443) was generally <10% of the total absorption but its contribution increased in the elevated chlorophyll band south of the APF (Figures 6A,B) likely due to the persistence of this band and the multiple pathways for decay and regeneration of the phytoplankton biomass. Overall, CDOM contribution was greater (50–60%) than phytoplankton absorption (30–40%). However, in the high chlorophyll band south of the APF and in the northern stations off NZ, phytoplankton absorption was dominant. Terrestrial influences off NZ (station 1) and at TNB stations likely contributed to the dominant CDOM contribution (~70 and 80%, respectively; Figure 6B). Thus, while the general surface characteristics of the absorption field within the ACC region appear consistent with other regions of the Southern Ocean, effects of deviations in regions such as off NZ on ocean color should be considered in its interpretation.
FDOM Distribution along the Transect
The four PARAFAC fluorescent components identified in the surface waters of the NZSSO have also been reported in other oceanic regions (Murphy et al., 2008; Jorgensen et al., 2011; D'Sa et al., 2014; Catalá et al., 2015, 2016) including the Southern Ocean (Wedborg et al., 2007; Nelson and Gauglitz, 2016). The relative concentrations and latitudinal distribution patterns of the four components however, appeared to be influenced by physical and biological processes along the NZSSO. A positive correlation of the humic-like C4 component to chlorophyll (Figure 9A) suggests a strong biological control consistent with previous results documented for the global epipelagic ocean (Catalá et al., 2016). A decreasing trend of the C4 component with increasing distance from the NZ shore as well as its high intensity in TNB suggest a strong terrestrial influence on this component in these two regions (Figure 8A). However, in the isolated region of the Antarctic Zone, elevated C4 values (Figure 8A) suggest likely contribution by upwelling associated with the UCDW and is consistent with higher intensity of this humic-like component in deeper waters of the ocean (Catalá et al., 2016; Nelson and Gauglitz, 2016). Furthermore, uniformly elevated C4 intensity in contrast to highly variable chlorophyll distribution in the Antarctic Zone suggests no direct linkage of this component to local productivity. A decreasing trend of C4 to uniformly low background values north of the APF likely due to photobleaching (Catalá et al., 2016) suggests a transformation of this humic-like material in surface waters as it flows equatorward associated with the Southern Ocean's meridional overturning circulation. The transformation of this DOM fluorescent material as the upwelled waters of the UCDW continue equatorward to form the Antarctic Intermediate Water (AAIW) and the Subantarctic Mode Water (SAMW) (Abernathey et al., 2016; Armour et al., 2016) has potential to influence DOM fluorescent composition in the global ocean (Marshall and Speer, 2012). The marine humic-like C3 component in contrast, revealed large variability across the surface waters of the NZSSO. Although a previous study indicated biological control on the distribution of this component in the global epipelagic waters (Catalá et al., 2016), such direct linkage was not observed in this study; rather, trends of elevated C3 in the productive region offshore of NZ and the STF, and the productive band in the Antarctic Zone south of the APF were observed (Figure 8A). This component was, however, low in the highly productive surface waters of the TNB, the summer ice edge region, and between the fronts. This pattern likely suggests elevated production of this fraction associated with microbial activity at more productive sites or at sites such as the STF with predominance of regenerated production (Kopcsynska et al., 2001). In contrast, although the TNB site was highly productive (Figure 3), the short-term cycling of the cold and high saline waters associated with the TNB polynia may not provide the conditions for the microbial production of this fluorescent fraction of CDOM.
The tyrosine- and tryptophan-like components C1 and C2 revealed broadly similar patterns of distribution with C1 having greater intensity and variability across the transect (Figure 8B). Off NZ, C1 showed a steep decline in intensity up to the STF suggesting strong terrestrial influence. It then increased significantly at the STF and thereafter declined toward the APF in concert with decreasing salinity (Figure 8B) suggesting some physical control (Catalá et al., 2016) as indicated by a weak negative relationship to coarse estimates of satellite-derived sea surface salinity (Figure 9B). However, anomalous increase of this component at or near hydrographic fronts (e.g., STF, SSAF, APF ad SACCF) were observed (Figure 8B) and are similar to those reported in the South Africa sector of the Southern Ocean, wherein, pronounced concentrations of the protein-like fluorescent fractions were detected even at great depths (Wedborg et al., 2007), likely indicating linkage to more resistant DOM fractions in the deeper ocean waters (Catalá et al., 2015). Both C1 and C2 showed increases at fronts and low values between the fronts (e.g., NSAF and APF) suggesting some photooxidative loss of these components. Large variability in these two protein-like components in the Antarctic Zone could be due to both physical and biological processes associated with upwelling, elevated phytoplankton biomass and seasonal sea ice effects.
In summary, surface field data combined with satellite (salinity and chlorophyll) and historical hydrographic observations were used to understand the physical regime (specifically, the locations of fronts) and the presence of meanders along the NZSSO, a topographically complex region of the Southern Ocean. CDOM absorption and fluorescence variability along the NZSSO were then examined in relation to frontal positions and biochemical properties (chlorophyll and DOC concentrations) in addition to assessing CDOM absorption contribution to total absorption in the visible band that influences ocean color. In the STF region south of NZ, the interaction of the subtropical and subantarctic waters generally resulted in decreasing levels of chlorophyll and DOC concentrations, and CDOM optical properties that suggested terrestrial influences. However, in the core of the ACC, between the STF and the APF, surface chlorophyll and DOC concentrations and CDOM absorption were low and consistent with other studies. Fluorescence fractions identified using PARAFAC analysis were consistent with those in other oceanic regions, but revealed patterns influenced by fronts and water properties typical of the NZSSO. In the Antarctic Zone, upwelling of CDOM-rich waters likely associated with the Southern Ocean's overturning circulation and its equatorward transport and transformation could contribute to modified CDOM and FDOM properties that could serve as a tracer of changes in biochemistry associated with the overturning circulation.
Author Contributions
ED and HK designed the study and contributed to the manuscript.
Funding
Funding for this work was provided by a Korea Polar Research Institute (KOPRI) grant PE16040 (Satellite remote sensing on west Antarctic ocean research: STAR) and partly supported by PE17120.
Conflict of Interest Statement
The authors declare that the research was conducted in the absence of any commercial or financial relationships that could be construed as a potential conflict of interest.
Acknowledgments
The authors would like to thank the crew of the KOPRI ice-breaker and research vessel Araon and the technicians and students who participated in the Southern Ocean cruise and helped in the laboratory. The authors would like to thank NASA GSFC and JPL for making available the satellite data. The use of the Ocean Data Viewer (http://odv.awi.de) is also gratefully acknowledged. The authors would also like to thank the three reviewers for helpful comments on the manuscript.
References
Abernathey, R. P., Cerovecki, I., Holland, P. R., Newsom, E., Mazloff, M., and Talley, L. D. (2016). Water-mass transformation by sea ice in the upper branch of the Southern Ocean overturning. Nat. Geosci. 9, 596–601. doi: 10.1038/ngeo2749
Armour, K. C., Marsahll, J., Scott, J. R., Donohue, A., and Newsom, E. R. (2016). Southern Ocean warming delayed by circumpolar upwelling and equatorward transport. Nat. Geosci. 9, 549–555. doi: 10.1038/ngeo2731
Arrigo, K., Worthen, D., Schnell, A., and Lizotte, M. P. (1998). Primary production in Southern Ocean waters. J. Geophys. Res. 103, 15587–15600. doi: 10.1029/98jc00930
Belkin, I. M., and Gordon, A. L. (1996). Southern Ocean fronts from Greenwich meridian to Tasmania. J. Geophys. Res. 101, 3675–3696. doi: 10.1029/95JC02750
Benner, R., and Strom, M. (1993). A critical evaluation of the analytical blank associated with DOC measurements by high temperature catalytic oxidation. Mar. Chem. 41, 153–160. doi: 10.1016/0304-4203(93)90113-3
Blough, N. V., and Del Vecchio, R. (2002). “Chromophoric DOM in the coastal environment,” in Biogeochemistry of Marine Dissolved Organic Matter, eds D. A. Hansell and C. A. Carlson (San Diego, CA: Academic Press), 509–546
Boyd, P., LaRoche, J., Gall, M., Frew, R., and McKay, R. M. L. (1999). The role of iron, light and silicate in controlling algal biomass in sub-Antarctic water SE of New Zealand. J. Geophys. Res. 104, 13395–13408. doi: 10.1029/1999JC900009
Bricaud, A., Morel, A., Babin, M., Allali, K., and Claustre, H. (1998). Variations of light absorption by suspended particles with chlorophyll a concentration in oceanic (case 1) waters: analysis and implications for bio-optical models. J. Geophys. Res. 103, 31033–31044. doi: 10.1029/98JC02712
Bryden, H. L., and Heath, R. A. (1985). Energetic eddies at the northen edge of the antarctic circumpolar current in the southwest pacific. Prog. Oceanogr. 14, 65–85. doi: 10.1016/0079-6611(85)90006-0
Budillon, G., and Rintoul, S. R. (2003). Fronts and upper ocean thermal variability south of New Zealand. Antarct. Sci. 15, 141–152. doi: 10.1017/S0954102003001135
Campanelli, A., Massolo, S., Grilli, F., Paschi, E., Rivaro, P., Artegiani, A., et al. (2011). Variability of nutrient and thermal structure in surface waters between New Zealand and Antarctica, October 2004-January 2005. Polar Res. 30:7064. doi: 10.3402/polar.v30i0.7064
Carlson, C. A. (2002). “Production and removal processes,” in Biogeochemistry of Marine Dissolved Organic Matter, eds D. A. Hansell and C. A. Carlson (San Diego, CA: Academic Press), 91–151.
Carlson, C. A., Hansell, D. A., Peltzer, E. T., and Smith, W. O. Jr. (2000). Stocks and dynamics of dissolved and particulate organic matter in the southern Ross Sea, Antarctica. Deep Sea Res. II 47, 3201–3225. doi: 10.1016/S0967-0645(00)00065-5
Carranza, M. M., and Gille, S. T. (2015). Southern Ocean wind-driven entrainment enhances satellite chlorophyll-a through the summer. J. Geophys. Res. 120, 304–323. doi: 10.1002/2014jc010203
Catalá, T. S., Reche I., Fuentes-Lema A., Romera-Castillo C., Nieto-Cid M., Ortega-Retuerta E., et al. (2015). Turnover time of fluorescent dissolved organic matter in the dark global ocean. Nat. Commun. 6:5986. doi: 10.1038/ncomms6986
Catalá, T. S., Alvarez-Salgado, X. A., Otero, J., Iuculano, F., Companys, B., Horstkotte, B., et al. (2016). Drivers of fluorescent dissolved organic matter in the global epipelagic ocean. Limnol. Oceanogr. 61, 1101–1119. doi: 10.1002/lno.10281
Clementson, L. A., Parslow, J. S., Turnbull, A. R., McKenzie, D. C., and Rathbone, C. E. (2001). Optical properties of waters in the Australasian sector of the Southern Ocean. J. Geophys. Res. 106, 31611–31625. doi: 10.1029/2000jc000359
Coble, P. G. (1996). Characterization of marine and terrestrial DOM in seawater using excitation-emission matrix spectroscopy, Mar. Chem. 51, 325–346. doi: 10.1016/0304-4203(95)00062-3
Daly, K. L., Smith, W. O. Jr., Johnson, G. C., DiTullio, G. R., Jones, D. R., Mordy, C. W., et al. (2001). Hydrography, nutrients, and carbon pools in the Pacific sector of the Southern Ocean: implications for carbon flux. J. Geophys. Res. 106, 7107–7124. doi: 10.1029/1999JC000090
Del Castillo, C. E., and Miller, R. L. (2011). Horizontal and vertical distributions of colored dissolved organic matter during the Southern Ocean Gas Exchange Experiment. J. Geophys. Res. 116, C00F07. doi: 10.1029/2010JC006781
D'Sa, E. J. (2008). Colored dissolved organic matter in coastal waters influenced by the Atchafalaya River, USA: effects of an algal bloom, J. Appl. Remote Sens. 2, 023502. doi: 10.1117/1.2838253
D'Sa, E. J., and DiMarco, S. (2009). Seasonal variability and controls on chromophoric dissolved organic matter in a large river- dominated coastal margin, Limnol. Oceanogr. 54, 2233–2242. doi: 10.4319/lo.2009.54.6.2233
D'Sa, E. J., Goes, J. I., Gomes, H., and Mouw, C. (2014). Absorption and fluorescence properties of chromophoric dissolved organic matter of the eastern Bering Sea in the summer with special reference to the influence of a cold pool. Biogeosciences 11, 3225–3244. doi: 10.5194/bg-11-3225-2014
D'Sa, E. J., Overton, E. B., Lohrenz, S. E., Maiti, K., Turner, R. E., and Freeman, A. (2016). Changing dynamics of dissolved organic matter fluorescence in the northern Gulf of Mexico following the Deepwater Horizon oil spill. Environ. Sci. Technol. 50, 4940–4950. doi: 10.1021/acs.est.5b04924
D'Sa, E. J., Steward, R. G., Vodacek, A., Blough, N. V., and Phinney, D. (1999). Determining optical absorption of colored dissolved organic matter in seawater with a liquid capillary waveguide. Limnol. Oceanogr. 44, 1142–1148.
Fernandez, D., Bowen, M., and Carter, L. (2014). Intensification and variability of the confluence of subtropical and subantarctic boundary currents east of New Zealand. J. Geophys. Res. Oceans 119, 1146–1160. doi: 10.1002/2013JC009153
Han, D.-H., and Takahashi, M. M. (2001). Chlorophyll a biomass of netplankton in surface waters in the Pacific sector of the Southern Ocean in austral summer. J. Oceanogr. 57, 581–592. doi: 10.1023/A:1021207719976
Hansell, D. A. (2013). Recalcitrant dissolved organic carbon fractions. Annu. Rev. Mar. Sci. 5, 421–445. doi: 10.1146/annurev-marine-120710-100757
Hansell, D. A., and Carlson, C. A. (2001). Marine dissolved organic matter and the carbon cycle. Oceanography 14, 41–49. doi: 10.5670/oceanog.2001.05
Helms, J. R., Stubbins, A., Ritchie, J. D., Minor, E. C., Kieber, D. J., and Mopper, K. (2008). Absorption spectral slopes and slope ratios as indicators of molecular weight, source and photobleaching of chromophoric dissolved organic matter. Limnol. Oceanogr. 53, 955–969. doi: 10.4319/lo.2008.53.3.0955
Hiscock, M. R., Marra, J., Smith, W. O. Jr., Goericke, R., Measures, C., Vink, S., et al. (2003). Primary productivity and its regulation in the Pacific sector of the Southern Ocean. Deep Sea Res. II 50, 533–558. doi: 10.1016/S0967-0645(02)00583-0
Holm-Hansen, O., Lorenzen, C. J., Holmes, R. W., and Strickland, J. D. H. (1965). Fluorometric determination of chlorophyll. J. Conseil. Conseil Permanent Int. L'explor. 30, 3–15. doi: 10.1093/icesjms/30.1.3
Honjo, S. (2004). Particle export and the biological pump in the Southern Ocean. Antarctic Sci. 16, 501–516. doi: 10.1017/S0954102004002287
Hunt, B. P. V., and Hosie, G. W. (2006). The seasonal succession of zooplankton in the Southern Ocean south of Australia, part II: the sub-antarctic to polar frontal zones. Deep Sea Res. I 53, 1203–1223. doi: 10.1016/j.dsr.2006.05.002
Jiao, N., Herndl, G. J., Hansell, D. A., Benner, R., Kattner, G., Wilhelm, S. W., et al. (2010). Microbial production of recalcitrant dissolved organic matter: long-term carbon storage in the global ocean. Nature Rev. Microbiol. 8, 593–599. doi: 10.1038/nrmicro2386
Jorgensen, L., Stedmon, C. A., Kragh, T., Markager, S., Middelboe, M., and Sondergaard, M. (2011). Global trends in the fluorescence characteristics and distribution of marine dissolved organic matter. Mar. Chem. 126, 139–148. doi: 10.1016/j.marchem.2011.05.002
Kieber, D. J., Toole, D. A., and Kiene, R. P. (2009). “Chromophoric dissolved organic matter cycling during a Ross Sea Phaeocystis Antarctica bloom,” in Smithsonian at the Poles: Contributions to International Polar Year Science, eds I. Krupnik, M. A. Lang, and S. E. Miller (Washington, DC: Smithsonian Institution Scholarly Press), 309–318.
Kitidis, V., Stubbins, A. P., Uher, G., Goddard, U., Robert, C., Law, C. S., and Woodward, E. M. S. (2006). Variability of chromophoric organic matter in surface waters of the Atlantic Ocean. Deep Sea Res. II 53, 1666–1684. doi: 10.1016/j.dsr2.2006.05.009
Kopcsynska, E. E., Dehairs, F., Elskens, M., and Wright, S. (2001). Phytoplankton and microzooplankton variability between the Subtropical and Polar Fronts south of Australia: thriving under regenerative and new production in late summer. J. Geophys. Res. 106, 31597–31609. doi: 10.1029/2000JC000278
Lee, T. (2016). Consistency of Aquarius sea surface salinity with Argo products on various spatial and temporal scales. Geophys. Res. Lett. 43, 3857–3864. doi: 10.1002/2016GL068822
Lee, Z., Lance, V. P., Shang, S., Vaillancourt, R., Freeman, S., Lubac, B., et al. (2011). An assessment of optical properties and primary production derived from remote sensing in the Southern Ocean (SO GasEx). J. Geophys. Res. 16, C00F03. doi: 10.1029/2010jc006747
Marshall, J., and Speer, K. (2012). Closure of the meridional overturning circulation through Southern Ocean upwelling. Nat. Geosci. 5, 171–180. doi: 10.1038/ngeo1391
McNeil, B. J., and Tilbrook, B. (2009). A seasonal carbon budget for the sub-Antarctic Ocean, South of Australia. Mar. Chem. 115, 196–2010. doi: 10.1016/j.marchem.2009.08.006
Mitchell, B. G., Kahru, M., Wieland, J., and Stramska, M. (2003). Determination of Spectral Absorption Coefficients of Particles, Dissolved Materials and Phytoplankton for Discrete Water Samples. Ocean Optics Protocols For Satellite Ocean Color Sensor Validation, Revision 4, Vol. 4, Inherent Optical Properties: Instruments, Characterization, Field Measurements and Data Analysis Protocols. Greenbelt, Maryland: NASA Technical Report.
Moore, J. K., and Abbott, M. R. (2000). Phytoplankton chlorophyll distributions and primary production in the Southern Ocean. J. Geophys. Res. 105, 28709–28722. doi: 10.1029/1999JC000043
Mopper, K., and Schultz, C. A. (1993). Fluorescence as a possible tool for studying the nature and water column distribution of DOC components. Mar. Chem. 41, 229–238. doi: 10.1016/0304-4203(93)90124-7
Murphy, K. R., Stedmon, C. A., Waite, T. D., and Ruiz, G. M. (2008). Distinguishing between terrestrial and autochthonous organic matter sources in marine environments using fluorescence spectroscopy. Mar. Chem. 108, 40–58. doi: 10.1016/j.marchem.2007.10.003
Murphy, R. J., Pinkerton, M. H., Richardson, K. M., Bradford-Grieve, J. M., and Boyd, P. W. (2001). Phytoplankton distributions around New Zealand derived from SeaWiFS remotely-sensed ocean colour data. N. Z. J. Mar. Freshw. Res. 35, 343–362. doi: 10.1080/00288330.2001.9517005
Naik, P., and D'Sa, E. J. (2012). Phytoplankton light absorption of cultures and naturalsamples: comparisons using two spectrophotometers. Optics Express 20, 4871–4886. doi: 10.1364/OE.20.004871
Naik, P., D'Sa, E. J., Gomes, H. R., Goes, J. I., and Mouw, C. B. (2013). Light absorption properties of southeastern Bering Sea waters: analysis, parameterization and implications for remote sensing. Rem. Sens. Environm. 134, 120–143. doi: 10.1016/j.rse.2013.03.004
Nelson, N. B., and Gauglitz, J. M. (2016). Optical signatures of dissolved organic matter transformation in the global ocean. Front. Mar. Sci. 2:118. doi: 10.3389/fmars.2015.00118
Nelson, N. B., and Siegel, D. A. (2002). “Chromophoric DOM in the Open Ocean,” in Biogeochemistry of Marine Dissolved Organic Matter, eds D. A. Hansell and C. A. Carlson (San Diego, CA: Academic Press), 547–578.
Nelson, N. B., and Siegel, D. A. (2013). The global distribution and dynamics of chromophoric dissolved organic matter. Annu. Rev. Mar. Sci. 5, 447–476. doi: 10.1146/annurev-marine-120710-100751
Nelson, N. B., Siegel, D. A., Carlson, C. A., and Swan, C. M. (2010). Tracing global biogeochemical cycles and meridional overturning circulation using chromophoric dissolved organic matter. Geophys. Res. Lett. 37, L03610. doi: 10.1029/2009GL042325
Ogawa, H., Fukuda, R., and Koike, I. (1999). Vertical distributions of dissolved organic carbon and nitrogen in the Southern Ocean. Deep-Sea Res. 46, 1809–1826. doi: 10.1016/S0967-0637(99)00027-8
Orsi, A. H., Whitworth, T. III, and Nowlin, W. D. (1995). On the meridional extent and fronts of the Antarctic Circumpolar Current. Deep-Sea Res. 42, 641–673. doi: 10.1016/0967-0637(95)00021-W
Ortega-Retuerta, E., Frazer, T. K., Duarte, C. M., Ruiz-Halpern, S., Tovar-Sanchez, A., Arrieta, J. M., et al. (2009). Biogeneration of chromophoric dissolved organic matter by bacteria and krill in the Southern Ocean. Limnol. Oceanogr. 54, 1941–1950. doi: 10.4319/lo.2009.54.6.1941
Reynolds, R. A., Stramski, D., and Mitchell, B. G. (2001). A chlorophyll-dependent semianalytical reflectance model derived from field measurements of absorption and backscattering within the Southern Ocean. J. Geophys. Res. 106, 7125–7138. doi: 10.1029/1999JC000311
Rivaro, P., Ianni, C., Massolo, S., Abelmoschi, M. L., De Vittor, C., and Frache, R. (2011). Distribution of dissolved labile and particulate iron and copper in Terra Nova Bay polynya (Ross Sea, Antarctica) surface waters in relation to nutrients and phytoplankton growth. Cont. Shelf Res. 31, 879–889. doi: 10.1016/j.csr.2011.02.013
Romera-Castillo, C., Sarmento, H., Alvarez-Salgado, X. A., Gasol, J. M., and Marrase, C. (2010). Production of chromophoric dissolved organic matter by marine phytoplankton. Limnol. Oceanogr. 55, 446–454. doi: 10.4319/lo.2010.55.1.0446
Sander, S. G., Tian, F., Ibisanmi, E. B., Currie, K. I., Hunter, K. A., and Frew, R. D. (2015). Spatial and seasonal variations of iron speciation in surface waters of the Subantarctic front and the Otago Continental Shelf. Mar. Chem. 173, 114–124. doi: 10.1016/j.marchem.2014.09.001
Sarmiento, J. L., and LeQuere, C. (1996). Oceanic carbon dioxide uptake in a model of century-scale global warming. Science 274, 1346–1350. doi: 10.1126/science.274.5291.1346
Siegel, D. A., Maritorena, S., Nelson, N. B., Hansell, D. A., and Lorenzi-Kayser, M. (2002). Global distribution and dynamics of colored dissolved and detrital organic materials. J. Geophys. Res. 107, 3228. doi: 10.1029/2001JC000965
Singh, S., D'Sa, E. J., and Swenson, E. M. (2010). Chromophoric dissolved organic matter (CDOM) variability in Barataria Basin using excitation-emission matrix (EEM) fluorescence and parallel factor analysis (PARAFAC). Sci. Total Environ. 408, 3211–3222. doi: 10.1016/j.scitotenv.2010.03.044
Stedmon, C. A., and Bro, R. (2008). Characterizing dissolved organic matter fluorescence with parallel factor analysis: a tutorial. Limnol. Oceanogr. 6, 572–579. doi: 10.4319/lom.2008.6.572
Stedmon, C. A., and Markager, S. (2005). Tracing the production and degradation of authochthonous fractions of dissolved organic matter using fluorescence analysis. Limnol. Oceanagr. 50, 1415–1426. doi: 10.4319/lo.2005.50.5.1415
Stedmon, C. A., Markager, S., and Bro, R. (2003). Tracing dissolved organic matter in aquatic environments using a new approach to fluorescence spectroscopy. Mar. Chem. 82, 239–254. doi: 10.1016/S0304-4203(03)00072-0
Swan, C. M., Siegel, D. A., Nelson, N. B., Carlson, C. A., and Nsair, E. (2009). Biogeochemical and hydrographic controls on chromophoric dissolved organic matter distribution in the Pacific Ocean. Deep Sea Res. I 56, 2175–2192. doi: 10.1016/j.dsr.2009.09.002
Wedborg, M., Persson, T., and Larsson, T. (2007). On the distribution of UV-blue fluorescent organic matter in the Southern Ocean. Deep-Sea Res. I 54, 1957–1971. doi: 10.1016/j.dsr.2007.07.003
Williams, M. J. M. (2004). Analysis of quasi-synoptic eddy observations in the New Zealand subantarctic. N. Z. J. Mar. Freshwater Res. 38, 183–194. doi: 10.1080/00288330.2004.9517227
Yamashita, Y., and Tanoue, E. (2003). Chemical characterization of protein-like fluorophores in DOM in relation to aromatic amino acids. Mar. Chem. 82, 255–271. doi: 10.1016/S0304-4203(03)00073-2
Keywords: CDOM, DOC, EEMs, PARAFAC, chlorophyll, absorption, Southern Ocean
Citation: D'Sa EJ and Kim H-c (2017) Surface Gradients in Dissolved Organic Matter Absorption and Fluorescence Properties along the New Zealand Sector of the Southern Ocean. Front. Mar. Sci. 4:21. doi: 10.3389/fmars.2017.00021
Received: 07 November 2016; Accepted: 17 January 2017;
Published: 28 February 2017.
Edited by:
Michael Seidel, University of Oldenburg, GermanyReviewed by:
X. Antón Álvarez-Salgado, Spanish National Research Council, SpainIsabel Reche, University of Granada, Spain
Leanne C. Powers, University of Maryland Center for Environmental Science, USA
Copyright © 2017 D'Sa and Kim. This is an open-access article distributed under the terms of the Creative Commons Attribution License (CC BY). The use, distribution or reproduction in other forums is permitted, provided the original author(s) or licensor are credited and that the original publication in this journal is cited, in accordance with accepted academic practice. No use, distribution or reproduction is permitted which does not comply with these terms.
*Correspondence: Eurico J. D'Sa, ZWpkc2FAbHN1LmVkdQ==
 Eurico J. D'Sa
 Hyun-cheol Kim