- 1Department of Environmental Health Sciences, Arnold School of Public Health, University of South Carolina, Columbia, SC, USA
- 2Department of Pathology and Laboratory Medicine, University of British Columbia, Vancouver, BC, Canada
- 3Southern California Coastal Water Research Project, Costa Mesa, CA, USA
- 4NOAA/NOS/NCCOS Center for Coastal Environmental Health and Biomolecular Research, Charleston, SC, USA
- 5Department of Environmental Sciences, University of California Riverside, Riverside, CA, USA
- 6Department of Environmental Sciences, Baylor University, Waco, TX, USA
- 7College of Veterinary Medicine, Center for Environmental and Human Toxicology, University of Florida, Gainesville, FL, USA
Monitoring programs have traditionally monitored legacy contaminants but are shifting focus to Contaminants of Emerging Concern (CECs). CECs present many challenges for monitoring and assessment, because measurement methods don't always exist nor have toxicological studies been fully conducted to place results in proper context. Also some CECs affect metabolic pathways to produce adverse outcomes that are not assessed through traditional toxicological evaluations. Antibiotics are CECs that pose significant environmental risks including development of both toxic effects at high doses and antibiotic resistance at doses well below the Minimum Inhibitory Concentration (MIC) which kill bacteria and have been found in nearly half of all sites monitored in the US. Antimicrobial resistance has generally been attributed to the use of antibiotics in medicine for humans and livestock as well as aquaculture operations. The objective of this study was to assess the extent and magnitude of antibiotics in the environment and estimate their potential hazards in the environment. Antibiotics concentrations were measured in a number of monitoring studies which included Waste Water Treatment Plants (WWTP) effluent, surface waters, sediments, and biota. A number of studies reported levels of Antibiotic Resistant Microbes (ARM) in surface waters and some studies found specific ARM genes (e.g., the blaM−1 gene) in E. coli which may pose additional environmental risk. High levels of this gene were found to survive WWTP disinfection and accumulated in sediment at levels 100–1000 times higher than in the sewerage effluent, posing potential risks for gene transfer to other bacteria.in aquatic and marine ecosystems. Antibiotic risk assessment approaches were developed based on the use of MICs and MIC Ratios [High (Antibiotic Resistant)/Low (Antibiotic Sensitive) MIC] for each antibiotic indicating the range of bacterial adaptability to each antibiotic to help define the No Observable Effect Concentration (NOEC) for each antibiotic which were compared to maximum Measured Exposure Concentrations (MEC) in the environment to predict individual environmental risks. Four antibiotics had high MEC/NOEC and high MIC ratios and were identified as higher risks for concern based upon this approach, but only Triclosan had MEC/NOEC ratios >1 and was recommended for monitoring in future studies.
Introduction
Antimicrobials are pharmaceutical drugs developed to target and combat biological infections, such as those occurring from bacteria, fungi, viruses, and protozoans. Among the antimicrobials, antibiotics are most often defined as any chemotherapeutic agent capable of inhibiting or killing bacteria (bacteriostatic or bactericidal). While compounds with these properties have been used for centuries, it was not until the late 1920s that the first antibiotic was isolated (Van Epps and Dubos, 2006). Since this initial discovery, the use and production of antibiotics has continued to increase yearly. Wise (2002) estimated that between 1 and 2 × 10⁸ kg of antibiotics are consumed annually worldwide. The estimated percentages vary between countries and availability of information for most of the developing countries is scarce. For instance, in the European Union (EU), Switzerland, and the US, the usage is estimated to be 50% for human and 50% for veterinary medicine (Kummerer, 2009). A more recent estimate for the US released by the FDA in 2010, indicates that 1.3 × 10⁷ kg of antibiotics (~60%) are used for agricultural purposes, including aquaculture, while the remaining 40% are used for human clinical use (U.S. Food Drug Administration., 2010). Globally, the annual consumption of antibiotics is estimated in 70 billion standard units for human use (Van Boeckel et al., 2014) and 63,151 ± 1560 tons/year for livestock (Van Boeckel et al., 2015). Within 15 years, both figures are expected to increase by 30 and 67% for human and veterinary purposes, respectively (Gelbrand et al., 2015).
When antibiotics were first introduced, Alexander Fleming, who won a Nobel Prize for the discovery of penicillin, warned in 1945 that misuse of the drug could result in selection for resistant bacteria (Rosenblatt-Farrell, 2009). Within 10 years of the wide-scale introduction of penicillin, antibiotic resistance to this drug was observed. Although antibiotics have transformed the treatment of biological infections and greatly reduced the duration of infections and associated morbidity and mortality, the over-prescription and misuse of these drugs in medicine and agriculture have resulted in an increased rate of development and propagation of resistant microbial populations. This problem is considered so significant that many experts suggest the value of existing antibiotic therapies over the next 100 years is now uncertain (Rosenblatt-Farrell, 2009). Consumption of antibiotics in human medicine rose by nearly 40% overall between 2000 and 2010, but actual global usage patterns are more complex with decreases occurring in some countries and rapid increases in others (O'Neill, 2014). The emerging economic countries of the world plus South Africa accounted for three quarters of this growth, while annual per-person consumption of antibiotics varies by more than a factor of 10 across all middle and high-income countries (Van Boeckel et al., 2014). Furthermore, the European Centre for Disease Control (2013) monitored 15 European countries and found that more than 10% of people in these areas contained Staphylococcus aureus bloodstream infections which were methicillin-resistant (MRSA), with several of these countries demonstrating resistance rates approaching 50%. Currently, mortality rate attributable to antimicrobial resistance represent 700,000 deaths every year (O'Neill, 2014). These figures have been estimated to increase up to 10 million deaths/year by 2050, with antimicrobial resistance becoming “one of” the leading cause of death in the world if greater control measures and policies are not implemented (O'Neill, 2014).
The observed increased rate of antibiotic resistance in bacteria is likely due many complex factors that ultimately drive the development and maintenance of direct and indirect methods of microbial resistance. Chemicals with antimicrobial properties may naturally occur in the environment where they provide selective pressure for maintenance of antimicrobial resistance within certain microbes. This natural intrinsic resistance occurs in some bacteria as a result of the over-expression of genes involved in regulating cellular permeability to hydrophobic compounds, such as macrolide antibiotics (Rosenblatt-Farrell, 2009). In addition, some microbes may temporarily overexpress or suppress a range of genes allowing survival in the presence of naturally occurring chemicals, with expression patterns returning to normal once the exposure threat has passed. As a result, many microbes have “Intrinsic Resistance” to natural chemicals or antibiotics when their normal metabolic or physiological characteristics are changed to render them immune to the mechanism of effect associated with specific types of chemical exposure (Humeniuk et al., 2002).
While antibiotic resistance may occur naturally, the additional input of exogenous chemicals, with antimicrobial properties from anthropogenic sources, may provide increased selective pressure for the generation and propagation of resistant phenotypes within microbial communities (Rosenblatt-Farrell, 2009). Certain microbes may also have “Acquired Resistance” to an antibiotic by taking on new adaptive characteristics either through gene mutation or the transfer of genetic material between bacteria (Rosenblatt-Farrell, 2009). Thus, once exposed to antibiotics, resistant phenotypes may arise through a combination of intrinsic, mutational, or acquired mechanisms. Acquired resistance enables microbes to become more resistant to antibiotics and examples may include changes to the bacterial membrane such as increased activity of multidrug resistance (MDRs) proteins, which prevent antibiotics from entering the cell. Microbes may also use enzymes to break down antibiotics, or they may employ “efflux pumps” to remove the antibiotic entirely or reduce its concentration below effective levels (Rosenblatt-Farrell, 2009).
Thus, resistant phenotypes may arise through random mutational events that result in protein target site modification, changes in cell wall structure, and altered metabolic pathways. One of the greatest contributing factors to increased rates of global antibiotic resistance is the ability of these resistant traits to be rapidly transferred through mobile elements both vertically and horizontally through microbial communities resulting in widespread acquired resistance. Once these resistance traits are generated or acquired, they are capable of being maintained long-term even in the absence of antibiotics through reduced gene expression, storage within integron systems, and non-antibiotic co-selection pressure. Clearly antibiotics and the attending problems of antibiotic resistance in microbes result in this class of chemicals having unique environmental hazards and risks within the different types of Contaminants of Emerging Concern (CECs) currently being assessed.
The objectives of this review were to evaluate the occurrence of antibiotics, as both CECs and antibiotic resistant pathogens within the environment and to evaluate approaches developed to potentially assess and predict antibiotic resistance risks within the environment.
Materials and Methods Employed in this Review
Literature reviews of existing studies measuring the occurrence of antibiotics, antibiotic resistant microbes (ARM) and mechanisms of antibiotic resistance in aquatic environments were conducted. Concentrations of antibiotics measured in surface waters, sediments and biota from peer reviewed published studies and government reports were compiled and summarized, drawing very heavily on two recent reports conducted by the Water Environment Research Foundation for freshwater (Diamond, 2011) and the Southern California Coastal Water Research Project for estuarine, coastal, and marine waters (Anderson et al., 2012) which compiled data on exposure and effects of antibiotics in the environment. Similarly, levels of antibiotic resistance within E. coli and other indicator bacterial species were summarized and reported from selected studies conducted in different coastal locations around the U.S. Both government reports and peer reviewed literature sources used in these assessments (U.S. Food and Drug Administration (FDA), 2015).
To assess the range of resistance potential for each antibiotic, the ratio of the Minimum Inhibitory Concentration (MIC) for naïve (non-resistant) vs. highly resistant bacteria was compared between 10 antibiotics (Ampicillin, Ciprofloxin, Azithromycin, Clarithromycin, Erythromycin, Tetracycline, Sulfathiazole, Suylfamethoxazole, Sulfamethizole, and Trimethoprim) and two antibacterial agents (Triclocarban and Triclosan) found frequently in monitoring studies throughout the U.S (Diamond, 2011; Anderson et al., 2012). Anderson et al. (2012) also assessed the risk posed by antibiotics within the environment, by using the lowest reported MIC for each antibiotic as a No Observable Effects Concentration (NOEC = most sensitive bacteria) which was then compared to the maximum Measured Exposure Concentration (MEC) reported for each antibiotic. The MEC/NOEC ratios were then reported for the 10 antibiotics and two antimicrobial agents assessed. Those which exceeded unity (>1) were considered a significant risk (Anderson et al., 2012). Margins of Safety (1 divided by the MEC/NOEC Ratio for each antibiotic) were also calculated using results from Anderson et al. (2012) to indicate relative differences in safety between different antibiotics. Finally, MIC Ratios [Highest Inhibitory Concentration (e.g., most resistant strain) divided by the Lowest Inhibitory Concentration (e.g., most sensitive strain)] were calculated as suggested by Anderson et al. (2012) to provide an estimate of the relative potential to develop antibiotic resistance.
Statistical analysis included general descriptive statistics (e.g., calculation of mean, range, sample size) for compiled or summarized data. Any rigorous statistical comparisons were derived directly from results cited within each individual article cited. One exception was the tidally adjusted estimated rates of antibiotic resistance in E. coli (e.g., Table 5) made by dividing the reported rate of resistance by a tidal range ratio between locations (e.g., ratio of mean spring tidal range for Charleston, SC in comparison to mean tidal ranges at other locations in Maryland and Florida).
Antibiotic Levels Measured in the Environment
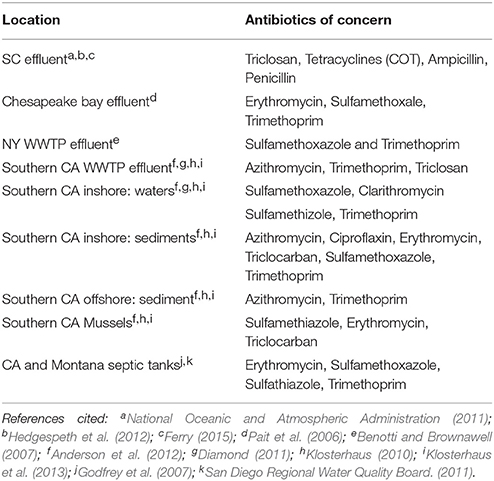
National monitoring programs have identified detectable levels of select antibiotics in 48% of 139 US surface waters tested at maximum concentrations ranging from 0.1 to 10 ug/L [U.S. Geological Survey (USGS), 2002], indicating the widespread use and discharge of these compounds into the environment. Kolpin et al. (2002) as part of this USGS study reported that nation-wide a total of 14 antibiotics (Chlortetracycline, Ciprofloxacin, Erythromycin, Lincomycin, Norfloxacin, Oxytertracycline, Roxithromycin, Sulfamethoxine, Sulfamethazine, Sulfamethizole, Sulfamethoxazole, Tetracycline, Trimethoprim, and Tylosin) were detected by the USGS, with the frequency of detection for individual antibiotics ranging from 0.9 to 27.4% and median concentrations ranging from 0.02 to 0.42 ug/L. The five most frequently detected antibiotics were Tylosin (13.5%), Lincomycin (19.2%), Sulfamethexoazole (19.5%), Erythromycin (21%), and Trimethoprim (27.5%) (Kolpin et al., 2002). Frequently measured antibiotics in other studies of US coastal surface waters include Erythromycin, Trimethoprim and Sulfamethoxazole (Pait et al., 2006; Benotti and Brownawell, 2007). For example, in surface waters of Jamaica Bay in NY, Benotti and Brownawell (2007) found levels of Trimethoprim and Sulfamethoxazole in effluent ranging from 130 to 240 and 70 to 140 ng/L, respectively vs. levels in surface waters ranging from 1 to 42 and 1 to 26 ng/L, respectively (Table 1). In addition, surface water concentrations of both Trimethoprim and Sulfamethoxazole decreased rapidly with increasing salinities and distance downstream from sewerage outfall and also during heavy rainfall, as concentrations of both antibiotics declined significantly due to the increased dilution effects observed with increased surface runoff (Benotti and Brownawell, 2007). Godfrey et al. (2007) and the San Diego Regional Water Quality Board. (2011) similarly reported Erythromycin, Sulfamethoxazole, Sulfamethoxazole and Trimethoprim in septic tank effluent in Montana and California.
In Southern California (Klosterhaus, 2010; Diamond, 2011; Klosterhaus et al., 2013), antibiotics detected in surface waters included Clarithromycin (Mean 5 ng/L; Max 18 ng/L), Erythromycin (Mean 4 ng/L; Max 12 ng/L), Sulfamethizole (Mean 3 ng/L; Max 16 ng/L), and Trimethoprim (Mean 1 ng/L; Max 4 ng/L) (Table 1; Figure 1). In Southern California estuarine sediments, several antibiotics were detected and measured including Ciprofloxacin (Mean 480 ng/g dry weight (dw); Max 600 ng/g dw), Erythromycin (Mean 1 ng/g dw; Max 3 ng/g dw), Sulfamethoxazole (Mean 0.1 ng/g dw; Max 1 ng/g dw), Triclocarban (8 ng/g dw and 33 ng/g dw), and Trimethoprim (Mean 3 ng/g dw; Max 18 ng/g dw). In Southern California Bight and other offshore sediments, antibiotics detected included Azithromycin (Mean 2.95 ng/g dw; Max 19.884 ng/g dw) and Trimethoprim (Mean 0.35 ng/g dw; Max 0.581 ng/g dw). In Southern California wastewater treatment plant (WWTP) offshore outfalls, several antibiotics were detected and measured including Azithromycin (Mean 1.31 ng/g dw; Max 10.72 ng/g dw) and Trimethoprim (Mean 0.30 ng/g dw; Max 0.49 ng/g dw). In Southern California mussels, antibiotics detected and measured included Erythromycin (Mean 0.1 ng/g ww; Max 0.2 ng/g ww), Sulfamethiazole (Mean 0.04 ng/g ww; Max 0.2 ng/g ww), and Triclocarban (0.5 ng/g ww and 2.0 ng/g ww) (Table 1; Figure 1).
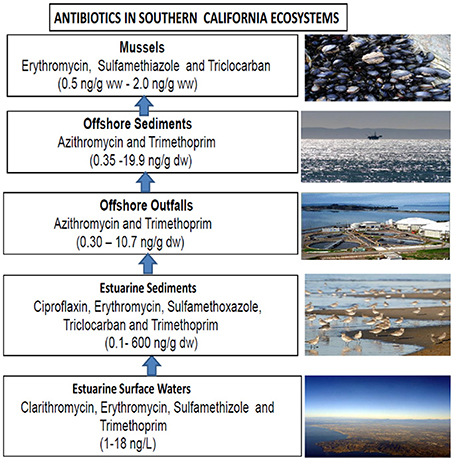
Figure 1. Antibiotic concentrations measured in different environmental compartments of coastal ecosystems of southern California.
Antimicrobial Resistance
The term antimicrobial resistance has been broadly defined as the development of adaptive physiological responses to all pharmaceuticals used to kill or inhibit the growth of pathogenic microorganisms (bacteria, viruses, fungi, and protozoa) and include antibiotics (antibacterials), antifungals, antivirals, and antiparasitics drugs. Antibiotic resistance may involve both physiological/metabolic and genetic, molecular adaptation by microbes in response to antibiotic mode of action and may involve several major adaptive responses (Table 2). These may include changes in the cell wall, metabolism, proteins or nucleic acids (DNA or RNA) and bacterial membrane structure (Romero et al., 2012). Cell wall inhibition is perhaps the most widespread response observed among microbes by which antibiotics (beta-Lactams and Glycopeptides) kill bacteria by damaging or inhibiting the cell wall synthesis (Romero et al., 2012). Other antibiotics may affect microbes by (1) affecting bacterial metabolism, such as trimethoprim and the sulfonamides; (2) by affecting DNA or RNA synthesis, such as quinolones and rifampin; or (3) by affecting protein synthesis, such as chloramphenicol, the tetracyclines, the aminoglycocides, and the macrolide antibiotics.
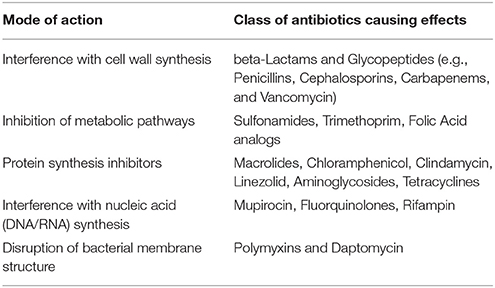
Table 2. Mechanism of action for antibiotics in causing microbial resistance (modified after Romero et al., 2012).
The spread of antimicrobial resistance has generally been attributed in part to: (1) prescriptive drug use by people and animals given therapeutic doses in medical and agricultural practices; (2) environmental release from waste treatment and disposal activities that concentrate animal, medical and human wastes such as WWTPs [Federal Interagency Working Group – Pharmaceuticals in the Environment (FIWG-PIE), 2009], municipal land fields (Wintgens et al., 2003; Barnes et al., 2004; Slack et al., 2005) and confined farm animal practices; and (3) aquaculture practices that use these drugs directly administered to fish and shellfish (primarily in feeds) within aquatic environments [Federal Interagency Working Group – Pharmaceuticals in the Environment (FIWG-PIE), 2009; Uyaguari et al., 2010]. Most antibiotics however are compounds produced by bacteria and fungi in the environment, providing a natural source of selection and maintenance of antibiotic resistant phenotypes even in the most pristine environments (Davies and Davies, 2010). For example, the β-lactamase genes are ancient (Barlow and Hall, 2002), having been found in remote and desolate environments such as Alaska (Allen et al., 2009), which suggests that novel β-lactamases with altered substrate ranges occur throughout the environment (Aminov, 2009; Davies and Davies, 2010). Similarly, antibiotic resistance has also been found in minimally-impacted marine environments, such as National Estuarine Research Reserves such as North Inlet and the ACE Basin in South Carolina (Kelsey et al., 2003a,b; Thompson, 2007; Baker-Austin et al., 2008; Uyaguari et al., 2011).
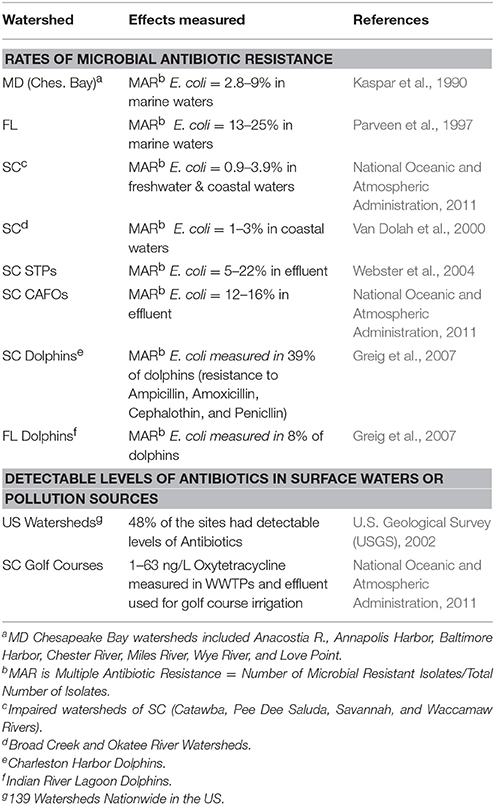
With naturally occurring antibiotic resistance prevalent in the environment along with the widespread occurrence of antibiotics in U.S. surface waters (e.g., 48% of 139 US surface waters) (U.S. Geological Survey (USGS), 2002), it is not surprising to find ARM within the environment. While, Davies and Davies (2010) suggest that antibiotic resistance has increased since the 1960s, Aminov (2009) suggest that it is difficult to explain the role of antibiotics and antibiotic resistance in natural environments from an anthropocentric point of view per se. Several regional studies (Kaspar et al., 1990; Parveen et al., 1997; Van Dolah et al., 2000; Webster et al., 2004; Thompson, 2007; National Oceanic and Atmospheric Administration, 2011) have surveyed WWTPs and confined animal feeding operations (CAFOs), where antibiotics are often discharged into the environment primarily from human use and are frequently used in livestock production, respectively. Results from monitoring of sites throughout mid-Atlantic and southeastern US have found the rate for detection of multiple antibiotic resistance E. coli bacteria ranged from 5 to 22% in WWTPs and from 12 to 16% in farm animal operations (chicken and hog farms) (Tables 3, 4). The number of antibiotics to which multiple antibiotic resistance was observed ranged from 1 to 8 antibiotics, averaging 4.6 antibiotics/WWTP [Webster et al., 2004; Thompson, 2007; National Oceanic and Atmospheric Administration, 2011]. Figure 2 depicts the mechanism by which antibiotic resistance can occur as antibiotics may kill sensitive bacterial strains/biotypes lowering MICs, leaving more resistant strains to persist which will have much higher MICs.
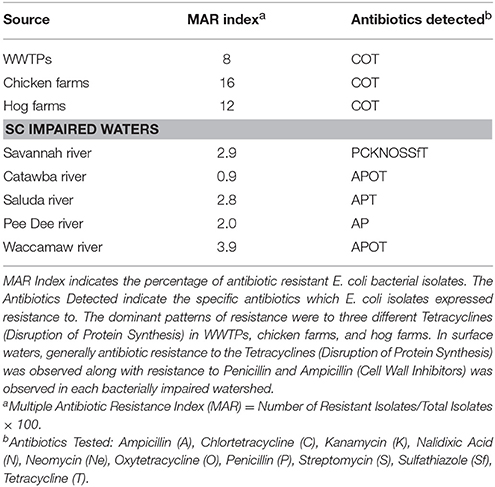
Table 3. Impaired Watershed Study in South Carolina (SC) (National Oceanic and Atmospheric Administration, 2011).
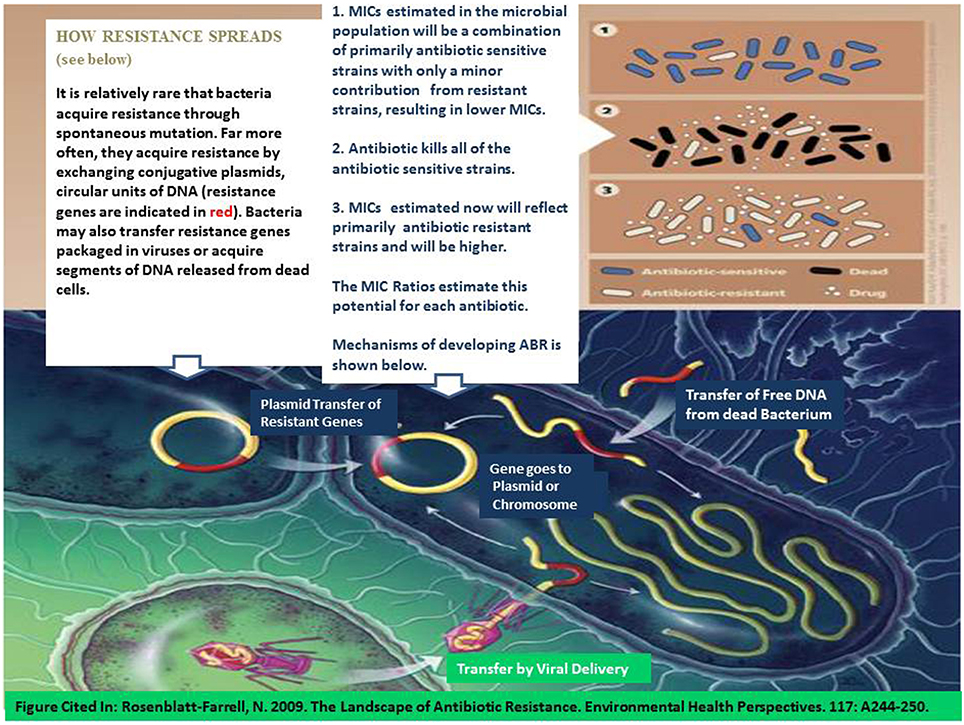
Figure 2. Mechanisms for development of antibiotic resistance (modified after Rosenblatt-Farrell, 2009). The landscape of antibiotic resistance. Environ Health Perspect. 117: A244-A250). Top portion of the figure: (1) Most bacteria are antibiotic sensitive (blue) and not resistant (white). (2) Exposure to an antibiotic at or above the MIC results in mortality (black) in most antibiotic sensitive bacteria. (3) This leaves behind more antibiotic resistant bacteria which will have a higher MIC as a result. Mechanisms for acquiring ABR are depicted in the bottom part of the figure.
Once developed, the maintenance and spread of antibiotic resistant phenotypes becomes a secondary issue within the environment, including aquatic environments [Federal Interagency Working Group – Pharmaceuticals in the Environment (FIWG-PIE), 2009; Uyaguari, 2011; Uyaguari et al., 2011]. Monitoring of marine surface waters in various regions of the U.S. has indicated rates of antibiotic resistance vary based upon tidal range, which may dilute the microbial source, and land use activity (urban vs. rural), with urban areas generally having 2–3 times higher levels of antibiotic resistance observed than rural areas (Table 5). Levels of antibiotic resistant E. coli bacteria ranged from 13 to 25% in FL (microtidal – < 1 m), 2.6–9% (mesotidal – >1 – < 2 m) in MD and from 1 to 3% in SC (mesotidal – >2 – < 3 m) coastal waters. When adjusted for tidal range differences, the rates of antibiotic resistance were quite similar (Table 5) in both urban and rural areas underscoring the importance of dilution in affecting the magnitude of antibiotic resistance detected. Environmental realistic exposures from these sources generally result in pharmaceutical exposure concentrations that are much lower than therapeutic doses; however, uncertainty exists about the potential for biologically meaningful human and ecological effects from chronic exposures to low concentrations and mixtures of these compounds, especially in the environment and in subpopulations of humans and wildlife that might be particularly sensitive (Pomati et al., 2006, 2008).
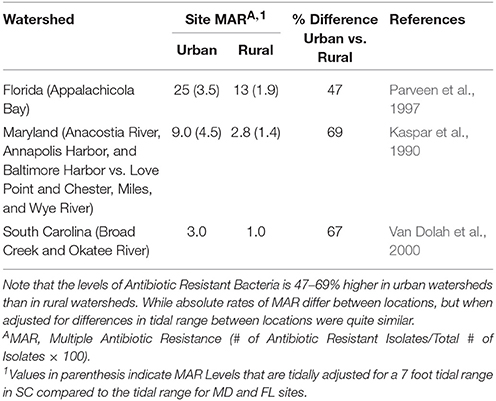
Table 5. Comparison of antibiotic resistance in E. coli bacteria at different coastal geographical locations in Maryland, South Carolina, and Florida.
Antibiotic Resistance Genes
Bacteria can become resistant to antibiotics through a series of mechanisms [e.g., permeability changes in cell wall or efflux of antimicrobials from the bacterial cell (Van Hoek et al., 2011)]. This resistance is initially gained through evolutionary mechanisms wherein exposures to either natural or anthropogenic sources of antibiotics (or other co-selective factors) activate a bacterial stress response resulting in gene mutations that subsequently undergo positive selection. Thus, while it true that some antibiotics increase the mutation rate and may subsequently increase the chances of getting the right mutation causing antibiotic resistance, antibiotic resistant bacteria with mutant genes do not necessarily require subsequent acquisition of other resistance genes in order to develop resistance. In this context, recent studies have demonstrated that conventional wastewater treatment does not necessarily reduce the number of known antibiotic resistance genes within the overall gene pool (Auerbach et al., 2007; Uyaguari, 2011; Uyaguari et al., 2011). Thus, WWTPs may play a very important role as a reservoir of pre-existing resistance genes, generator of novel bacterial resistance, or vehicles for the adaptation of microbes. Interestingly, the level of antibiotic resistance within the gene pool may be higher in WWTP effluent than in pretreated sewage (Reinthaler et al., 2003; Uyaguari et al., 2011), suggesting that the treatment process could be further effective in selecting for more resistant bacteria.
Uyaguari et al. (2011) used a coupled metagenomic and quantitative PCR approach to discover a novel variant of a gene conferring resistance to ampicillin (blaM−1), and to show that this gene is enriched and temporally maintained throughout a WWTP, suggesting that WWTP processes may provide a long-term selective environment for resistant bacteria (Figure 3). Uyaguari et al. (2011) also observed abundances of the blaM−1 gene within surrounding estuarine sediments at abundances higher than that found in discharged effluent, suggesting sediments may be providing an environmental reservoir for these genes (Figure 4). The WWTP in Charleston, SC examined in this study discharged an average of 136 million L day-1 of treated wastewater, which represents on average approximately 3.9 × 10∧14 gene copies of blaM−1 released daily into the surrounding ecosystem (Uyaguari et al., 2011).
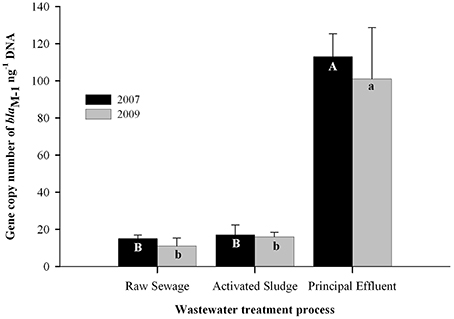
Figure 3. The blaM−1 gene levels in WWTP effluent from SC (modified after Uyaguari et al., 2011, Appl. Environ. Microbiol. 77: 8226–8233). Note the much higher blaM−1 gene levels in the final effluent than in the raw sewerage or sludge, when normalized to DNA. Upper and lower case letters (A,B, a, and b) indicate difference in levels of blaM−1 genes across different WWTP stages of treatment for years 2007 and 2009, respectively.
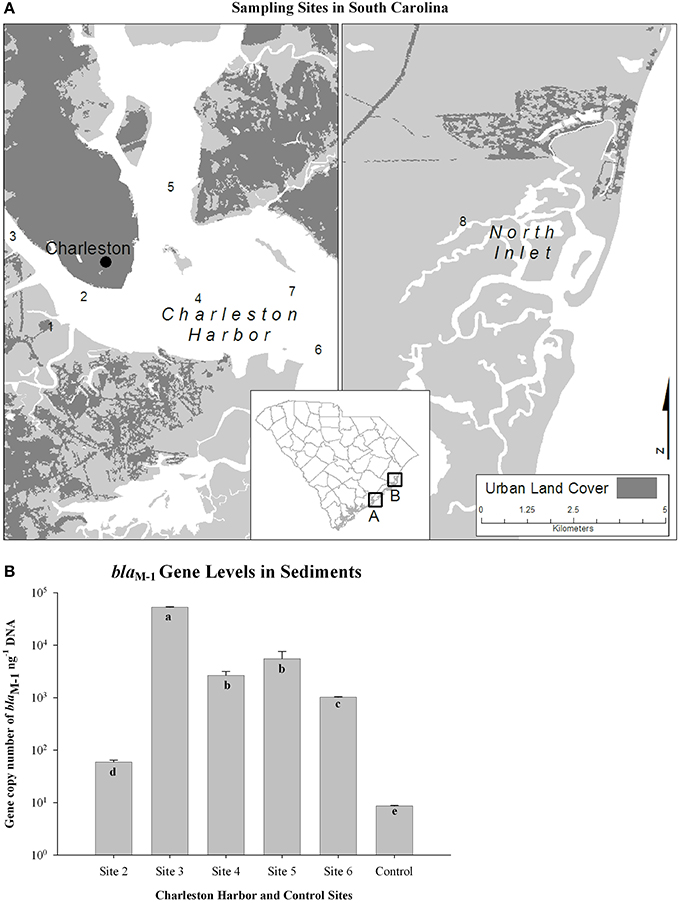
Figure 4. The blaM−1 gene levels in the environment (modified after Uyaguari et al., 2011, Appl. Environ. Microbiol. 77: 8226–8233). (A) Sampling sites in Charleston Harbor and North Inlet, SC. (B) The blaM−1 gene levels measured in sediments at each site. Means with different letters (a–d) indicate statistical significance at the 0.05 level.
Evidence suggesting effluent discharges contain antibiotic resistance conferring genetic material (plasmids, free DNA, integrons, bacterial genomes) has been well documented (Tennstedt et al., 2003; Szczepanowski et al., 2004, 2009; Auerbach et al., 2007; Munir et al., 2011; Uyaguari et al., 2013; Pellegrini et al., 2011). Bacterial acquisition of genes involved in these resistance mechanisms is achieved by a variety of promiscuous gene transfer systems or elements such as bacterial conjugative plasmids, transposons, and integrons (Bennett, 2008; Garriss et al., 2009). These elements allow genes to move vertically and horizontally from one cell to another throughout microbial communities, regardless of the gene donor and may in part explain why antibiotic resistance phenotypes are widely distributed across geographical regions (Bennett, 2008; Zaneveld et al., 2008). For instance, within marine ecosystems, Baker-Austin et al. (2008) isolated 350 V. parahaemolyticus strains from water and sediment at three locations along the Atlantic coast of Georgia and South Carolina and found that 99% were antibiotic resistant, with 24% of the isolates demonstrating resistance to 10 or more antibiotics. The average rate of antibiotic resistance was 7.5 antimicrobials per isolate. Since vibrios are marine bacteria, the development of antibiotic resistance within these potential pathogens underscores the importance of antibiotics in the marine environment and the accompanying propagation of resistance genes that may be selected resulting from exposure. Horizontal gene transfer mechanisms may also play a role in the continued loss of antibiotic effectiveness against a range of microbes. For example, the antibiotic vancomycin was the first choice to treat Gram-positive bacterial infections, but use has declined due to acquired resistance first observed in enterococci and later documented in the U.S. as a completely resistant strain in S. aureus (MIC > 16 μg/mL) (Ala'Aldeen and Hiramatsu, 2004). Among the different elements of antibiotic resistance transfer, integrons are considered one of the main agents of bacterial evolution involved in overall bacterial adaptation to varying environmental conditions and likely play a role in widespread dissemination of antibiotic resistance genes (Mazel, 2006; Joss et al., 2009; Uyaguari et al., 2013).
Assessing the Risks of Antibiotics
Anderson et al. (2012) assessed the risk of 10 antibiotics and 2 antibacterial agents commonly detected in environmental monitoring studies. For each antibiotic and antibacterial agent, a range of MICs measured in E. coli and other indicator bacteria were determined based upon a review of peer reviewed scientific literature. The Lowest Concentration Causing Resistance (LCCR) for reported MICs was determined for each antibiotic and antibacterial agent and was used as a LOEC for risk assessment. The NOEC was a concentration < LOEC. Risk of effects for ABR was determined by comparing the MEC and NOEC ratio for each antibiotic and antibacterial agent. When the MEC/NOEC >1 excess risks were predicted. Also, the ratio between the highest and lowest MICs was also used as a metric predicting the vigor (potency) of antibiotic resistance for each antibiotic and antibacterial agent and was also considered in addition to MEC/NOEC Ratio. Any MEC/NOEC Ratio > 1 would indicate that antibiotic concentrations in the environment exceed NOEC levels and may pose risk to the environment. Also a Margin of Safety for each antibiotic/antibacterial agent was calculated by taking a MEC/NOEC Ratio of 1 (where excess risks occur) divided the MEC/NOEC Ratio for each antibiotic/antibacterial agent.
Results indicated (Tables 6, 7):
(1) Ampicillin (CAS number 69-53-4)—Ampicillin is a cell wall inhibitor class of antibiotic. The MICs ranged from 8000 to 32,000 ug/L and the LCCR was 1000 ug/L which was used as a LOEC. The NOEC was estimated to be < 1000 ug/L. The MEC was < 0.10 ug/L. The MEC/NOEC ratio was < 0.0001. The ratio between the highest MIC and LCCR was 32 (32,000/1000 ug/L) which is indicative of the range of resistance for bacterial response to this antibiotic. The Margin of Safety was ≤ 10,000.
(2) Ciprofloxacin (CAS number 87521-33-1)—Ciprofloxacin is an inhibitor of DNA replication. The MICs ranged from 1000 to < 4000 ug/L and the LCCR was 60 ug/L, which was used as a LOEC. The NOEC was estimated to be < 60 ug/L. The MEC was 0.182 ug/L. The MEC/NOEC ratio was < 0.003. The ratio between the highest MIC and LCCR was 67 (4000/60 ug/L) which is indicative of the range of resistance for bacterial response to this antibiotic. The Margin of Safety was ≤ 333.
(3) Azithromycin (CAS number 83905-01-5)—Azithromycin is a protein synthesis inhibitor. The MICs ranged from 4000 to < 8000 ug/L and the LCCR was 250 ug/L which was a MIC for the most sensitive microbial species, which was used as a LOEC. The NOEC was estimated to be < 250 ug/L. The MEC was 1.65 ug/L. The MEC/NOEC ratio was < 0.0067. The ratio between the highest MIC and LCCR was 32 (8000 ug/L/250 ug/L) which is indicative of the range of resistance for bacterial response to this antibiotic. The Margin of Safety was ≤ 149.
(4) Clarithromycin (CAS number 81103-11-9)—Clarithromycin is a protein synthesis inhibitor. The MICs ranged from 2000 to 8000 ug/L and the LCCR was 250 ug/L which was a MIC for the most sensitive microbial species that was used as a LOEC. The NOEC was estimated to be < 250 ug/L. The MEC was 0.611 ug/L. The MEC/NOEC ratio was < 0.0024. The ratio between the highest MIC and LCCR was 32 (8000/250 ug/L) which is indicative of the range of resistance for bacterial response to this antibiotic. The Margin of Safety was ≤ 417.
(5) Erythromycin (CAS number 114-07-8)—Erythromycin is a protein synthesis inhibitor. The MICs ranged from 8000 to 32,000 ug/L and no LCCR was reported. The MIC for the most sensitive species of 8000 ug/L was used as a LOEC. The NOEC was estimated to be < 8000 ug/L. The MEC was 5700 ug/L. The MEC/NOEC ratio was < 0.00071. The ratio between the highest and lowest MIC and LCCR was 4 (32,000/8000 ug/L) which is indicative of an acute chronic ratio for bacterial response to this antibiotic and was multiplied by 100 (since no LCCR, no most sensitive MIC value was reported, and there was no other sublethal parameter endpoint observed) to derive a Safety Factor of 400 for this antibiotic. The Margin of Safety was ≤ 1409.
(6) Tetracycline (CAS number 60-54-8)—Tetracycline is a protein synthesis inhibitor. The MICs ranged from 8000 to 16,000 ug/L and an LCCR of 10 ug/L was reported. The LCCR for the most sensitive species of 10 ug/L was used as a LOEC. The NOEC was estimated to be < 10 ug/L. The MEC was 1.500 ug/L. The MEC/NOEC ratio was < 0.15. The ratio between the highest and lowest MIC and LCCR was 1600 (16,000/10 ug/L) which is indicative of the range of resistance for bacterial response to this antibiotic. The Margin of Safety was ≤ 6.7.
(7) Sulfathiazole (CAS number 72-14-0)—Sulfathiazole is a nucleotide synthesis inhibitor. The MICs ranged from >500,000 to 500,000 ug/L and an LCCR of 250 ug/L was reported. The LCCR reported for the most sensitive species of 250 ug/L was used as a LOEC. The NOEC was estimated to be < 250 ug/L. The MEC was 0.200 ug/L. The MEC/NOEC ratio was < 0.0008. The ratio between the highest and lowest MIC and LCCR was 2000 (500,000/250 ug/L) which is indicative of the range of resistance for bacterial response to this antibiotic. The Margin of Safety was ≤ 1250.
(8) Sulfamethoxazole (CAS number 723-46-6)—Sulfamethoxazole is a nucleotide synthesis inhibitor. The MICs ranged from >76,000 to 76,000 ug/L and no LCCR was reported. The MIC for the most sensitive species of 76,000 ug/L was used as a LOEC. The NOEC was estimated to be < 76,000 ug/L. The MEC was 2.10 ug/L. The MEC/NOEC ratio was < 0.000028. The ratio between the highest and lowest MIC was >1 (>76,000/76,000 ug/L) which is indicative of the range of resistance for bacterial response to this antibiotic. The Margin of Safety was < 35,714.
(9) Sulfamethizole (CAS number 144-82-1)—Sulfamethizole is a nucleotide synthesis inhibitor. The MICs ranged from 512,000 to 128,000 ug/L and no LCCR was reported. The MIC for the most sensitive species of ranged 32,000–64,000 ug/L and the lowest Most Sensitive MIC value of 32,000 was used as a LOEC. The NOEC was estimated to be < 32,000 ug/L. The MEC was 0.130 ug/L. The MEC/NOEC ratio was < 0.000004. The ratio between the highest and lowest MIC was 16 (512,000/32,000 ug/L) which is indicative of the range of resistance for bacterial response to this antibiotic. The Margin of Safety was ≤ 250,000.
(10) Trimethoprim (CAS number 738-70-5)—Trimethoprim is a nucleotide synthesis inhibitor. The MICs ranged from >16,000 to 4,000 ug/L and no LCCR was reported. The lower MIC value reported for the most sensitive species of 4000 ug/L was used as a LOEC. The NOEC was estimated to be < 4000 ug/L. The MEC was 1.288 ug/L. The MEC/NOEC ratio was < 0.000322. The ratio between the highest and lowest MIC was >4 (>16,000/4000 ug/L) which is indicative of the range of resistance for bacterial response to this antibiotic. The Margin of Safety was ≤ 3106.
(11) Triclocarban (CAS number 101-20-2)—Triclocarban is an antibacterial agent. The MICs ranged from 80,000 to 200 ug/L and an LCCR of 100 ng/L based on a Microtox LOEC was reported. The lower MIC value reported for the most sensitive species of 200 ug/L was used as a MIC LOEC and the Microtox LOEC of 100 ng/l was also reported. The MIC NOEC was estimated to be < 200 ug/L and the Microtox NOEC was estimated at < 0.100 ug/L. The MEC was 0.223 ug/L. The MEC/NOEC ratios was < 0.001 (MIC)–2.23 (Microtox). The ratio between the highest and lowest MIC was 400 (80,000/200 ug/L) which is indicative the range of resistance for bacterial response to this antibiotic. The Margin of Safety was ≤ 1000 based on MICs and 0.45 based on the Microtox EC50 value.
(12) Triclosan (CAS number 3380-34-5)—Triclosan is an antibacterial agent. The MICs ranged from 65 to 8,000,000 ug/L and no LCCR was reported. The lowest MIC value reported for the most sensitive species of 25 ug/L was used as a LOEC. The NOEC was estimated to be < 25 ug/L. The MEC was 2.700 ug/L. The MEC/NOEC ratio was 0.108. The ratio between the highest and lowest MIC was 320,000 (8,000,000/25 ug/L) which is indicative of the range of resistance for bacterial response to this antibiotic. The Margin of Safety was ≤ 9.26.
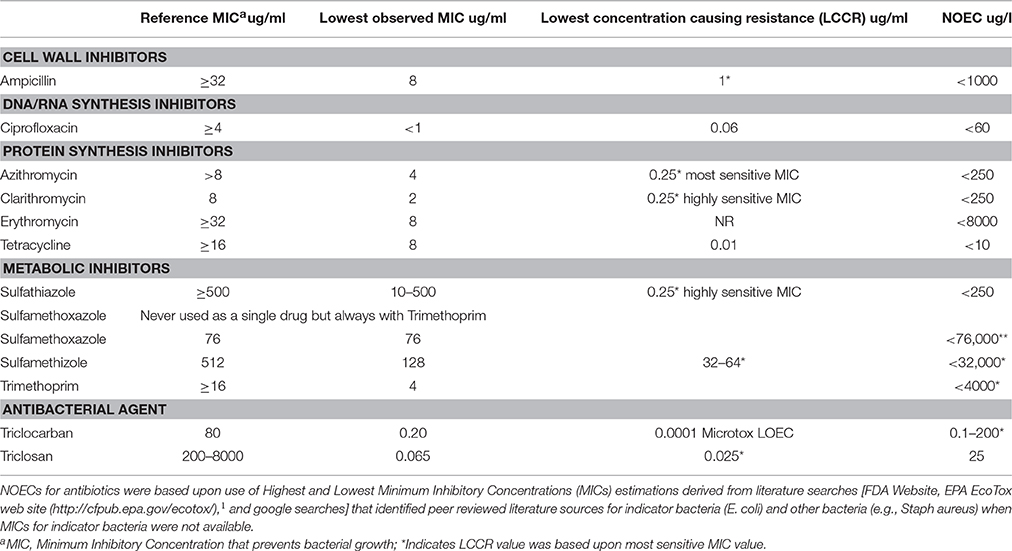
Table 6. MIC and screening level assessment values for 10 antibiotics and two antibacterial agents frequently detected in the environment.
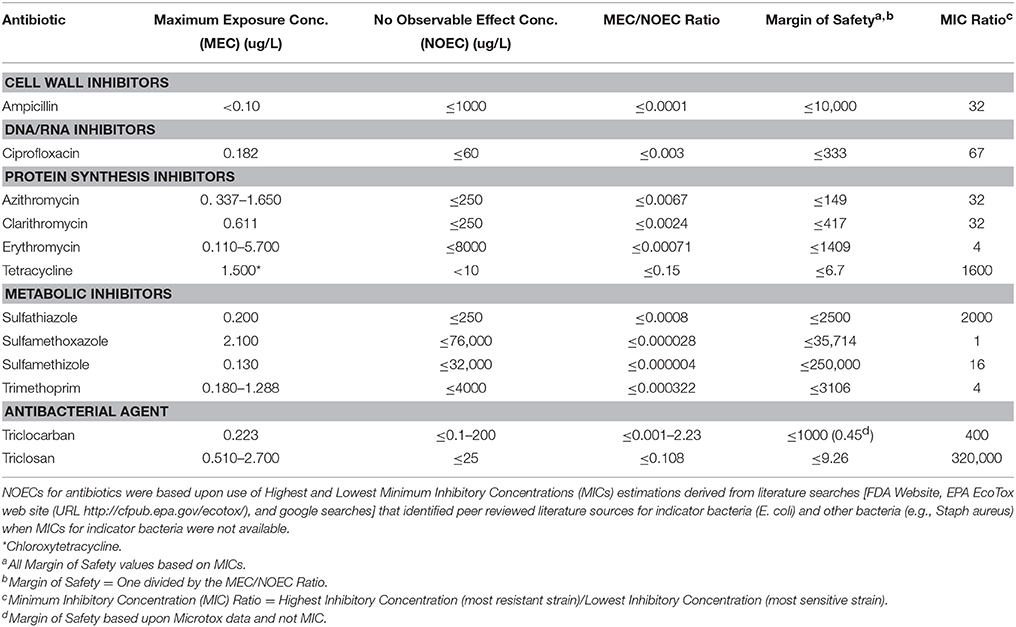
Table 7. The Maximum Exposure Concentration (MEC), NOEC, MEC, NOEC Ratio, Margin of Safety, and MIC Ratio for 10 commonly detected antibiotics and two antibacterial agents.
This approach provides a risk assessment process for comparing differences among different antibiotics and antibacterial agents in terms of overall exposure level in the environment (MEC), the most sensitive strain (NOEC) and the range of resistance expressions as determined by the MIC Ratios. When MECs exceed NOECs there is a clear potential for impacts to the microbial community. The Margin of Safety estimate provides an indication of how great the potential is to exceed the MEC/NOEC ratio and allows for consideration of uncertainty in the quality and quantity of data available for the evaluation of each antibiotic. There was one antibiotic (Tetracycline) and one antimicrobial agent (Triclosan) which had relatively low Margins of Safety ranging from < 6.7 to 9.26 using MICs as the estimator for the NOEC. Only one microbial agent, triclocarban, had an exceedance of the MEC/NOEC ratio of 1 but only with the use of a Microtox EC50 value (MEC/NOEC = 2.23) where as MEC/NOEC ratio using the MIC was only 0.001. Similarly, only two antibiotics—Tetracycline (High/Low MIC Ratio of 1600) and Sulfathiazole (MIC Ratio of 2000) and two antimicrobial agents—Triclocarban (MIC Ratio of 400) and Triclosan (MIC Ratio of 320,000) had large High/Low MIC Ratios indicating a wide range of response to differing concentrations of each chemical. For the other antibiotics the High/Low MIC Ratio ranged from 4 to 67, indicating a much lower response to differing concentration of each chemical.
Discussion
As this review has indicated, antibiotics have been detected in surface waters, sediments, and tissues at many locations around the US. In the most thorough investigation in surface waters and freshwater streams by the USGS (Kolpin et al., 2002), antibiotics and antimicrobial disinfectants were detected at 22 and 57.6% respectively, of the sites sampled nation-wide in the US. The most frequently detected antibiotics in freshwater and effluents included Tetracycline (1.2% frequency of detection), Chlortetracycline (2.4%), Ciprofloxacin (2.6%), Sulfamethazine (1.2–4.8%), Roxithromycin (4.8%), Tylosin (13.5%), Sulfamethoxazole (12.5-19%), Lincomycin (19.2%), Erythromycin (21.5%), and Trimethoprim (12.4–27.5%), while Triclosan (57.6%) was the most frequently detected antimicrobial agent. (Kolpin et al., 2002). Maximum concentrations of these 10 most frequently detected antibiotics ranged from 0.11 to 1.90 ug/L and the maximum concentration for an antimicrobial agent was Triclosan at 2.70 ug/L (Kolpin et al., 2002). High frequency of detection and highest maximum concentrations often co-occurred for both antibiotics (Erythromycin—21% and 1.70 ug/L; Sulfamethoxazole—19% and 1.90 ug/L) and antibacterial agents (Triclosan—57.6% and 2.70 ug/L).
Results presented in this review of the analyses from earlier published studies [Benotti and Brownawell, 2007; Klosterhaus, 2010; Diamond, 2011; National Oceanic and Atmospheric Administration, 2011; Klosterhaus et al., 2013; Hedgespeth et al., 2012] similarly indicated the presence of Ampicillin, Clarithromycin, Erythromycin, Penicillin, Sulfamethizole, Sulfamethoxazole, Tetracycline, Triclosan, and Trimethoprim in effluent and marine surface waters of coastal ecosystems. Similarly in marine sediments Azithromycin, Ciprofloxacin, Erythromycin, Sulfamethoxazole, Triclocarban, and Trimethoprim were detected. In mussel tissues (Geukensia demissa) from California coastal ecosystems, only Erythromycin, Sulfamethiazole and Triclocarban were detected. These results clearly indicate that most of the antibiotics reported in coastal waters in this study were similar to those most frequently detected antibiotics/antibacterial agents measured in the nation-wide assessment of effluent and freshwater rivers/streams by USGS (Kolpin et al., 2002).
Antibiotic resistance was also measured in bacteria within aquatic environments and may represent a possible general biomarker of long term antibiotic/antibacterial agent exposure, although other environmental factors [e.g., temperature (Hinks et al., 1977; James and Edwards, 1989) and heavy metal concentrations (Seiler and Berendonk, 2012)] are known to select antibiotic resistant bacteria. The selected review of published literature indicated the presence of E. coli which were resistant to many of the same antibiotics measured in the environment including Ampicillin, Chlortetracycline, Oxytetracycline, Penicillin, Sulfathiazole, and Tetracycline in effluent/surface waters and to Ampicillin and Penicillin in rectal swabs from bottlenose dolphins [Greig et al., 2007; National Oceanic and Atmospheric Administration, 2011]. Bacterial resistance was also observed to Amoxicillin and Cephalothin in rectal swabs from bottlenose dolphins and to Kanamycin, Nalidixic Acid and Streptomycin in bacteria in surface waters [Greig et al., 2007; National Oceanic and Atmospheric Administration, 2011]. Rates of antibiotic resistance ranged from 5 to 22% in WWTP effluent, 12–16% in effluent from CAFOs, 0.9–25% in surface waters, and 8–39% in bottled-nose dolphins [Greig et al., 2007; National Oceanic and Atmospheric Administration, 2011].
Little is known about the direct connections between WWTPs and antibiotic resistance, yet many characteristics of wastewater make it a highly suspect medium for the spread of antibiotic resistance in the environment (Lachmayr et al., 2009). This includes the presence of antibacterial agents (e.g., Triclosan and Triclocarban) from household products (hand soaps and detergents) as well as the presence of antibiotics either excreted directly by humans or disposed of down the drain in WWTP waste streams and effluent (Lachmayr et al., 2009). Bacteria can become resistant to antibiotics naturally through a series of mechanisms (Aminov, 2009; Davies and Davies, 2010) as well as resistance conferred by direct exposure to a number of environmental factors including temperature and heavy metals (Seiler and Berendonk, 2012), as well as antibiotics. This may increase the rate of gene mutation and enhance subsequent acquisition of genes (e.g., coding enzymes that may damage antibiotics, enzymes that allow synthesis in the presence of inhibitors, and antibiotic pumps) carried by plasmids or other mobile genetic elements that may be exchanged with both naïve and antibiotic resistant bacteria in the environment (Lachmayr et al., 2009; Uyaguari et al., 2011). Thus, while some antibiotics may increase the mutation rate and subsequently increase the chances of causing antibiotic resistance, antibiotic resistant bacteria with mutant genes do not necessarily require subsequent acquisition of other resistance genes in order to develop resistance. Thus, the exact importance of WWTPs and other major pollutions sources of antibiotic exposure and genes carried by plasmids or other mobile genetic elements remain unclear. Results of monitoring antibiotic resistance genes in a WWTP suggested that the blaM−1 gene, a novel class A B-lactamase gene conferring resistance to ampicillin was enriched in the principal effluent which is subsequently released into the surrounding coastal aquatic ecosystem resulting in an estimated 3.9 × 10¹⁴ copies of the blaM−1 gene released daily into Charleston Harbor, SC (Uyaguari et al., 2011). Approximately two-thirds of antibiotics administered to humans are B-lactams, for which the mechanism of antibiotic resistance is hydrolysis by B-lactamases (Lachmayr et al., 2009). Lachmayr et al. (2009) similarly has found that while modern WWTP technology may reduce the concentrations of B-Lactam antibiotic resistance genes, the ratio of the blaTEM genes/16SrRNA genes increased with treatment, suggesting that bacteria harboring the blaTEM genes are likely to survive WWTP treatment. The mobility of these genes is related in part to their association with transposons and integrons (Lachmayr et al., 2009).
In coastal environments, Baker-Austin et al. (2008) has shown that >99% of Vibrio parahaemolyticus isolated from Charleston Harbor and other sites in coastal South Carolina and Georgia demonstrate resistance to a range of antibiotics. Vibrio bacteria are marine bacteria and one of three pathogens that the CDC reports as showing increased rates of infection, with most increases in Vibrio infections resulting from wound infections rather than seafood consumption (Weiss et al., 2011). The high rates of antibiotic resistance in vibrios raise concerns about the potential discharge of antibiotic resistant genes into aquatic environments from WWTPs and other major pollution sources. As these results and discussions have clearly shown, the measurement of antibiotic resistance when measured in combination with chemical measurements of antibiotics/antibacterial agents as well as other legacy pollutants that may affect antibiotic resistance (e.g., heavy metals) will provide important information on the presence of these CECs within aquatic ecosystems, as both exposure and possible effects are discerned. While we acknowledge that there are both naturally occurring levels of antibiotic resistance and that other environmental factors may affect antibiotic resistance, such as heavy metals (Seiler and Berendonk, 2012), direct chemical measurements of antibiotics concentrations in water and sediments when coupled with assessment of antibiotic resistance rates in key indicator bacteria within the environment provide an essential starting point for environmental assessments. Comparing the levels and types (genotypes) of antibiotic resistance in bacteria within the environment throughout a variety of land use types (pristine, urban, agricultural/livestock) and pollution sources (e.g., WWTPs, CAFOs) will provide a better understanding of the significance of antibiotic exposure within aquatic ecosystems. To be clear however, these measurements do not indicate risks to humans and the ecosystems per se.
The use of MICs and resulting risk assessment process to assess potential effects of antibiotics and antibiotic risk presented in this study provides a method that can address both the toxicological hazard of the antibiotic/antimicrobial agent and also the microbial hazard in terms of development of antibiotic risks (e.g., plasmids) which may be relevant to human exposure. MICs represent an estimation of the concentrations at which adverse effects occur in bacteria and thus provide a LOEC concentration from which NOECs can be estimated at levels < LOEC. This derived NOEC can then be compared to MEC of each antibiotic/antibacterial agent in the environment to assess whether current levels of antibiotics in the environment will kill, harm or alter the bacteria. At MECs >NOECs, mortality in bacteria will occur primarily in the antibiotic sensitive isolates within the bacterial population, leaving primarily antibiotic resistant portion of the population to persist within the environment. These resistant isolates will have a greater potential to develop plasmid mediated and other types of resistance. Also antibiotic/antibacterial agent concentrations < NOEC may also possibly breed resistance due to the greater potential for sublethal molecular responses to antibiotic exposure. Those antibiotics/antibacterial agents, which have had multiple MIC determinations made at a range of concentrations, have much greater insight into the potential for development of antibiotic resistance. This range of MIC determinations may provide a further estimate of bacterial adaptability to the antibiotic/antibacterial agent. As bacteria adapt, higher MIC determinations may be observed which will provide a larger range in MIC determinations which may provide a possible estimation of adaptability differences among different antibiotics and bacterial species.
The application of our risk assessment methods applied to 10 antibiotics and two antibacterial agents indicated that two antibiotics Tetracycline and Sulfathiazole and two antibacterial agents—Triclosan and Triclocarban had high MIC ratios ranging from 400 to 320,000 compared to MIC ratios ranging from 4 to 67 for the other eight antibiotic assessed. Similarly only one antibiotic—Tetracycline, and one antibacterial agent—Triclosan, had high MEC/NOEC ratios (0.108–0.15), low margins of safety (6.70–9.26) and high MIC ratios (1600–320,000) when compared to the other nine antibiotics and one antibacterial agent. Maruya et al. (2013) applied the use of Uncertainty Factors to address the quality (inadequacies/incompleteness) of toxicological, chemistry and microbial data in estimating the hazards of CECs for the State of California (Anderson et al., 2012). For antibiotic resistance, Uncertainty Factors (10–100) were used when data for specific indicator species were lacking (e.g., E. coli) and/or for a lack of MIC values for both sensitive and resistant bacteria were not available. The only antibiotic/antibacterial agent that had excessive risk was Triclosan, which had a MEC/NOEC ratio > 1 when an Uncertainty Factor of 10 was used. Triclosan was one of 12 new CECs recommended for monitoring by the state of California and the only antibiotic/antimicrobial agent recommended for further monitoring of CECs (Anderson et al., 2012). This combination of approaches using MECs, MICs, and Uncertainty Factors seems to provide a path forward for assessing the risks of antibiotics and antibacterial agents, as antibacterial resistance research and better monitoring studies measuring antibiotics/antibacterial agents and antibiotic resistant bacteria continues to help us better define and understand the complexities of antibiotic resistance within aquatic environments and coastal ecosystems.
Author Contributions
All authors listed, have made substantial, direct and intellectual contribution to the work, and approved it for publication.
Conflict of Interest Statement
The handling Editor declared a shared affiliation, though no other collaboration, with one of the authors MIU-D and states that the process nevertheless met the standards of a fair and objective review.
The other author declare that the research was conducted in the absence of any commercial or financial relationships that could be construed as a potential conflict of interest.
Acknowledgments
The authors wish to thank the Southern California Coastal Water Research Project (SCCWRP) and National Oceanic and Atmospheric Administration (NOAA) for use of extensive data sets compiled by each agency. Also the hard work by researchers at SCCWRP and their Expert Panel on CECs, NOAA and the University of South Carolina who generated many of the concepts and much of the data used in this study.
Abbreviations
CECs, Contaminants of Emerging Concern; ARM, Antibiotic Resistant Microbes; CAFOs, Confined Animal Feeding Operations; MEC, Maximum Exposure Concentration; MICs, Minimum Inhibitory Concentration; LOEC, Lowest Observable Effect Concentration; NOEC, No Observable Effect Concentration; WWTP, Waste Water Treatment Plant.
Footnotes
1. ^(U.S.) Environmental Protection Agency. (2015). EPA EcoTox web site. Available online at: http://cfpub.epa.gov/ecotox/.
References
Ala'Aldeen, D., and Hiramatsu, K. (2004). Staphylococcus Aureus: Molecular and Clinical Aspects. Chichester, UK: Horwood Publishing.
Allen, H. K., Moe, L. A., Rodbumrer, J., Gaarder, A., and Handelsman, J. (2009). Functional metagenomics reveals diverse beta-lactamases in a remote Alaskan soil. ISME J. 3, 243–251. doi: 10.1038/ismej.2008.86
Aminov, R. I. (2009). The role of antibiotics and antibiotic resistance in nature. Environ. Microbiol. 11, 2970–2988. doi: 10.1111/j.1462-2920.2009.01972.x
Anderson, P. D., Denslow, N. D., Drewes, J. E., Oliviera, A. W., Schlenck, D., Scott, G. I., et al. (2012). Monitoring Strategies for Chemicals of Emerging Concern (CECs) in California's Aquatic Ecosystems, Technical Report 692, Southern California Coastal Water Research Project, Cosa Mesa, CA, 195.
Auerbach, E. A., Seyfried, E. E., and McMahon, K. D. (2007). Tetracycline resistance genes in activated sludge wastewater treatment plants. Water Res. 41, 1143–1151. doi: 10.1016/j.watres.2006.11.045
Baker-Austin, C., McArthur, J. V., Tuckfield, R. C., Najarro, M., Lindell, A. H., Gooch, J., et al. (2008). Antibiotic resistance in the shellfish pathogen Vibrio parahaemolyticus, isolated from the coastal water and sediment of Georgia and South Carolina, USA. J. Food Protect. 71, 2552–2558.
Barlow, M., and Hall, B. G. (2002). Phylogenetic analysis shows that the OXA beta-lactamase genes have been on plasmids for millions of years. J. Mol. Evol. 55, 314–321. doi: 10.1007/s00239-002-2328-y
Barnes, K. K., Christenson, S. C., Kolpin, D. W., Focazio, M., Furlong, E. T., Zaugg, S. D., et al. (2004). Pharmaceuticals and other organic waste water contaminants within a leachate plume downgradient of a municipal landfill. Ground Wat. Monit. R. 24, 119–126. doi: 10.1111/j.1745-6592.2004.tb00720.x
Bennett, P. M. (2008). Plasmid encoded antibiotic resistance: acquisition and transfer of antibiotic resistance genes in bacteria. Br. J. Pharmacol. 153(Suppl. 1), S347–S357. doi: 10.1038/sj.bjp.0707607
Benotti, M. J., and Brownawell, B. J. (2007). Distributions of pharmaceuticals in an urban estuary during both dry- and wet-weather conditions. Environ. Sci. Technol. 41, 5975–5802. doi: 10.1021/es0629965
Davies, J., and Davies, D. (2010). Origins and evolution of antibiotic resistance. Microbiol. Mol. Biol. Rev. 74, 417–433. doi: 10.1128/MMBR.00016-10
Diamond, J. (2011). Development of Diagnostic Tools for Trace Organic Compounds and Multiple Stressors. Water Environment Research Foundation, Project Report CEC5R08: 172.
European Centre for Disease Control (2013). Antimicrobial Resistance Interactive Database (EARS-NET). Solna.
Federal Interagency Working Group – Pharmaceuticals in the Environment (FIWG-PIE) (2009). Pharmaceuticals in the Environment – An Interagency Research Strategy. U.S Congressional Committee on Environmental and Natural Resources Report, Washington, DC, 61.
Ferry, J. (2015). Monitoring Results from the Wastewater Treatment Plant in Columbia, SC. Columbia, SC: Department of Chemistry and Biochemistry, University of South Carolina. Personal Communications.
Garriss, G., Waldor, M. K., and Burrus, V. (2009). Mobile antibiotic resistance encoding elements promote their own diversity. PLoS Genet 5:e1000775. doi: 10.1371/journal.pgen.1000775
Gelbrand, H., Miller-Petrie, M., Pant, S., Gandra, S., Levinson, J., Barter, D., et al. (2015). The State of the World's Antibiotics 2015. Wound Healing Southern Africa, Vol. 8, 30–34.
Godfrey, E., Woessner, W. W., and Benotti, M. J. (2007). Pharmaceuticals in on-site sewerage effluent and groundwater, western Montana. Groundwater 45, 263–271. doi: 10.1111/j.1745-6584.2006.00288.x
Greig, T. W., Bemiss, J. A., Lyon, B. R., Bossart, G. D., and Fair, P. A. (2007). Prevalence and diversity of antibiotic resistant Escherichia coli in Bottlenose Dolphins (Tursiops truncatus) from the Indian River Lagoon, Florida, and Charleston Harbor Area, South Carolina. Aquat. Mammals 33, 185–194. doi: 10.1578/AM.33.2.2007.185
Hedgespeth, M. L., Sapozhnikova, Y., Pennington, P., Clum, A., Fairey, A., and Wirth, E. (2012). Pharmaceuticals and personal care products (PPCPs) in treated wastewater discharges into Charleston Harbor, SC. Sci. Total Environ. 437, 1–9. doi: 10.1016/j.scitotenv.2012.07.076
Hinks, E. T., Daneo-Moore, L., and Braveman, S. (1977). Temperature effects on minimum inhibitory and bactericidal concentrations of cell wall antibiotics in Streptococcus faecalis. Antimicrob. Agents Chemother. 12, 281–283. doi: 10.1128/AAC.12.2.281
Humeniuk, C., Arlet, G., Gautier, V., Grimont, P., Labia, R., and Philippon, A. (2002). β-Lactamases of Kluyvera ascorbata, Probable Progenitors of Some Plasmid-Encoded CTX-M Types. Antimicrob. Agents Chemother. 46, 3045–3049. doi: 10.1128/AAC.46.9.3045-3049.2002
James, P. D., and Edwards, C. (1989). The effects of temperature on growth and production of the antibiotic granaticin by a thermotolerant streptomycete. J. Gen. Microbiol. 135, 1997–2003. doi: 10.1099/00221287-135-7-1997
Joss, M. J., Koenig, J. E., Labbate, M., Polz, M. F., Gillings, M. R., Stokes, H. W., et al. (2009). ACID: annotation of cassette and integron data. BMC Bioinformatics 10:118. doi: 10.1186/1471-2105-10-118
Kaspar, C. W., Burgess, J. L., Knight, I. T., and Colwell, R. R. (1990). Antibiotic resistance indexing of Escherichia coli to identify sources of fecal contamination in water. Can. J. Microbiol. 36, 891–894. doi: 10.1139/m90-154
Kelsey, H., Porter, D. E., Scott, G., Neet, M., and White, D. (2003b). Using geographic information systems and regression analysis to evaluate land use impacts on fecal coliform bacterial pollution. J. Exp. Mar. Biol. 298, 197–209. doi: 10.1016/S0022-0981(03)00359-9
Kelsey, H. E., Scott, G., Porter, D. E., Thompson, B., and Webster, L. (2003a). Using multiple antibiotic resistance and land use characteristics to determine sources of fecal coliform bacterial pollution. Environ. Monit. Assess. 81, 337–348. doi: 10.1023/A:1021305930858
Klosterhaus, S. L. (2010). “Update on contaminants of emerging concern,” in San Francisco Bay Estuary Institute, 2010 Regional Monitoring Program Annual Meeting: Abstract and Presentation (San Francisco, CA).
Klosterhaus, S. L., Grace, R., Hamilton, M. C., and Yee, D. (2013). Method validation and reconnaissance of pharmaceuticals, personal care products, and alkylphenols in surface waters, sediments, and mussels in an urban estuary. Environ. Int. 54, 92–99. doi: 10.1016/j.envint.2013.01.009
Kolpin, D. W., Furlong, E. T., Meyer, M. T., Thurman, E. M., Zaugg, S. D., Barber, L. B., et al. (2002). Pharmaceuticals, hormones, and other organic wastewater contaminants in U.S. streams, 1999-2000: a National Reconnaissance. Environ. Sci. Technol. 36, 1202–1211. doi: 10.1021/es011055j
Kummerer, K. (2009). Antibiotics in the aquatic environment–a review–part I. Chemosphere 75, 417–434. doi: 10.1016/j.chemosphere.2008.11.086
Lachmayr, K. L., Kerkhof, L. J., DiRienzo, A. G., Cavanaugh, C. V., and Ford, T. E. (2009). Quantifying nonspecific TEM B-Lactamse (blaM-1) Genes in a Wastewater Stream. Appl. Environ. Microbiol. 75, 203–211. doi: 10.1128/AEM.01254-08
Mazel, D. (2006). Integrons: agents of bacterial evolution. Nat. Rev. Microbiol. 4, 608–620. doi: 10.1038/nrmicro1462
Munir, M., Wong, K., and Xagoraraki, I. (2011). Release of antibiotic resistant bacteria and genes in the effluent and biosolids of five wastewater utilities in Michigan. Water Res. 45, 681–693. doi: 10.1016/j.watres.2010.08.033
Maruya, K. A., Schlenck, D., Anderson, P. D., Denslow, N. D., Drewes, J. E., Oliviera, A. W., et al. (2013). An adaptive, comprehensive monitoring strategy for Chemical Contaminants of Emerging Concern (CECs) in California aquatic ecosystems. Integr. Environ. Assess. Manag. 10, 69–77. doi: 10.1002/ieam.1483
National Oceanic Atmospheric Administration (NOAA). (2011). Rates of Antibiotic Resistance in SC Sewerage Treatment Plants and Farm Animal Operations. Technical Report, Center for Coastal Environmental Health and Biomolecular Research, Charleston, SC, 28.
O'Neill, J. (2014). Review on Antimicrobial Resistance. Antimicrobial Resistance: Tackling a Crisis for the Health and Wealth of Nations.201. The Office of the United Kingdom Prime Minister, Creative Commons Attribution 4.0 International Public License: 18.
Pait, A. S., Warner, R. A., Hartwell, S. I., Nelson, J. O., Pacheco, P. A., and Mason, A. L. (2006). Human Use Pharmaceuticals in the Estuarine Environment: A Survey of the Chesapeake Bay, Biscayne Bay and Gulf of the Farallones. Silver Spring, MD: NOAA/NOS/NCCOS/Center for Coastal Monitoring and Assessment.
Parveen, S., Murphree, R. L., Edmiston, L., Kaspar, C. W., Portier, K. M., and Tamplin, M. L. (1997). Association of multiple-antibiotic resistance profiles with point and nonpoint sources of Escherichia coli in Apalachicola Bay. Appl. Environ. Microbiol. 63, 2607–2612.
Pellegrini, C., Celenza, G., Segatore, B., Bellio, P., Setacci, D., Amicosante, G., et al. (2011). Occurrence of class 1 and 2 integrons in resistant Enterobacteriaceae collected from a urban wastewater treatment plant: first report from central Italy. Microb. Drug Resist. 17, 229–234. doi: 10.1089/mdr.2010.0117
Pomati, F., Castiglioni, S., Zuccato, E., Fanelli, R., Vigetti, D., Rossetti, C., et al. (2006). Effects of a complex mixture of therapeutic drugs at environmental levels on human embryonic cells. Environ. Sci. Technol. 40, 2442–2447. doi: 10.1021/es051715a
Pomati, F., Orlandi, C., Clerici, M., Luciani, F., and Zuccato, E. (2008). Effects and interactions in an environmentally relevant mixture of pharmaceuticals. Toxicol. Sci. 102, 129–137. doi: 10.1093/toxsci/kfm291
Reinthaler, F. F., Posch, J., Feierl, G., Wust, G., Haas, D., Ruckenbauer, G., et al. (2003). Antibiotic resistance of E. coli in sewage and sludge. Water Res. 37, 1685–1690. doi: 10.1016/S0043-1354(02)00569-9
Romero, J., Feijoo', C. G., and Navarrete, P. (2012). “Antibiotics in aquaculture – use, abuse and alternatives,” in Health and the Environment in Aquaculture, ed N. Carvalho (Rejaka: InTech Open Science), 159–198.
Rosenblatt-Farrell, N. (2009). The landscape of antibiotic resistance. Environ. Health Perspect. 117, A244–A250. doi: 10.1289/ehp.117-a244
San Diego Regional Water Quality Board. (2011). Contaminants of Emerging Concern (CECs) Summary, June, 2011. San Diego Regional Water Quality Board, San Diego, CA, 3.
Seiler, C., and Berendonk, T. U. (2012). Heavy metal driven co-selection of antibiotic resistance in soil and water bodies impacted by agriculture and aquaculture. Front. Microbiol. 3:399. doi: 10.3389/fmicb.2012.00399
Slack, R. J., Gronow, J. R., and Voulvoulis, N. (2005). Household hazardous waste in municipal landfills: contaminants in leachate. Sci. Total Environ. 337, 119–137. doi: 10.1016/j.scitotenv.2004.07.002
Szczepanowski, R., Linke, B., Krahn, I., Gartemann, K. H., Gutzkow, T., Eichler, W., et al. (2009). Detection of 140 clinically relevant antibiotic-resistance genes in the plasmid metagenome of wastewater treatment plant bacteria showing reduced susceptibility to selected antibiotics. Microbiology 155(Pt 7), 2306–2319. doi: 10.1099/mic.0.028233-0
Szczepanowski, R. I., Krahn, B., Linke, A., Goesmann, A., Puhler, A., and Schluter, A. (2004). Antibiotic multiresistance plasmid pRSB101 isolated from a wastewater treatment plant is related to plasmids residing in phytopathogenic bacteria and carries eight different resistance determinants including a multidrug transport system. Microbiology 150(Pt 11), 3613–3630. doi: 10.1099/mic.0.27317-0
Tennstedt, T., Szczepanowski, R., Braun, S., Puhler, A., and Schluter, A. (2003). Occurrence of integron-associated resistance gene cassettes located on antibiotic resistance plasmids isolated from a wastewater treatment plant. FEMS Microbiol. Ecol. 45, 239–252. doi: 10.1016/S0168-6496(03)00164-8
Thompson, B. (2007). Master's Thesis. Arnold School of Public Health, Department of Environmental Health Sciences, University of South Carolina, Columbia, SC.
U.S. Food and Drug Administration. (2010). Draft Guidance: The Judicious Use of Medically Important Antimicrobial Drugs In Food-Producing Animals. Federal Register Notice, Vol. 75, No. 124, 37450–37451.
U.S. Food and Drug Administration (FDA) (2015). US FDA Website. Available online at: http://www.fda.gov/Drugs/ResourcesForYou/Consumers/BuyingUsingMedicineSafely/AntibioticsandAntibioticResistance/default.htm
U.S. Geological Survey (USGS). (2002). The1999-2000 Survey of 139 US Waterways. Technical Report Open-File Report 02-94, USGS, Washington, DC; Restin, VA.
Uyaguari, M., Fichot, E. B., Scott, G., and Norman, R. S. (2011). Characterization and quantification of a novel beta-lactamase gene found in a wastewater treatment facility and the surrounding coastal ecosystem. Appl. Environ. Microbiol. 77, 8226–8233. doi: 10.1128/AEM.02732-10
Uyaguari, M., Key, P. B., Gooch, J., Jackson, K., and Scott, G. I. (2010). Acute effects of the antibiotic oxytetracycline on the bacterial community of the grass shrimp, Palaemonetes pugio. Environ. Toxicol. Chem. 28, 2715–2724. doi: 10.1897/08-514.1
Uyaguari, M., Scott, G., and Norman, R. S. (2013). Abundance of class 1-3 integrons in South Carolina estuarine ecosystems under high and low levels of anthropogenic influence. Marine Poll. Bull. 15, 77–84. doi: 10.1016/j.marpolbul.2013.09.027
Uyaguari, M. I. (2011). Microbial Antibiotic Resistance and Integron Gene Distribution within a Heavily Populated Coastal Urbanized Coastal Estuarine Ecosystem. Doctoral Dissertation, Arnold School of Public Health, Department of Environmental Health Sciences, University of South Carolina, 140.
Van Boeckel, T. P., Brower, C., Gilbert, M., Grenfell, B. T., Levin, S. A., Robinson, T. P., et al. (2015). Global trends in antimicrobial use in food animals. Proc. Natl. Acad. Sci. U.S.A. 112, 5649–5654. doi: 10.1073/pnas.1503141112
Van Dolah, Van Dolah, R. F., Chestnut, D. E., and Scott, G. I. (2000). A Baseline Assessment of Environmental and Biological Conditions in Broad Creek and the Okatee River, Beaufort County, South Carolina. Final Report to the Beaufort County Council, SC Dept. of Natural Resources, 281p.
Van Boeckel, T. P., Gandra, S., Ashok, A., Caudron, Q., Grenfell, B. T., Levin, S. A., et al. (2014). Global antibiotic consumption 2000 to 2010: an analysis of national pharmaceutical sales data. Lancet Infect. Dis. 14, 742–750. doi: 10.1016/S1473-3099(14)70780-7
Van Epps, H. L., and Dubos, R. (2006). Unearthing antibiotics. J. Exp. Med. 203, 259. doi: 10.1084/jem.2032fta
Van Hoek, A., Mevius, D., Guerra, B., Mullany, P., Roberts, A. P., and Aarts, H. J. M. (2011). Acquired antibiotic resistance: an overview. Front. Microbiol. 2:203. doi: 10.3389/fmicb.2011.00203
Webster, L. F., Thompson, B. C., Fulton, M. H., Chestnut, D. E., Van Dolah, R. F., Leight, A. K., et al. (2004). Identification of sources of E. coli in South Carolina estuaries using antibiotic resistance analysis. J. Exp. Mar. Biol. 298, 179–195. doi: 10.1016/S0022-0981(03)00358-7
Weiss, K. E., Hammond, R. M., Hutchinson, R., and Balckmore, C. G. M. (2011). Vibrio illnesses in Florida, 1998-2007. Epidemiol. Infect. 139, 591–598. doi: 10.1017/S0950268810001354
Wintgens, T., Gallenkemper, M., and Melin, T. (2003). Occurrence and removal of endocrine disrupters in landfill leachate treatment plants. Water Sci. Technol. 48, 127–134.
Wise, R. (2002). Antimicrobial resistance: priorities for action. J. Antimicrob. Chemother. 49, 585–586. doi: 10.1093/jac/49.4.585
Keywords: contaminants of emerging concern, antibiotics, no observable effects concentration, maximum exposure concentration, blaM−1 genes
Citation: Scott GI, Porter DE, Norman RS, Scott CH, Uyaguari-Diaz MI, Maruya KA, Weisberg SB, Fulton MH, Wirth EF, Moore J, Pennington PL, Schlenk D, Cobb GP and Denslow ND (2016) Antibiotics as CECs: An Overview of the Hazards Posed by Antibiotics and Antibiotic Resistance. Front. Mar. Sci. 3:24. doi: 10.3389/fmars.2016.00024
Received: 01 December 2015; Accepted: 23 February 2016;
Published: 20 April 2016.
Edited by:
Juan Jose Alava, University of British Columbia (UBC) and Simon Fraser University, CanadaReviewed by:
Gulsen Altug, Istanbul University, TurkeyJulian Davies, University of British Columbia, Canada
Copyright © 2016 Scott, Porter, Norman, Scott, Uyaguari-Diaz, Maruya, Weisberg, Fulton, Wirth, Moore, Pennington, Schlenk, Cobb and Denslow. This is an open-access article distributed under the terms of the Creative Commons Attribution License (CC BY). The use, distribution or reproduction in other forums is permitted, provided the original author(s) or licensor are credited and that the original publication in this journal is cited, in accordance with accepted academic practice. No use, distribution or reproduction is permitted which does not comply with these terms.
*Correspondence: Geoffrey I. Scott, Z2lzY290dDBAbWFpbGJveC5zYy5lZHU=
 Geoffrey I. Scott
 Dwayne E. Porter
 R. Sean Norman
 C. Hart Scott1
 Miguel I. Uyaguari-Diaz
 Keith A. Maruya
 Steve B. Weisberg
 Michael H. Fulton
 Ed F. Wirth
 Janet Moore
 Paul L. Pennington
 Daniel Schlenk
 Nancy D. Denslow