Fluorescence Quantum Yields of Natural Organic Matter and Organic Compounds: Implications for the Fluorescence-based Interpretation of Organic Matter Composition
 Urban J. Wünsch
 Kathleen R. Murphy
 Colin A. Stedmon
- 1Section for Marine Ecology and Oceanography, National Institute of Aquatic Resources, Technical University of Denmark, Charlottenlund, Denmark
- 2Water Environment Technology, Chalmers University of Technology, Gothenburg, Sweden
A Corrigendum on
Fluorescence Quantum Yields of Natural Organic Matter and Organic Compounds: Implications for the Fluorescence-based Interpretation of Organic Matter Composition.
by Wünsch, U. J., Murphy, K. R., and Stedmon, C. A. (2015) Front. Mar. Sci. 2:98. doi: 10.3389/fmars.2015.00098
The authors wish to include the following corrections to the original article. Some data presented in the published article were inaccurate due to improper instrumental correction factors resulting in incorrect fluorescence intensities. Moreover, we have corrected an error in the aquaDOM toolbox that affected the molar fluorescence and absorbance of organic compounds reported in the original article. Since these issues influenced data reported in Tables 1, 2 and figures (Figures 1–9), there is a need for this corrigendum. The findings of the original manuscript were unaffected by these issues and remain the same.
TABLE 1
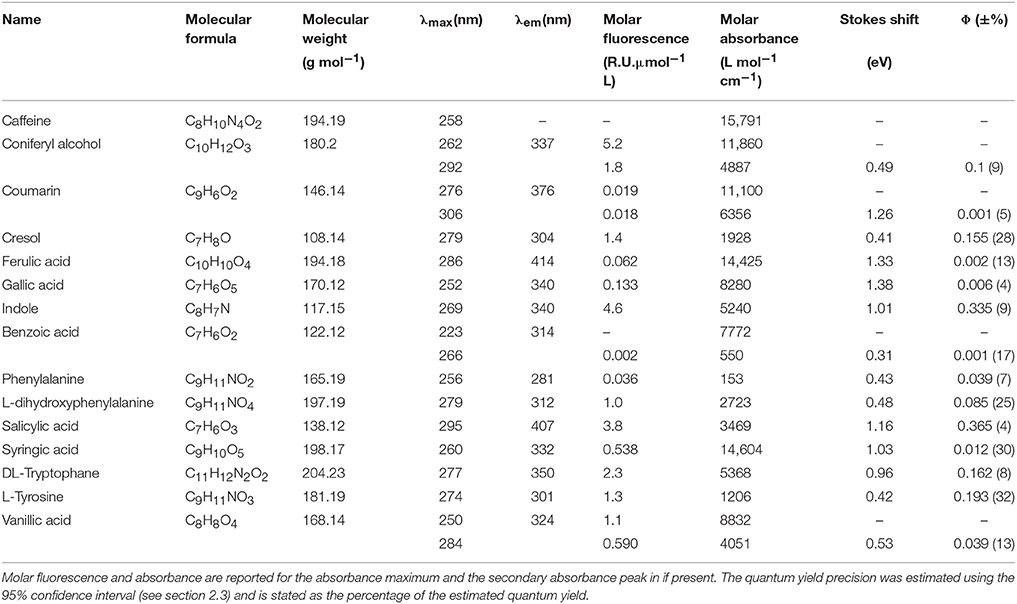
Table 1. Optical properties of organic compounds dissolved in 1 mmol L−1 phosphate buffer (pH 7.5).
TABLE 2
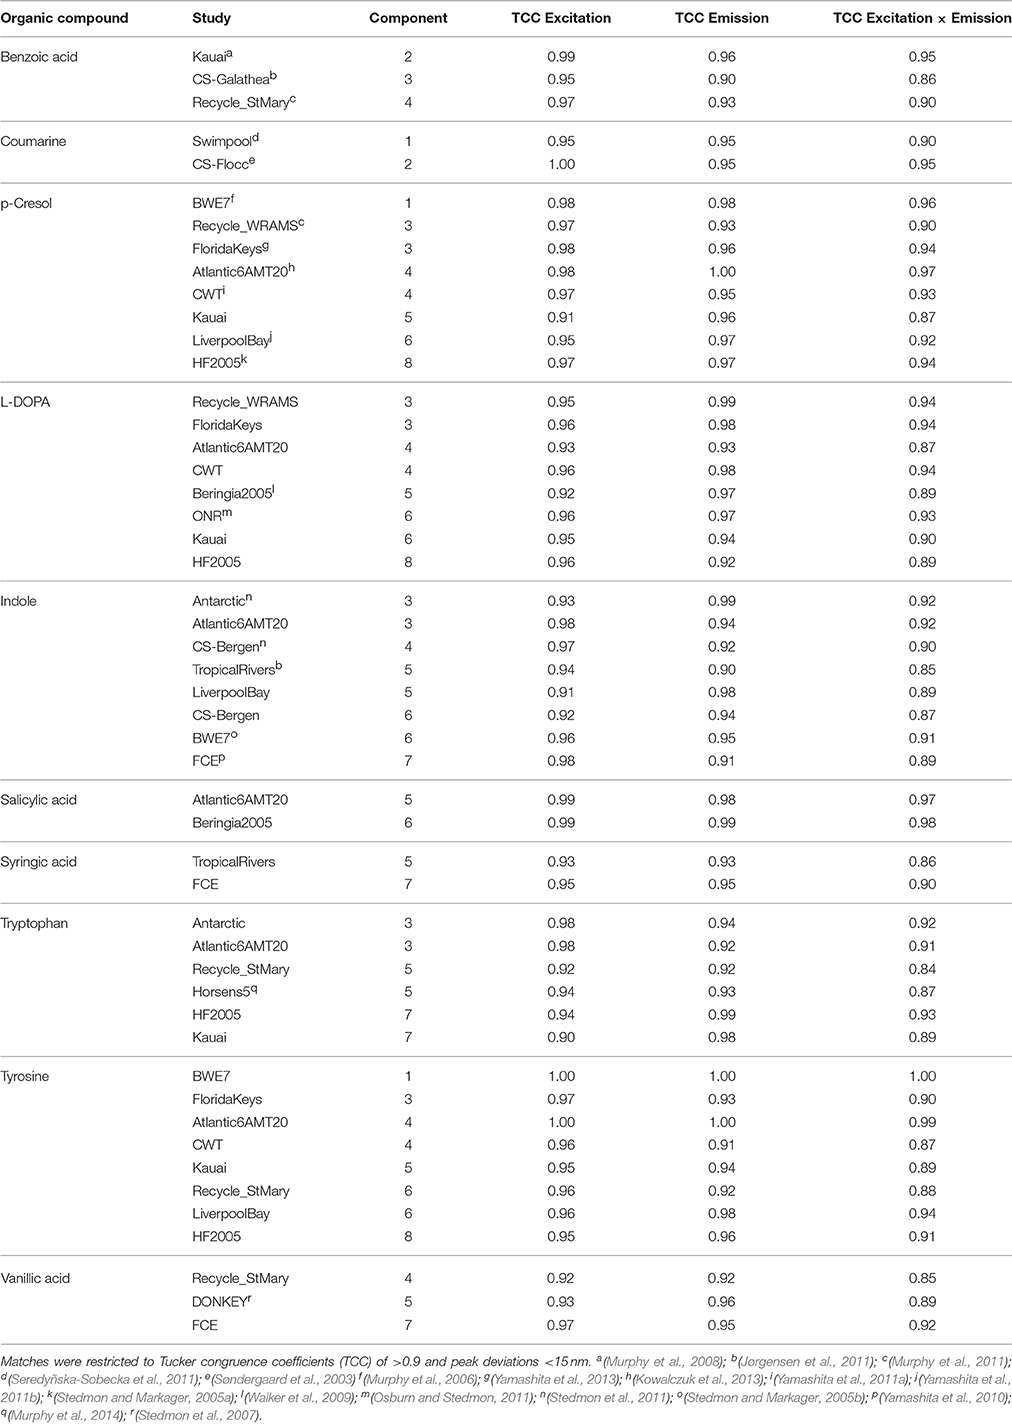
Table 2. Similarities between fluorescence spectra of PARAFAC components in the OpenFluor database and the spectra of organic compounds.
FIGURE 1
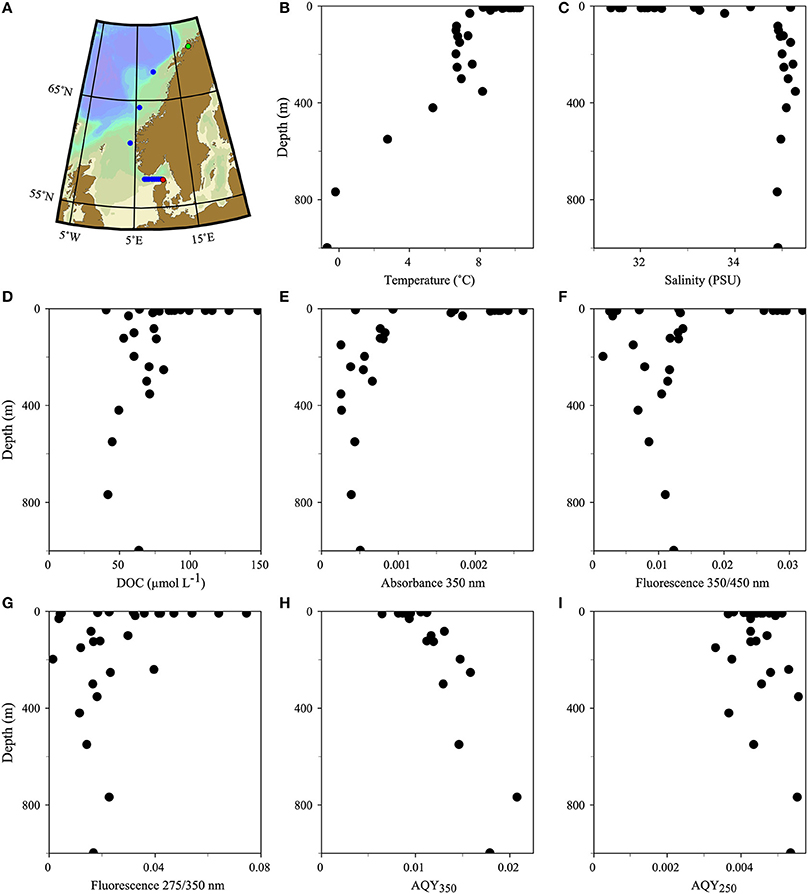
Figure 1. Map (A) and vertical profiles of various biogeochemical parameters (B–I) of the transect along the Norwegian shelf and the Skagerrak. The transect direction was north (starting in Tromsø, green dot) to south (ending in Hirtshals, red dot). A total of 11 stations were sampled. Eight stations in the Skagerrak were sampled for surface waters; three stations along the Norwegian shelf included vertical profiles.
FIGURE 2
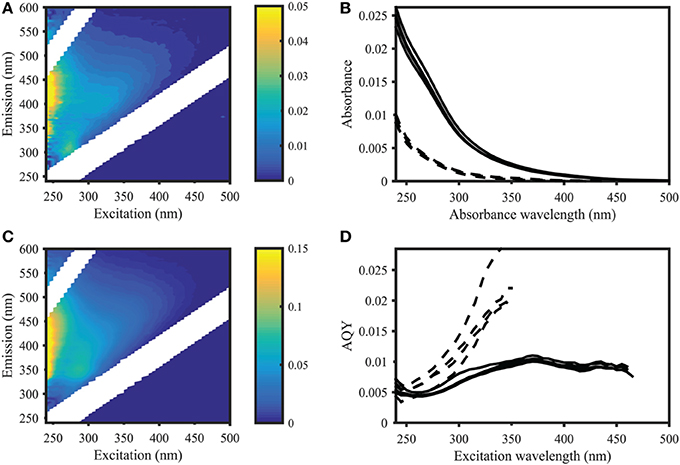
Figure 2. Apparent quantum yield and fluorescence in samples from the Norwegian Sea (Station 2, deep sea) and Skagerrak (Station 14, surface water). Left panel: EEMs of deep (A) and surface (C) samples in Raman units (different scales as indicated by colorbar). Right panel: CDOM absorbance (B) and CDOM apparent fluorescence quantum yields (D) of four deep sea samples (dashed lines) and four surface water samples (solid lines), showing deep sea AQYs consistently higher than in surface waters. AQYs at wavelengths where signal to noise ratios were below 25 are missing values.
FIGURE 3
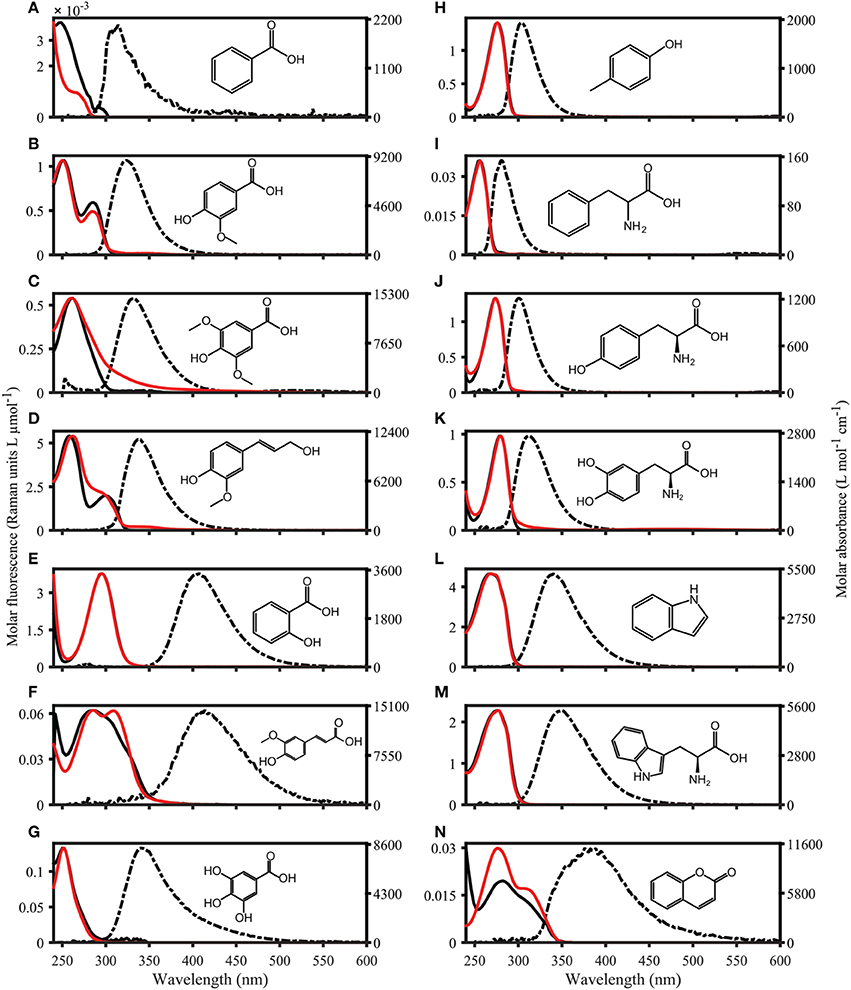
Figure 3. Absorbance and Fluorescence spectra of organic compounds dissolved in water with 1 mmol L−1 PO4 buffer (pH 7.5). The molar absorptivity is shown as a solid red line, excitation loadings are solid black lines, and emission loadings are dashed black lines. (A–G) Benzoic acid, vanillic acid, syringic acid, coniferyl alcohol, salicylic acid, ferulic acid, gallic acid. (H–N) p-Cresol, phenylalanine, tyrosine, dihydroxyphenylalanine, indole, tryptophan, coumarin.
FIGURE 4
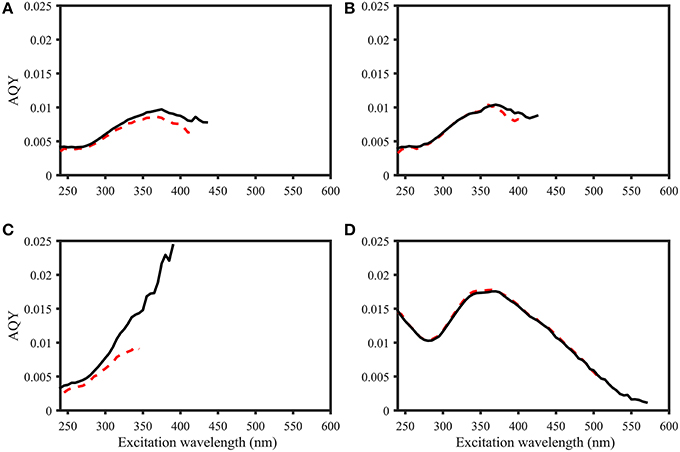
Figure 4. Comparison of AQY calculations for four samples. Black line: Zero-intercept approach. Red dashed line: Variable-intercept approach. (A–C) Norwegian shelf DOM, water depth: 6, 30, and 200 m (A–C, respectively). (D) 2.5 mg L−1 Suwannee River XAD-8 fulvic acid extract. Figures do not include error bars for ease of viewing, but in all cases, AQY values of the two calculation approaches were within the precision estimates.
FIGURE 5
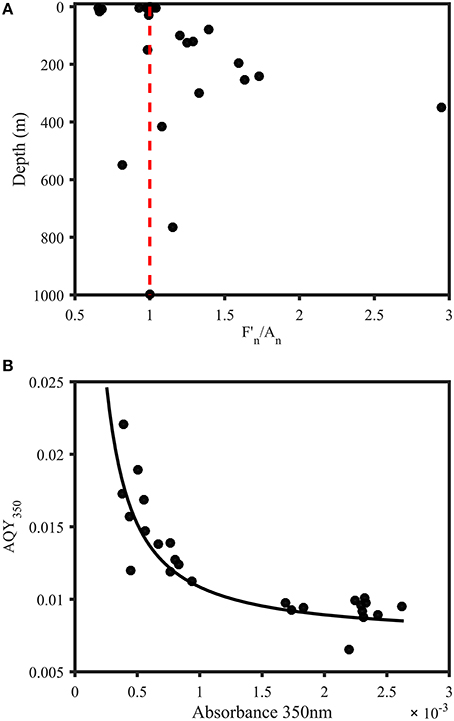
Figure 5. Trends in AQYs of natural samples from the Norwegian shelf and Skagerrak. (A) Depth profile of F350∕450 divided by A350 (both normalized to station maximum) for samples from 11 stations in the Norwegian Sea and Skagerrak (n = 28). Red line indicates a ratio of 1 and represents equal relative contribution of fluorescence and absorbance. Subsurface waters were characterized by a strong fluorescence contribution, with the exception of one sample with abnormally high absorbance (548 m). Surface waters either showed equal FDOM and CDOM levels or dominant CDOM absorbance contribution. (B) AQY vs. absorbance at 350 nm. The black line represents a power fit (a × a350nmb + c, a = 9.821 × 10⁻⁶, b = −1.181, c = 0.0074, R2 = 0.75).
FIGURE 6
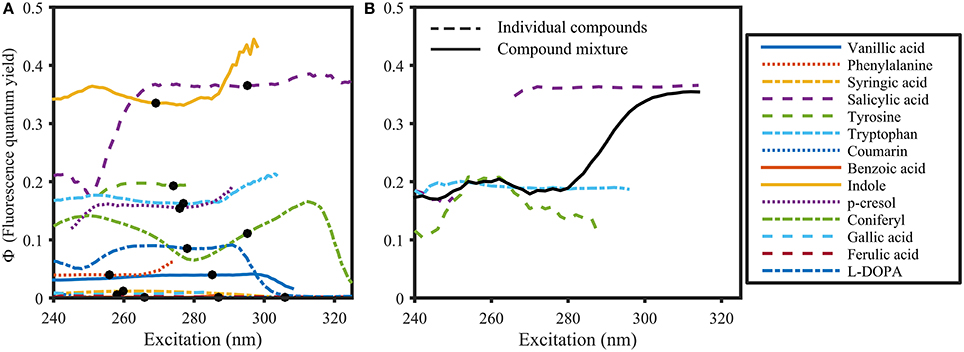
Figure 6. Φ of organic compounds (A) and a compound mixture (B) dissolved in 1 mmol L−1 Phosphate buffer (pH 7.5). The solid black line in (B) represents Φ of the compound mixture. Dots in (A) represent the absorbance maximum of the respective compound. Φ was calculated using the variable-intercept approach (R2 > 0.95 and S/N >50).
FIGURE 7
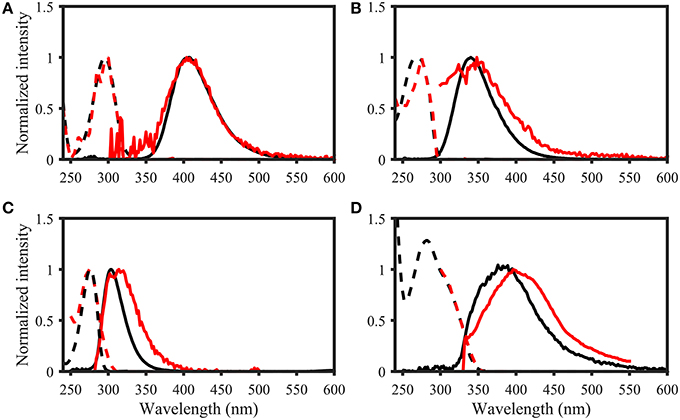
Figure 7. Examples of spectral matching between PARAFAC components in the OpenFluor database with organic compounds. Dashed lines represent excitation loadings, solid lines show emission loadings. Organic compounds are shown in black, PARAFAC components in red. (A) Salicylic acid against component 5 from Kowalczuk et al. (2013), (B) Indole against component 3 from Kowalczuk et al. (2013), (C) p-cresol against component 3 from Murphy et al. (2011), (D) Coumarin against component 2 from Søndergaard et al. (2003).
FIGURE 8
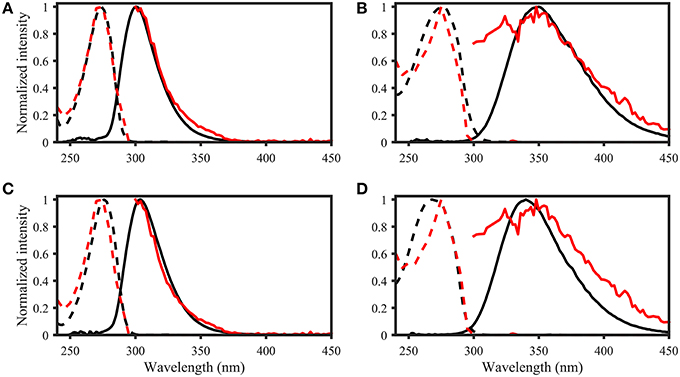
Figure 8. OpenFluor matches of (A) tyrosine, (B) tryptophan, (C) p-cresol, and (D) indole (all in black) with PARAFAC components (all in red) from Kowalczuk et al. (2013). Dashed lines represent excitation loadings, solid lines show emission loadings. Tryptophan and indole, as well as tyrosine and p-cresol yield matches with the same PARAFAC component.
FIGURE 9
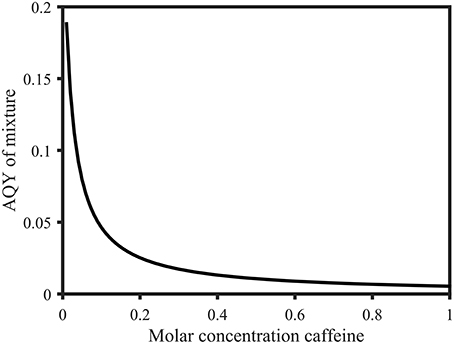
Figure 9. Calculated apparent quantum yields of a mixture of 1 mol L−1 salicylic acid solution with variable molar parts of caffeine (0.01 to 1 mol L−1) at 258 nm. The apparent quantum yield decreases from 0.19 (0.01 mol L−1 caffeine) to 0.0054 (1 mol L−1 caffeine). Calculations were based on Eq. 5 and are explained in the Supplementary Material.
Corrections are listed below in bold and underlined font. For page numbers, section heading, and paragraph numbers please refer to http://dx.doi.org/10.3389/fmars.2015.00098.
Page 1. Abstract
• Range of Φ of organic compounds changed from 0.00079–0.35 to 0.001–0.37
• Range of DOM AQY changed from 0.011 ± 0.003 to 0.012 ± 0.004
• Number of studies that contained matches with this study changed from16 to 21
Page 4. Materials and Methods. (Apparent) Quantum Yield Calculation.
• Paragraph 1: The MATLAB toolbox is now available at https://github.com/urbanwuensch/aquaDOM/releases. The toolbox published with the original article is available as v1.0.0. For the corrigendum, v1.0.1 was used. Further updates will be published on this website if necessary.
• Paragraph 3: The molar fluorescence of the cross-reference salicylic acid was previously underestimated and led to the conclusion that 0.54 is the true reference quantum yield for quinine sulfate. As both 0.51 and 0.54 appear in the literature and 0.51 results in smaller errors during the cross calibration, the reference quantum yield of quinine sulfate was changed from 0.54 to 0.51.
Page 5. Results. Optical Properties of Samples and Organic Compounds. Paragraph 2.
• Molar fluorescence range changed from 0.003–38.50 (indole) to 0.002–5.2 Raman units L μmol−1 (coniferyl alcohol)
• Stokes shift range changed from 0.32–1.38 eV (ferulic acid) to 0.31–1.38 eV (gallic acid)
• Stokes shift range “group 1” changed from 0.32–0.57 eV with emission maxima of 281–339 nm to 0.32–0.49 eV and emission maxima of 281–337 nm
• Stokes shift range group 2 changed from 0.97–1.38 eV with emission maxima of 333–413 nm to 1.01–1.38 eV and emission maxima of 340–414 nm
• Φ of p-cresol and tyrosine changed from 0.11 and 0.13 to 0.16, and 0.19; Stokes shift changed from 0.45 and 0.49 eV to 0.41 and 0.42 eV
• Φ of tryptophan and indole changed from 0.15 and 0.28 to 0.16 and 0.34
Page 7. Results. Method Comparison: Apparent Quantum Yield Calculations.
• AQY accuracy for both approaches changed from 0.1–6% to 0.1–2.5%
• Zero-intercept approach wavelength extent changed from 565 nm to 570 nm
• Precision estimates of variable- and zero-intercept approach changed from ±2.4% and ±1.3% to 2.3% and 1.02%, respectively.
Page 7. Results. Apparent Quantum Yields of CDOM and Φ of Organic Compounds. Paragraph 1.
• Range of AQY350 changed from 0.006–0.021 to 0.007–0.022
Page 7. Results. Apparent Quantum Yields of CDOM and Φ of Organic Compounds. Paragraph 2.
• Average surface water AQY changed from 0.009 to 0.010
• Average deep-sea water AQY changed from 0.014 ± 0.003 to 0.016 ± 0.003
• Average AQY250 changed from 0.004 ± 0.0006 to 0.005 ± 0.0007
Page 7. Results. Apparent Quantum Yields of CDOM and Φ of Organic Compounds. Paragraph 3.
• Recalculation of AQYs eliminated the outlier at 197 m
• Table 1: Molar absorbance and fluorescence is reported for all mentioned peaks in the corrected version of the paper. Most values reported in the original version of the document have changed slightly. The correct values are reported in Table 1.
Page 7–8. Results. Apparent Quantum Yields of CDOM and Φ of Organic Compounds. Paragraph 4.
• Range of Φ for organic compounds changed from 0.00079–0.35 to 0.001–0.37
• Wavelength dependence of Φ for salicylic acid changed from 0.35 at 295 nm and 0.15 at 250 nm to 0.37 at 295 nm and 0.18 at 250 nm.
• Distinct minima of coniferyl alcohol changed from 300 nm: 0.06, 250 nm: 0.11, 315 nm: 0.16 to 280 nm: 0.07, 250 nm: 0.14, 312 nm: 0.17
• Figure 4: water depth changed from 30, 10, and 200 m (A–C, respectively) to 6 m, 30 m and 200 m (A-C, respectively).
Page 8. Results. Spectral Matching of Organic Compounds with PARAFAC Spectra
• List of potential matches for organic compounds changed from p-cresol, tryptophan, indole, L-dihydroxyphenylalanine, tyrosine, coumarin, salicylic acid, ferulic acid, and benzoic acid to indole, p-cresol, L-diphenylalanine, tyrosine, tryptophan, vanillic acid, benzoic acid, syringic acid, and salicylic acid
• Similarity of spectra changed from p-cresol and tryptophan, as well as indole and tyrosine to p-cresol and tyrosine, as well as indole and tryptophan
Page 8–9. Discussion. DOM Apparent Fluorescence Quantum Yields. Paragraph 1.
• Maximum Φ of organic compounds changed from 0.35 to 0.37
• AQY of equimolar mixture of caffeine and salicylic acid changed from 0.0046 to 0.0054
• Range of AQY of 1 mol L−1 salicylic acid and 0.01 to 1 mol L−1 caffeine changed from 0.15–0.0046 to 0.19–0.0054
• AQY of mixture for mixture of caffeine and salicylic acid above 310 nm changed from 0.35 to 0.37
Page 9. Discussion. DOM Apparent Fluorescence Quantum Yields. Paragraph 2.
• Average AQY at 350 nm changed from 0.011 ± 0.003 to 0.012 ± 0.004
• Figure 5A legend: Recalculation eliminated outlier at 197 m
Page 10–11. Discussion. Method Comparison: Quantum Yield Calculations. Paragraph 4.
• %-difference between reference study and this study for optical properties of salicylic acid changed from 1.3, 2.9, and 0.4 (molar absorbance, Φ, and Stokes shift, respectively) to 1.3, 2.7, and 0.3 (molar absorbance, Φ, and Stokes shift, respectively).
• Φ of phenylalanine changed from 0.018 to 0.039. This matches previously published values (Feitelson, 1964). Therefore, the last three sentences of paragraph 4 are redundant.
• Table 2: The erroneous spectral correction factors resulted in slightly inaccurate peak shapes for many organic compounds. This affected similarity scores between organic compounds such that some previously-matched PARAFAC components were excluded, while new hits were added to the table.
Page 13. Discussion. Linking Optical and Chemical Properties. Paragraph 1.
• Range of molar fluorescence and absorbance of a 1 nmol L−1 equivalient changed from 35 × 10−5–0.0036 m−1, and 25 × 10−5–0.038 Raman units to 3.5 × 10⁻⁵ to 0.0036 m−1 for absorbance, and 2.1 × 10⁻⁶ to 0.0052 Raman units
• Figure 9 legend: AQY decrease changed from 0.15–0.0046 changed to 0.19–0.0054
Author Contributions
All authors (UW, KM, and CS) contributed substantially to the text of the submitted corrigendum. UW performed the data analysis and correction, CS and KM assisted during the correction process.
Funding
This work is supported by Technical University of Denmark and Chalmers Technical University Nordic5Tech collaboration. CS would like to acknowledge the Danish Research Council for Independent Research (DFF 1323- 00336), and KM acknowledges funding by the Swedish Research Council for Environment, Agricultural Sciences and Spatial Planning (FORMAS grant 2013–1214).
Conflict of Interest Statement
The authors declare that the research was conducted in the absence of any commercial or financial relationships that could be construed as a potential conflict of interest.
The Guest Associate Editor CO declares that, despite co-authoring a paper with author CAS, the review process was handled objectively and no conflict of interest exists.
References
Feitelson, J. (1964). On the mechanism of fluorescence quenching. Tyrosine and similar compounds. J. Phys. Chem. 68, 391–397. doi: 10.1021/j100784a033
Jørgensen, L., Stedmon, C. A., Kragh, T., Markager, S., Middelboe, M., and Søndergaard, M. (2011). Global trends in the fluorescence characteristics and distribution of marine dissolved organic matter. Mar. Chem. 126, 139–148. doi: 10.1016/j.marchem.2011.05.002
Kowalczuk, P., Tilstone, G. H., Zabłocka, M., Röttgers, R., and Thomas, R. (2013). Composition of dissolved organic matter along an Atlantic Meridional Transect from fluorescence spectroscopy and Parallel Factor Analysis. Mar. Chem. 157, 170–184. doi: 10.1016/j.marchem.2013.10.004
Murphy, K. R., Bro, R., and Stedmon, C. A. (2014). “Chemometric analysis of organic matter fluorescence,” in Aquatic Organic Matter Fluorescence, eds P. Coble, A. Baker, J. Lead, D. Reynolds, and R. Spencer (New York, NY: Cambridge University Press), 339–375.
Murphy, K. R., Hambly, A., Singh, S., Henderson, R. K., Baker, A., Stuetz, R., et al. (2011). Organic matter fluorescence in municipal water recycling schemes: Toward a unified PARAFAC model. Environ. Sci. Technol. 45, 2909–2916. doi: 10.1021/es103015e
Murphy, K. R., Ruiz, G. M., Dunsmuir, W. T. M., and Waite, T. D. (2006). Optimized parameters for fluorescence-based verification of ballast water exchange by ships. Environ. Sci. Technol. 40, 2357–2362. doi: 10.1021/es0519381
Murphy, K. R., Stedmon, C. A., Waite, T. D., and Ruiz, G. M. (2008). Distinguishing between terrestrial and autochthonous organic matter sources in marine environments using fluorescence spectroscopy. Mar. Chem. 108, 40–58. doi: 10.1016/j.marchem.2007.10.003
Osburn, C. L., and Stedmon, C. A. (2011). Linking the chemical and optical properties of dissolved organic matter in the Baltic-North Sea transition zone to differentiate three allochthonous inputs. Mar. Chem. 126, 281–294. doi: 10.1016/j.marchem.2011.06.007
Seredyñska-Sobecka, B., Stedmon, C. A., Boe-Hansen, R., Waul, C. K., and Arvin, E. (2011). Monitoring organic loading to swimming pools by fluorescence excitation-emission matrix with parallel factor analysis (PARAFAC). Water Res. 45, 2306–2314. doi: 10.1016/j.watres.2011.01.010
Søndergaard, M., Stedmon, C. A., and Borch, N. H. (2003). Fate of terrigenous dissolved organic matter (DOM) in estuaries: aggregation and bioavailability. Ophelia 57, 161–176. doi: 10.1080/00785236.2003.10409512
Stedmon, C. A., and Markager, S. (2005a). Resolving the variability of dissolved organic matter fluorescence in a temperate estuary and its catchment using PARAFAC analysis. Limnol. Oceanogr. 50, 686–697. doi: 10.4319/lo.2005.50.2.0686
Stedmon, C. A., and Markager, S. (2005b). Tracing the production and degradation of autochthonous fractions of dissolved organic matter using fluorescence analysis. Limnol. Oceanogr. 50, 1415–1426. doi: 10.4319/lo.2005.50.5.1415
Stedmon, C. A., Markager, S., Tranvik, L., Kronberg, L., Slätis, T., and Martinsen, W. (2007). Photochemical production of ammonium and transformation of dissolved organic matter in the Baltic Sea. Mar. Chem. 104, 227–240. doi: 10.1016/j.marchem.2006.11.005
Stedmon, C. A., Thomas, D. N., Papadimitriou, S., Granskog, M. A., and Dieckmann, G. S. (2011). Using fluorescence to characterize dissolved organic matter in Antarctic sea ice brines. J. Geophys. Res. Biogeosci. 116, 1–9. doi: 10.1029/2011JG001716
Walker, S. A., Amon, R. M. W., Stedmon, C. A., Duan, S., and Louchouarn, P. (2009). The use of PARAFAC modeling to trace terrestrial dissolved organic matter and fingerprint water masses in coastal Canadian Arctic surface waters. J. Geophys. Res. Biogeosci. 114, 1–12. doi: 10.1029/2009JG000990
Yamashita, Y., Boyer, J. N., and Jaffé, R. (2013). Evaluating the distribution of terrestrial dissolved organic matter in a complex coastal ecosystem using fluorescence spectroscopy. Cont. Shelf Res. 66, 136–144. doi: 10.1016/j.csr.2013.06.010
Yamashita, Y., Kloeppel, B. D., Knoepp, J., Zausen, G. L., and Jaffé, R. (2011a). Effects of Watershed History on Dissolved Organic Matter Characteristics in Headwater Streams. Ecosystems 14, 1110–1122. doi: 10.1007/s10021-011-9469-z
Yamashita, Y., Panton, A., Mahaffey, C., and Jaffé, R. (2011b). Assessing the spatial and temporal variability of dissolved organic matter in Liverpool Bay using excitation-emission matrix fluorescence and parallel factor analysis. Ocean Dyn. 61, 569–579. doi: 10.1007/s10236-010-0365-4
Keywords: aquaDOM, OpenFluor, PARAFAC, spectral matching, EEM, FDOM, CDOM
Citation: Wünsch UJ, Murphy KR and Stedmon CA (2016) Corrigendum: Fluorescence Quantum Yields of Natural Organic Matter and Organic Compounds: Implications for the Fluorescence-based Interpretation of Organic Matter Composition. Front. Mar. Sci. 3:9. doi: 10.3389/fmars.2016.00009
Received: 13 January 2016; Accepted: 22 January 2016;
Published: 10 February 2016.
Edited and reviewed by: Christopher Osburn, North Carolina State University, USA
Copyright © 2016 Wünsch, Murphy and Stedmon. This is an open-access article distributed under the terms of the Creative Commons Attribution License (CC BY). The use, distribution or reproduction in other forums is permitted, provided the original author(s) or licensor are credited and that the original publication in this journal is cited, in accordance with accepted academic practice. No use, distribution or reproduction is permitted which does not comply with these terms.
*Correspondence: Urban J. Wünsch, urbw@aqua.dtu.dk