- 1Institute for Marine and Antarctic Studies, University of Tasmania, Hobart, TAS, Australia
- 2Antarctic Climate and Ecosystems Cooperative Research Centre, University of Tasmania, Hobart, TAS, Australia
The biological pump makes a major global contribution to the sequestration of carbon-rich particles in the oceans' interior. This pump has many component parts from physics to ecology that together control its efficiency in exporting particles. Hence, the influence of climate change on the functioning and magnitude of the pump is likely to be complex and non-linear. Here, I employ a published 1-D coupled surface-subsurface Particulate Organic Carbon (POC) export flux model to systematically explore the potential influence of changing oceanic conditions on each of the pump's “moving parts,” in both surface and subsurface waters. These simulations were run for typical high (High Nutrient Low Chlorophyll, HNLC) and low (Low Nutrient Low Chlorophyll, LNLC) latitude sites. Next, I couple pump components that have common drivers, such as temperature, to investigate more complex scenarios involving concurrent climate-change mediated alteration of multiple “moving parts” of the pump. Model simulations reveal that in the surface ocean, changes to algal community structure (i.e., a shift toward small cells) has the greatest individual influence (decreased flux) on downward POC flux in the coming decades. In subsurface waters, a shift in zooplankton community structure has the greatest single effect on POC flux (decreased) in a future ocean. More complex treatments, in which up to 10 individual factors (across both surface and subsurface processes) were concurrently altered, ~ halved the POC flux at both high and low latitudes. In general climate-mediated changes to surface ocean processes had a greater effect on the magnitude of POC flux than alteration of subsurface processes, some of which negated one another. This relatively simple 1-D model provides initial insights into the most influential processes that may alter the future performance of this pump, and more importantly reveals many knowledge gaps that require urgent attention before we can accurately quantify future changes to the biological pump.
Introduction
Two ocean pumps play key roles in removing carbon from the surface ocean—the solubility pump is physico-chemically mediated whereas the biological pump is driven primarily by the interactions of marine biota from microbes to metazoa (Volk and Hoffert, 1985). In brief, in the euphotic zone (Ez) photosynthetic carbon fixation by autotrophs, and heterotrophic bacterial production, inputs POC (and dissolved organic carbon which is not considered in the present study) to the biological pump. This POC supply to the upper ocean is subsequently modified and attenuated by a wide range of grazing activities which transform most of the phytoplankton and bacterial carbon into heterogeneous particles which eventually settle out of the surface ocean after a residence time of days to weeks (Boyd and Stevens, 2002). Further transformations of these settling particles, by heterotrophic bacteria and grazers, further diminish this POC flux in subsurface waters (Steinberg et al., 2008). Despite, many processes attenuating this sinking particle flux, a small but significant (a few percent of the surface signature) proportion of this carbon supply will be sequestered into the deep ocean (Boyd and Trull, 2007).
Modeling studies have projected that an ocean without a biological pump would result in atmospheric CO2 levels ~400 pmm higher than present day (Ito and Follows, 2005) and changes in the efficiency of the biological pump (driven by enhanced iron supply) are thought to explain up to a third of the ~80 ppm decreases in atmospheric CO2 during the glacial terminations (Sigman and Boyle, 2000). More recent modeling studies investigating the implications of future changes to characteristics of the biological pump, such as particle remineralization length scales (Kwon et al., 2009) or Particulate Inorganic Carbon (PIC) (Roth et al., 2014), point to its potential influence as a significant feedback on a changing climate. For example—a 30 ppm change in atmospheric CO2 is projected to result from climate-change mediated modification to particle remineralization length scales in the upper ocean (Kwon et al., 2009). Hence an increasing number of studies have focused on individual processes that will influence how the sign and magnitude of the pump is likely to change in a future ocean (Boyd and Trull, 2007; Riebesell et al., 2009; Passow and Carlson, 2012).
Investigations into the nature and performance of the future biological pump have ranged from modeling (Bopp et al., 2001, 2013; Taucher and Oschlies, 2011) to lab culture (Taucher et al., 2015) and field based mesocosm enclosures (Riebesell et al., 2007). Studies such as Bopp et al. (2013) have used global climate change biogeochemical models to capture the combined effects of climate-change mediated alteration of ocean circulation, properties such as temperature, pH and nutrient supply, and Net Primary Production (NPP) on the downward flux of POC. Other investigations, for example lab- and field-based experiments have targeted how aspects of climate-change (warming/ocean acidification, OA) will modify particular processes that influence the biological pump such as TEP (Transparent Exopolymer Particle) production (Taucher et al., 2015) or diurnal vertical migration (Berge et al., 2014). Pörtner et al. (2014) in the Working Group 2 Fifth Assessment Report of the Intergovernmental Panel on Climate Change attempted to synthesize the findings of the growing number of studies into the sensitivity of the component parts of the biological pump to climate change. They concluded that due to the many “moving parts” it was not possible state with confidence how the sign or magnitude of the pump would alter in the coming decades. Instead they put forward a first assessment of the integrated knowledge platform (see Table 6.1, Pörtner et al., 2014) required to project how the biological pump will function in a future ocean.
Passow and Carlson (2012) published a review of the status of our understanding of the biological pump—as a prerequisite to predicting how it will be altered under changing oceanic conditions. They used the study of Lomas et al. (2010) at BATS (Bermuda Atlantic Time Series) to illustrate the dangers of extrapolating results solely from investigations into the individual components of the pump. The Lomas et al. (2010) analysis demonstrates a zero sum outcome, over a decade at BATS, between alteration of upper ocean processes (NPP and downward POC export) vs. those in subsurface waters (mesopelagical attenuation of export flux). Thus, a holistic approach to assessing how the biological pump will be environmentally altered, in both the surface and the subsurface ocean, is essential if we are to begin to quantify how the functioning and magnitude of the pump will be transformed in the coming decades.
The present study has dual aims: to assess our current ability to quantify the response of the biological pump to complex and concurrent changes to oceanic conditions, and to refine the integrated knowledge platform needed to assess the performance of a future pump, presented by Pörtner et al. (2014). In this study, I employ a previously published 1-D coupled surface-subsurface biological model (Buesseler and Boyd, 2009) to explore the sensitivity of the downward POC flux to projected changes in a wide range of individual surface and subsurface processes. These range from physical (altered seawater viscosity) to ecological (differential vulnerability of organisms across trophic levels to changing oceanic conditions) processes. In addition to exploring the future role of the individual components of the biological pump, I also attempt to link the components that are controlled primarily by specific aspects of a changing climate, such as warming or OA, to explore the cumulative effects of these processes on downward POC export flux in a future ocean.
Methods
Rationale for the Employment of a 1-D Model
A wide range of models have been used to explore the functioning of the biological pump from conceptual (Michaels and Silver, 1988), to biological (i.e., Phytoplankton, Zooplankton, Detritus, Nutrient (PZDN), Taucher and Oschlies, 2011) to coupled ocean-atmosphere (Bopp et al., 2001; Kwon et al., 2009). Each different modeling approach has pros and cons (see later). Here, I selected a 1-D coupled surface-subsurface model that has previously been used to assess the relative roles of surface ocean processes [i.e., within the Euphotic zone (Ez)] vs. those in the subsurface mesopelagic (base of the Ez to ~300 m below this depth) across a wide range of oceanic provinces from tropical to polar (Buesseler and Boyd, 2009). Furthermore the model outputs from Buesseler and Boyd (2009), when compared with internally-consistent downward POC flux datasets (i.e., all based on the same techniques and measured by a sole laboratory) for each province, were successfully validated across the global ocean. My choice of this 1-D approach was based on its utility to explore the potential role of each of the many individual components of the biological pump.
The Coupled Surface-subsurface Model
There are benefits and drawbacks to using a 1-D approach. In this case the versatility of the model to represent, either directly or indirectly, each of more than 10 individual components of the biological pump (each shown to be sensitive to changing oceanic conditions) outweighs its inability to explore the “2D” space vs. time seasonality (sensu Lampitt and Antia, 1997), or the “3D animation” of the biological pump by ocean circulation (Kwon et al., 2009; Bopp et al., 2013).
The model structure is summarized in Figure 1 which presents the flow pathways through the foodweb. The input to the model is a prescribed rate of Ez-integrated NPP (mg C m−2 d−1), partitioned across different phytoplankton size categories, derived from published values for a particular region or season (e.g., Boyd et al., 2008). A further source of POC that is inputted into the model is Ez-integrated heterotrophic bacterial production (BP). The NPP and BP then flow through a pelagic foodweb typical of the surface ocean (Figure 1). The flows of POC follow size-based rules based on grazing constraints (such as maximum or minimum prey size), and are detailed in Buesseler and Boyd (2009). In addition to cell size, other phytoplankton traits (see Litchman and Klausmeier, 2008) that influence particle export include cell shape and coloniality. Both these traits are included implicitly in the direct sinking of a proportion of large phytoplankton (Jackson, 1990). Table 1 summarizes the trophic transfer efficiencies that are applied to Figure 2 to illustrate the attenuation of POC within the Ez and the subsequent POC flux to depth. As the NPP, within a phytoplankton size class, is consumed by grazers, the POC is attenuated based on published transfer efficiencies—for example 30% of the NPP grazed by ciliates is transferred to the next trophic level in the foodweb (Figure 2). All transfer efficiencies were derived from lab-based feeding experiments, the findings of which were synthesized by Straile (1997).
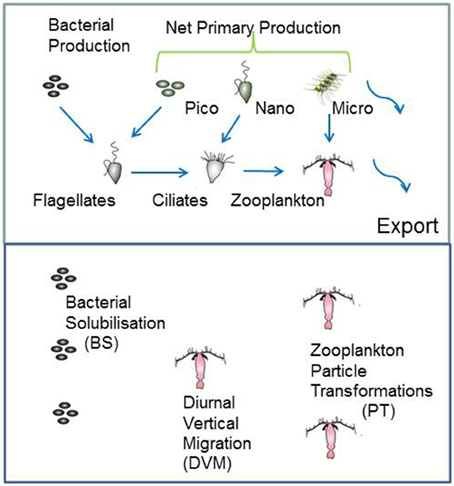
Figure 1. Schematic of the coupled surface-subsurface model. The upper panel represents the euphotic zone (Ez) and the input of column-integrated net primary (NPP) and heterotrophic bacterial production (BP) to fuel downward POC export flux. NPP is partitioned between pico-, nano-, and micro-phytoplankton. Blue arrows show the grazing pathways the BP and NPP are routed through. Curved arrows denote the two pathways for POC to be exported from the Ez, direct sinking of a proportion of micro-phytoplankton NPP, and of mesozooplankton fecal pellets. For simplicity, pathways, such as bacterivory by ciliates (see Bernard and Rassoulzadegan, 1990) are not included. The lower panel denotes subsurface waters from the base of the Ez to 500 m depth, where attached microbes continuously solubilise POC, vertical migrators daily shunt POC to depth, and mesozooplankton transform particles via grazing.
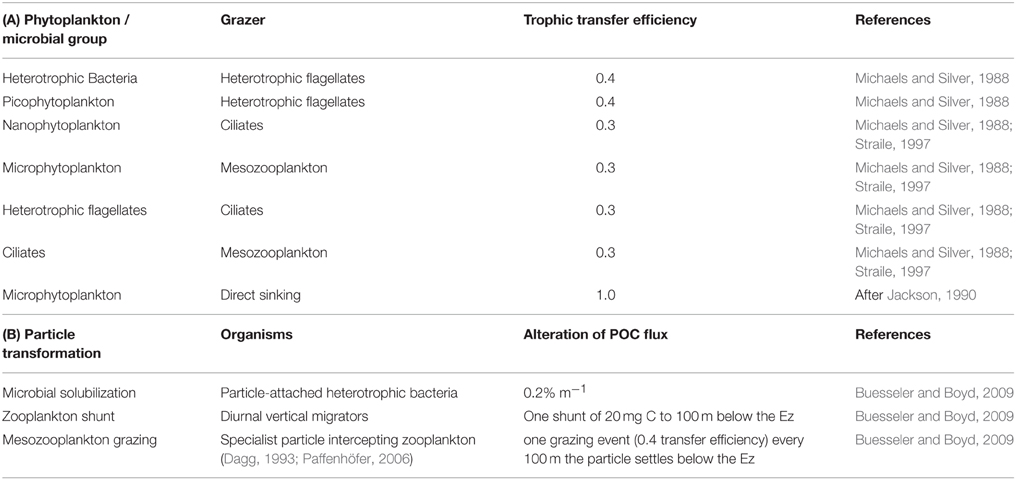
Table 1. (A) Trophic transfer efficiencies through the pelagic foodweb in the surface ocean as represented by the upper panel in Figures 1, 2, and used in the control run. (B) Particle transformations in the subsurface ocean used in the control run and presented in Figure 2.
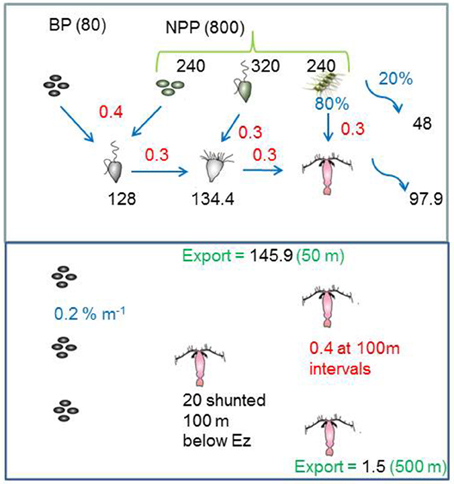
Figure 2. The model standard run for the high latitude ocean case, that illustrates how the inputted POC in the Ez is transformed by trophic transfers (using published data from Table 1). In the subsurface ocean the export flux is further attenuated by continuous (microbes) and discrete (zooplankton) transformations, and supplemented by a shunt of POC to one discrete depth from vertical migrators. Black text denotes fluxes (mg C m−2 d−1), red are trophic transfer efficiencies (proportion of 1), and blue represents (%) such as the partitioning of micro-phytoplankton NPP between grazing and direct sinking.
Published observations dictate that there are two major pathways for NPP to exit the surface mixed layer as sinking particles—as directly sinking aggregates of large phytoplankton (Jackson, 1990) and mesozooplankton fecal pellets (Lampitt et al., 1993). In the model, this simplification of the many pathways for particles to exit the surface ocean means that other vectors for particle export, such as marine snow as a carrier of small cells (Richardson and Jackson, 2007; Passow and Carlson, 2012), are not included. Moreover, only downward POC export, and not DOC vertical export (which is often seasonally-driven, Carlson et al., 2010) is considered in this model. Note, that as the model currency is POC, it cannot take climate-change mediated changes in downward PIC flux into consideration (Armstrong et al., 2001; Hofmann and Schellnhuber, 2009).
The POC exported out of the surface mixed layer is then inputted into the subsurface mesopelagic water column where it is further attenuated by three processes (Figures 1, 2). These activities either act continuously (POC solubilization by microbes attached to sinking particles, Hoppe et al., 1993; Arístegui et al., 2005), or discretely (POC transformations by mesozooplankton grazing and residing within this stratum, Dagg, 1993) as reported by Steinberg et al. (2008). A further pathway for sinking POC in the subsurface ocean is via zooplankton diurnal vertical migration (DVM, Hays, 1996), which is represented in the model as a discrete vertical shunt of POC to depth without either microbial solubilization or zooplankton particle interception and transformation. Details of the attenuation of POC flux with depth by each of these subsurface activities are summarized in Figure 2, Table 1B.
High vs. Low Latitude Biological Pumps
Many other modeling studies compare and contrast how climate change will alter rates such as NPP or downward POC flux in high vs. low latitude oceanic regions (e.g., Bopp et al., 2001, 2013). In the present study I have also attempted such a comparison, and have used published datasets on NPP, depth of the Ez, and on the foodweb structures that characterize the low (LNLC) vs. high (HNLC) latitude oceans (Table 2) in the model standard runs. The high latitude standard run is presented in Figure 2. These runs are then compared with additional simulations that highlight the relative influence of each of the individual components of the biological pump in high vs. low latitude waters.

Table 2. Details of the standard runs for the representative cases for the high (HNLC subpolar waters, Boyd and Harrison, 1999; Boyd et al., 2008) vs. low (LNLC subtropical waters, Karl et al., 2008; Boyd et al., 2008) latitude ocean.
Projected Future Changes to the Oceans Biological Pump
A wide range of studies, from lab experiments (Taucher et al., 2015), mesocosm enclosures (Isla et al., 2008), synthesis of observations (Rose and Caron, 2007) to modeling experiments (Bopp et al., 2013) provide insights into how the multi-faceted components of the biological pump are projected to be altered in the coming decades. A synthesis of the individual components reported to both influence the performance of the biological pump, and which are sensitive to changing ocean conditions, is presented in Table 3. They include those cataloged by Pörtner et al. (2014) along with additional factors—such as seawater viscosity and its influence on particle sinking rates (Taucher et al., 2014) and the joint influence of warming/acidification on bacterial solubilization of particles (Piontek et al., 2015)—from recent research. Table 3 lists the putative controlling environmental factor, such as warming, on each individual component that influences the biological pump, and the reported modification (where available) of each individual factor by changing ocean conditions for both surface and subsurface waters.
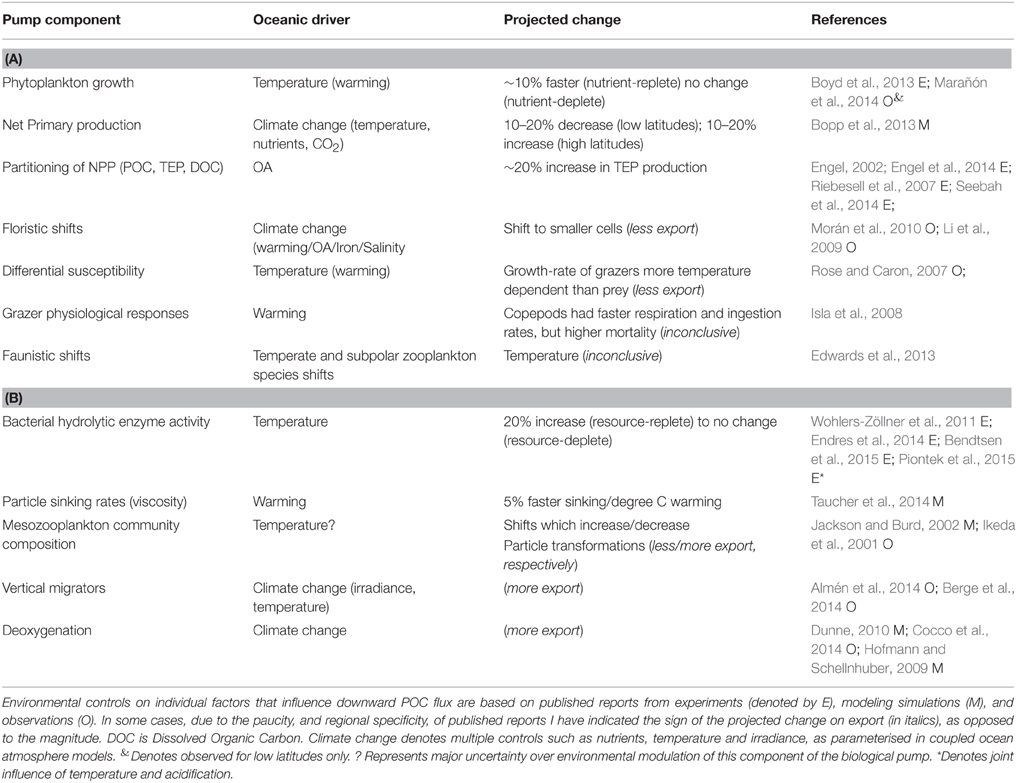
Table 3. Summary of projected climate-change mediated alteration of components of the biological pump for (A) surface and (B) subsurface waters.
Representation of Climate Change Effects on the Biological Pump in the 1D model
The synthesis of climate change effects on component of the biological pump in Table 3 is used to constrain the changes to individual components of the model to represent the biological pump in a future ocean (Figure 3). In some cases, such as future projections of NPP (Bopp et al., 2013) it was relatively straightforward to alter the 1-D model run (i.e., 10% more NPP at high latitudes, 10% less NPP at low latitudes) to reflect the future projected changes. For other pump components, such as changes to bacterial enzyme activity, I employed an intermediate value of a 10% increase (see Table 3). In other cases, such as climate-change mediated shifts in phytoplankton community structure, there are many different regional examples, driven by wide-ranging aspects of changing ocean conditions, such as warming, freshening, wind speed, nutrient supply, or OA (Table 4). Each of these floristic shifts can have different potential effects on the sign and magnitude of change to the biological pump, such that I have only considered illustrative examples in the model runs.
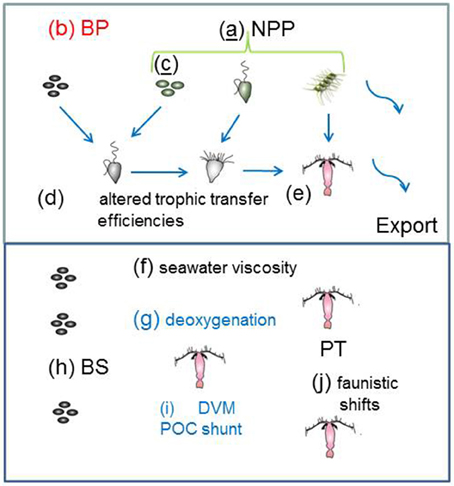
Figure 3. Catalog of the climate-change model runs for the individual processes that influence the biological pump in both the surface and subsurface ocean. The schematic is as for Figure 1 with the exception of the letters (a) to (j) which denote changes to: (a) NPP; (b) BP; (c) phytoplankton community structure; (d) and (e) efficiency of trophic transfer of POC In the subsurface ocean (f) to (j) represent alteration of: (f) seawater viscosity; (g) deoxygenation; (h) microbial solubilization; (i) vertical migration; and (j) mesozooplankton trophic transfer efficiency. Colored letters denote processes mediated by: temperature (black); OA (red); “climate change”(blue); and those underlined have more than one form of mediation—e.g., model run (c) is influenced by temperature, CO2, salinity and/or iron supply (see Table 4).

Table 4. Illustrative examples of the wide range of effects on the biological pump due to floristic shifts (see also Review by Boyd et al., 2010).
For other components of the pump, where the sign of the change is known, but not the magnitude—such as for the differential sensitivity of grazers vs. phytoplankton to warming, I applied arbitrary changes to the model in an attempt to represent these changes. For example, in the case of reports of the growth rate of microzooplankton responding more to warming than that of their prey (small phytoplankton) (Rose and Caron, 2007), the trophic transfer efficiency has been decreased to mimic a shift in the relationship between increased grazing pressure relative to phytoplankton growth rate (which is a complex coupling, see Apple et al., 2011) in this climate change scenario. In other studies, such as for mesozooplankton under warming scenarios (Isla et al., 2008), a wide range of responses—increased fecal pellet and egg production rates have to be reconciled against elevated mortality rates and reduced net growth efficiency (Table 3A). The cumulative outcome of such responses to a changing climate was problematic to represent simply in the model runs.
Table 5 summarizes how each of the individual components are represented in the model runs, which are each largely based on the trends from the literature collated in Table 3. In cases where the changes to the biological pump are not well constrained by published studies, or where I have employed an indirect representation of an individual process, I have used rudimentary sensitivity analysis to explore the effect of such uncertainties. Furthermore, in the concluding section of the Results, I have attempted to link the individual components that influence the performance of the biological pump to explore their cumulative effect on the pump in a future ocean. This linkage has focussed upon using comparable climate-change mediated forcing—such as warming or acidification—to move toward a joint outcome due to specific environmental forcing (see later). It has been problematic to cross-link the potential interactive effects of forcing by multiple environmental properties, the limits on which are presented in the Discussion.
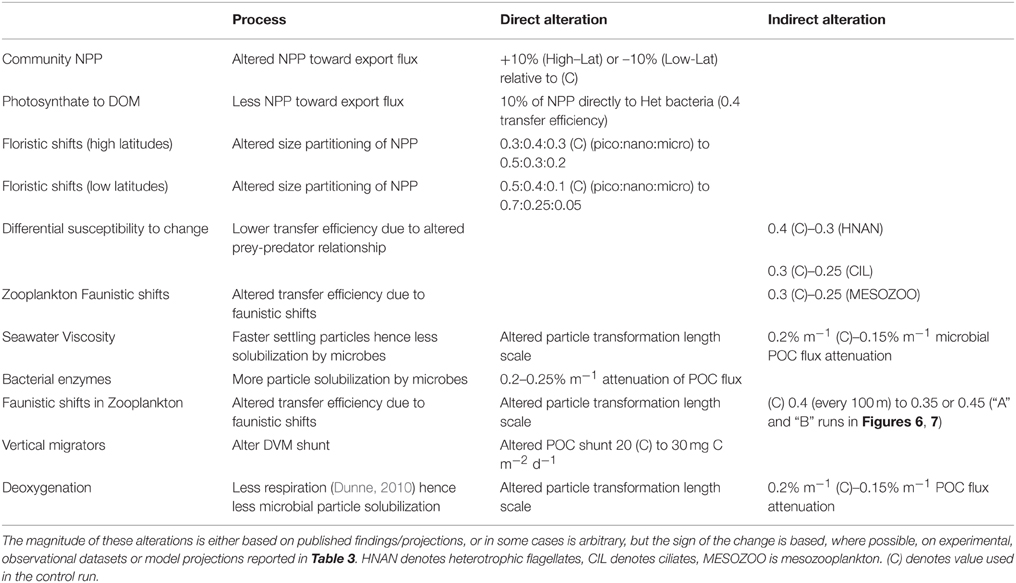
Table 5. Description of the model runs that each represent alteration, either directly or indirectly, of individual processes that influence the performance of the biological pump.
Results
Influence of Alteration of Individual Factors Controlling Downward POC Flux
Simulations from the 1-D model are presented as vertical plots of downward POC flux vs. depth (presented for the base of the Ez, 150, 300, and 500 m), expressed as a systematic alteration of each of the climate-change mediated factors influencing POC export (Tables 3, 5), relative to the control, for the Ez (e.g., Figure 4A) and the subsurface Twilight Zone (e.g., Figure 4B). For the high latitude simulations, the export flux from the base of the 50 m deep Ez ranged from 109 mg C m−2 d−1 (shift to small phytoplankton cells) to ~160 mg C m−2 d−1 (higher NPP) relative to the control run (146 mg C m−2 d−1, Figure 4A). As expected, the other runs (more photosynthate from NPP to BP; reduced energy transfer during grazing transformations) each resulted in 5–10% decreases in export flux at the base of the Ez. The amplitude of POC flux, across the range of model runs, was greatest at 50 m depth (base of the Ez in high latitude waters), and the span of these simulated POC fluxes declined with depth as the subsurface processes (each based on the standard run, Figure 2) further modified the sinking particles in the model (Figure 4A).
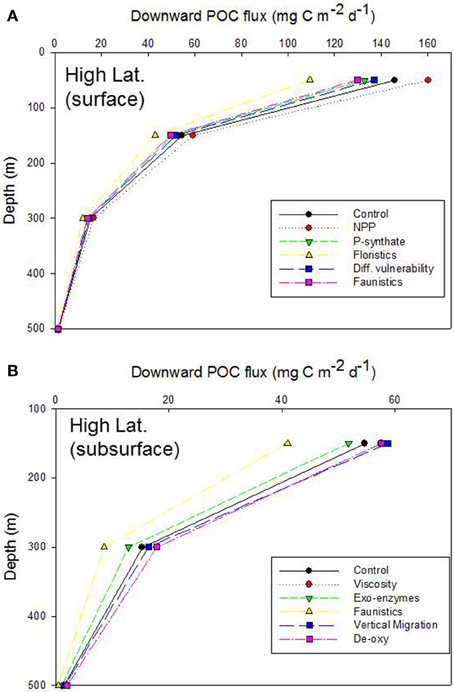
Figure 4. Vertical profile of projected downward POC flux for the control run, high latitude case. Note that the profile for the Viscosity run is overlaid by that for De-oxygenation. (A) Additional simulations represent the systematic alteration of the individual components of the pump for the surface ocean: NPP, increased NPP; P-synthate, NPP directed to bacteria resulting in increased BP; Floristics, altered size-partitioning of NPP; Diff. vulnerability, altered microzooplankton trophic transfer efficiency; Faunistics, altered mesozooplankton trophic transfer efficiency. (B) As for (A), but the simulations represent the systematic alteration of the pump components for subsurface waters: Viscosity, decreased seawater viscosity increasing particle sinking rates; Exo-enzymes, more microbial activity; Faunistics, altered mesozooplankton trophic transfer efficiency; Vertical migration, altered vertical POC shunt; De-oxy, decreased microbial remineralization due to de-oxygenation.
The model runs for each of the altered subsurface processes for the high latitude case also resulted in a wide range of POC fluxes [41 to ~59 (control, 55 mg C m−2 d−1)] at 150 m depth (Figure 4B). Increased exo-enzyme activity or a decrease in the transfer efficiency of energy after zooplankton-mediated particle transformations both reduced POC fluxes, whereas reduced viscosity (faster sinking particles), de-oxygenation (less microbial activity), or a larger DVM shunt led to higher POC fluxes at 150 m. These trends were also evident at 300 m depth, although with less spread across the range of model runs, but were almost undetectable by 500 m depth, due to the pivotal role in the model of zooplankton-mediated particle transformations removing 60% of the downward flux for every 100 m that the particles sink (Buesseler and Boyd, 2009).
At the low latitude site, the deeper Ez of 130 m (Table 2) led to a different vertical POC flux profile than in Figure 4A, with a flux of ~61 mg C m−2 d−1 for the control run as particle settled out of the zone of de novo particle production (Figure 5A). The trends for each of the model runs (for systematic alteration of upper ocean processes that each alters POC flux) were as for the high latitude case in Figure 4A. The range of POC fluxes at the base of the Ez (across the different model simulations) was 44 (altered size-partitioning of NPP) to 61 (control) mg C m−2 d−1. As observed for the high latitude case, the spread of the POC fluxes across the various model runs decreased with depth as subsurface processes (all from the low latitude standard run, Table 2) further attenuated the POC flux to 500 m depth in the model simulations.
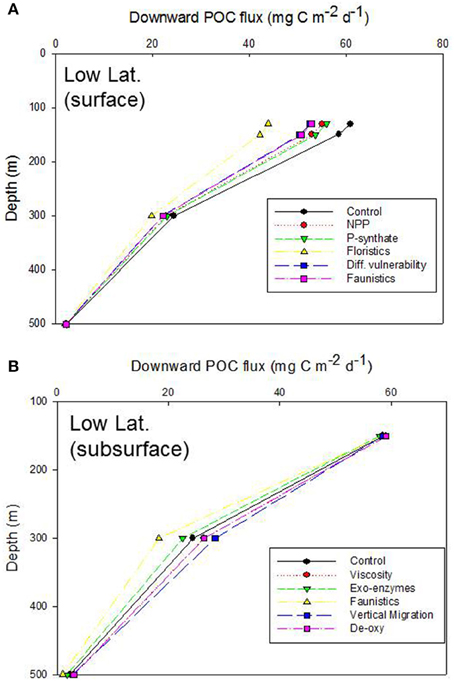
Figure 5. Vertical profile of projected POC flux for the control run, low latitude case. The additional simulations for (A,B) are as described in Figures 4A,B. As for Figure 4B, the “Viscosity” profile is overlaid by “De-oxygenation.” In the case of the NPP run, NPP is decreased for low latitudes (Bopp et al., 2013; Marañón et al., 2014). Note, the convergence of fluxes at 150 m depth is due to relatively little influence of altered subsurface processes over 20 m depth (i.e., 130 m deep Ez, Table 2).
The trends in the downward POC flux from 150 to 300 m for the low latitude case differed slightly—due to the region-specific model parameterizations (Table 2)—than those for the high latitude simulation (Figure 5B c.f. Figure 4B). Specifically, the spread of POC export fluxes, across the range of simulations in which individual subsurface processes were modified, was greatest at 300 m (in contrast to the high latitude site where the amplitude of POC fluxes, across all simulations, was maximal at 150 m depth) due to several factors. First, the 150 m discrete depth selected for the model simulation—only 20 m deeper than the depth of the Ez at the low latitude site. Second, the DVM shunt and the first zooplankton-mediated particle transformation took place at a greater depth than in the high latitude simulation (Table 2).
In the low latitude simulations, the alteration of each subsurface process that influences POC export flux resulted in a different suite of trends, relative to the control, than was evident for the high latitude simulation (Figure 5B c.f. Figure 4B). Although the alteration of energy transfer during zooplankton-mediated particle transformations led to the largest departure (faunistics, lowest POC flux) from the control run at 300 m depth at both the low and high latitude sites, the influence of other processes, such as DVM differed. The altered DVM run resulted in a flux that was higher than the control (at 300 m depth) at the low latitude site (Figure 5B) whereas the DVM simulation in Figure 4B was very similar to the control POC flux. As for the high latitude simulation, the spread of POC fluxes across these various subsurface simulations had declined by 500 m depth, again due to the dominant role of zooplankton-mediated particle transformations in attenuating the particle flux.
Cumulative Effects of Concurrent Alteration of Factors Controlling POC Flux
Many of the trends in Figures 4, 5, such as the effect of increasing or decreasing NPP or decreasing the efficiency of energy transfer during zooplankton-mediated particle transformations in subsurface waters, were as anticipated. The outcome of next suite of model simulations was less readily predicted as they explored the cumulative effect on downward POC flux when multiple individual factors, representing both climate-change mediated surface and subsurface processes, are altered concurrently. The selection of which individual processes to combine in these model runs was based on published reports of the environmental forcing (see Tables 3, 6) responsible for the observed changes in each individual process that alters the performance of the biological pump. This collation resulted in four categories—the individual effect of warming; the sole impact of Ocean Acidification (OA); the combined effect of multiple factors (including irradiance, nutrients, temperature evident from climate change models such as Bopp et al., 2013—termed here as “climate change”); and the cumulative effects of all the above factors (termed “All”). In addition, in several cases where the sign of the change in POC flux, due to alteration of an individual process such as alteration of energy transfer during grazing associated with faunistic shifts, is poorly constrained I also added runs where the sign of this process varied (see Table 5). These sensitivity analysis runs were termed A (i.e., less particle attenuation than the control or B and labeled on Figures 6, 7).
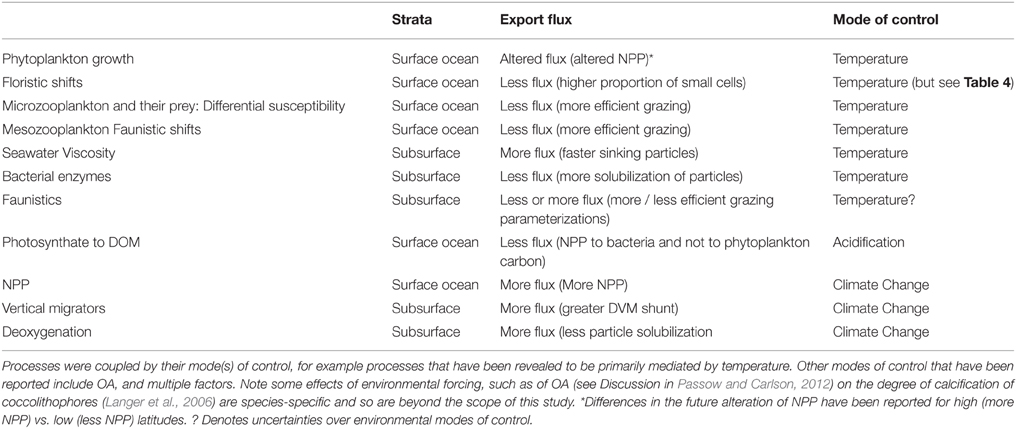
Table 6. Summary of the coupling of individual processes used in model runs presented in Figures 6, 7.
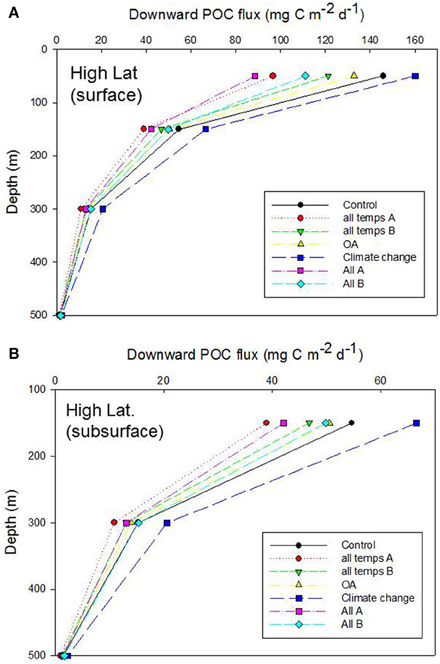
Figure 6. Vertical profile of projected POC flux for the control run, high latitude case, for (A) surface and (B) subsurface processes. Additional simulations represent the cumulative effect of alteration of individual properties that influence the functioning of the biological pump: “all temps” denotes all the temperature-mediated individual processes described in Table 6 (“A” and “B” are runs in which the mesozooplankton trophic transfer efficiency for surface waters is decreased and increased, respectively, relative to the control); OA denoted all OA-mediated individual processes; “Climate change” is the alteration of more complex processes (NPP, DVM, and deoxygenation) which are controlled by multiple factors; “All” is the cumulative effect of altering all of the temperature-, OA- and climate-change- mediated individual factors (“A” and “B” are as described earlier).
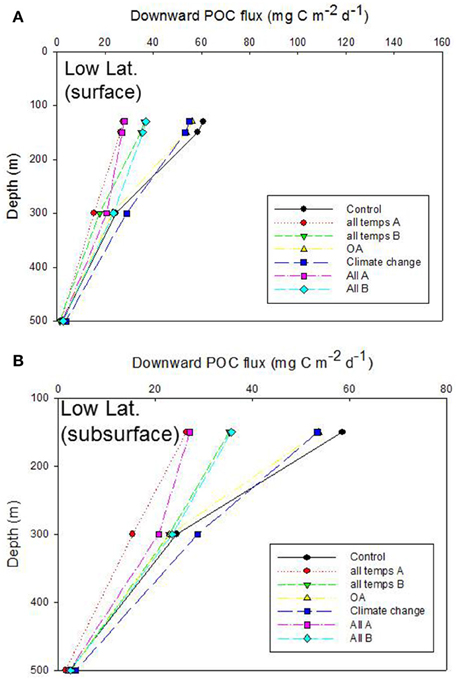
Figure 7. Vertical profile of projected POC flux for the control run, low latitude case. The additional simulations in (A,B) are as described in Figures 6A,B.
The OA-mediated changes to export flux was the simplest of these simulations [with only altered photosynthate reported as a direct OA effect (Table 6, but see Piontek et al., 2015 in Table 3B), whereas for temperature seven individual factors (four associated with surface processes, and three with subsurface processes) were altered concurrently, Table 6]. The outcome of the cumulative effect of altering these processes, in different permutations, was an almost twofold range of POC fluxes exiting the base of the 50 m Ez at the high latitude site (Figure 6A). Most of these simulations resulted in lower POC fluxes, relative to the control, at 50 m depth, with the “climate change” run being the exception. In the simplest case—that of OA, there was little departure from the control, but increasing deviations (and lower POC fluxes) were evident for the temperature-mediated treatment and the largest reduction in the POC flux was for the “All A” treatment. Despite the inclusion of several subsurface processes in simulations such as “temperature,” or “All,” the trends in downward POC flux did not alter significantly with depth, but the amplitude of the POC fluxes, across the range of runs, did decline with depth—as was evident from Figures 4, 5. However, at 150 m depth a substantial separation (1.5 fold) of the simulated POC fluxes, resulting from each of the treatments was evident, and the “climate change” and “all temps A” runs exhibited clear separation from the control at 300 m depth (Figure 6B).
Inter-comparison of the cumulative effects of different environmental controls on the downward POC flux in the low latitude case also revealed a wide range of export fluxes (> 2 fold) at the depth of the Ez (130 m) (Figure 7A). As for the high latitude case, the largest departures from the control run were driven by some of the more complex treatments (“all temps A” and “All A”) in which six or more individual processes, straddling surface, and subsurface strata, were altered concurrently. The separation of the treatments, in terms of the magnitude of POC flux, at 150 m depth was similar to that at the base of the Ez (130 m), which was not surprising given that a 20 m vertical horizon separated these discrete depths in the simulations. However, between 150 and 300 m depth there was some “crossover” of the vertical profiles of POC flux—for “All A” and “all temps B” treatments, that was not evident at the high latitude case (Figure 7B c.f. Figure 6B). These “cross-overs” of the treatments were indicative of depth-dependent changes in the relative roles of the individual properties considered within each treatment (Figure 7B).
The relative roles of the processes setting export flux in the surface vs. the subsurface strata were explored by expressing the data from the control and the composite runs presented in Figures 6, 7 as the Ez ratio and T100 (from Buesseler and Boyd, 2009). The Ez ratio reveals the degree to which upper ocean particle transformations, which set the POC flux out of the Ez, decrease the input of new particles fuelled by NPP and BP. Deeper in the water column, T100 is a measure of the attenuation of the resulting export flux of particles as they traverse the 100 m horizon below the Ez (Buesseler and Boyd, 2009). In the high latitude case, the control run points to the surface ocean as having the greatest influence on the attenuation of the downward POC flux (Ez ratio of 0.18) whereas the T100 for the control was 0.37 (Figure 8A). The range of environmentally-mediated alteration of multiple properties resulted in Ez ratios ranging from 0.11 to 0.18, and corresponding T100 ratios of 0.37 to 0.48. The “All A” run (pink symbol) was a conspicuous end member with Ez and T100 ratios of 0.11 and 0.48, respectively.
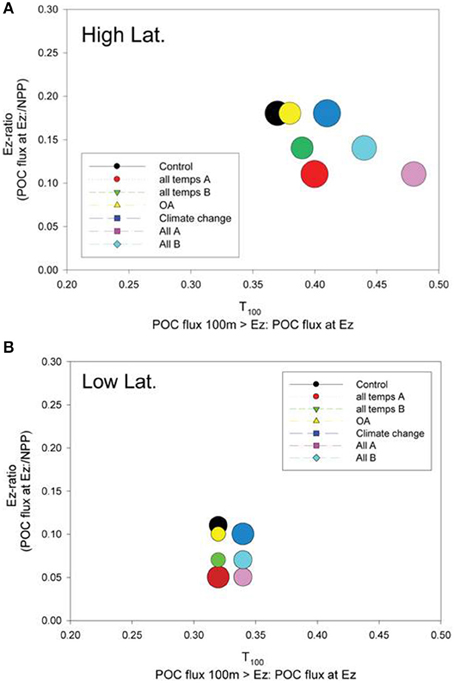
Figure 8. A bubble plot of the Ez ratio vs. T100 (both defined in the plot labels) for the (A) high latitude and (B) low latitude cases. The model simulation represented by each bubble is color-coded as for Figures 6, 7. The diameter of the bubble is scaled to column-integrated NPP used in the model simulations.
Examination of the trends in the Ez and T100 ratios from the “All A” and “all temps A” runs (Figure 8A), which exhibited the largest decreases in downward export flux (Figures 6A, 7A), reveals that they have a larger effect on Ez than on T100, with the latter ratios exceeding those for the control run. In contrast, the Ez ratios for these simulations were > 1.5 fold less than that for the controls at both the high and low latitude sites (Figure 8). Hence the effect of warming alone, and of all factors together being altered, has the largest effect on export out of the surface ocean, but less effect on downward POC flux in subsurface waters.
The Ez and T100 ratios for the control in the low latitude simulation were both lower than in the high latitude run, reflecting differences in the surface and subsurface characteristics at each site (Table 2), as previously reported and discussed by Buesseler and Boyd (2009). The Ez ratio was 0.11 and T100 was 0.32 for the control (Figure 8B), and these ratio's ranged from 0.05 to ~0.1 for Ez and from 0.32 to 0.34 for T100. As for high latitudes, the “All A” run (pink symbol) was an end member with Ez and T100 ratios of 0.05 and 0.34, respectively.
Discussion
The Cumulative Effects of Different Modes of Control on Export Fluxes
Stepwise investigation of the influence of altering each climate-change sensitive process reported to influence the biological pump (Figures 4, 5) helps to interpret the cumulative effect of joint alteration of the pump in a future ocean by multiple factors (Figures 6, 7). In surface waters for both the high and low latitude cases, climate-change mediated alteration of each individual factor mainly results in decreased POC downward flux out of the surface ocean (Figures 4, 5). At both sites, shifts in phytoplankton community structure, and their ramifications for the altered flows of energy through the pelagic foodweb (Figures 1, 3), result in the largest decrease in POC flux. These shifts in the model are based on widespread reports of environmentally-mediated shifts toward smaller cells that are driven regionally by temperature in low latitudes (Morán et al., 2010) or salinity in high latitudes (Li et al., 2009).
Changes to the flows of energy through the pelagic foodweb (Figure 3) due to altered predator-prey interactions, or more NPP going to the dissolved phase, also decrease export flux (Figures 4, 5) but may be offset by increased phytoplankton growth due to warming (under nutrient-replete conditions, Boyd et al., 2013) and/or increased high latitude NPP driven by “climate-change” (Bopp et al., 2013). When these individual factors are considered together they result in a substantial decrease in downward POC flux from the base of the Ez (Figure 6A). In the model runs, where the cumulative effects of individual properties was investigated, no attempt was made to explore whether there are any interactive effects between these properties, and if any such interplay would result in synergistic amplification or antagonistic diminution of the POC export flux (Folt et al., 1999).
In the subsurface waters below the Ez, alteration of each of two individual processes decreased export flux, relative to the control, while modification of three other processes increased this flux, resulting in changes to downward POC flux that were more akin to a “zero sum” outcome. For example, the effects of decreased seawater viscosity and increased microbial solubilization of particles, as parameterized in the model, cancel one another out. The parameterization of altered mesozooplankton assemblages in subsurface waters had the largest effect on POC fluxes, but little is known, apart from exploratory modeling studies (Jackson and Burd, 2002) about how the subsurface community will be altered by climate change. However, temperature does influence zooplankton rates such as respiration (Ikeda et al., 2001) and hence likely grazing rates also. In the case of the DVM of mesozooplankton, such migration it is likely to be a complex effect driven by temperature, irradiance, and phytoplankton stocks (Berge et al., 2014). There is also the likelihood of feedbacks between the resulting changes to such biogeochemically-influential processes as DVM (alteration of dissolved oxygen inventories, Bianchi et al., 2013) and more intense microbially-mediated remineralization (more subsurface nutrient recycling, Bendtsen et al., 2015) that will have further consequences for export flux, but are beyond the parameterization limits of this 1-D model.
The combined effect of concurrent alteration of climate-change sensitive individual processes that influence the functioning of the biological pump is evident to depths of 300 m, but difficult to discern below 300 m (Figures 6B, 7B). The marked decrease in simulated POC flux below 300 m depth in the control run (to rates less than reported from Thorium disequilibria or state-of-the-art neutrally buoyant sediment traps, Buesseler et al., 2007) is probably due to the constant length-scale (100 m) imposed in the model parameterization for biologically-mediated particle transformations such as zooplankton grazing on sinking particles. The concept of such a length-scale for particle transformations was introduced by Buesseler and Boyd (2009) to accommodate a wide range of regional particle transformation processes and to represent them simply within a 1-D model. However, due to the paucity of studies of mesozooplankton grazing on sinking particles and its depth dependency (Wilson et al., 2008) it is fatuous to further alter this parameterization in the model.
A confounding factor in assessing the cumulative effects of climate change on the individual processes, that set the functioning of the biological pump, is that across the global ocean there will likely be regionally-specific effects, such as different environmental drivers causing similar trends. For example, the freshening of the Arctic Ocean is reported to be leading to a floristic shift toward small phytoplankton (Li et al., 2009), whereas warming has a similar effect on restructuring phytoplankton community structure in lower latitudes (Morán et al., 2010). Table 4 reveals that other factors that cannot be considered in this 1-D model, such as nutrient supply or multiple environmental controls, may be equally important in driving such floristic shifts and that some changes, such as more iron to higher latitudes (Boyd et al., 2015a), could result in higher export flux out of the surface ocean. Hence, a range of different outcomes may arise from the regional climate-change mediated alteration of processes that shape the biological pump, and in some cases different environmental forcing may trigger similar responses in such influential processes.
The Role of Altered Surface vs. Subsurface Processes
The Ez ratio and T100 ratios permit robust inter-comparisons of sites with different Ez depths, and also reveal which processes—surface or subsurface—these regions are more sensitive to under both present day ambient and future perturbed conditions. The Ez and T100 ratios also provide insights into how sensitive the surface vs. subsurface processes are to environmental forcing—and hence where future research efforts to better quantify the effect of a changing climate on the biological pump should be directed.
A comparison of these metrics—in Figure 8 indicates that the attenuation of the NPP signal in the surface mixed layer (for the control and climate-change model runs) is greater than the consequent decline in the POC export flux within the subsurface ocean at both the selected high latitude and low latitude sites. This trend, based on observations, has also been reported by Buesseler and Boyd (2009) for lower productivity regions (relative to high productivity water characterized by blooms). Buesseler and Boyd proposed that the lower attenuation in POC flux in subsurface waters was likely due to many particle transformations in the surface ocean resulting in sinking particles that were compact and less prone to further re-processing by the subsurface biota.
The climate-change model runs, which spanned simple (OA) to complex (concurrent alteration of nine processes) resulted in a ~two- and three-fold range of Ez ratios in the surface ocean for the high and low latitude cases, respectively. In contrast, the range of T100 ratios across the model simulations was ~30% (0.37–0.48) for the high latitude runs, and less (0.32–0.34) for the low latitude simulations. Hence, based on these model runs (but with the caveat of our present day undeveloped understanding of many of these processes, Riebesell et al., 2009; Passow and Carlson, 2012) climate change will have a greater influence on surface ocean controls on the biological pump. One reason why climate-change mediated alteration of subsurface ocean components may have less influence on the biological pump is because the effects of some individual factors may cancel each other out (Figure 4B)—for example decreased seawater viscosity results in faster sinking particles (enhancing flux) but also in faster rates of particle remineralization by microbes (decreasing flux). Moreover, the surface ocean is also characterized by a wider range of climate-change sensitive forcing (light, nutrients, CO2, temperature) than the subsurface ocean, which may also partially explain its greater influence on downward POC flux relative to the subsurface ocean.
Extrapolation of Trends for High vs. Low Latitude Sites
The trends in Ez and T100 for the model simulations are similar to those reported for observations by Buesseler and Boyd (2009)—with T100 exceeding Ez at subtropical (ALOHA, off Hawaii) and subpolar (Ocean Station Papa, in the NE Pacific) sites. The HNLC characteristics of the high latitude site (Table 2) are also observed across about 30% of the global ocean (Moore et al., 2004), and the properties assigned to the low latitude site are comparable to the subtropical ocean which contains the largest biome—the Subtropical North Pacific Gyre globally (Karl et al., 2008). However, Figure 9 in Buesseler and Boyd (2009) displays Ez and T100 ratios of up to 0.4 and 1.0, respectively, from observations for the North Atlantic during the spring bloom, and also reveals changes in these ratios with season for different oceanic provinces, such as the Southern Ocean. Hence, the outcomes from the high and low latitude simulations (Figures 4–8) will be broadly representative of some but not all other oceanic provinces, and also the 1-D model cannot accommodate temporal shifts in either POC export flux (Lutz et al., 2002; Henson et al., 2012; Stock et al., 2014a) or in ratios such as Ez or T100.
The different magnitudes of POC export flux across the high and low latitude sites (Figure 4 c.f. Figure 5) and trends in Ez and T100 largely reflect the different environmental characteristics of these sites (Table 2) such as the deeper Ez depth, and hence the point of entry of new particles into the subsurface ocean (see Discussion in Buesseler and Boyd, 2009). The small range of T100 ratios (0.32–0.34) for the low latitude compared to the high latitude (0.37–0.48) runs, probably reflects differences in the model parameterization for the subsurface ocean that are driven by the deeper Ez for low latitudes. The 130 m deep Ez exit for sinking particles also increases the depth at which the simulated DVM shunt takes place, and the particle transformation length-scale does not take effect until deeper in the water column at the low latitude compared to the high latitude site. Hence the trends from the model runs reflect both site-specific differences in model parameterization, and different environmental forcing, such as warming and acidification, which influences a suite of both surface and subsurface processes at these sites with different characteristics of their regional biological pumps.
Climate-change Controls on the Biological Pump
One utility of this relatively simple 1-D modeling approach is that it provides insights into how different climate-change forcing influences a suite of both surface and subsurface processes, such as warming or acidification. By making this connection it is possible to cross-link the sensitivities in the model to altered climate-change parameterizations, such as warming, with the degree of confidence that exists for temperature-sensitive processes. For example, temperature-modulated changes to the viscosity of seawater can be readily estimated (Taucher et al., 2015), whereas the effect of warming on rates of bacterial solubilization of particles (Cunha et al., 2010; Bendtsen et al., 2015) is more problematic particularly in the subsurface ocean where the effects of in situ pressure on microbes is difficult to mimic in the lab or shipboard (Giering et al., 2014; Boyd et al., 2015b). The present 1-D modeling approach provides the means to rank our understanding of each process, relative to its perceived influence on the performance of the biological pump. The model runs revealed that changes to phytoplankton community structure had the most marked effect of all the individual mechanisms on POC flux out of the surface ocean. In contrast, a change in mesozooplankton community structure had the greatest effect on the export flux signal in subsurface waters. The datasets that illustrate the former are much more widespread and well-established, than for the latter which is more speculative and relies on several strands of indirect evidence that: fauna have different feeding strategies in the mesopelagic (Ikeda et al., 2001; Jackson and Burd, 2002; Paffenhöfer, 2006); climate-mediated shifts in mesozooplankton distributions have been observed in the surface ocean (Edwards et al., 2013) (and hence are also likely in the subsurface ocean as conditions change), and zooplankton species display a wide range of grazing rates (Mauchline, 1998).
Improving Estimates of the Performance of an Altered Biological Pump
This 1-D modeling study reveals that the cumulative effect of the individual processes, reported so far to be altered by a changing climate, on the biological pump in the future will be considerable, with marked reductions in POC flux projected at both high and low latitude sites. These reduced POC fluxes are in excess of those reported from 3-D coupled ocean atmosphere models (Bopp et al., 2001, 2013). The 1-D and 3-D approaches bring different levels of analysis to bear—with the cumulative effects of nine different processes being examined in a 1-D water column in the present study, vs. the influence of several inter-related factors (nutrients, irradiance, temperature, NPP) on export within a dynamic global model being jointly investigated in Bopp et al. (2013). In particular, the interplay and feedbacks (on the input of POC into the pump) between altered performance of the biological pump, mesopelagic nutrient regeneration, and ocean circulation can only be addressed in 3-D models. Clearly a nested suite of modeling approaches is currently needed to reduce the gaps in our knowledge, and to refine the integrated knowledge platform required to better explore the climate change ramifications for downward export flux in the coming decades.
Based on our current understanding of the influence of climate change on the biological pump, the 1-D approach in the present study indicates that the surface ocean will have a more pronounced influence on altering the magnitude of POC export flux in a future ocean. However, our knowledge on how a changing environment influences upper ocean processes that influence the pump is better than that for subsurface ocean processes. In particular, little is known about environmental forcing of mesozooplankton in the mesopelagic realm, and the study of zooplankton functional traits (Litchman et al., 2013; Vogt et al., 2013) in conjunction with advanced foodweb modeling (Stock et al., 2014b) offers the best prospect of advancing this field. It is also evident that although up to nine individual properties were considered in the 1-D model here, there are many gaps in our understanding on how complex climate change (i.e., multi-stressors, for example see Yoshimura et al., 2014) will influence the many “moving parts” of the biological pump in both surface and subsurface waters. Hence, a regional approach to this issue may be necessary to simplify this task as much as possible, before we can address global changes to a future biological pump with more certainty.
Funding
This research was supported by the University of Tasmania (IMAS) and the Antarctic Climate and Ecosystems Cooperative Research Centre (ACE CRC).
Conflict of Interest Statement
The author declares that the research was conducted in the absence of any commercial or financial relationships that could be construed as a potential conflict of interest.
References
Almén, A.-K., Vehmaa, A., Brutemark, A., and Engström-Öst, J. (2014). Coping with climate change? Copepods experience drastic variations in their physicochemical environment on a diurnal basis. J. Exp. Mar. Biol. Ecol. 460, 120–128. doi: 10.1016/j.jembe.2014.07.001
Apple, J. K., Strom, S. L., Palenik, B., and Brahamsha, B. (2011). Variability in protist grazing and growth on different marine synechococcus isolates. Appl. Environ. Microbiol. 77, 3074–3084. doi: 10.1128/AEM.02241-10
Arístegui, J., Agustì, S., Middelburg, J. J., and Duarte, C. M. (2005). “Respiration in the mesopelagic and bathypelagic zones of the ocean,” in Respiration in Aquatic Ecosystems, eds P. A. del Giorgio and P. J. le B. Williams (New York, NY: Oxford University Press), 181–205.
Armstrong, R. A., Lee, C., Hedges, J. I., Honjo, S., and Wakeham, S. G. (2001). A new, mechanistic model for organic carbon fluxes in the ocean based on the quantitative association of POC with ballast minerals. Deep Sea Res. II 49, 219–236. doi: 10.1016/S0967-0645(01)00101-1
Bendtsen, J., Hilligsøe, K. M., Hansen, J. L. S., and Richardson, K. (2015). Analysis of remineralisation, lability, temperature sensitivity and structural composition of organic matter from the upper ocean. Prog. Oceanogr. 130, 125–145. doi: 10.1016/j.pocean.2014.10.009
Berge, J., Cottier, F. Varpe, Ø., Renaud, P. E., Falk-Petersen, S., Kwasniewski, S., et al. (2014). Arctic complexity: a case study on diel vertical migration of zooplankton. J. Plankton Res. 36, 1279–1297. doi: 10.1093/plankt/fbu059
Bernard, C., and Rassoulzadegan, F. (1990). Bacteria or microflagellates as a major food source for marine ciliates: possible implications for the microzooplankton. Mar. Ecol. Prog. Ser. 64, 147–155. doi: 10.3354/meps064147
Bianchi, D., Galbraith, E. D., Carozza, D. A., Mislan, K. A. S., and Stock, C. A. (2013). Intensification of open-ocean oxygen depletion by vertically migrating animals. Nat. Geosci. 6, 545–548. doi: 10.1038/ngeo1837
Bopp, L., Monfray, P., Aumont, O., Dufresne, J. L., Le Treut, H., Madec, G., et al. (2001). Potential impact of climate change on marine export production. Glob. Biogeochem. Cycles 15, 81–99. doi: 10.1029/1999GB001256
Bopp, L., Resplandy, L., Orr, J. C., Doney, S. C., Dunne, J. P., Gehlen, M., et al. (2013). Multiple stressors of ocean ecosystems in the 21st century: projections with CMIP5 models. Biogeosciences 10, 6225–6245. doi: 10.5194/bg-10-6225-2013
Boyd, P., and Harrison, P. J. (1999). Phytoplankton dynamics in the NE subarctic Pacific. Deep Sea Res. II Topical Stud. Oceanogr. 46, 2405–2432. doi: 10.1016/S0967-0645(99)00069-7
Boyd, P. W., and Stevens, C. L. (2002). Modelling particle transformations and the downward organic carbon flux in the NE Atlantic Ocean. Prog. Oceanogr. 52, 1–29. doi: 10.1016/S0079-6611(02)00020-4
Boyd, P. W., and Trull, T. W. (2007). Understanding the export of biogenic particles in oceanic waters: is there consensus? Prog. Oceanogr. 72, 276–312. doi: 10.1016/j.pocean.2006.10.007
Boyd, P. W., Gall, M. P., Silver, M. W., Coale, S. L., Bidigare, R. R., and Bishop, J. (2008). Quantifying the surface-subsurface biogeochemical coupling during the VERTIGO ALOHA and K2 studies. Deep Sea Res. II 55, 1578–1593. doi: 10.1016/j.dsr2.2008.04.010
Boyd, P. W., Strzepek, R., Fu, F. X., and Hutchins, D. A. (2010). Environmental control of open-ocean phytoplankton groups: now and in the future. Limnol. Oceanogr. 55, 1353–1376. doi: 10.4319/lo.2010.55.3.1353
Boyd, P. W., Rynearson, T. A., Armstrong, E. A., Fu, F., Hayashi, K., Hu, Z., et al. (2013). Marine phytoplankton temperature versus growth responses from polar to tropical waters - outcome of a scientific community-wide study. PLoS ONE 8:e63091. doi: 10.1371/journal.pone.0063091
Boyd, P. W., Lennartz, S. T., Glover, D. M., and Doney, S. C. (2015a). Biological ramifications of climate-change mediated oceanic multi-stressors. Nat. Clim. Change 5, 71–79. doi: 10.1038/nclimate2441
Boyd, P. W., McDonnell, A., Valdez, J., LeFevre, D., and Gall, M. P. (2015b). RESPIRE: an in situ particle interceptor to conduct particle remineralization and microbial dynamics studies in the oceans' twilight zone. Limnol. Oceanogr. Methods 5, 71–79. doi: 10.1002/lom3.10043
Buesseler, K. O., and Boyd, P. W. (2009). Shedding light on processes that control particle export and flux attenuation in the twilight zone of the open ocean. Limnol. Oceanogr. 54, 1210–1232. doi: 10.4319/lo.2009.54.4.1210
Buesseler, K. O., Lamborg, C. H., Boyd, P. W., Lam, P., Trull, T. W., Bidigare, R. R., et al. (2007). Revisiting carbon flux through the ocean's twilight zone. Science 316, 567–570. doi: 10.1126/science.1137959
Carlson, C. A., Hansell, D. A., Nelson, N. B., Siegel, D. A., Smethie, W. M., Khatiwala, S., et al. (2010). Dissolved organic carbon export and subsequent remineralization in the mesopelagic and bathypelagic realms of the North Atlantic basin. Deep Sea Res. II 57, 1433–1445. doi: 10.1016/j.dsr2.2010.02.013
Cocco, V., Joos, F., Steinacher, M., Frölicher, T. L., Bopp, L., Dunne, J., et al. (2014). Oxygen and indicators of stress for marine life in multi-model global warming projections. Biogeosciences 10, 1849–1868
Cunha, A., Almeida, A., Coelho, F. J. R. C., Gomes, N. C. M., Oliveira, V., and Santos, A. L. (2010). “Bacterial extracellular enzymatic activity in globally changing aquatic ecosystems,” in Current Research, Technology and Education Topics in Applied Microbiology and Microbial Biotechnology, ed A. Mendez-Vilas (Badajoz: Formatex Research Center), 124–135.
Dagg, M. J. (1993). Sinking particles as a possible source of nutrition for the calanoid copepod Neocalanus cristatus in the subarctic Pacific Ocean. Deep Sea Res. 40, 1431–1445. doi: 10.1016/0967-0637(93)90121-I
Dunne, J. P. (2010). Reconciliation of Observed Variation in Sinking Organic Carbon Transfer Efficiency Through the Twilight Zone Via Mineral, Oxygen, and Temperature Controls. Eos Trans. AGU 91, 26.
Edwards, M., Beaugrand, G., Helaouet, P., and Coombs, S. (2013). Marine ecosystem response to the atlantic multidecadal oscillation. PLoS ONE 8:e57212. doi: 10.1371/journal.pone.0057212
Endres, S., Galgani, L., Riebesell, U., Schulz, K.-G., and Engel, A. (2014). Stimulated bacterial growth under elevated pCO2: results from an off-shore mesocosm study. PLoS ONE 9:e99228. doi: 10.1371/journal.pone.0099228
Engel, A. (2002). Direct relationship between CO2 uptake and transparent exopolymer particles production in natural phytoplankton. J. Plankton Res. 24, 49–53. doi: 10.1093/plankt/24.1.49
Engel, A., Piontek, J., Grossart, H. P., Riebesell, U., Schulz, K. G., and und Sperling, M. (2014). Impact of CO2 enrichment on organic matter dynamics during nutrient induced coastal phytoplankton blooms. J. Plankton Res. 36, 641–657. doi: 10.1093/plankt/fbt125
Folt, C. L., Chen, C. Y., Moore, M. V., and Burnaford, J. (1999). Synergism and antagonism among multiple stressors. Limnol. Oceanogr. 44, 864-877.
Giering, S. L. C., Sanders, R., Lampitt, R. S., Anderson, T. R., Tamburini, C., Boutrif, M., et al. (2014). Reconciliation of the carbon budget in the ocean's twilight zone. Nature 507, 480–483. doi: 10.1038/nature13123
Hays, G. C. (1996). Large-scale patterns of diel vertical migration in the North Atlantic. Deep Sea Res. I 43, 1601–1615.
Henson, S. A., Sanders, R., and Madsen, E. (2012). Global patterns in efficiency of particulate organic carbon export and transfer to the deep ocean. Global Biogeochem. Cycles 26, GB1028. doi: 10.1029/2011GB004099
Hinder, S. L., Hays, G., Edwards, M., Emily, C., Roberts, E. C., Walne, A. W., et al. (2012). Changes in marine dinoflagellate and diatom abundance under climate change. Nat. Clim. Change 2, 271–275. doi: 10.1038/nclimate1388
Hofmann, M., and Schellnhuber, H.-J. (2009). Oceanic acidification affects marine carbon pump and triggers extended marine oxygen holes. PNAS 106, 3017–3022. doi: 10.1073/pnas.0813384106
Hoppe, H., Ducklow, H., and Karrasch, B. (1993). Evidence for dependency of bacterial growth on enzymatic hydrolysis of particulate organic matter in the mesopelagic ocean. Mar. Ecol. Prog. Ser. 93, 277–283. doi: 10.3354/meps093277
Ikeda, T., Kanno, Y., Ozaki, K., and Shinada, A. (2001). Metabolic rates of epipelagic marine copepods as a function of body mass and temperature. Mar. Biol. 139, 587–596. doi: 10.1007/s002270100608
Isla, J. A., Lengfellner, K., and Sommer, U. (2008). Physiological response of the copepod Pseudocalanus sp. in the Baltic Sea at different thermal scenarios. Glob. Change Biol. 14, 895–906. doi: 10.1111/j.1365-2486.2008.01531.x
Ito, T., and Follows, M. J. (2005). Preformed phosphate, Soft tissue pump, and atmospheric CO2. J. Mar. Res. 63, 813–139. doi: 10.1357/0022240054663231
Jackson, G. A. (1990). A model of the formation of marine algal flocs by physical coagulation processes. Deep Sea Res. A. 37, 1197–1211. doi: 10.1016/0198-0149(90)90038-W
Jackson, G. A., and Burd, A. B. (2002). A model for the distribution of particle flux in the mid-water column controlled by subsurface biotic interactions. Deep Sea Res. II 49, 193–217. doi: 10.1016/S0967-0645(01)00100-X
Karl, D. K., Bidigare, R. R., Church, M. J., Dore, J. E., Letelier, R. M., Mahaffey, C., et al. (2008). “The nitrogen cycle in the North Pacific trades biome: an evolving paradigm,” in Nitrogen in the Marine Environment, eds D. G. Capone, D. A. Bronk, M. R. Mulholland, and E. J. Carpenter (San Diego, CA: Academic Press), 705–769.
Kwon, E. Y., Primeau, F., and Sarmiento, J. L. (2009). The impact of remineralization depth on the air-sea carbon balance. Nat. Geosci. 2, 630–635. doi: 10.1038/ngeo612
Lampitt, R. S., and Antia, A. N. (1997). Particle flux in deep seas: regional characteristics and temporal variability. Deep Sea Res. I 44, 1377–1403.
Lampitt, R. S., Wisher, K. F., Turley, C. M., and Angel, M. V. (1993). Marine snow studies in the Northeast Atlantic: distribution, composition and role as a food source for migrating plankton. Mar. Biol. 116, 689–702. doi: 10.1007/BF00355486
Langer, G., Geisen, M., Baumann, K. H., Klas, J., Riebesell, U., Thoms, S., et al. (2006). Species-specific responses of calcifying algae to changing seawater carbonate chemistry. Geochem. Geophys. Geosyst. 7, Q09006. doi: 10.1029/2005GC001227
Li, W. K. W., McLaughlin, F. A., Lovejoy, C., and Carmack, E. C. (2009). Smallest algae thrive as the arctic ocean freshens. Science 326, 539. doi: 10.1126/science.1179798
Litchman, E., and Klausmeier, C. A. (2008). Trait-based community ecology of phytoplankton. Annu. Rev. Ecol. Evol. Syst. 39, 615–639. doi: 10.1146/annurev.ecolsys.39.110707.173549
Litchman, E., Ohman, M. D., and Kiorboe, T. (2013). Trait-based approaches to zooplankton communities. J. Plankton Res. 35, 473–484. doi: 10.1093/plankt/fbt019
Lomas, M. W., Steinberg, D. K., Dickey, T., Carlson, C. A., Nelson, N. B., Condon, R. H., et al. (2010). Increased ocean carbon export in the Sargasso Sea linked to climate variability is countered by its enhanced mesopelagic attenuation. Biogeosciences 7, 57-70. doi: 10.5194/bg-7-57-2010
Lutz, M., Dunbar, R., and Caldeira, K. (2002). Regional variability in the vertical flux of particulate organic carbon in the ocean interior. Glob. Biogeochem. Cycles 16, 1037 doi: 10.1029/2000GB001383
Marañón, E., Cermeño, P., Huete-Ortega, M., López-Sandoval, D. C., Mouriño-Carballido, B., and Rodríguez-Ramos, T. (2014). Resource supply overrides temperature as a controlling factor of marine phytoplankton growth. PLoS ONE 9:e99312. doi: 10.1371/journal.pone.0099312
Mauchline, J. (ed.). (1998). “The biology of calanoid copepods,” in Advances in Marine Biology, Vol. 33, (San Diego, CA: Elsevier Academic Press), 710.
Michaels, A. F., and Silver, M. W. (1988). Primary production, sinking fluxes and the microbial food web. Deep Sea Res. A 35, 473–490. doi: 10.1016/0198-0149(88)90126-4
Moore, J. K., Doney, S. C., and Lindsay, K. (2004). Upper ocean ecosystem dynamics and iron cycling in a global three-dimensional model. Glob. Biogeochem. Cycles 18, GB4028. doi: 10.1029/2004GB002220
Morán, X. A. G., López-Urrutia, Á., Calvo Díaz, A., and Li, W. K. (2010). Increasing importance of small phytoplankton in a warmer ocean. Glob. Change Biol. 16, 1137–1144. doi: 10.1111/j.1365-2486.2009.01960.x
Paffenhöfer, G.-A. (2006). Oxygen consumption in relation to motion of marine planktonic copepods. Mar. Ecol. Prog. Ser. 317, 187–192. doi: 10.3354/meps317187
Passow, U., and Carlson, C. (2012). The biological pump in a high CO2 world. Mar. Ecol. Prog. Ser. 470, 249–271. doi: 10.3354/meps09985
Piontek, J., Sperling, M., Nothig, E.-M., and Engel, A. (2015). Multiple environmental changes induce interactive effects on bacterial degradation activity in the Arctic Ocean. Limnol. Oceanogr. 60, 1392–1410. doi: 10.1002/lno.10112
Pörtner, H.-O., Karl, D., Boyd, P. W., Cheung, W., Lluch-Cota, S. E., Nojiri, Y., et al. (2014). “Ocean systems,” in Climate Change 2014: Impacts, Adaptation, and Vulnerability. Part A: Global and Sectoral Aspects. Contribution of Working Group II to the Fifth Assessment Report of the Intergovernmental Panel on Climate Change, eds C. B. Field, V. R. Barros, D. J. Dokken, K. J. Mach, M. D. Mastrandrea, T. E. Bilir et al. (Cambridge, UK; New York, NY: Cambridge University Press), 411–484.
Richardson, T. L., and Jackson, G. A. (2007). Small phytoplankton and carbon export from the surface ocean. Science 315, 838–840. doi: 10.1126/science.1133471
Riebesell, U., Schulz, K. G., Bellerby, R. G. J., Botros, M., Fritsche, P., Meyerhöfer, M., et al. (2007). Enhanced biological carbon consumption in a high CO2 ocean. Nature 450, 545–549. doi: 10.1038/nature06267
Riebesell, U., Körtzinger, A., and Oschlies, A. (2009). Sensitivities of marine carbon fluxes to ocean change. PNAS 106, 20602–20609, doi: 10.1073/pnas.0813291106
Rose, J. M., and Caron, D. A. (2007). Does low temperature constrain the growth rates of heterotrophic protists? Evidence and implications for algal blooms in cold waters. Limnol. Oceanogr. 52, 886-895. doi: 10.4319/lo.2007.52.2.0886
Roth, R., Ritz, S. P., and Joos, F. (2014). Burial-nutrient feedbacks amplify the sensitivity of atmospheric carbon dioxide to changes in organic matter remineralisation. Earth Syst. Dyn. 5, 321–343. doi: 10.5194/esd-5-321-2014
Seebah, S., Fairfield, C., Ullrich, M. S., and Passow, U. (2014). Aggregation and sedimentation of thalassiosira weissflogii (diatom) in a warmer and more acidified future ocean. PLoS ONE 9:e112379. doi: 10.1371/journal.pone.0112379
Sigman, D. M., and Boyle, E. A. (2000). Glacial/interglacial variations in atmospheric carbon dioxide. Nature 407, 6806, 859–869. doi: 10.1038/35038000
Steinberg, D. K., Van Mooy, B. A. S., Buesseler, K. O., Boyd, P. W., Kobari, T., and Karl, D. M. (2008). Bacterial vs. zooplankton control of sinking particle flux in the ocean's twilight zone. Limnol. Oceanogr. 53, 1327–1338. doi: 10.4319/lo.2008.53.4.1327
Stock, C. A., Dunne, J. P., and John, J. G. (2014a). Global-scale carbon and energy flows through the marine planktonic food web: an analysis with a coupled physical-biological model. Prog. Oceangr. 120, 1–28. doi: 10.1016/j.pocean.2013.07.001
Stock, C. A., Dunne, J. P., and John, J. G. (2014b). Drivers of trophic amplification of ocean productivity trends in a changing climate. Biogeosciences 11, 7125–7135. doi: 10.5194/bg-11-7125-2014
Straile, D. (1997). Gross growth efficiencies of protozoan and metazoan zooplankton and their dependence on food concentration, predator-prey weight ratio, and taxonomic group. Limnol. Oceanogr. 42, 1375–1385. doi: 10.4319/lo.1997.42.6.1375
Taucher, J., and Oschlies, A. (2011). Can we predict the direction of marine primary production change under global warming? Geophys. Res. Lett. 38, L02603. doi: 10.1029/2010GL045934
Taucher, J., Bach, L. T., Riebesell, U., and Oschlies, A. (2014). The viscosity effect on marine particle flux: a climate relevant feedback mechanism. Glob. Biogeochem. Cycles 28, 415–422. doi: 10.1002/2013GB004728
Taucher, J., Jones, J., James, A., Brzezinski, M. A., Carlson, C. A., Riebesell, U., et al. (2015). Combined effects of CO2 and temperature on carbon uptake and partitioning by the marine diatoms Thalassiosira weissflogii and Dactyliosolen fragilissimus. Limnol. Oceanogr. 60, 901–919. doi: 10.1002/lno.10063
Vogt, R. J., Peres-Neto, P. R., and Beisner, B. E. (2013). Using functional traits to investigate the determinants of crustacean zooplankton community structure. Oikos 122, 1700–1709. doi: 10.1111/j.1600-0706.2013.00039.x
Volk, T., and Hoffert, M. (1985). “Ocean carbon pumps: analysis of relative strengths and efficiencies in ocean-driven atmospheric CO2 changes,” in The Carbon Cycle and Atmospheric OC2: Natural Variations Archean to Present, eds E. Sundquist and W. S. Broecker (Washington, DC: AGU), 99–110.
Wilson, S. E., Steinberg, D. K., and Buesseler, K. O. (2008). Changes in fecal pellet characteristics with depth as indicators of zooplankton repackaging of particles in the mesopelagic zone of the subtropical and subarctic Pacific Ocean. Deep Sea Res. II. 55, 1636–1647. doi: 10.1016/j.dsr2.2008.04.019
Winter, A., Henderiks, J., Beaufort, L., Rickaby, R. E. M., and Brown, C. W. (2014). Poleward expansion of the coccolithophore Emiliania huxleyi. J. Plankton Res. 36, 316–325. doi: 10.1093/plankt/fbt110
Wohlers-Zöllner, J., Breithaupt, P., Walther, K., Jürgens, K., and Riebesell, U. (2011). Temperature and nutrient stoichiometry interactively modulate organic matter cycling in a pelagic algal-bacterial community. Limnol. Oceanogr. 56, 599–610. doi: 10.4319/lo.2011.56.2.0599
Yoshimura, T., Sugie, K., Endo, H., Suzuki, K., Nishioka, J., and Ono, T. (2014). Organic matter production response to CO2 increase in open subarctic plankton communities: comparison of six microcosm experiments under iron-limited and-enriched bloom conditions. Deep Sea Res. I 94, 1–14. doi: 10.1016/j.dsr.2014.08.004
Keywords: POC export, biological pump, climate change, ocean microbes, zooplankton
Citation: Boyd PW (2015) Toward quantifying the response of the oceans' biological pump to climate change. Front. Mar. Sci. 2:77. doi: 10.3389/fmars.2015.00077
Received: 01 April 2015; Accepted: 18 September 2015;
Published: 13 October 2015.
Edited by:
Elvira S. Poloczanska, Commonwealth Scientific and Industrial Research Organization, AustraliaReviewed by:
Diego M. Macias, European Commission, Joint Research Center, ItalyAleksandra M. Lewandowska, Carl von Ossietzky University Oldenburg, Germany
Copyright © 2015 Boyd. This is an open-access article distributed under the terms of the Creative Commons Attribution License (CC BY). The use, distribution or reproduction in other forums is permitted, provided the original author(s) or licensor are credited and that the original publication in this journal is cited, in accordance with accepted academic practice. No use, distribution or reproduction is permitted which does not comply with these terms.
*Correspondence: Philip W. Boyd, Institute for Marine and Antarctic Studies, University of Tasmania, Castray Esplanade, Salamanca, Hobart, TAS 7005, Australia,cGhpbGlwLmJveWRAdXRhcy5lZHUuYXU=
 Philip W. Boyd